
Abstract
This systematic review documents current best practices, standards, and approaches for transportation safety data analytics. While standards exist for defining measures, there are few available standards or guides for processing driving and driver data. Standards are crucial for ensuring repeatability and appropriate cost-benefit decisions. The review identified 36 relevant studies describing behavioral and physiological measures. Most studies do not comprehensively report data processing steps. Of the studies that did report data processing steps, few analyzed the impact of decisions made during data processing on algorithm performance. Most studies were conducted in a controlled simulator environment and may not generalize to naturalistic settings. The findings show that driver behavior and physiological data show efficacy for detecting fatigue, distraction, stress, and driver errors. The results of these studies may necessitate additional data processing standards and future work should focus on measuring the effects of data decisions on model performance.
Introduction
The recent and rapid expansion of advanced vehicle automation and driver state monitoring technology has created a corresponding need for systems that collect and integrate data from vehicles, drivers, and infrastructure and process the data with predictive models. While there has been increasing attention placed on standardizing the process of predictive modeling, available standards for data processing are limited. This lack of standardization is problematic because decisions made in data preprocessing (Table 1) can have a substantial effect on algorithm performance and generalizability.
Examples of data related decisions made during predictive modeling.
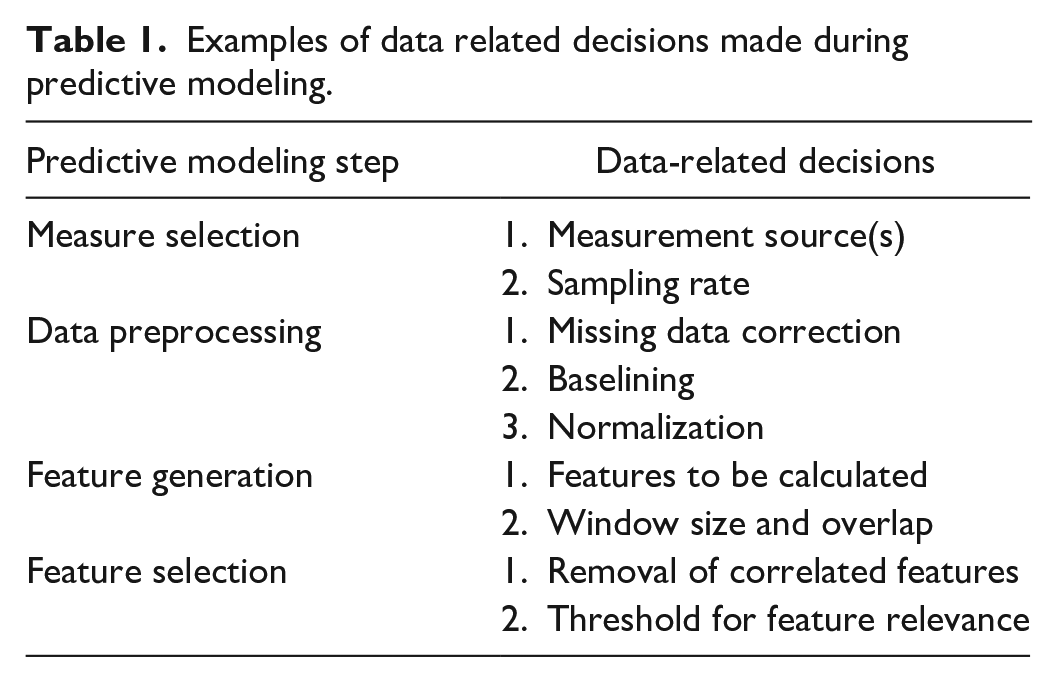
Sufficient or ideal driver, vehicle, and infrastructure-based data characteristics may be different based on one or more realtime factors (e.g., type of scenario, environment, roadway), which may require adaptive data acquisition in vehicles. Modifying data collection sampling rates and data characteristics in real-time can preserve memory, data bandwidth, and device battery life (Krause et al., 2005). Infrastructure and environmental data sources may improve predictive performance; however, the data sources are not integrated into driver or vehicle systems. Having a well-defined and consistent approach is a vital requirement for making this integration smoother.
The goal of this review article is to provide an overview of the current best practices, standards, and approaches employed when using driving data in transportation safety research, describe the characteristics of available data sources and variables that can be used in model construction of driver behaviors, and generate recommendations for data processing. The collection of recommendations provided by this review can be used as a guide for researchers developing human-subjects studies and designers of advanced vehicle technologies and driver state monitoring systems to improve consistency and generalizability ultimately maximizing the value of data collected.
Previous Reviews and Standards
There have been several reviews of driver state detection algorithms and measures (Dong et al., 2011; Lenné & Jacobs, 2016; Lohani et al., 2019). This review is distinct from those previous efforts in its focus on data collection and processing standards and broad focus on driver, vehicle, and infrastructure measures. Beyond the reviews, there are multiple relevant standards for transportation measure collection and calculation (e.g., Driver Metrics Performance Behaviors and States Committee, 2015; Vehicle Dynamics Standards Committee, 1974). This review leverages these standards but interprets them in the context of the data preprocessing necessary for predictive modeling. In this way, the review will guide practitioners and researchers to the relevant standards and their applications. Specifically, this review will assist practitioners and researchers in (1) Identifying the data that is available for predictive modeling and the characteristics of that data that add value; (2) Converting the data from measures to important features or variables for modeling; (3) Understanding how real-world data compare to ideal data characteristics.
Methods
The Preferred Reporting Items for Systematic Reviews and Meta-Analyses method (Page et al., 2021) guided the review process. The articles included in this review were identified through database searches, including Science Direct, Transportation Research International Documentation, and Google Scholar. In addition to the database searches, articles were identified through snowball approach. The search was limited to peer-reviewed publications that were written in English and included studies that used driving data to predict driving states. The search generated a total of 724 results. Thirty-seven articles were added via reviews of reference lists. After consolidating the duplicate results and screening the titles and abstracts, 137 potentially relevant full-text articles were retrieved. These publications were further reviewed for eligibility resulted in a total of 36 included publications. The primary reasons for exclusion were a lack of inclusion of a machine learning algorithm and insufficient detail on data preprocessing. Each included article was evaluated with an extraction template on Covidence to extract the types of measures included, driver state predicted, data preprocessing steps, feature extraction and selection methods, and machine learning algorithms used.
Results
The included articles included spanned a variety of data sources including driver behavior, vehicle kinematics, glance and body metrics, physiological measures, neurological measures, and environmental measures. The details extracted for each data source were categorized into four sections; (1) Data collection specifications: sampling rate, range of values, type of device, and device reliability and quality; (2) Data preprocessing: methodology employed for baselining, filtering, and dealing with missing data; (3) Derived features specifications: Type (e.g., time domain, frequency domain, non-linear) and duration (e.g., window size, overlap) of feature extracted from the measure; (4) Driver state predicted: The type of driver state that the feature was used to predict (e.g., fatigue, drowsiness, workload, stress, distraction, emotion).
Driver behavior and vehicle measures
Driver motor behavior measures identified in the review included direct input (e.g., steering wheel angle), derived measures (e.g., steering entropy), and indirect measures (e.g., lane position). Vehicle measures identified in the review included speed, acceleration, proximity to other vehicles/infrastructure. These measures have been standardized (Jeong & Green, 2013).
Driver behavior and vehicle measurement
Driver behavior and vehicle measures in the reviewed studies included primarily data from driving simulators with data collected from the simulator software. Across the reviewed studies sampling rates between 10 and 240 Hz were used but 60 Hz was the most common (Alambeigi et al., 2021; McDonald et al., 2020; Sommer & Golz, 2010; Son & Park, 2016). In naturalistic studies, driver and vehicle measures were collected from the vehicle’s OnBoard Diagnostic (OBD-II) port, cameras, accelerometers, GPS location devices, and radar systems. These measures were then consolidated and time synced through a data acquisition system (Blatt et al., 2015). The reviewed studies suggest that speed and acceleration can have high value at sampling rates as low as 1 Hz (McDonald et al., 2013), and that GPS position can have high value with samples every 30 s (Babulal GM et al., 2016). The most used measures in the reviewed studies were steering input, lateral and longitudinal acceleration, lane position, and speed. In addition to these measures, studies also investigated time and distance headway, time-to-collision, and braking and accelerator pedal input. Among the studies that investigated variable and measure importance, steering, lane position, and speed were the most important measures (McDonald et al., 2020).
Driver and vehicle data preprocessing
Among the measures reported in the reviewed studies, driver and vehicle measures required the least pre-processing. To convert the time-series behavior and vehicle data to machine learning features, most studies binned measures into time windows and processed them using standard statistics, e.g., mean, median, standard deviation, maximum, and minimum to create useful features (Ji et al., 2004; Son & Park, 2016). Beyond time-domain features, nonlinear features including entropy were also commonly used in the studies. Across all features steering entropy, standard deviation of lane position, and standard deviation of speed and steering input were the most important features. These features were particularly important for algorithms trained to detect distraction and drowsy driving.
Driver and vehicle measures in state prediction
Driver and vehicle measures were used to detect driver distraction, drowsiness, driver workload, crash likelihood, and driver errors. Few studies compared driver and vehicle measures with others, however, the comparisons that were made suggested that driver and vehicle measures were more important than physiological measures—including heart rate and respiration rate—for identifying sensorimotor distraction (i.e., texting) and driver errors following a transfer of control from automation (Alambeigi et al., 2021; Du, Zhou, et al., 2020; McDonald et al., 2020).
Eye-tracking and Head Measures
Eye-tracking measurement
The most common approach to collect eye data is to use camera-based eye-tracking systems either mounted on the dashboard or attached to glasses. The measures derived from these systems include eye glance location, eye closure, and head position. These measures can be used to derive blinks and blink rate, glance duration, saccades and fixations, and head nodding.
Eye-tracking data preprocessing
The sampling rates of eye and head tracking across the reviewed studies varied from 10 Hz (Beggiato et al., 2019) to 1000 Hz (Hirata et al., 2009), although 60 Hz was the most common sampling rate. The initial sampling rates were typically determined by the measurement device’s capability. Preprocessing steps across the studies included the application of band-pass and Butterworth filters (Papadelis et al., 2006), linear interpolation (Byrnes & Sturton, 2018), Kalman filters (Dababneh et al., 2016), normalization (Du, Zhou, et al., 2020), and visual inspection (Lehtonen et al., 2018). One critical pre-processing step included the identification of blinks and the separation of eye closure from blinks. Across the studies, the blink duration ranged from 80 ms to 500 ms and blink durations longer than 500 ms were typically defined as sleep related eye closures.
Eye and head-position measures were most often converted to features using time or frequency domain analysis. Feature importance analyses from the reviewed studies identified blink frequency, eyelid movement, gaze eccentricity (measured from the road center), gaze location, gaze duration, head movement, saccade magnitude, blink duration, pupil size, and the spatial distribution of the gaze pattern as important features. Gaze location was the most frequently identified important feature followed by blink frequency, glance duration, and spatial distribution of the gaze pattern (Costela & Castro-Torres, 2020; Liang et al., 2021; Mulhall et al., 2020; Svärd et al., 2021; Wu et al., 2021).
Eye-tracking in prediction
Eye measures have been used in the detection of fatigue, visual distraction, stress states (Pedrotti et al., 2014; Torres-Salomao et al., 2015; Yamanaka & Kawakami, 2009), situation awareness (Zhou et al., 2022) and driver errors (Alambeigi et al., 2021). PERCLOS—percentage of a time window where the eyes are more than 80 % closed— has been the gold standard measure for drowsy driving detection and has even been used as a ground truth definition of drowsiness (Sommer & Golz, 2010). Off road glance duration has similarly been used as a definition of distraction (NHTSA, 2016).
Cardiovascular Measures
Cardiovascular measurement
Cardiovascular measures in the reviewed studies were collected using electrocardiograph (ECG) which measures changes in the electrical potential of the heart. The amplitude of the ECG signal is an indicator of the change in the heart’s electrical activity which can be used to derive heart rate and HRV. In the reviewed studies, heart rate was defined as the beats per minute of the heart and HRV was defined as the variability in time between successive heartbeats. ECG data was measured using chest mounted sensors with direct skin contact in most of the reviewed studies. Notably the measurement of ECG requires two points of contact and data can be corrupted by poor electrode contact.
The recommended sampling rate for ECG data was 250 Hz, however 125 Hz was deemed acceptable if analysis was confined to the time-domain (Laborde et al., 2017). Most studies recorded data at the highest frequency and down sampled to a lower rate. In addition to the sampling rate, most studies included a baseline measurement period to account for individual differences. The recommended baseline posture was having the participant seated with knees at a 90-degree angle with palms up on the legs for 5 min. Alternatively, Laborde et al., (2017) recommended using a baseline posture that best resembles the participant’s position during the experiment. The reviewed studies accomplished this baseline in a driving simulator by instructing participants to hold a driving posture for 15 minutes during simulator familiarization (Murugan et al., 2020).
Cardiovascular data processing
Cardiovascular data are prone to noise and require substantial pre-processing. The reviewed studies reported noise between the 50 Hz to 60 Hz range due to body movement and respiration. Beyond the inclusion of a baseline measurement period, there is no singularly accepted method of filtering. The reviewed studies used Finite Impulse Response and Infinite Impulse Response to remove noise from signals between 3 Hz to 100 Hz. Murugan et al., (2020) used the Butterworth 6th order to filter the ECG signals within the range of 0.5 Hz and 49 Hz. Notably, heart rate variability can be impacted by demographics, medication use, and activities such as smoking, alcohol consumption, or sleep loss. Thus, these demographics should be accounted for in data preprocessing.
Cardiovascular feature extraction in the reviewed studies was done in either the time or frequency domain. Time domain features in the reviewed studies include the heart rate RRinterval, R-peak, Root Mean Square Standard Deviation, and standard deviation of normal RR-interval. Frequency extraction for HRV was done with the Fast Fourier Transform, Empirical Mode Decomposition, or Discrete Wavelength Transform. These transforms, particularly FFT, were used to identify HRV frequencies across multiple bands including the Ultra-low frequency band (below 0.0033 Hz), very-low frequency band (between 0.0033 Hz and 0.04 Hz), low frequency band (between 0.04 Hz and 0.15Hz), and high frequency band (between 0.15Hz and 0.40 Hz). Among the studies that reviewed feature importance of cardiovascular features, the mean heart rate, maximum heart rate, mean IBI, and standard deviation of IBI over a time window were identified as the most important (Benedetto et al., 2011). Across the reviewed studies, driver, vehicle, and eye features typically were shown to be more impactful to algorithm accuracy compared to cardiovascular measures.
Cardiovascular measures in prediction
Cardiovascular measures in the studies were used to predict fatigue (Murugan et al., 2020), stress (Paschalidis et al., 2018), distraction (Alrefaie et al., 2019), and driver errors. While these algorithms have been moderately successful at predicting driver states, some of the reviewed studies suggested that the addition of cardiovascular measures did not improve algorithm classification performance (McDonald et al., 2020).
Electrodermal Activity (EDA) Measures
EDA measurement and sampling
EDA was measured from the wrists, palms, and digits in the reviewed studies. The studies suggested that measurement at the wrist is not recommended because it reflects thermoregulatory rather than psychophysiological relevant electrodermal phenomena (Boucsein et al., 2012). In addition to individual differences, the studies suggested that EDA measures are also sensitive to humidity, sweat, and the amount of electrolyte gel applied. Braithwaite et al., (2013) suggested a baseline of 2-4 minutes is sufficient for a lab experiment using hydrogel or paste with electrodes to account for individual differences, whereas Tronstad et al. (2022) suggested that 27 minutes was needed for measurements to stabilize.
The sampling rates across EDA transportation studies varied considerably. Braithwaite et al., (2013) suggest that sampling rates between 500 Hz and 2,000 Hz are needed for EDA data collection. In contrast, Tronstad (2022) recommended sampling rates around 5 Hz for skin conductance levels (SCL) and between 5 and 100 Hz for skin conductance responses (SCR). Among the reviewed studies, Li et al., (2018) and Villarejo et al., (2012) collected data at 100 Hz and 4Hz respectively on the tips of left index and middle fingers. Kurniawan et al. (2013) collected data at 2 Hz on the right index and middle fingers.
EDA data processing
The reviewed studies indicated that EDA data requires significant processing to remove artifacts. The filtering frequencies used to remove artifacts are dependent on the conditions present during the experiment. In their review of EDA data processing, Tronstad et al. (2022) indicated that machine learning algorithms and skin conductance software were common methods of artifact removal. While promising, the machine learning methods required considerable processing and additional decision making that may be difficult to implement in real-time.
In addition to filtering, the studies also normalized EDA data. Kurniawan et al., (2013) normalized the skin conductance by subtracting the minimum baseline value and dividing by the baseline range. Villarejo et al., (2012) included a voltage divider output and averaged the voltage over a 5 s window.
EDA measures in prediction
EDA has been used to predict driver stress and post-automated vehicle takeover performance. Li et al., (2018) used SCL for the overall physical arousal for the driver while Du, Yang, et al., (2020) used SCR to explain changes in the nervous system related to transitions of control from automation to human drivers. Kurniawan et al., (2013) used EDA values to predict stress levels in different scenarios. Villarejo et al., (2012) used EDA data to predict relaxed and stressed states. In general, these approaches were successful in predicting driver states significantly better than a random classifier.
Discussion
The goals of this review were to identify data sources that have been used for driver state prediction, understand the data preprocessing required for each data source to be converted into meaningful features, and to understand the feasibility of translating the findings from current research to the real-world. The review identified driver and vehicle measures, eye tracking measures, cardiovascular measures, EDA measures, neurological measures, and environmental measures as the measures used in driver state prediction algorithms. Among these measures, driver, vehicle, and environmental measures required the least preprocessing. Eye-tracking required more preprocessing than the driver and vehicle measures, however, it was also feasible to collect in the real-world. Cardiovascular, respiration, EDA, and neurological measures required the most preprocessing and faced several limitations in real-world translation associated with the need for baseline data, direct contact between sensors and the driver, and sensitivity to the environment. The findings are summarized in Table 2.
Summary of findings.

The review found variance in the performance of the data sources in detecting human states. Algorithms were more sensitive to data sources than the machine learning algorithm used. Driver and vehicle-based measures were predictive of multiple types of distraction, drowsiness, impairment, and driver errors. Eye measures were predictive of distraction and drowsiness. Physiological measures were typically outperformed by driving and eye measures for distraction and drowsiness detection but performed well for stress detection. Cardiovascular and neurological measures were effective for predicting driver stress, and neurological measures were effective for predicting fatigue. The review highlighted several research needs including the need for standardized reporting practices for data processing decisions, the need to explore the effects of recording data at lower frequencies, and the need to translate the findings from simulator studies to naturalistic environments. While this review highlighted several key findings, it is not without limitations. The review search was focused to published scientific work in the English language. This selection criteria excluded some relevant patents, existing algorithms that have been incorporated into designs, and algorithms developed and published around the world. Despite these limitations, the findings were moderately consistent across studies, thus, providing some evidence of convergence and lending credence to the findings.
Conclusions
There have been many studies focused on data collection for the purposes of driver state prediction algorithm development. These studies have used numerous sources including the vehicle, driver’s eyes, driver’s physiology, and driver’s neurological activity. Among these sources the vehicle, driver behavior, and driver eyes have been the most effective for drowsiness, distraction, and driver errors. Driver physiology has been most effective for stress. Translating these measures to the real world requires research to identify optimal sampling rates, data preprocessing steps, and features. Standardization of the conduction and reporting of these steps will facilitate translation. Additional studies are also needed to validate findings from driving simulation in the real-world.