
Abstract
Advanced driver assistance systems are changing the way that drivers interact with vehicles and may benefit from changes to consumer education that aim to improve the driver’s understanding of changes to their role. System updates will increasingly be applied over the air, which may lead to confusion about system capabilities if there is a substantial change, and there is a need to understand when changes need additional education. This paper uses a network analysis to quantify the change in driver assistance systems and also extends the approach to include a human user in the network. This paper describes the approach and presents an example comparing two adaptive cruise control systems, before and after an update. The network analysis quantified the connections within the network, with components of the driving assistance systems showing different connection strength with an increase in complexity of the system and with the addition of the user as a node in the network. The network analysis approach may be a useful tool for determining when additional consumer education is necessary for advanced driver assistance systems updates.
Introduction
Changes to vehicle technology will happen more frequently as over-the-air (OTA) update to driver assistance software becomes more common. OTA updates may improve the capability of driver assistance and automation features, such as adaptive cruise control (ACC), or even introduce new features that were not previously available on a vehicle, such as increasing the breadth of roads where an advanced automation feature can be used. These sudden changes to vehicle features may lead to confusion and inappropriate use by consumers, suggesting that new education and training may be needed.
Recent research demonstrates that understanding of ADAS, often referred to as a user’s mental model, is important for safe interactions with vehicle technology. Gaspar and colleagues (2021) showed that impoverished mental models translate to degradation in driving performance, particularly during edge case situations (i.e., based on limitations provided in the owner’s manual). Research also suggests that drivers have poor understanding of ADAS technology, even when they own vehicles with those systems (McDonald et al., 2018).
OTA updates may be challenging for drivers in the sense that some of these updates will change ADAS systems in such a way that a user’s existing mental model is ill-equipped to interact with the new system safely. Other updates may result in smaller changes that conform with the user’s mental model of the original system, allowing them to easily transfer existing skills. Thus, there is a need to understand the magnitude and quality of changes that result in these types of consumer confusions and when education is needed for system changes.
To date, there is not a standard approach to measuring the change in ADAS systems from OTA updates. One challenge is the complexity of ADAS technologies. ADAS systems such as ACC include subcomponents such as sensing systems, control algorithms, human-machine interfaces (HMI), vehicle controls, and interactions with the environment. OTA updates could alter one or more of these subsystems, which may also alter the relationships between them. Another challenge is how changes to these subcomponents affect user behavior. There are many changes that may not have corresponding behavioral effects, meaning that they could be irrelevant for determining whether consumer education is needed. The interaction between system complexity and user effect makes identifying a specific approach difficult.
This paper attempts to close this gap by applying a network analysis to measure the change in ADAS systems from OTA updates. Network analysis is an approach to describing and quantifying the information flows within a network, most often used to quantify information flows in social networks (Borgatti et al., 2009). This approach provides metrics that capture network complexity and connectedness, which are useful in describing the subsystems within an ADAS technology. This approach has been previously used by Lee and Kantowitz (2005) to map the relationships between different in-vehicle information systems to determine which one was most important for user interaction.
This paper adapts the network analysis approach to map the relationship between subcomponents of an individual ACC system. The paper also presents an approach for including the human user in these networks, which is helpful in quantifying the human-ADAS relationship and how it might change following an OTA update. The goal is to establish a relationship between changes in the network and changes to the user interaction as a means of identifying when consumer education is needed.
Network Analysis
In the context of ADAS, the goal is to map the relationship between different subsystems or features. These features can be deconstructed to their functional components, which are defined as the range of functions, roles, or responsibilities of the feature. By mapping the flow of information across the functional components, one can construct a network that quantifies the flow of information within the vehicle system.
This section provides a summary of the process for developing an ADAS network, using a generic baseline ACC system. The process consists of three steps: 1. Generating functional descriptions of the system, 2. Mapping information flows across functional components (i.e., nodes in a network analysis) of the system, and 3. Visualizing the network and create network metrics.
Step 1: Generate Functional System Descriptions
ADAS systems can be described at different levels of abstraction (Table 1), which include the system, subsystems or features;
System Level: descriptions provide the overall name(s) of the system and the system’s objective (e.g., Baseline ACC).
Subsystem (Feature) Level: consists of the various system features or subsystems. This includes the various objectives of the system (e.g., speed control), the systems used for sensing and controlling the system, and the connections with the human user.
Functional Component Level: this level provides the different functions performed by each feature and the different components of each subsystem. For example, the sensing subsystem relies on a combination of radar, cameras, and other information from the environment such as weather sensors.
Functional system descriptions.
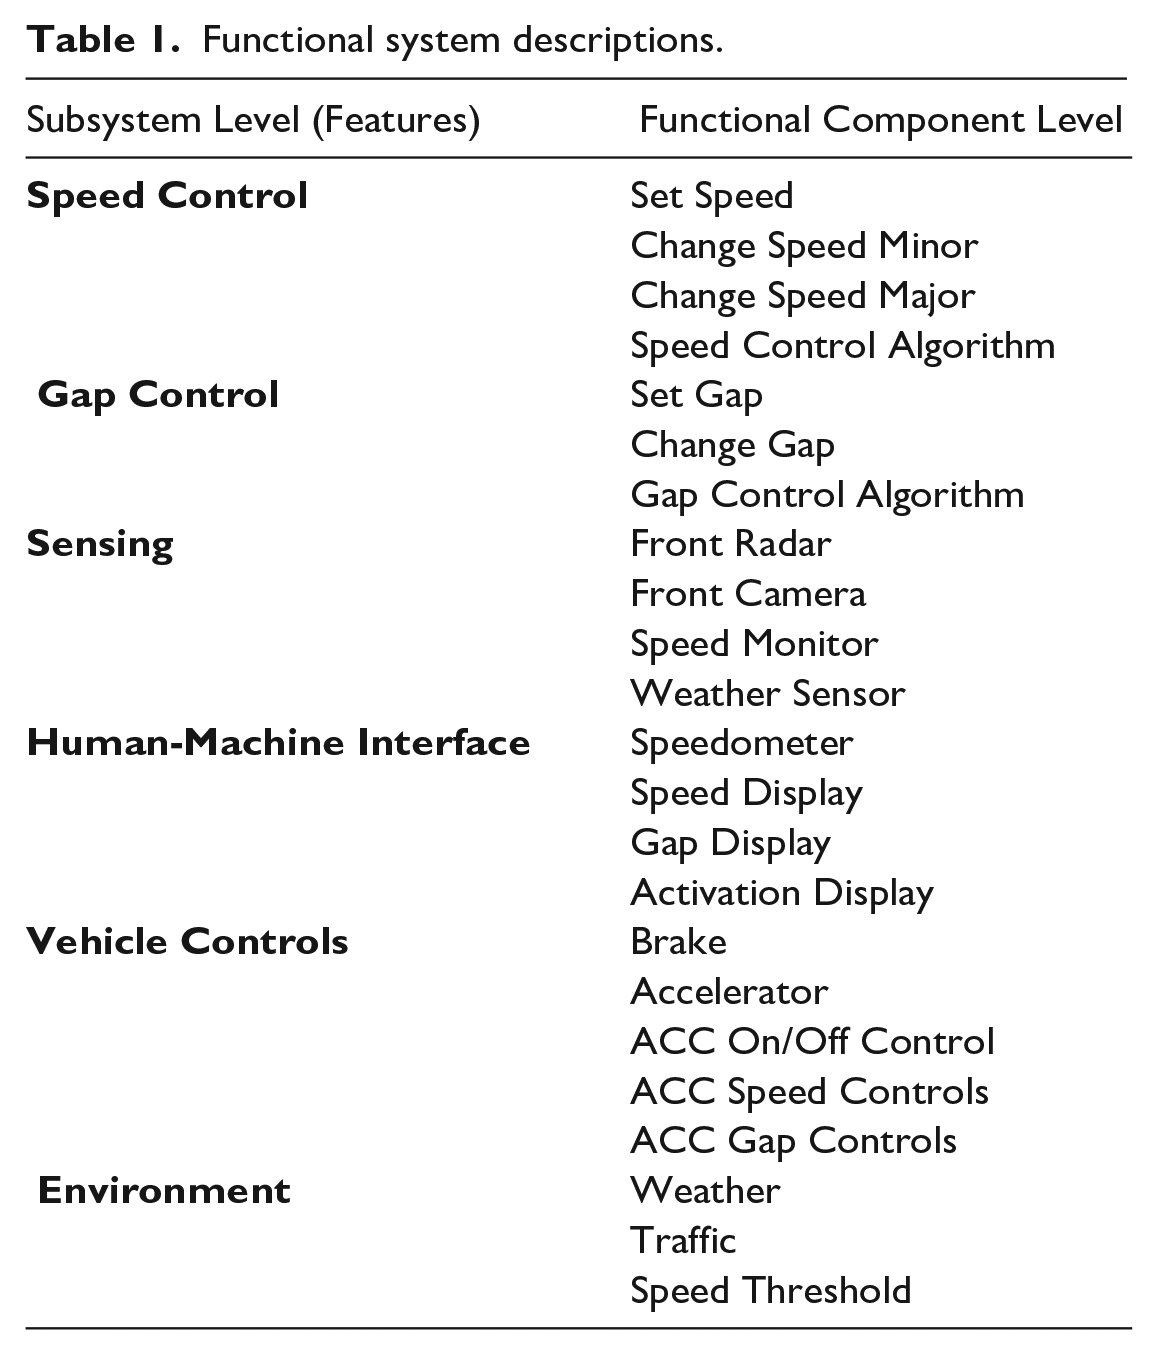
The network analysis approach presented here focuses on the mapping of information flows among functional components of ACC systems. The functional components are represented as nodes in the network. These functional components describe how the system functions, without providing specific physical descriptions (e.g., HMI icons). Functional components can be identified by reviewing the different functions of a system as well as how the system interacts with the user (or vice versa) and environment. The functional components of the Baseline ACC system in Table 1 were identified based on a review of network diagrams from production ACC systems (Pradhan et al., 2019).
Step 2: Generate Functional System Descriptions
The next step is mapping the flow of information across each of the functional components. This is a step-by-step mapping of the inputs of information from each node (i.e., functional component level) to every other connected node. The connections between nodes are called edges and represent the directional flow of information from one node to another.
Figure 1 shows an example of this information flow mapping. The speed control algorithm provides information to many functional components. The algorithm might adjust the speed monitor, manipulate the accelerator and/or brake controls, and modify the system’s HMI by adjusting the activation or speed display components. These information flows are represented as a matrix, where inputs from one functional component to another are defined by “1”. The complete matrix mapping information flows for Baseline ACC (as well as the updated ACC described later in the paper) are available in the supplemental materials.
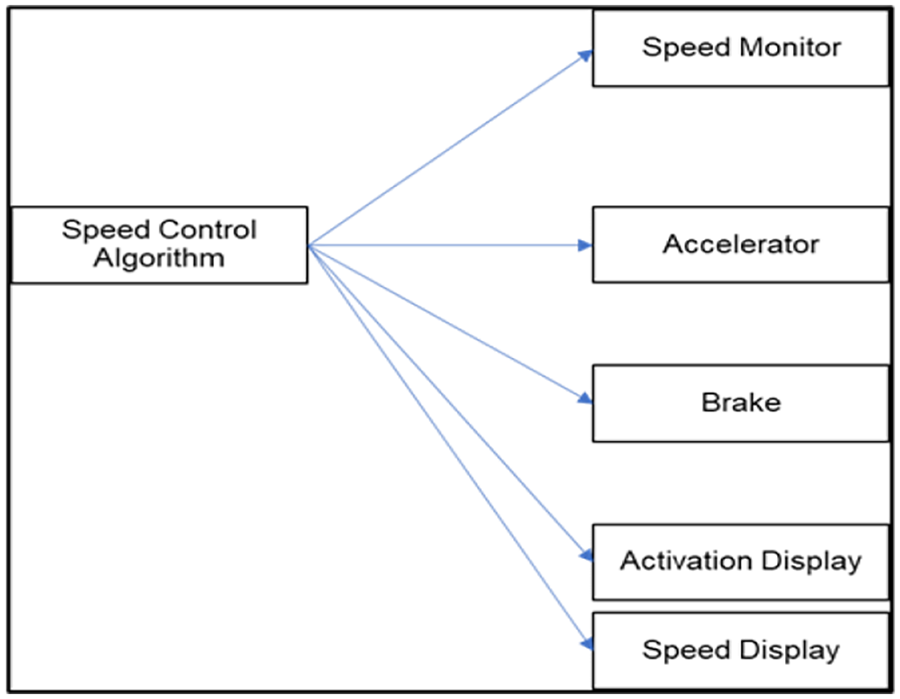
Example information flows.
Step 3: Construct Network and Generate Metrics
The system network can be constructed using the complete matrix of information flows across functional components. The networks presented in this report were constructed and analyzed using the igraph package in R (Csardj and Nepusz, 2006). Figure 2 shows the network for Baseline ACC. The arrows represent the flow of information from one node to another. Several features are visible in this network representation. The speed and gap control algorithms are important to the network because they receive information from many other nodes from different subsystems and send information to many functional components (i.e., nodes). The speedometer, on the other hand, only receives input and is therefore less central to the network. Similarly, the ACC gap controls provide information to other nodes without receiving incoming information.
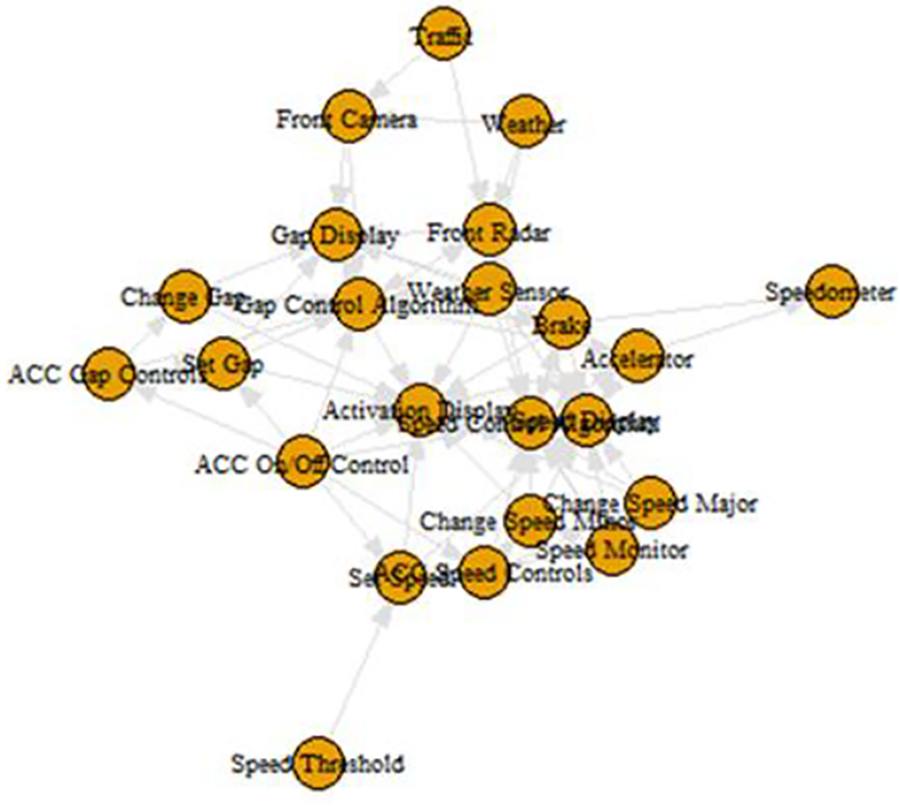
Baseline ACC network.
Several metrics can be computed to describe the overall network (network level) and the role of individual nodes within the network (node level). Node-level measures indicate the role of each node in the flow of information in the system network. Centrality represents the importance of an individual node to the network. This can be computed as the number of inputs to or outputs from each node, referred to below as input and output degree centrality. A node with high input centrality receives much information from other nodes in the network. Examples of this in Figure 3 are the speed and gap control algorithms and the displays.
Baseline vs. ACC+TJP.
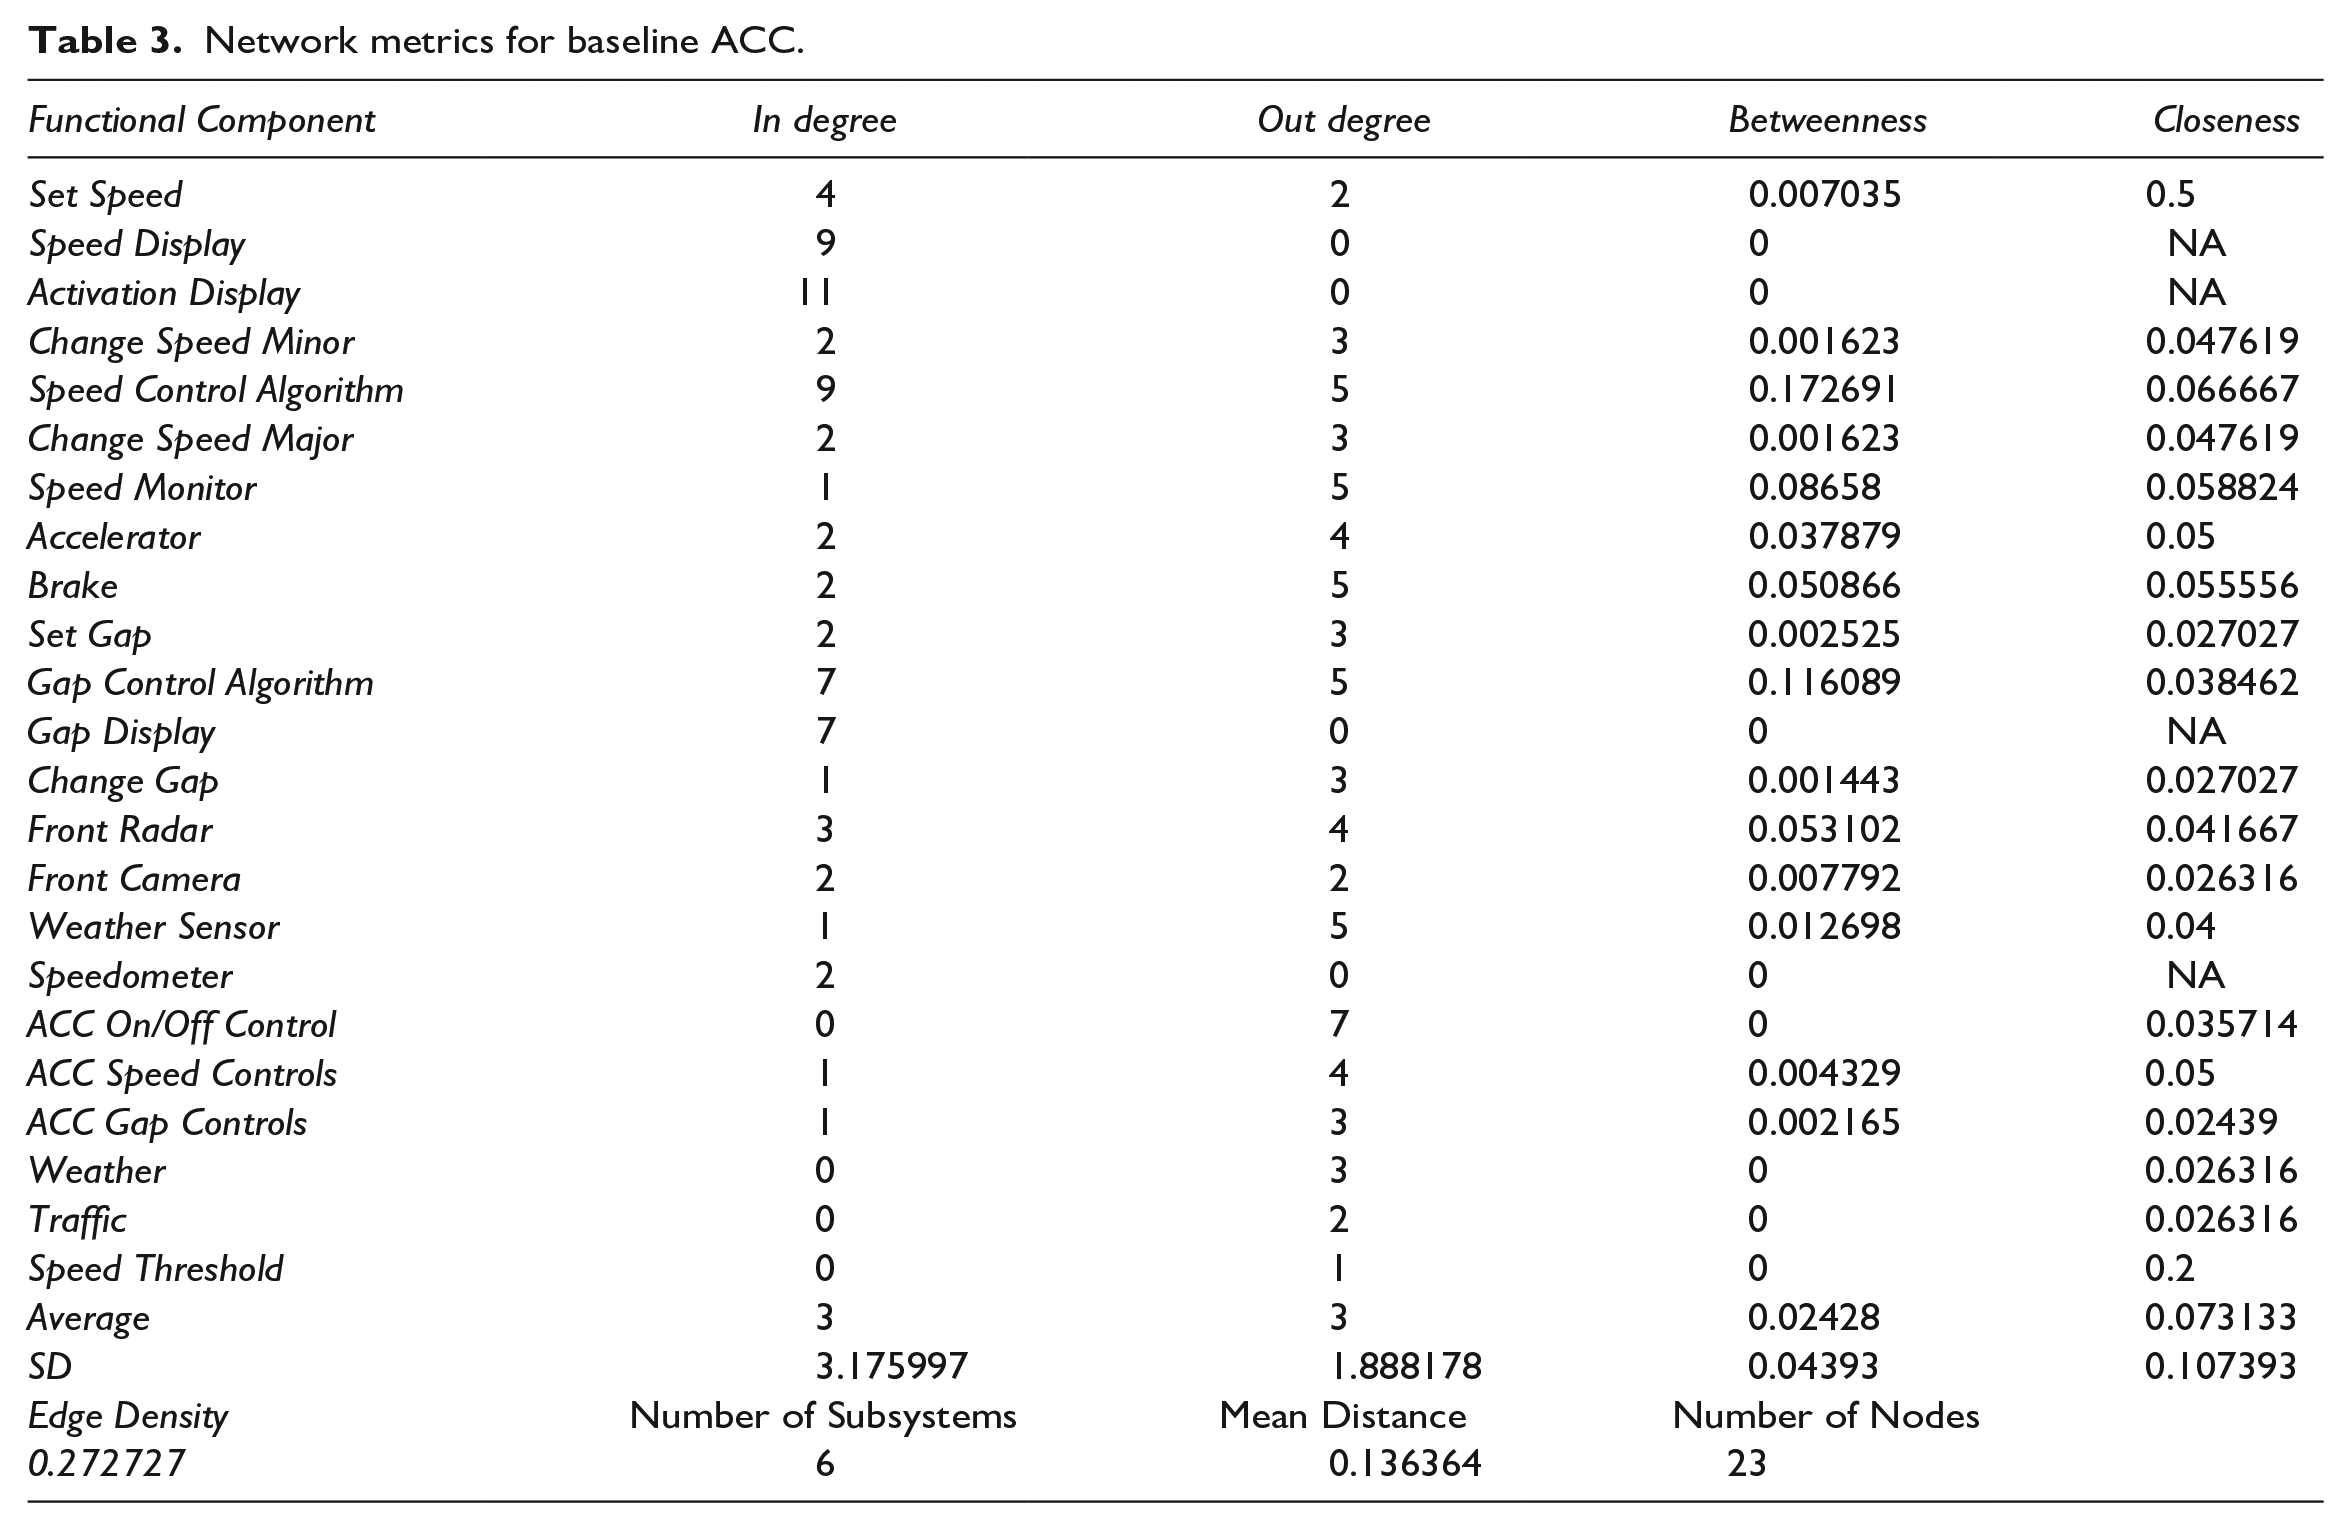
Network-level measures provide different information about the overall network. Simple measures such as the number of subsystems or features and the number of nodes provide information about the complexity of the system. Edge density calculates the proportion of potential edges (i.e., connections) that exist. A selected set of these measures is described in Table 2. Table 3 presents the metrics calculated for the Baseline ACC network.
Network metrics.

Network metrics for baseline ACC.
Comparing ADAS Systems
The goal of this network approach is to utilize network analysis to compare different systems, specifically the context of a system that has changed following an OTA update. To illustrate how network analysis can be used to quantify differences between systems, this section presents a network comparison of Baseline ACC and ACC with the addition of a Traffic Jam Pilot (TJP) feature. For the purposes of this example, TJP is a conditionally automated driving feature (SAE, 2021) which functions specially in low-speed traffic jams. Table 4 shows the added functional components of this hypothetical system (compared to baseline). The highlighted subsystems and components are those that differ from the Baseline ACC system. The relational matrix for the ACC+TJP functional components was created by mapping the information flows from each functional component using the same approach described in the previous section. The complete relational matrix is available in the supplemental materials.
Additions to ACC+TJP from baseline.

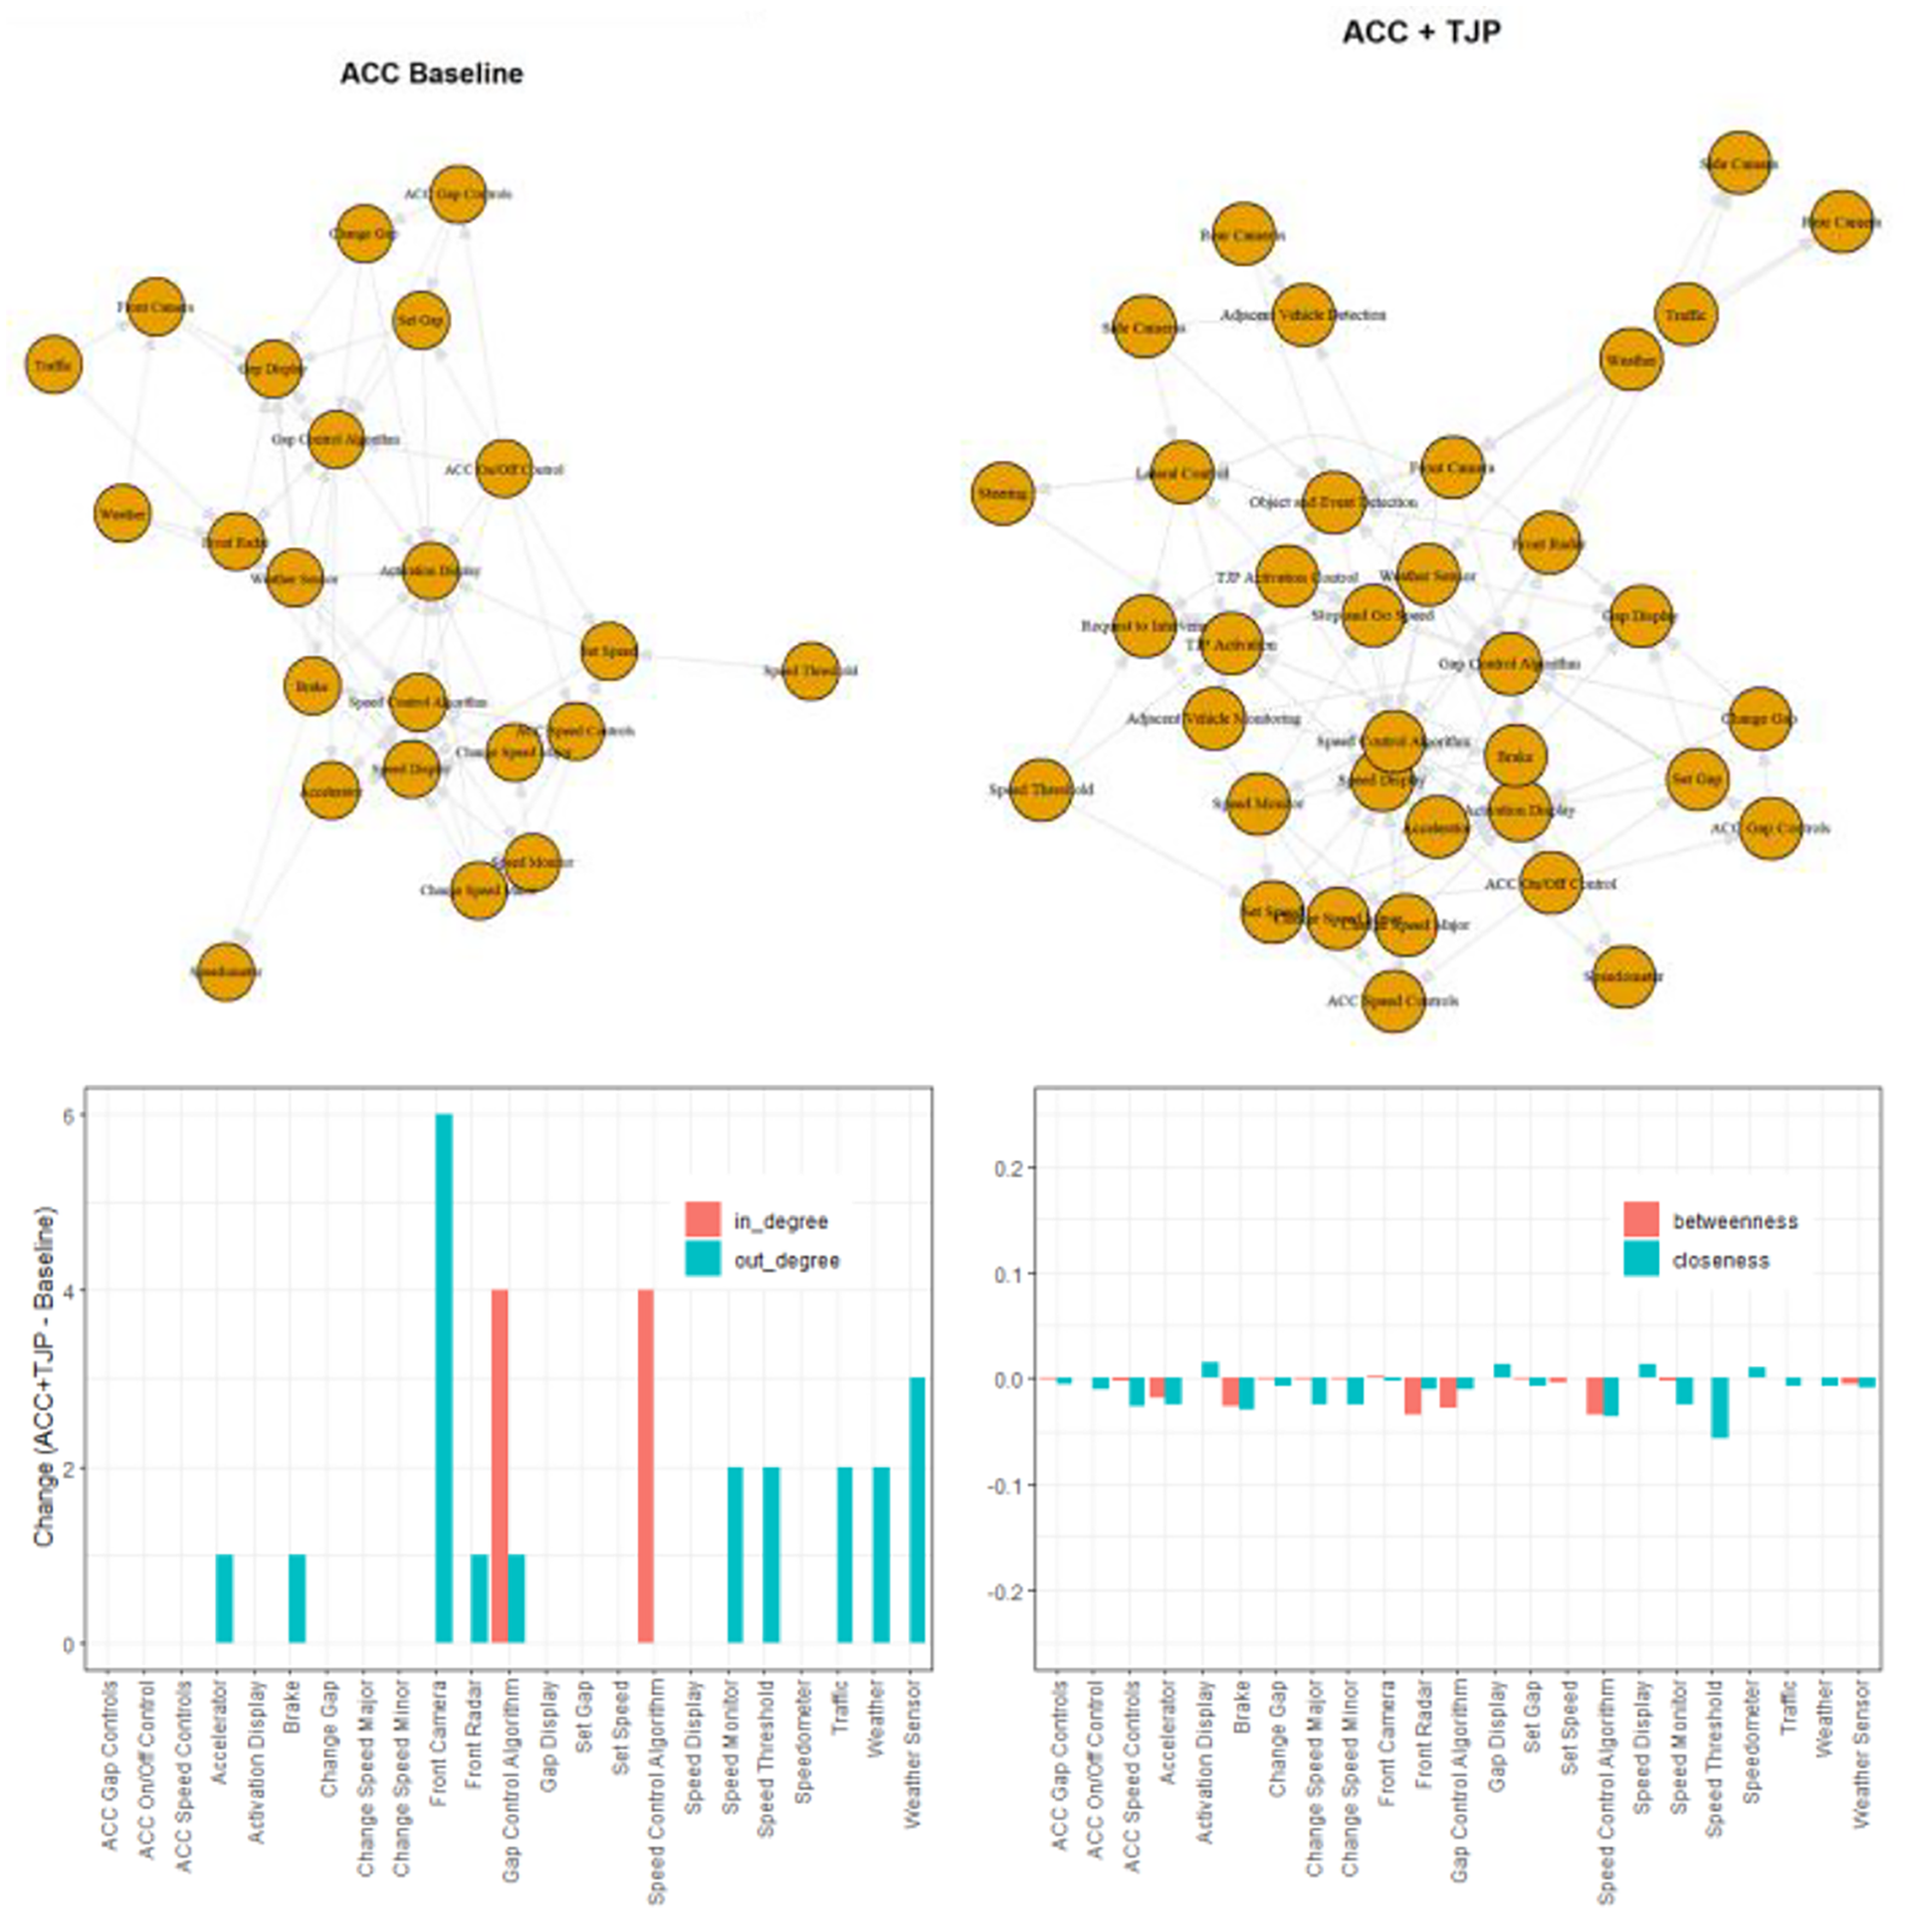
Figure 3 presents the Baseline and TJP networks along with a comparison of network metrics for the common functional components. At a high level, ACC+TJP is a larger network, with one additional subsystem, 12 additional nodes, and an increase in mean distance, measuring the average number of steps between nodes.
The speed and gap control algorithms showed an increase in in-degree centrality as well as large increases in betweenness. This shows the control algorithms collect even more inputs relative to in the baseline system. Several functional components show an increase in out-degree centrality in ACC+TJP. In particular, the front camera provides increased inputs to other nodes, likely due to its role in speed maintenance and object detection during TJP. Environment nodes also play a more important role in the new system, providing ODD-level information important for the level 3 functionality.
Figure 3 displays an increase in centrality for ACC+TJP, particularly output centrality. This reflects an increase in connectedness between nodes in the updated system. For example, the front camera becomes more central to the network, adding six new connections with the addition of TJP.
Figure 3 also shows the change in betweenness and closeness for the two systems. For the functional components common to both Baseline ACC and ACC+TJP, betweenness and closeness generally decreased in the updated system. This reflects the increased complexity of the network. The addition of a new subsystem and new nodes increases the number of available paths for information to flow between nodes. These changes are relatively small, with the largest change in the speed control algorithm (-0.35 or 3.5%).
These network measures help illustrate where errors might arise from a system update and correspondingly what aspects of the system might require quick fix consumer education. For example, the increased importance (measured by centrality) of the front camera in the updated system might require users to better understand that feature and how it interacts within the system. Users might need to formulate a mental model of the camera’s ability (and limits) to detect certain objects. The addition of new features and nodes might also necessitate training, particularly as they involve a subset of the original functional components. One example is the role of the control algorithms, which now function within both the original design domain of high-speed traffic as well as the new domain of traffic jams.
Adding the User
The human user plays a key role, even when vehicles are equipped with automated systems. ADAS may change the role of the user in the driving task, and it is important to understand the roles and responsibilities of the collective human-ADAS system. It is useful to consider the human as part of the ADAS network. Incorporating the user into the network may be helpful in understanding how roles and responsibilities change (or do not) following OTA updates. This understanding can help inform strategies for consumer education, where necessary.
The user subsystem represents the tasks and responsibilities allocated to the user, which include monitoring the environment and system and changing system settings. Note that this could include other activities (such as nondriving tasks) and that responsibilities may change based on the capabilities and expectations of the ADAS. Figure 4 shows the ACC+User network compared to Baseline without the user. As expected, adding the user increases the overall size and complexity of the network. Several of the nodes have a resulting increase in input centrality in the network that includes the user. This reflects the fact that the user provides inputs to several functional components within the network, such as the gap controls. Adding the user also changes the betweenness of other functional components. Some components, such as the displays, show higher betweenness in the updated network. Other nodes, specifically the control algorithms, show a reduction in betweenness with the user added.

ACC baseline vs ACC+User.
Discussion
The network analysis approach presented in this paper is a method for quantifying the changes in an ADAS system following an update. The approach is useful in describing changes to both the overall network and to specific functional components (i.e., nodes) within the network. This approach is valuable in that it can help identify functional components whose roles have changed, expanded, or diminished. It can also help illustrate the importance of different components to the overall network and may be a useful tool for suggesting education approaches.
This paper also presents an approach for including the user in ADAS networks. While previous work has focused on mapping networks of systems (e.g., Lee & Kantowitz, 2005), it has not included the human’s role in the human-ADAS relationship. However, including the human is an important step for identifying where errors may occur and where additional consumer education may be necessary.
The approach relies on an accurate definition and mapping of subsystems and functional components, as the network creation and resulting metrics rely heavily on this framework. In applying this approach to identify training needs, what remains unknown is the functional impact of changes in these measures and their magnitude to driving performance. While the network analysis approach speaks to how users may interact with a system, it may not provide data to determine whether participants are likely to use a system. Therefore it is important to understand the relationship between system networks and user mental models.