
Abstract
Health information like heart rate (HR) and electrocardiogram (ECG) patterns are available to the public on smartwatches; however, there may be a disconnect between these health measures and how users subjectively experience feelings of stress. This study examines the health detection features of two leading smartwatches in the industry, the Apple Watch Series 6 and Fitbit Sense, to determine if these devices may be used to accurately measure stress. Participants engaged in a multi-tasking program (MATB-II) that varied in cognitive workload demand while wearing smartwatches measuring cardiac data. Subjective workload responses resulted in significant differences between low and high workload conditions, indicating an increase in stress. However, both smartwatches were unable to detect significant differences in stress responses between low and high workload conditions. Overall, these results indicate that smartwatch HR and ECGs may not reflect internal feelings of stress and are sensitive to variability in measurement.
Keywords
Introduction
It is important to be able to detect and manage an individual’s stress levels considering the heightened prevalence in stress-related chronic health conditions. When a person experiences stress, several physiological responses may be used as measurable indicators of stress level, including changes in heart rate (HR), heart rate variability (HRV), cortisol levels, and blood pressure (Childs, White, & de Wit, 2014). Prior research has shown that most daily stressors are rooted in the workplace (Wainwright & Calnan, 2002). Career fields that are highly stressful may involve daily threats of life and death (e.g., police officers and warfighters) or severe consequences in the event of a mistake (e.g., miners, airline pilots, and surgeons; Cranwell-Ward & Abbey, 2005). Several studies (e.g., Johnson et al., 2005, Robertson & Ruiz, 2010) have leveraged physiological responses to stress to measure daily stress levels in high intensity career fields, such as when Seoane et al., (2014) measured the mental stress of combatants in real time.
Even in jobs that may be subjectively less stressful, the human body still experiences the highest number of physiological stress responses during hours of work (Okada et al., 2013). Multiple studies have shown that of the acute stress responses, cardiac activity (i.e., HR and HRV) is a reliable indicator of stress levels in humans (Okada et al., 2013; Seoane et al., 2014; Schwerdtfeger & Friedrich-Mai, 2009) because it is linked to the cortical regions of the brain involved in stressful situation appraisal (Kim et al., 2018). However, many of these studies measure stress responses with equipment that is not practical for everyday use such as chest-mounted, three-electrode electrocardiograms (ECGs) or a sensitized glove apparatus. While this equipment is effective in measuring human stress responses in a controlled research environment, its limited accessibility and invasive design implies that the average person may be unable to measure or manage their daily stress levels without doctor-ordered tests.
Advancements in smartphone and mobile sensing technology have enabled the public to integrate devices equipped with health tracking features (e.g., smartwatches and fitness trackers) into their everyday lives (Reeder & David, 2016). Currently, popular smartwatches like the Apple Watch Series 6 and Fitbit Sense are equipped with the following health and activity tracking features: global-positioning systems (GPS), altimeter, blood oxygen sensor, electrical heart sensor, optical heart sensor, accelerometer, and gyroscope (Apple Inc., 2020; Fitbit LLC, 2020). In addition to the health and activity tracking features, the smartwatches are equipped with the same or similar capabilities as a smartphone, boosting the popularity of smartwatches among smartphone users (Chuah et al., 2016).
This work aims to achieve a better understanding of the capabilities of smartwatches related to the detection and measurement of physiological stress responses as compared to subjective workload. Further, this research investigates the data accessibility associated with the health detection features on the Apple Watch Series 6 and Fitbit Sense to determine if the data produced by these devices may be easily analyzed and compared. Based on what is known about the relationship between stress levels, workload, and cardiac responses the expected results of this study are:
a) As user workload increases, user stress will increase, (Wainwright & Calnan, 2002)
b) An increase in perceived stress will result in a measurable increase in physiological stress responses (i.e., heart rate and heart rate variability), (Cranwell-Ward & Abbey, 2005; Seoane et al., 2014), and
c) The data streams produced from the smartwatches will positively correlate with subjective workload. (Okada et al., 2014)
Methods
Participants
Twenty-two college students (11 male and 11 female) with a mean age of 24.2 (SD = 3.1) gave informed consent to participate in this study. This study complied with the American Psychological Association (APA) Code of Ethics and was approved by the Institutional Review Board of the University of Virginia. An even number of participants was necessary to properly counter-balance task presentation during the trials. Participants were compensated with a $10 gift card following completion of the experiment.
Experimental Setup
The setup included a standard desktop computer setup—i.e., a desktop monitor, keyboard—which the participant could use to interact with the Multi-Attribute Task Battery II (MATB-II) program developed by National Aeronautics and Space Administration (NASA). During the trials, participants wore an Apple Watch Series 6 on their left wrist and a Fitbit Sense on their right wrist. Both watches were positioned so that the optical and electrical heart sensors were flush against their skin and 1 cm above the end of the ulna (see Figure 1).

Experimental setup depicting smartwatch placement.
Participants were stationed in a desk chair adjusted to their comfort level in front of a HP Z230 workstation with a 28” monitor, keyboard, wireless mouse, and Logitech joystick to monitor MATB-II tasks during each trial (see Figure 1). The AliveCor Kardia, an ECG device approved by the Food and Drug Administration (FDA), was placed within reach of the participants for standardized ECG measurements between trials.
MATB-II Task Overview
Participants were tasked with completing two 3-minute-long evaluation trials using the MATB-II program. The MATB-II computer-based multitasking program is designed to evaluate operator performance and workload (Santiago-Espada et al., 2011). This program was selected because it simulates a high-stress career field (i.e., being a pilot) and allows the experimenter to manipulate the number of tasks the participant is presented (Cranwell-Ward & Abbey, 2005).
The MATB-II program consists of four main tasks that the user is required to monitor: System Monitoring (SYSM), Tracking (TRCK), Communications (COMM), and Resource Management (RMAN) (see Figure 2). These tasks run concurrently during the trials and are controlled with a wireless mouse, keyboard, and wired joystick.

The MATB-II program interface depicting System Monitoring, Tracking, Communications, and Resource Management tasks. The Scheduling interface module was not used for the purposes of this experiment.
The SYSM task requires users to monitor the dark blue panels within the light blue vertical gauges (labeled F1-F4 in Figure 2) and ensure they remain centered on the gauge. The normal state of this component presents as the dark blue panels centered on the gauge, and the failed state of this component occurs when the dark blue panels are at the top or bottom of the gauge. Additionally, the SYSM section has buttons labeled F5 and F6 that require attention: the F5 button must always remain green (failed state: button turns white) while the F6 button must always remain white (failed state: button turns red). These components are controlled by corresponding keyboard keys labeled F1-F6 or by mouse.
The TRCK task simulates controlling an aircraft system during flight. The goal of this task is to keep the circular reticle near the center of the crosshairs using a wired joystick. If left untouched, the circular reticle will randomly migrate away from the center of the crosshairs.
The RMAN task represents fuel management while onboard an aircraft in flight. The goal of this task is to maintain ±250 units from the starting volumes in tanks alphabetically labeled A-D. Tanks A and B start at 2500 units, while tanks C and D start at 1000 units. Tank fuel levels are controlled by operating fuel pumps numbered 1-8 (pump states: open = green, closed = white, failed = red). Tanks A and B are constant drain throughout the simulation. There is no combination of pump flow that results in a steady state tank volume, so the user must actively monitor this task.
The COMM task simulates pilot interaction with aircraft controller requests (Gutzwiller et al., 2014). The user is called to action through audio in the generic form of “[Call sign], please change your [radio] to [frequency].” The goal is to change the radio and frequency using a mouse as quickly and accurately as possible. The user must only respond if the audio message refers to the user’s call sign, which, in this experiment, was “NASA 504.”
Experimental Design
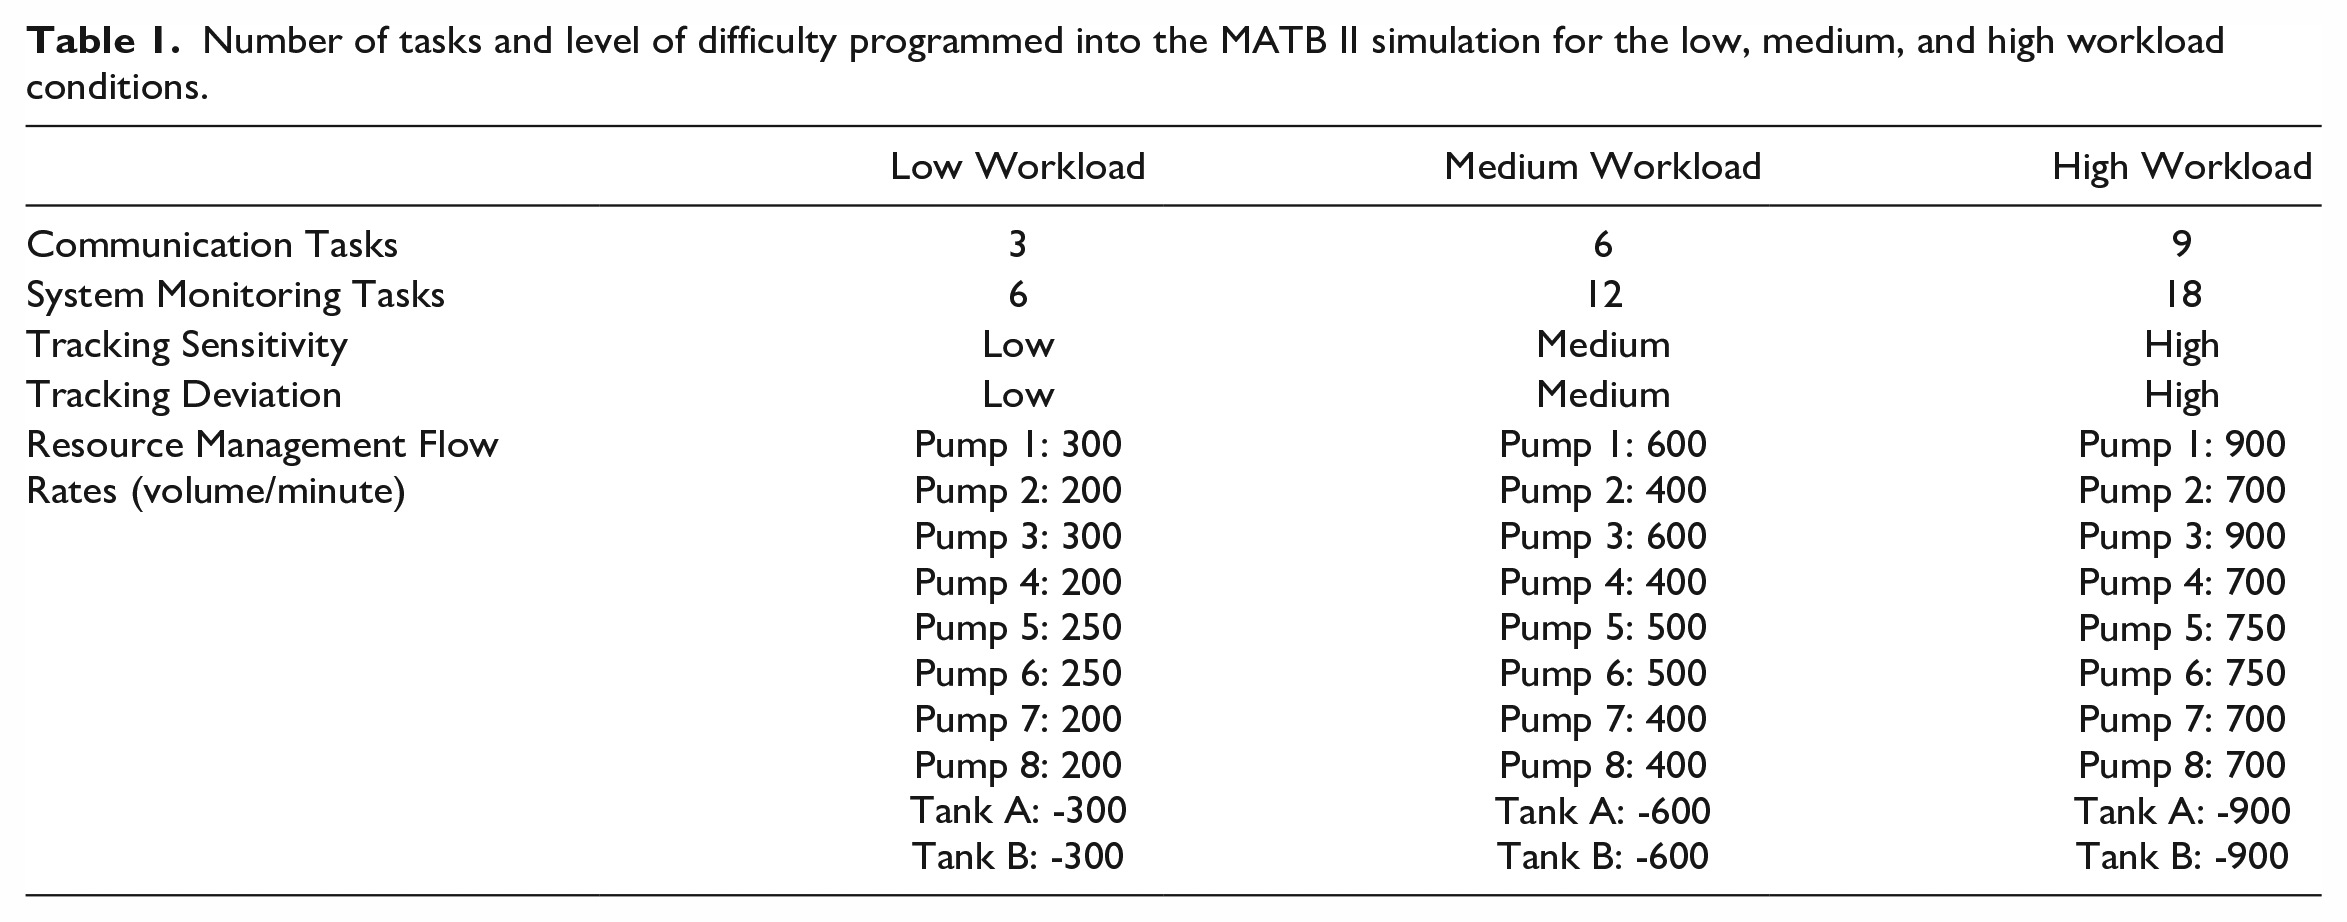
This study leveraged the flexibility of the MATB-II program to create low and high workload conditions for testing purposes and a medium workload condition for training. The training module was used as a qualifier to continue with the experiment. The variables altered to create the three workload conditions were task frequency (i.e., the number of tasks per category presented to the user during the simulation), joystick sensitivity, and pump flow rates. The difference in task difficulty, joystick sensitivity, and pump flow rates within the low and high workload conditions was programmed to elicit measurable differences in stress responses and developed during pilot testing.
The low workload condition TRCK and RMAN tasks were programmed with recording intervals that allowed participants leniency in making mistakes. This allowed participants more time to address tasks between each recording interval, resulting in the ability to apply attention elsewhere in the MATB-II program. Conversely, the high workload condition was programmed with the shortest recording intervals that limited the amount of time participants had to address other tasks within the MATB-II program (Table 1).
Number of tasks and level of difficulty programmed into the MATB II simulation for the low, medium, and high workload conditions.
Procedure
Participants were asked to read and sign an informed consent form followed by a demographic survey. The experimenter explained the details of the study including the equipment involved and an overview of the tasks required. Participants took a baseline ECG using the AliveCor Kardia device and adjusted the Fitbit Sense to fit securely on their right wrist. The experimenter read scripted instructions for each task in the MATB-II program. Afterwards, the participant completed the medium workload training module. Participants then fit the Apple Watch Series 6 to their left wrist and completed the low and high workload testing conditions. In both conditions, the program was paused at the 1.5-minute and concluded at the 3-minute mark, at which time the participants recorded an ECG using the Apple Watch Series 6 and then the AliveCor Kardia ECG, respectively. At the conclusion of the study, each participant completed a debriefing questionnaire. The study was approximately 1 hour in duration.
Results
The dependent variables in this study were participant cardiac activity and subjective workload differences during each testing period. Cardiac activity was used to calculate differences in HR and HRV under the low and high workload conditions. Subjective workload was assessed using the NASA Task Load Index (NASA-TLX) questionnaire. The HR and HRV data were recorded using an ECG from the AliveCor Kardia ECG and Apple Watch Series 6. The ECG results were first analyzed using a Shapiro-Wilk normality test to show that the distribution of differences in the paired samples were not significantly different from a normal distribution. Paired samples t-tests were then used to analyze the ECG results as well as the NASA-TLX scores to identify significant differences between the low and high workload conditions.
Subjective Workload (NASA-TLX)
Participants filled out a NASA-TLX questionnaire at the conclusion of the low and high workload conditions to gauge subjective workload and, by default, perceived stress levels. When comparing the responses from the low workload condition to the high workload condition with paired samples t-tests, all categories showed significant differences (all p < 0.001). Effort (t(21) = 6.6742, p < 0.001), Frustration (t(21) = 5.5193, p < 0.001), Mental Demand (t(21) = 7.4394, p < 0.001), and Temporal Demand (t(21) = 4.6673, p < 0.001), showed significant increases in response ratings from the low workload condition to the high workload condition. Performance (t(21) = -9.0441, p < 0.001), showed a significant decrease from low workload to high workload, indicating a perceived decrease in performance that was accurately reflected by the MATB-II task scoring associated with each experimental condition.
Heart Rate (HR)
AliveCor Kardia
There were no significant differences found between the low workload (M = 73.1 bmp, SD = 10.3) and high workload (M = 76.8 bmp, SD = 10.9) condition HR measurements using the AliveCor Kardia ECG device (t(19) = 0.34793, p = 0.7317).
Apple Watch Series 6
A paired samples t-test between the low workload (M = 69.2, SD = 10.1) and high workload condition Apple Watch Series 6 ECGs (M = 72.7 bmp, SD = 9.2) did not show a significant increase in HR, t(20) = -0.5055, p = 0.6187.
Fitbit Sense
The Fitbit Sense was worn by participants throughout the duration of the experiment and measured HR continuously in 5-second intervals. Participants showed an average HR of 77.5 bmp during the low workload condition and 78.3 bmp during the high workload condition. Paired samples t-tests were run on the average for each condition using the continuous HR data and there were no significant differences found between low workload (M = 77.5, SD = 9.3) and high workload (M = 78.3, SD = 9.9) conditions, t(21) = -1.7219, p = 0.09979.
Heart Rate Variability (HRV)
Heart rate variability was calculated by converting the data into a time series format and using the Root Mean Square of Successive Differences (RMSSD) of the R-R intervals of heartbeats during the ECG recordings. RMSSD has been shown to be most accurate during short (i.e., 30 seconds or less) HRV measures (Thong et al., 2003). To isolate R-R intervals from raw data, the data was screened for local peaks (the QRS complex) and the largest peaks were then amplified. A threshold which all amplified QRS complexes surpassed could then be determined so that any point in time with an ECG measurement above that threshold indicated the R portion of the QRS complex. The R-R intervals are then identifiable and RMSSD can be calculated.
AliveCor Kardia
Paired samples t-tests between the low (M = 0.11, SD = 0.10) and high (M = 0.13, SD = 0.15) workload Kardia did not show a significant increase in RMSSD (t(16) = 1.1329, p = 0.2739).
Apple Watch Series 6
There was not a significant difference between low workload and high workload condition RMSSD using the Apple Watch Series 6 ECGs (t(17) = -1.1149, p = 0.2804). However, this conclusion is caveated by the fact that differences between the pairs were not normally distributed based on the Shapiro-Wilk normality test (W = 0.83791, p = 0.02).
Debriefing Questionnaire Responses
Participants were asked to subjectively rate how stressed they felt on a scale from 0-10 (0 being not stressed at all, 10 being most stressed) as part of the demographic survey at the beginning of the experiment, and again upon completion. Pre-trial responses resulted in a self-reported mean stress level of 3.48, while post-trial responses resulted in an average of 4.57. A t-test showed a significant difference between pre- and post-survey stress ratings (t(21) = -2.9823, p = 0.007).
Discussion and Conclusions
The goal of this research was to determine the extent to which two industry-leading smartwatches, the Apple Watch Series 6 and the Fitbit Sense, can accurately detect and measure stress responses as a function of workload compared to perceived workload measured by the NASA-TLX survey.
Based on this study, perceived workload may significantly differ between workload conditions without triggering a measurable physiological response detectable via cardiac data. Participants may experience heightened feelings of stress that are not reflected in HR or HRV data. It is therefore important to consider subjective measures in addition to objective measures of stress to garner a holistic representation of user stress that includes mental and physiological stress.
The results of this study affirm our first hypothesis: as user workload increases, user stress will significantly increase. The NASA-TLX responses demonstrated a significant increase in participant perceived workload from the low workload condition to the high workload condition. However, the equivalent was not reflected by the HR and HRV measurements taken by the Apple Watch Series 6 or the Fitbit Sense. Therefore, we must reject our second hypothesis: an increase in perceived stress, determined by the NASA-TLX survey responses, did not result in a significant, measurable increase in the physiological stress responses utilized (HR and HRV). Finally, data streams produced by the smartwatches did not positively correlate with subjective workload, and we must reject our third hypothesis expecting such. This research overall supports prior findings that workload affects stress levels (Taelman et al., 2009; Okada et al., 2013; Cranwell-Ward & Abbey, 2005; Wainwright & Calnan, 2002).
Overall, these findings contribute to a new and growing body of work that aims to test the validity of health features on wrist-wearable smart devices. Further, this research supports the findings of variability in data collection among popular smartwatches (Siirtola, 2019; Ciabattoni, 2017).
Limitations and Future Work
Individual confidence levels of participants and their perception of how prepared they are to handle the MATB-II tasks may impact their stress levels and therefore present as a limitation within this study. It has been shown that if an individual feels they have the necessary skills or tools to achieve a task, their subjective experience will be less stressful when compared to an individual that has a lower confidence level, regardless of the workload intensity (Selye, 1984). This can result in variability between participants, despite each participant being exposed to the same conditions.
The availability of the data streams from the Apple Watch Series 6 and FitBit Sense presents another limitation: the Apple Watch Series 6 is unable to provide extractable continuous HR data and the Fitbit Sense is unable to provide extractable ECG data. Due to these restrictions, we cannot directly compare the two devices in the testing environment. Overall, this may impact the extent to which these results are generalizable to the capabilities of these devices.
The ECG data in this study was collected immediately following the completion of each trial to capture stress responses elicited by the tasks of the MATB-II evaluation. We must consider the limitation that the smartwatches are unable to passively record ECGs while the participant is actively taking the examination. To take an ECG with the technology used, the participant had to stop, place their index finger on the smartwatch sensors, and remain still for 30 seconds. Heart rates can decrease up to 22 beats bmp in 60 seconds of recovery, so by the time the ECG recording has concluded, the participant may not have been at their peak stress level (Shetler et al., 2001). This may also potentially explain why there were no significant differences in HR and HRV between the low workload and high workload conditions.
Finally, ECG data is affected by user movement during the recording process, as the devices are unintrusive and rely on tactile contact to generate a recording. There is a significant correlation between HRV measurement error and user movement, so any random movement or brief lack of contact with the smartwatch sensors could contribute to erroneous data (Maritsch et al., 2019).
It is critical for future work to be informed of potential sources of error in the data production and collection processes with commercially available smartwatch technology. Additionally, we recommend that future research gathers data from both subjective and objective sources to holistically approach measuring stress and potentially offset variations in data observed in this study. This will ideally develop a better understanding of the capabilities and generalizability of the extractable health metrics in these devices as technology continues to improve.