
Abstract
Adaptive displays have long been touted as a means of improving the usability of different types of interfaces. However, purely eye tracking-based adaptive displays have not yet lived up to the initial promise. In many cases, adaptive displays are tailored to users with special needs, developed to supplement virtual reality, or combine eye tracking with other physiological measures. This mapping review focuses instead on recent adaptive displays that rely solely on eye tracking input to understand a user’s needs while interacting with a regular computer display. We aimed to answer three main research questions related to 1) the application domains of such adaptive displays, 2) the eye tracking metrics that have been adopted to track attention allocation in real time, and 3) the adaptation triggering mechanisms. We provide a summary of the current state of eye tracking-based adaptive displays, identify gaps in the literature, and suggest topics for future work.
Introduction
In the past decades, the world has witnessed a rapid increase in the amount of digital data available (McAfee & Brynjolfsson, 2012). However, the availability of this data has not always translated into an abundance of useful information for users of digital displays. The issue is that our cognitive abilities are not always able to identify what is important and what is not in a given display or stream of work, especially not when under high cognitive workload (Hockey, 1997). Whether it is the amount of data we are presented with in social media (Lee, Son, & Kim, 2016) or the data that a process control operator has to contend with (Noah & Rothrock, 2017), it is not always possible to parse the important from the unimportant. In particular, in complex, safety-critical, and data-rich domains, such as aviation, medicine, or process control, not being able to quickly and effectively identify important information could lead to breakdowns in the safety and efficiency of the system (Shanker & Richtel, 2011).
One approach that has long been touted as a solution to the aforementioned problems in different domains is the use of adaptive displays (Hameed & Sarter, 2009; Patrick, James, & Ahmed, 2006). An adaptive display is defined as one where the design of the display changes in real time to suit the needs of the person (Keeble & Macredie, 2000). Adaptive displays consist of systems that collect real-time data through any number of sensors or performance monitoring and then adjust the display to better suit the user’s needs. Such displays are considered a type of intelligent display that will make systems safer and more efficient (Rey, Montesa, Alcañiz, Baños, & Botella, 2005). This is in contrast to displays that always function the same way no matter the circumstances or user, and adaptable displays that require user input to update the display. While adaptable displays may then be able to be adjusted to the situation or user, the added user workload may be costly.
Many simple forms of adaptive displays exist in everyday systems that we use (e.g., Na & Suk, 2015); a simple example would be the spellcheck that adjusts words being typed without any input or effort from the user. However, the key to taking adaptive displays to the next level is to be able to correctly identify and classify different types of user states in real time. Otherwise, the adaptive display runs the risk of leading to more frustration and problems than it solves. The sensors used to detect user state are then of primary importance in an adaptive display, and these have included eye blinks and EEG (Na & Suk, 2015). Eye tracking – or tracing where people are looking on a display – can also be used as an input to adaptive displays (Duchowski, 2007). The building blocks of eye tracking data in human factors research are fixations and saccades. Fixations are spatially stable gazepoints during which visual processing occurs (Findlay, 2004). Saccades are the rapid eye movements in between successive fixations, during which time visual processing is suppressed. The sequence of fixations and saccades is known as the scanpath. A dwell, also known as a gaze, refers to a cluster of fixations within a certain region or area of interest (AOI) that ends with the first fixation outside of that AOI (Poole & Ball, 2006).
Eye tracking provides a crucial advantage over other types of sensors in that it can be non-invasive, meaning that nothing needs to be attached to the user. However, it is not yet clear how best to leverage the benefits of eye tracking for the purpose of adaptive displays, and to what extent it is possible to have an adaptive display based on eye tracking alone. In particular, it is not clear whether the use of eye tracking has the capacity to become as ubiquitous as a mouse and keyboard for regular users, or whether it will always be a tool that has potential but that is best used in research labs or highly-advanced environments, if at all. The goal of this literature review is to provide an overview of the current state of eye tracking-based adaptive displays, analyze the eye tracking metrics and triggering mechanisms that have been used most successfully, and to pinpoint the gaps that require more research. The focus is on eye tracking for display adjustments for regular users, not as a means of assessing workload (e.g., Wu et al., 2019) or supporting virtual/augmented reality (e.g., Pfeuffer et al., 2021). This review will then provide an assessment of where we stand in terms of exclusively eye tracking-based adaptive displays and how best to proceed for the future.
Methods
We conducted a mapping review or systematic map of the literature from 2015 to 2022 (Grant & Booth, 2009). In other words, this review was systematic and comprehensive but within a selected period of time. The starting cutoff year was arbitrarily selected to focus on some of the most recent work and provide recommendations for future research. This review targeted the following research questions (RQ):
RQ1: How have eye tracking-based adaptive displays been used in recent years?
RQ2: What eye tracking metrics have been used?
RQ3: How has the adaptation been triggered?
Keywords and Selection Criteria
Our search keyword (KW) sets consisted of the following:
KW1: adaptive, interactive, “attentive user”
KW2: display, interface, intervention
KW3: “eye tracking”, “eye tracker”, “gaze tracking”, gaze, “gaze-driven”
Each search string was of the structure KW1 AND KW2 AND KW3, with all combinations from within each set used. Google Scholar was used as the search engine into which all of the combinations of search keywords were entered. The resulting studies were then subjected to the following five search criteria. To be considered in the review, studies should:
Be published in 2015 or later in journals or peer-reviewed conference proceedings.
Use only eye tracking metrics as an input to an adaptive display, meaning that the display changes based on the eye tracking metrics and not any other physiological measure and without any deliberate input from the user’s side (i.e., it is not related to text-entry or eye-based control). Performance data combined with eye tracking data was acceptable.
Be targeted to generic users, not users with any motor, physical, or visual attention difficulties.
Consist of a formal experiment where some form of quantitative or qualitative performance or subjective data is collected to test the adaptive display (i.e., it cannot be only the description of an idea).
Evaluate users’ interaction with the display, rather than assessing a construct like workload.
Does not involve virtual or augmented reality, and rather is related to a person’s interaction with an actual monitor.
A total of eight papers were first obtained using the keyword search and selection criteria. Snowballing was then adopted using those eight papers. Snowballing refers to checking the references of each paper (backward snowballing), as well as the papers that have cited each one (forward snowballing; Wohlin, 2014). The same search criteria were then applied to the papers that resulted from backward and forward snowballing. The final count was a total of 18 papers (5 from journals, and 13 from conference proceedings). Figure 1 shows the breakdown of papers by year.
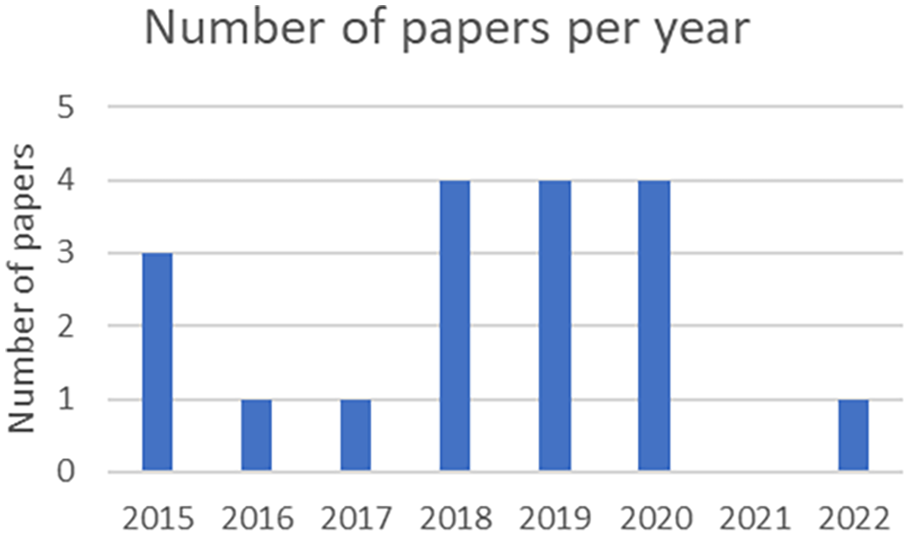
Number of papers broken down by year.
Results
RQ1: How are eye tracking-based adaptive displays used?
Eye tracking-based adaptive displays have been used in different domains, but the most prominent one in our review was reading applications (broadly defined as the use of any display with text, graphs, and data; 7 papers), followed by maps and aerial images (4 papers) and gaming applications (4 papers as well). The other domains that were represented, with one paper each, were learning (specifically, massive open online courses, or MOOCs), watching videos, and medicine (specifically, dentistry). The vast majority of papers used desktop-mounted eye trackers (13 papers), whereas one used a head-mounted eye tracker. The other papers did not specify the type of eye tracker. The most commonly used eye tracker sampling frequency was 60 Hz (7 papers), with other reported frequencies being 300 Hz (2 papers), and one each reporting 30, 90, and 120 Hz. In general, eye tracking has been used to three broad and non-mutually exclusive ends: 1) to highlight information that is currently on the screen, 2) to update or alter the display in some form, or 3) to record the location of gaze.
1) Highlight information
one of the most important uses of eye tracking-based adaptive displays is to highlight what is believed to be the most important information in the display. This category includes adaptive displays where nothing new is added or changed in the display except to reorient the user’s attention to where they should be looking at. For example, in one case red rectangles highlighted the important information while users watched videos as part of a MOOC (Sharma, Alavi, Jermann, & Dillenbourg, 2016). The adjustment was found to have a positive effect on the attention of users and helped them focus on the relevant parts of a lecture. In another case, a yellow ring was placed over an anomaly in a panoramic dental radiograph, although the highlighting did not lead to significantly better detection of anomalies (Castner, Geßler, Geisler, Hüttig, & Kasneci, 2020). In the case of Lallé, Toker, & Conati (2019), the bars of bar graphs were highlighted in black, which helped with the comprehension of magazine-style narrative visualizations. The effect was only evident for low-literacy users, although participants overall found the highlighting to be useful and not disruptive.
2) Update the display
In contrast, updating the display involves some change to the display or interaction that goes beyond highlighting a part of the display. Our review revealed that this type of eye tracking-based adaptive display could take one of four forms.
The first and most common case is the addition of new information that can help the user in their task. In the context of gaming applications, this could be an in-game non-playing character changing their behavior (Lankes, 2020; Vidal, Bismuth, Bulling, & Gellerson, 2015) or new objects being created within the game (Lankes, 2020). In other cases, numbers are added to show users how much they have looked at certain graphs in the context of information dashboards (Toreini, Langner, Maedche, Morana, & Vogel, 2022). In some instances, updating the display is combined with highlighting. In Tateosian, Glatz, Shukunobe, and Chopra’s (2017) work on geographic information systems, users who read about a place could receive additional information in the form of a marker on a map, local imagery in the browser, and highlighting the name of the place in question.
A second type of adaptive display in this category involves bringing items closer to the point of gaze, in many cases together with other changes to the display. For example, a proxy to a map legend can be placed close to the gaze point, and then when the users look at this proxy, the full legend appears on the map (Gobel, Kiefer, Giannopoulos, Duchowski, & Raubal 2018). In addition, the symbols that participants had been looking at are the ones that show up in the legend. There are applications in reading, with translations for a paragraph placed where the participant is looking (Ho, Wang, & Lai, 2018), and data entry, with the target image that is needed for a task brought closer if users are not looking at it (Kim, Billinghurst, Lee, & Huang, 2020). The location of gaze can also be used to place captions closer to the gaze point when watching a video (Kurzhals, Göbel, Angerbauer, Sedlmair, & Raubal, 2020). This intervention led to lower time to first fixation on the captions and led to gaze patterns that are more similar to natural viewing.
A third type of adaptive display involves fully rendering and/or coloring the display only at the point of gaze, an approach that was seen in applications such as maps and aerial images (Bektas Coltekin, Kruger, & Duchowski, 2015; Bektaş, Çoltekin, Kruger, Duchowski, & Fabrikant, 2019), as well as gaming (Lankes, Haslinger, & Wolff, 2019). In the latter case, a vignette was placed around the target and the rest of the display was made black.
Finally, a fourth type of application in this category involves updating the settings of the interface, such as the difficulty level as part of a Tetris game (Spiel, Bertel, & Kayali, 2019).
3) Record the location of gaze
Another broad type of eye tracking-based adaptive display depicts the location of the last fixation, most frequently for the purpose of interruption management. Often, this is done together with updating or highlighting information on the display. For example, a red circle indicated the location of the last fixation before an interruption as part of a reading and comprehension task (Jo, Kim, & Seo, 2015). The sentence or paragraph in question was also highlighted as part of this intervention. However, while the adaptation helped users resume reading, it did not help improve comprehension performance. In a similar reading application, the last fixation was depicted and annotation for difficult words were placed at the point of gaze (Cheng, Fan, & Dey, 2018). This approach of highlighting the last fixation was also used in the context of information dashboards, together with highlighting the last AOI that was looked at (Toreini, Langner, & Maedche, 2018), although the sample size of four participants makes it difficult to draw firm conclusions.
RQ2: What eye tracking metrics have been used?
By far the most used metric was simply the location of gaze, where researchers used the x and y positions of fixations or gazepoints, and not any higher order metrics, to trigger adaptations (Bektaş et al., 2015, 2019; Gobel et al., 2018; Ho et al., 2018; Jo et al., 2015; Kim et al., 2020; Kurzhals et al., 2020; Lankes et al., 2019, 2020; Sharma et al., 2016; Tateosian et al., 2017; Vidal et al., 2015). The total dwell time in an AOI has also been used to good extent (Cheng et al., 2018; Kim et al., 2020; Toreini et al., 2022). Other types of metrics have been used more sparingly. Lallé et al. (2019) used the number of fixations on an AOI rather than the dwell time. Cheng et al. (2018) and Spiel et al. (2019) used the transitions between AOI, which is the rate at which a user switches between fixating one AOI and another. A larger number of transitions is assumed to indicate more user uncertainty. Finally, the gaze angle, or the angle between the previous and current gaze point on one hand and the previous gaze point and the target AOI on the other, was also used by Castner et al. (2020). An angle less than 10 degrees would indicate movement towards the target.
For most of these metrics, there was no window of time reported during which time the metrics were calculated. Instead, it was considered that the point of gaze, for example, was calculated in near real time (e.g., Bektas et al., 2015; Kurzhals et al., 2020; Tateosian et al., 2017). In one case, a window of time was considered: a one-minute window was used to calculate the number of fixations to an AOI (Sharma et al., 2016).
RQ3: How has the adaptation been triggered?
Across our review, we found that the adaptations were triggered either in real time, based on the location of gaze, or based on some threshold. The former accounts for most cases, with studies using the location of fixations or gaze points within a certain AOI to trigger an adaptation (Bektas et al., 2015, 2019; Gobel et al., 2018; Ho et al., 2018; Jo et al., 2015; Kurzhals et al., 2020; Lankes, 2020; Lankes et al., 2019; Tateosian et al., 2017; Vidal et al., 2015). Alternatively, an appropriate threshold can be selected for some metric. For example, a threshold for dwell time can be considered, and when the time goes above the threshold, the adaptation is triggered. In one case, 600 ms was considered as the threshold by Kim et al. (2020). Another threshold that has been reported was 8 seconds (Toreini et al., 2018). In one case, the exact threshold dwell time was not reported (Cheng et al., 2018).
The number of fixations has also been compared to a selected threshold; this has typically been determined using a combination of previous studies and further pilot studies that have established the average or expected number of fixations on an AOI or target. Lallé et al. (2019) triggered the adaptation when the number of fixations was above 40% of the average number expected on a sentence. In another similar case, in the context of learning in MOOCS, a score was given for each gaze point based on whether participants were looking right where they should (maximum score of 255) or not at all (score of 0; Sharma et al., 2016). The adaptation was then triggered if the score was below the threshold calculated from previous participants whose performance was between the 33rd and 66th percentiles. In some cases, it was not clear exactly how the adaptation was triggered (Castner et al., 2020; Spiel et al., 2019; Toreini et al., 2022).
Discussion
The goal of this review was to determine whether one of the crucial advantages of eye tracking – the ability to collect data in real time – has been fully leveraged for adaptive displays that can potentially help everyday users. There were some limitations in terms of the scope, review cutoff date, and keywords used, with computer science and computer engineering applications potentially not all using the exact words to depict the same idea. However, we have deliberately taken a human factors-centric viewpoint in order to see the current state of affairs from this perspective. Here we provide some questions that still need to be answered when it comes to eye tracking-based adaptive displays, in the hopes that these will trigger further research on the topic and advance the literature. While eye tracking provides several benefits to human factors research, the real-world applications have yet to deliver on the promise of several decades of research.
What can eye tracking-based adaptive displays provide?
This review revealed that eye tracking-based adaptive displays have been relatively more prominent in certain domains (namely, as support for reading, maps, and gaming). The applications were largely successful, with many studies citing improved performance through adaptation and increased satisfaction of users. The majority of the adaptive displays created did not use a very large eye tracker sampling rate (mainly 60 Hz). While that is promising in terms of what can be done with eye trackers, it also provides more questions about the ceiling of eye tracking-based adaptive displays and whether we have not yet come close to exploring all that might be done.
At the same time, it may be that we have reached that ceiling and without data from other sensors/tools (e.g., face recognition, EEG, heart rate, etc.), eye tracking-based adaptive displays are very limited. Is it possible to envision everyday eye tracking-based adaptive displays outside of virtual reality, gaze-based input, or supporting users with special needs? Across a span of seven years, there were less than 20 papers on the subject and in many cases the studies did not provide enough detail or thorough testing to be able to judge the applications. It would be interesting to see more use of eye tracking-based adaptive displays for interruption management, for example. There is also no clear use of different sensory channels or modalities, which could make use of Multiple Resource Theory (Wickens, 2008) to provide additional data to users. In other words, it could be that some auditory notification or information could be triggered instead of any additional visual information. The education domain is another area that could benefit from more adaptive displays that support online learning, potentially together with interruption management. Other specific applications that were not evident in our review but that could benefit from further research include display clutter management, detection of distraction or mind-wandering, and vigilance decrement detection.
What are the best metrics to use?
The review revealed that most adaptive displays rely on one or two metrics, with most relying simply on the location of gaze. Would more metrics be able to reveal more about a person’s attention or would they not be useful in the context of an adaptive display? Is there a limitation on processing power that would create a lag and prevent the adaptation from being triggered quickly enough? This could be a problem for higher-order eye tracking metrics (Sharafi et al., 2020), where these might not be calculated quickly enough to be of use. Other metrics may be redundant and highly correlated, or may require too many fixations to be calculated sufficiently quickly to be useful.
To further explore this last issue, a moving window of time may be needed during which time the metrics are calculated. The exact duration of this window will likely depend on the context and the task, with more high-level or complex metrics requiring longer windows. But what combination of metrics works best for different tasks or contexts? Would a window of one minute as suggested by Sharma et al. (2016) be useful in other contexts? The focus would have to be on finding ways to shorten the window as much as possible for different tasks.
How should the adaptation be triggered?
The review revealed that none of the adaptive displays in recent years have relied on prediction algorithms such as regression. Instead, either the location of gaze alone or a threshold on dwell time or fixation number has been used. Could there be any merit in using more advanced machine learning models? This would go together with using additional eye tracking metrics, in which case these would form the input to any algorithm that then triggers the adaptation. Would this provide any added value? One thing to consider is the added time for this calculation to be done, which would need to be factored into the moving window. Moacdieh and Sarter (2017) used logistic regression models to predict when users are affected by clutter using three eye tracking metrics but did not close the loop and create any display adaptations. Could it be that the same result could have been obtained using a simpler threshold approach? This is something that would need to be explored further.
Conclusion
In summary, the practical takeaways from this review can be summarized as follows. First, adaptive displays based on one metric and a simple threshold algorithm are possible and have been tried and tested in different domains. Second, there is a need to further explore a number of different aspects of adaptive displays, namely, what metrics can be calculated quickly enough to be useful, what combinations of metrics can reveal the most about a person’s attentional state, what the ideal window of time (if any) should be for calculating the metrics, and what type of algorithm (if any) should be used to trigger the adaptations. Finally, there is great scope for further applications of eye tracking-based adaptive displays, particularly for interruption management, in online learning environments, and for detecting distraction and vigilance decrements.