
Abstract
Fatigue may influence risk perception for subsequent physical activities. Participants volunteered to fill out a questionnaire, rating the perception of risk of cycleway pictures either before or after running a half or a full marathon race. The after race running group also reported workload, flow state, and stress state measures. We found the runners who responded after the race rated the cycleways as riskier than those who responded before the race. This effect was partially moderated by the length of the race run; runners who ran a full marathon were more likely to rate the cycleways as personally risky. The full marathon runners also reported more physical and mental fatigue than the half-marathon runners, but interestingly, they rated the race as less mentally and physically demanding. Fatigue may impact the perception of physical risks.
The interaction between fatigue – both cognitive and physical – and subsequent physical task performance has been extensively studied (Dambroz et al., 2022; Davidow et al., 2020; Head et al., 2016; Kempton et al., 2013; Knapick et al., 1991; Marcora et al., 2009; Smith et al., 2015). As early as 1891, Mosso (1904) wrote about fatigue affecting his later physical performance. While nuanced findings have been reported, generally fatigue, if anything, detrimentally impacts subsequent physical activities and performance. In applied settings, the negative impacts of fatigue on performance have been noted as a severe operational risk, and in some industries, such as construction work, operator fatigue has been claimed to be the most severe risk to ongoing operations (Chan, 2011).
The physiological mechanisms of how fatigue impacts subsequent physical performance is an area of active research, however, central regulator theories have been proposed as at least a partial explanation (Noakes, 2012). Activity in the cerebral cortex may influence physical fatigue perceptions and impact subsequent physical performance. The decrease in not just muscular output but also technical skill indicates fatigue impairs the coordination of movements. As fatigue sets in, top-down commands from the motor cortex to the peripheral muscles require additional neural control to maintain performance (Liu et al., 2010; Mehta & Parasuraman, 2013; Noakes, 2012). Fatigue may induce a conservative mode in which the central nervous systems reduces overall processing in order to preserve resources (see Wickens et al., 2021). Regardless of mechanism, there is growing consensus that muscular fatigue is at least partially due to changes in the central nervous system (Mehta & Parasuraman, 2013).
The detrimental impacts of fatigue on subsequent physical performance may also impact the willingness of an individual to engage in physical activities, in particular, physically risky activities. Risk assessment, or perception of risks, may affect the willingness to engage in physical activity. As one’s ability to perform physically decreases, it makes sense to adopt a conservative approach to physical risks, for example, “I’m tired and might not make that jump” as opposed to “if I jump that gap I will make it.” Our perception of physical risks should keep us safe when our physical and cognitive resources are depleted.
Risk perception is not fully understood, and encompasses multi-dimensional factors (Kahneman & Lovallo, 1993; Sjoberg, 2000; Slovic et al., 2005; Tversky & Kahneman, 2016). Indeed, there is some evidence in some settings, such as driving, that fatigue may paradoxically increase risky behaviors (Paterson et al., 2016). However, in these studies fatigue is not actively induced, but instead is related to sleepiness and passivity, which may be different than fatigue induced by prolonged work (Saxby et al., 2013).
Work or actively induced fatigue may impact physical risk perceptions in a manner similar to how detrimental subjective states impact affordance perceptions (Jones, 2003). Affordances, or the perceived action potentials of objects and environments, are sometimes impacted by states such as anxiety, fatigue and fear (Geuss et al., 2016; Jiang & Mark, 1994; Piipers et al., 2006; Proffitt et al., 1995; Stefanucci & Proffitt, 2009). Researchers have argued these altered perceptions would be adaptive by preventing individuals from taking unnecessary action risks, hence, decrease the prevalence of injuries or worse. Similarly, fatigue may alter risk perception for physical risks. Indeed, the mechanism may be via altered perception of affordances (e.g., the environment looks more hazardous) or direct assessments of the hazards of situations and environments.
In the present study, we invited participants to rate pictures of cycleways for the risk they pose to themselves as a potential bicycle rider before or after participating in either a half or full marathon running race. We employed this naturalistic approach to studying fatigue, as duplicating the fatigue induced by running either a half or full marathon in the laboratory would be extraordinarily challenging. Running long distances, however, would have been a common occurrence in human evolutionary history (Bramble & Lieberman, 2004; Lieberman & Bramble, 2007) We expected the participants rating the pictures before running the race to rate the pictures as less risky than the participants rating the pictures after running the race. We also expected this effect may be mitigated by whether the runners ran a half marathon versus a full marathon due to the increased fatigue, both mental and physical, of running a full marathon.
Method
Participants
One hundred and forty-four (87 men and 57 women) endurance runners partaking in the Queenstown, New Zealand half or full marathon participated. Fifty-two responded before the half marathon, 53 after the half marathon, 27 before the full marathon and 12 after the full marathon. Their ages ranged from 20 to 58 years (M = 32.85 years, SD = 8.2). Participation was voluntary.
Materials
Risk perception pictures
Eleven photos of cycleways or cycleway intersections, both trail and road, were used to assess how risky participants thought riding would be. The cycle ways differed in illumination (day or night), their degree of traffic congestion, and steepness (see Figure 1 for examples).

Example of some of the pictures of cycleways utilized in the study (the images have been grey scaled for publication).
Risk perception questions
Participants were presented with 11 pictures of cycle ways as described above. Andrews and Gatersleben (2010) developed questions to measure danger, fear, and preference for natural environments:
How likely do you think it is that you could come to harm cycling through this environment?
How severe are the dangers you could potentially face cycling through this environment?
How well do you think you could control any potential dangers while cycling in this environment?
Participants were asked to rate each of the pictures for the three questions on a scale from 1 (not at all) to 7 (very much so). The first question frames the risk in terms of personal harm likelihood, the second frames the risk in terms of extrinsic dangers faced, and the third reflects feelings of self-efficacy in handling any dangers.
The post marathon questionnaire also included the Short Flow State Survey (S-FSS; Jackson et al., 2008), a modified version of the NASA-TLX (Helton et al., 2022), and the Short Task Relevant Evaluation of Stress State (STRESS; Blakely et al., 2016). The S-FSS consists of nine items assessing flow states (task absorption; see Csikszentmihalyi, 1990) and each item is assessed on a 1 to 5 response scale, where 1 indicates less flow and 5 more flow. The NASA-TLX consists of six items assessing workload, however, we were only interested in the Mental Demand and Physical Demand items. STRESS consists of eleven items assessing subjective state responses to tasks, however, we were only interested in the Mental Fatigue and Physical Fatigue items. Both the NASA-TLX and STRESS measure utilize a 0 to 100 response scale.
Procedure
Participants were recruited at the start line and surrounding areas of the full and half Queenstown marathon. Participants recruited before the marathon were given questionnaires asking them to rate how risky they perceived pictures of cycleways. Participants recruited after the marathon were given questionnaires asking them to rate the riskiness of the same cycleway pictures, as well as complete the S-FSS, modified NASA-TLX, and STRESS. The before and after race participants were different runners; this was not a within-participants design.
Results
Risk Perception
All participants responded to the three risk perception questions for each of the 11 pictures. From this, an average score was calculated for each question per person (we were not interested in differences in the pictures). In this and all subsequent analyses we did examine the impact self-reported gender may have on the results, but since our interest was not the role of gender on these processes, we decided not to report them unless it substantively altered the results of the effects of time, before vs. after the race, or the event length, half marathon vs. full marathon, on the examined metrics. In no case did gender substantially alter the main findings.
A 2 time (before vs. after) by 2 event (half marathon vs. full marathon) ANOVA was used to compare the responses for each question. For Question 1 (How likely do you think it is that you could come to harm cycling through this environment?), there was a significant main effect for time, F(1,140) = 10.84, p = .001, ω2 = .061, but no significant main effect for event F(1,140) = .03, p = .86. There was, however, a significant interaction between time and event, F(1,140) = 9.59, p = .002, ω2 = .053.
For Question 2 (How severe are the dangers you could potentially face cycling through this environment?), there was a significant main effect for time F(1,140) = 6.27, p < .001, ω2 = .133, but neither a significant main effect for event, F(1,140) = 1.24, p = .267, nor a significant interaction, F(1,140) = .44 p = .205.
For Question 3 (How well do you think you could control any potential dangers while cycling in this environment?), the main effect for time was nonsignificant, F(1,140) = 1.14, p = .287, but both the main effect for event, F(1,140) = 10.53, p = .001, ω2 = .057, and the interaction of time and event F(1,140) = 13.32, p < .001, ω2 = .074, were statistically significant. The mean before race and after race responses for the three risk questions for both the half and full marathon are displayed in Figure 2. We performed Bonferroni corrected contrasts for each question for the half and full marathons comparing the before and after race responses. These significant contrasts are noted with an asterisk in Figure 2.
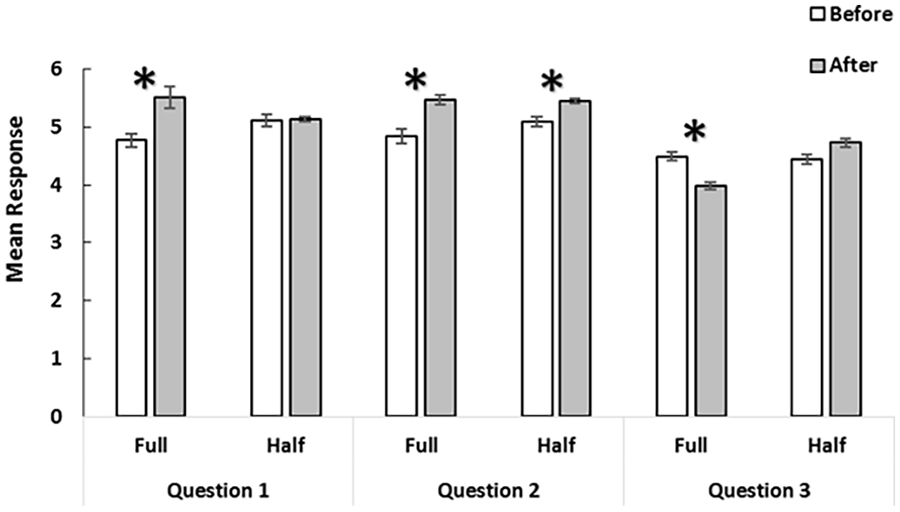
Mean before race and after race responses for the three risk questions for both the half and full marathon (error bars are standard errors of the mean and Bonferroni corrected significant contrasts are noted with an asterisk).
Subjective State Reports
For the S-FSS we averaged for each respondent their 9 items; these were on a 1-5 scale. The Cronbach’s α for this scale in this case was .764. The full marathon runners (M = 4.74, SD = .19) reported significantly more flow than half marathon runners (M = 4.20, SD = .33), t(63) = 5.43, p < .001, d = 1.736.
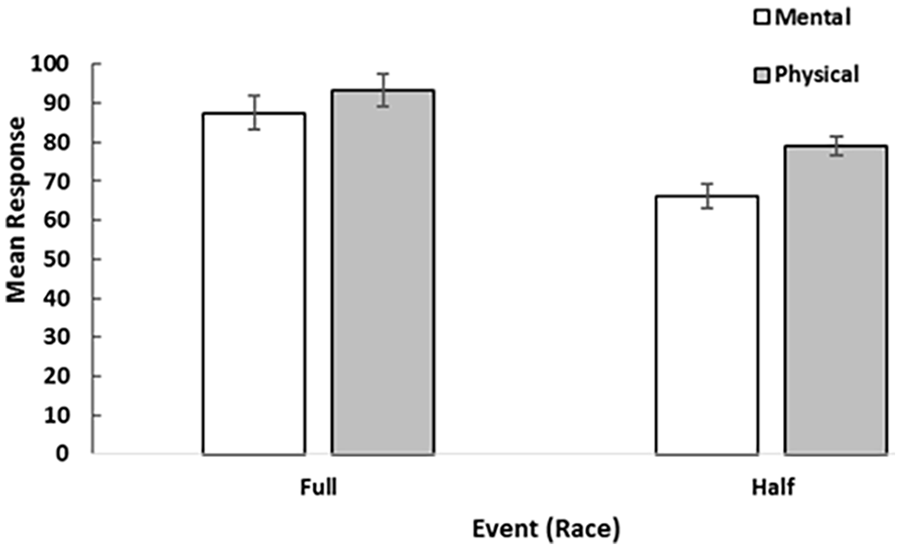
For the NASA-TLX we were only interested in the Mental Demand and Physical Demand scales; these were both reported on a 0-100 scale. We analyzed these responses utilizing a 2 dimension (mental vs. physical) by 2 event (half vs. full marathon) mixed ANOVA. There was a significant main effect for dimension, F(1,63) = 82.10, p < .001, ω2 = .337, and a significant main effect for event, F(1,63) = 21.77, p < .001, ω2 = .242. However, the interaction between the two was nonsignificant, F(1,63) = 2.10, p = .153. The mean responses for mental and physical fatigue for both the half and full marathon are displayed in Figure 3.

Mean NASA-TLX responses for mental and physical demand for both the half and full marathon (error bars are standard errors of the mean).
For the STRESS scale we were only interested in the Mental Fatigue and Physical Fatigue items; these were reported on a 0-100 scale. We analyzed these responses utilizing a 2 dimension (mental vs. physical) by 2 event (half vs. full marathon) mixed ANOVA. There was a significant main effect for dimension, F(1,63) = 6.62, p = .012, ω2 = .028, and a significant main effect for event, F(1,63) = 11.97, p < .001, ω2 = .144. However, the interaction between the two was nonsignificant, F(1,63) = .93, p = .338. The mean responses for mental and physical fatigue for both the half and full marathon are displayed in Figure 4.
Mean responses for mental and physical fatigue for both the half and full marathon (error bars are standard errors of the mean).
Discussion
Generally, participants who responded after completing the race compared to those who responded before the race rated the cycleways as more risky. This effect, however, was partially moderated by race distance. For example, Question 1, which framed the risk in terms of personal harm risk, was only significantly different before and after the race for the full marathon, not the half marathon. Interestingly, participants who responded before versus after both race lengths significantly differed for Question 2, which more objectively framed the risks as the dangers the rider would face. Those who responded after the race rated the pictures as presenting environments more dangerous for cycling than those who responded before the race. For Question 3, which asked participants to rate their ability to handle those dangers or risks, the before versus after race difference when corrected for multiple comparisons was only significant for the full marathon. In this case, participants who responded after the full marathon rated themselves less likely to handle the risks presented in the images than participants who responded before the full marathon. The finding that Question 2, which frames the risks more objectively, demonstrates the clearest before and after difference regardless of race length and overall was the largest effect size (ω2) in regard to the risk questions, is intriguing. This may because it requires the least self-reflection or cognitive mediation and is instead more similar to direct affordance perception (Jones, 2003; Scarantino, 2003; Stoffregen, 2000).
The partial moderation of event length on risk responses may have been due to differences in overall fatigue between the two events. Indeed, while both race lengths appeared to induce more physical than mental fatigue, the full marathon was rated as more fatiguing for both dimensions than the half marathon. Overall, both tasks were on the higher end of the scale for both dimensions of fatigue, mental and physical, reflecting the significant impact of either run length on feelings of exhaustion. Even a half marathon (~21km) is a long distance to run.
Intriguingly, the full marathon runners rated the run as less mentally and physically demanding after the race than the half marathon runners, even though they reported more mental and physical fatigue. There are a number of possible explanations. One possibility is the full marathon runners (a smaller sample) were better runners. This may have altered their ratings of the demands of the run relative to the half marathon runners. Another possibility is the full marathon runners reported higher levels of flow, or being absorbed by the task, than the half marathon runners (both though were high in self-reported flow state). Greater absorption or focus on the task may have limited the full marathon runners’ awareness of the demands. In other words, they perhaps did not notice the demands as much as they were more absorbed in doing the actual task – running. There may be other possibilities as well, including idiosyncrasies between the samples. Regardless, this does not impact the main findings regarding risk perception differences, as the primary impact on risk perception was hypothesized to be via fatigue, not perceived demand.
There is an extensive body of literature indicating fatigue may detrimentally impact subsequent physical activity and performance (Dambroz et al., 2022; Davidow et al., 2020; Head et al., 2016; Kempton et al., 2013; Knapick et al., 1991; Marcora et al., 2009). If physical risk perception is a cognitive mechanism to reduce potential self-harm (“this is risky, I may get hurt, so do not do it”) and fatigue is detrimental to physical skill, then one plausible mechanism to reduce harm likelihood would be for risk perception of physical activities to be influenced by fatigue states. This mirrors research demonstrating affordance perceptions are influenced by states that may detrimentally impact the ability of the individual to act on the affordance (Geuss et al., 2016; Jiang & Mark, 1994; Piipers et al., 2006; Proffitt et al., 1995; Stefanucci & Proffitt, 2009). The exact mechanisms should be investigated in greater detail in future research, but the practical implications may mean people will avoid certain physical actions when fatigued.
A practical example is the encouragement of people to commute by bicycle to and from work. While this form of transportation has benefits both for the physical fitness of the rider and greenhouse gas emissions (Maizlish et al., 2013), commuters may be hesitant to ride home after a full day of work, whether their work is mentally or physically fatiguing. Indeed, perceived physical risks of cycle commuting is one of the barriers reported by potential bicycle commuters (Woo et al., 2010). Alternative means for the return commute trip, such as bike friendly mass transportation, or modifications of the cycleway itself to reduce the perception of risks, may be necessary to encourage wider uptake. The impact fatigue has on physical risk perceptions should be explored further in both laboratory and operational studies.