



Abstract
Health insurance enrollment decisions are not only medical decisions but also involve other factors such as employment and financial status. Decision aids such as Virtual Benefits Counselors (VBC) and Human Resources (HR) traditional websites may help users make informed decisions. Little research has explicitly focused on how users navigate and search for information using these aids. We propose the use of the Social Network Analysis (SNA) method to characterize navigation and information search behavior. SNA was applied to the navigation data of 16 participants who were asked to make mock health insurance enrollment decisions using a VBC or HR website. VBC users searched for financial information with less back-and-forth navigation and explored a larger percentage of the system, whereas HR website users had more back-and-forth navigation between the same pages but explored fewer available pages. In conclusion, SNA provided insights into differences between how users interact with different decision aids and what contents they were looking for which may prove useful in understanding users’ interaction strategies.
Keywords
Introduction
Enrolling in health insurance plans is a difficult task because of the complexity of the healthcare system (Colón-Morales et al., 2021; Fox & Kongstvedt, 2013) and the lack of health insurance knowledge (Giang et al., 2021). Enrollment decisions depend on factors such as pre-existing health conditions, income level, employment status, and plan characteristics such as premiums or co-pays (Fox & Kongstvedt, 2013; Giang et al., 2021). For the 91.7% of Americans who have health insurance (Keisler-Starkey & Bunch, 2022), enrollment decisions occur at least once a year to either keep their current plan or change to another plan. Of that, 54.3% are employer-insured (Keisler-Starkey & Bunch, 2022), and research has shown that these individuals often seek information from multiple sources, such as friends and family and digital tools to aid in the decision-making process (Colón-Morales et al., 2021). Digital tools particularly are a preferred source of information (Colón-Morales et al., 2021) and have benefits such as providing information directly from the health insurance provider or employer and is scalable to a large audience.
A variety of new digital tools have been used to provide information for employer-provided plans. Traditional Human Resources (HR) websites provide information through a series of pages with links to external resources. Virtual Benefits Counselors (VBC) are a newer type of decision aid that mimics one-on-one conversations with a human resources agent. These tools have different structures, designs, and functionality that may lead to different usage of each system. For example, VBC systems, such as Jellyvision’s ALEX tool (www.jellyvision.com), guide the user through the enrollment decision through a series of questions, with a friendly voiced interface, to offer an engaging user experience, and provides healthcare usage estimations (Figure 1). In contrast, HR websites (Figure 2) are self-guided but can provide a larger variety of information about benefits (e.g., eligibility and costs, instructions about enrollment). HR websites also provide direct links to health insurance providers with detailed and updated information about plan options (e.g., premiums and deductibles, procedures covered, instructions on how to use the health insurance).

Screenshot of Jellyvision’s ALEX VBC System.

Screenshot of HR Website System.
Our previous work has shown that users differ in their ratings of the usability of these systems, and their ratings differed based on their health insurance knowledge and literacy scores (Giang et al., 2021). Due to the wide range of personal needs and the multitude of factors related to enrollment decisions, individuals may also rely on a variety of interaction strategies when engaging with health insurance decision aid systems (Giang et al., 2021; Schram & Sonnemans, 2011). We define system interaction strategies as deliberate methods used to interact with a system including navigation, information search, and exploration, to achieve specific user goals. We define user goals as the intentions and the expected outcomes that the user has when using health insurance decision aids, such as finding the most affordable plan, the plan with best coverage, or plan that has their specific insurance needs.
While previous studies have examined decision factors and goals related to health insurance enrollment decisions (Giang et al., 2021; Schram & Sonnemans, 2011; Politi et al., 2016), none have explicitly examined how users navigate and search for information with a health insurance decision aid. Several quantitative and qualitative methods are available to study users’ navigation and what information they are looking for such as clickstream analysis, graphs-based methods, eye tracking, cognitive walkthroughs, and retrospective interviews. In particular, graph-based methods have been commonly used to study navigation behavior across a website. For example, Wang & Lee (2011) investigated web navigation patterns to develop a path graph traverse algorithm to predict the web surfing paths of users. Huidobro et al., (2022) analyzed the sequence of visited pages among web visitors to identify common sequences and classify users. However, these methods lacked a holistic description that integrated users’ goals and their navigation behavior in order to provide an understanding of what users were trying to accomplish while interacting with the system (e.g., the webpage).
In addition, several studies have shown the potential of Social Network Analysis (SNA), a type of graph-based analysis, in understanding individual interactions in healthcare (Appel et al., 2018; Hu et al., 2021; Struweg, 2020). SNA was developed to study the structure of the relationship between social units (e.g., individuals and organizations) to understand their structure. It has been applied to understand the structure of websites, where pages can be represented as nodes and the links between them as edges (Jamali & Abolhassani, 2006). These previous studies in health insurance have focused on the structure of the social network, such as physician-patient relationships and policymaking, rather than on information search behavior with decision aids. SNA can be used to provide insights into how different elements in the network are related through individual network measures, such as network size, centralization, and connectivity (Tabassum et al., 2018), which may highlight important content that guided the user’s information search. In this paper, we propose the use of SNA to analyze a network representing navigation behavior within a decision aid to characterize a user’s system interaction strategy and information search. In this exploratory user study on VBC and HR website usage, we hope to answer the following questions about system interaction strategies:
How do people navigate different decision aid systems (VBC & HR Website)?
What is the content people are looking for to make an enrollment decision?
Is SNA useful for analyzing a network that represents users’ navigation in health insurance decision aids?
Methodology
Participants
Participants were employees at a state university who were recruited from a survey conducted to study the sources of information employees used to make health insurance decisions (see Colón-Morales et al., 2021, for a detailed description of the survey procedure). The only inclusion criterion was that participants must be full-time employees to be eligible for employer-provided health insurance. A total of 16 full-time employees, 12 females, and 4 males, were enrolled and completed the experiment. Participants were randomly assigned to use either the VBC system (n=8, Mage=30.9) or the HR website (n=8 Mage=34.8). All participants reported that they had either primary (11/16, 69%) or shared responsibility (5/16, 31%) for healthcare decisions in their household. On average, participants scored 5.3/7 on a test of basic health insurance knowledge. They also had an average score of 4.53/7 on the Health Insurance Literature Measure (HILM; Paez et al., 2014). A minority of participants reported being the sole member of their household (VBC: 38%, HR website 25%). This study was approved by the local institutional review board.
Apparatus
Participants were provided with a 15-inch laptop and an attached mouse to navigate through the health insurance decision aid. Eye-tracker data was collected using a Tobii Pro Nano Screen-based eye tracker, and a retrospective think-aloud was facilitated using Tobii Pro Lab software.
User Study Procedure and Experimental Tasks
A mock health insurance enrollment task with a retrospective think-aloud interview was used to understand users’ information search behavior while engaging with decision aids. In the mock health insurance enrollment task, participants were asked to make a hypothetical health insurance decision for the upcoming year using either the VBC or the HR website. Participants were asked to stay within the assigned system during the task and redirected to the system if they attempted to use other sources (e.g., left the HR website to use Google). The enrollment task ended when the participants felt ready to make a final decision. There was no time limit for this task. During the enrollment task, participants’ gaze patterns were recorded using an eye tracker and their navigation behavior and clicks were recorded in the Tobii Pro Lab software.
Prior to the start of the enrollment task, participants were provided training and practiced the think-aloud procedure. They were also given a pre-experiment questionnaire that measured their health insurance knowledge (adapted from Politi et al., 2016) and literacy (HILM). After completing the enrollment task participants were asked again about their health insurance knowledge and literacy. They also completed a decision conflict scale (Légaré et al., 2010) and were asked to rate the usefulness and ease of use of the system (Giang et al., 2021). Finally, participants took part in a retrospective think-aloud interview where they explained their thoughts, goals, navigation strategies, and information they were looking for while interacting with the decision aid. Participants used a video of their gaze data as a prompt for this process. The experiment was conducted by a trained graduate and undergraduate research assistant in an office-like environment, and took approximately 90 minutes.
Experiment Design and Measures
The main independent variable was the decision aid system used to assist the mock enrollment decision, either VBC or HR website. The dependent measures were their navigation behavior and participant descriptions of their navigation strategies as identified in the think-aloud interview.
Data Analysis
Participants’ navigation behavior data (e.g., the sequence of pages visited during the enrollment task) was analyzed using SNA to create a unique navigation network for each participant (Figure 3).
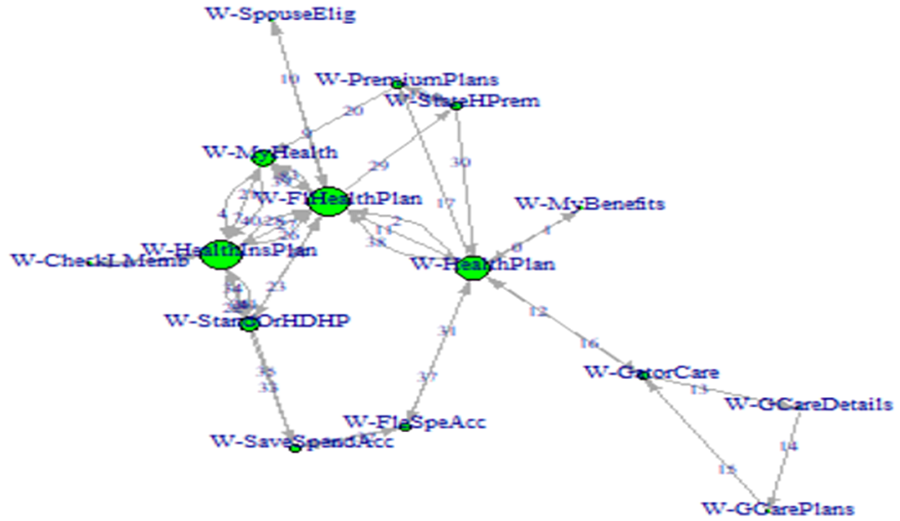
Example of Navigation Network.
The navigation network consisted of nodes that represented each visited “page” in the system, each with a number of visits and time duration attributes, and unique edges generated between each node based on the navigation path taken by the participants. These network characteristics allowed us to apply several graph statistical measures to understand the structure of the navigation network and how people search for information. There are many SNA measures that can be applied at both the network level which assesses the overall network structure and at the node level which assesses the centrality of nodes within the network (Tabassum et al., 2018). Our objective was to understand how people interacted with the different decision-aid systems and what content they were looking for during the enrollment process through seven SNA measures (Table 1)
SNA Measures.

The analysis was performed using R and the igraph package. Quotes from the retrospective-think-aloud interviews were selected to provide context for the SNA measures. Data for 1 HR website participant had a recording issue during the mock health insurance enrollment task, and the data was excluded from the SNA.
Results
Using the SNA, the previously described metrics were computed for each of the decision aids. The metrics were then compared across the two different systems. Overall the VBC consisted of more pages (159) compared to the HR website (109 pages), which resulted in more navigation links between the pages (VBC: 207 links; HR website: 111 links). On average, each page in the VBC had more links to other pages than the HR website (1.3 vs. 1.02). Table 2 displays the results of network utilization, path length, repeated navigation, and time duration.
SNA Measures Results.

Network utilization
We normalized the number of visited pages by the network size to calculate the network utilization. On average, VBC users explored more of the available pages than HR website users, Δ= 11.4%, t(13) = 3.02, p = 0.004. Path length was measured by the number of transitions in the navigation network. VBC users had marginally more page traversals than HR website users, Δ= 13, t(13) = 1.73, p = 0.054. Repeated navigation was measured by the difference in the number of visited pages and page traversals in the navigation network. VBC users had fewer repeat visits to the same page than HR website users, Δ= -16, t(13) = 2.71, p = 0.008. Time duration. VBC users spent less time navigating the system than the HR website users, but this difference was not significant, Δ= -3m 50s, t(13) = 1.27, p = 0.11, ns.
Degree of Centrality
For VBC users, the page that was most frequently identified as having the highest degree of centrality was the Side-by-Side Plans Comparison page with three users (37.5%). The Plans Cost Differences and Use of Flexible Spending Account pages each had one user (12.5%) that visited them the most. The remaining three users (37.5%) visited each page equally. Although the Side-by-Side Plans Comparison page was the most visited (37.5%) by users, these results show a wide range of different focuses for our VBC participants in terms of their most visited page. However, one piece of information that was common between these pages was financial information. For example, one participant was looking for financial information and selected the Side-by-Side Plans Comparison because financial information was included on the page. The participant commented:
I liked that they gave like the different options. Like the side-by-side comparison is what I was most drawn to. I almost went for estimating costs but the side-by-side, since they presented both of them [the health insurance plans] it just made sense to look at them that way to kind of get the most information. [ID06, VBC]
For HR website users, the State’s Health Plan and Network Providers page with 4 users (57.1%) was most frequently identified as having the highest degree of centrality, with the Health Insurance Plan page second (2 users, 28.5%), and the Benefits of the Premium page third (1 user, 14.2%). Unlike the VBC, the HR website had a page that was highly visited by the majority of the participants. However, both VBC and HR website users appeared to be searching for an overview page, as one participant commented:
I’m looking for a holistic – you know, a summary of all the options that I have. [ID02, HR Website]
Time Centrality
For VBC users, participants spent the most time on the Side-by-Side Plans Comparisons page (3 users, 37.5%, total time = 5m 16s); this accounted for 25% of their navigation time on average. The Plans Cost Differences page came second (3 users, 37.5%, total time = 4m 48s) accounting for 14.8% of their navigation time on average. The Cost of Worst-Case Scenario page had one user (12.5%) with a total time of 46s which was 7% of the navigation time, and the Details about HMO page had one user (12.5%) with a total time of 45s and was 20.3% of their navigation time. The results did not reveal a clear “focus” page where users spent the most time, but, again, the common content among these pages is financial information. One participant commented:
I guess because I was like, “Let’s just figure out how much things cost.” So, I guess when I was thinking [that] money matters the most in this situation to me at this point in time. Yeah, I didn’t even read the others, did I? [ID08, VBC]
For HR website users, participants spent the most time on the Health Insurance Plan page (4 users, 57.1%, total time = 15m 29s) accounting for 32.8% of their navigation time on average. The Summary about HMO came second (2 users, 28.5%, total time = 8m 59s), accounting for 43.4% of their navigation time on average. The Health Plan Comparison page had one user (14.3%) with a total time of 04m 34s; 28.3% of the navigation time. The results showed the majority of HR website users spent the most time on the Health Insurance Plan page that provided key highlights of the state’s health insurance plans. Many stated that this page contained all the information that was needed for their decision.
Betweenness
For VBC users, a variety of different pages were rated as having the highest betweenness for different participants including Side-by-Side Plans Comparison (2 users, 25%), Choices Costs, Question about How User Use Plan, Maternity Care, Use of Flexible Spending Account, Plans Cost Differences, and Occasional Prescriptions (1 user each). When we examined the pages in the navigation networks, we discovered that many of these pages were located in the middle of long sequences within the cost-estimation tool (e.g., Occasional Prescriptions), which calls into question whether betweenness was meaningful in identifying important pages for navigation. This was likely due to the design of the VBC systems which resulted in long linear sequences of page visits, resulting in identifying betweenness nodes that just happened to be in the center of the navigation network. Furthermore, the VBC presents information in smaller chunks, resulting in a larger set of pages, which may have also impacted the calculation of the betweenness measure.
For HR website users, the Health Insurance Plan page was rated as having the highest betweenness in the navigation network of three users (42.8%). The remaining users had a variety of different pages: Health Insurance Benefits and Eligibility, Links to State’s Health Plans, Non-Clinical Faculty Plans Eligibility, and State’s Health Plan and Network Providers (1 user each). After a review of these pages, we noticed that, in contrast to VBC, these pages appeared to play a significant role in how users navigated throughout the system. These pages provided information that linked to more detailed information sources that could be considered information hubs. For example, the Health Insurance Plan is an overview page that provided links to information about all plans, the other pages provided guidance information about eligibility and tables that also led to further information.
Discussion and Future Work
In this paper, we used SNA to characterize users’ navigation strategies and information search with health insurance decision aids by analyzing networks representing users’ navigation behavior. To our knowledge, no previous studies have explicitly examined how users navigate and search for information with a health insurance decision aid.
The network utilization, path length, and repeated navigation measures showed significant differences between the two decision aids. VBC users had less repeated navigation to the same pages and explored a larger percentage of the system. These navigation characteristics could be attributed to the design of the VBC system that provided a guided experience with specific paths that the users could follow. In contrast, HR website users exhibited more back-and-forth navigation behavior but explored fewer pages, which was a smaller percentage of the available pages. HR website users also navigated through “hub” pages that had high “betweenness”. This behavior may be indicative of users exploring the content and iteratively refining their search using the hub pages. Thus, the differences between VBC and HR website users may be due to the differing design of decision aids.
For VBC users, the degree of centrality and time centrality measures indicated that the side-by-side plans comparison page was prominently visited which contained financial information. Some VBC users explicitly stated that financial information was the most important factor, which supports the findings of the SNA analysis. These findings also agree with previous research that has shown health insurance premiums are highly significant when selecting health insurance plans (Chakraborty et al., 1994; Schram & Sonnemans, 2011). For HR website users, the degree of centrality and time centrality measures showed that the majority of users visited and spent time on pages that provide key highlights of health insurance plans (e.g., eligibility, benefits, coverage). HR website users described wanting to find summary information to compare available options. Our findings suggest that both VBC and HR website users were searching for an overview page with a variety of health insurance information, in contrast to previous research which found that users preferred more feature-based search when selecting a health insurance plan (Schram & Sonnemans, 2011). This difference could be due to the sample differences, as our participants were employees (VBC Mage=30.9, HR website Mage=34.8), while the participants in the previous study were undergraduate students (Mage=21.5).
In this preliminary study, we proposed SNA to characterize a user's system navigation strategy and information search by using networks representing navigation behavior within a decision aid. This approach, we believe, is beneficial in providing an understanding of how users interact with health insurance decision aids to make enrolment decisions. The measures used were sensitive to differences in the design of the two systems, capturing differences in network utilization, number of page transitions, and repeat navigations to the same page. Furthermore, insights gained from understanding critical pages within each system, as identified by the centrality and betweenness measures matched the quotes found in the think-aloud interviews. These preliminary findings using SNA show promise since these measures can be scaled to larger data sets, in contrast to think-aloud interviews, and user studies.
However, the analysis also revealed difficulties in directly applying these SNA measures to understand user interaction strategies. For example, in the VBC analysis, the betweenness measure identified pages that did not appear to play a meaningful role in the navigation behavior. The long linear sequences of visited pages in VBC navigation networks impacted the measure of betweenness which resulted in identifying pages solely due to these pages being in the center of the network. Furthermore, it was hard to differentiate between the impact of the systems design and users’ goals on how users navigated the health insurance decision aids using the SNA method. As a result, in future work, we will address such issues by considering other variations of SNA measures that also include additional factors such as time or edge weights in the navigation network as well as extend our research to a larger representative sample from various work environments.
In conclusion, this SNA analysis was able to provide insights into the differences between how users interact with different decision aids and content to make health insurance enrollment decisions. This may prove useful for future research in understanding user interaction strategies, leading to the design of systems that help users with making informed health insurance enrollment decisions.
