




Abstract
Aircraft carrier flight decks are dangerous work environments that require high degrees of coordination between humans in and around aircraft. It is impossible to run experiments in such settings to determine if new policies and rules could reduce the risk of injury. In order to explore possible safety improvement strategies in such settings where deaths still occur, an agent-based simulation environment was developed that allows for exploration of the impact of new procedures and technologies during aircraft launches. In this Optimal Manning Simulation (OMS), safety is measured through unexpected halo violations, where people inadvertently enter a bubble of high risk around an aircraft. An analysis with OMS demonstrated that safety-focused agent-based simulations could uncover not only where personnel face high risks but also when such risks could significantly increase. Thus, OMS can be used not only in a descriptive and predictive manner but also prescriptively to inform future policies.
Introduction
The fast-paced operational tempo for aircraft carrier deck operations means that personnel are at a higher risk of injury as they direct and maintain aircraft in a highly-constrained space. In these safety-critical environments, it is impossible to run actual experiments to determine if new policies and rules could reduce the risk of injury. Thus, organizations that operate safety-critical operations under high risk, like the Navy, need another way to explore possible safety improvement strategies. To this end, we developed an agent-based simulation environment that allows for exploration of personnel safety risk sources and possible mitigations.
This agent-based simulation tool, called the Optimal Manning Simulation (OMS), simulates carrier launches of 10-25 aircraft with the desired number and types of support personnel with an easy-to-use interface (Aubert, Ross, Mazzari, Stimpson, & Cummings, 2016). OMS also tracks where people and aircraft are on the deck in order to generate spatial and temporal estimates of a person’s risk of being struck by an aircraft. This effort describes how agent-based simulation tools like OMS can be used to identify safety concerns that could not be discovered through observation, and then how such information can inform safety strategies.
Background
Safety is a normative concept, with no absolute definition as it typically reflects the culture, policies, efficiencies and maturity of an organization’s operations in a specific setting. Safety and risk are related in that risk is the possibility of being harmed and safety is the absence of such risk. During aircraft carrier deck operations, risk is influenced by complexity of operations (i.e., numbers of aircraft and time of day), training and experience of personnel, and organizational safety policies. On aircraft carrier decks, risk intensity varies spatially and temporally, and also depends on the specific job a person is assigned. While absolute safety cannot be guaranteed in such inherently high-risk settings, risk can be mitigated with training, procedures and policies designed to reduce operational complexity.
Accident analytic techniques such as fault-tree analyses, failure modes and effects analyses, and systems-theoretic process analyses are important in understanding how safety may have been compromised for a specific accident, but such techniques are also inherently descriptive and cannot reliably predict future events (Cristea & Constantinescu, 2017; Sulaman, Beer, Felderer, & Höst, 2019). More systemic safety analytic approaches typically measure safety through outcomes, e.g., the number of days between accidents, the number of fatal accidents, etc. While unambiguous, such metrics are also descriptive, lag the existence of unsafe conditions and do not directly aid in preventing potentially deadly accidents.
Predictive models such as those that result from regression analyses can aid in developing policies for intervention. For example, researchers were able to statistically predict the likelihood of an aircraft crash based on cumulative fight time (Lyons & Nace, 2007). Such predictive models can point towards some interventions, like increasing flight time. However, such models can only capture trends of known and plentiful data, and cannot address more nuanced safety design considerations. What is needed, especially in complex safety-critical settings like aircraft carrier flight operations where experimentation is impossible, are prescriptive models that can explore many different operational settings to identify technology, process and policy changes that could be put in place to reduce risk while not compromising operational efficiency.
The development of prescriptive models for aircraft carrier flight deck operations is difficult due to their uncertain and dynamic nature as more than 100 people move in concert with dozens of aircraft and support vehicles, potentially under wartime conditions. Closed-form mathematical models cannot address the complexity of such scenarios, especially in developing safety predictions, so simulations are often used due to the "wicked" nature of these settings.
Safety simulation studies for humans in similar adverse environments have been conducted in other settings such as the Surrogate Safety Assessment Model (SSAM). Developed by the U.S Department of Transportation, SSAM uses microscopic traffic simulations to identify potential traffic conflicts through vehicle trajectory estimates (Gettman, Pu, Sayed, Shelby, & Siemens, 2008), and identify problems before they manifest in fatalities.
Other simulations used to prescriptively model safety include Monte Carlo simulations, which have been used to prospectively identify possible safety concerns. For example, they have been used to model runway incursions in air traffic control (Blom, Stroeve, & de Jong, 2006), pilot-based air traffic conflict detection (Thipphavong, 2010) and even for food safety (Heffernan, 2014). Monte Carlo simulations can be very effective for modeling systems with well-defined and stationary probabilistic behaviors, but are not well suited to non-stationary processes where individual entities inside the modeled domain change behaviors based on evolving events.
To cope with non-stationary and dynamic events with significant uncertainty, one modeling approach that can be used is agent-based modeling (ABM). In such a model, every agent in the system has a set of unique responses based on interactions with other agents in the environment. Agent behaviors, which can be people or other resources like catapults, can be represented by deterministic or probabilistic rules. Dynamic relationships emerge that can cause unanticipated interactions and potential problems. Given that ABMs can reveal possible unexpected agent interactions, in complex settings with a high number of independent agents like those that exist on an aircraft carrier deck, an ABM may be able to reveal new information about risk, and thus safety.
The Optimal Manning Simulation
OMS reflects the actions of all the different-colored jerseys on the deck (Fig. 1) for up to 25 aircraft, as well as resources like catapults and parking spots. OMS allows users to initialize variables and parameters, such as number and types of humans and planes, as well as failure parameters for commonly-occurring events such as aircraft maintenance problems and catapult failures. The desired number of simulation runs are then executed, and results compiled as aggregate statistics. Video playbacks of each run are available for visual analysis. Details on the development and validation of OMS can be found in Ryan and Cummings (2014) and Cummings, Li, Han, and Aguilar (2023).
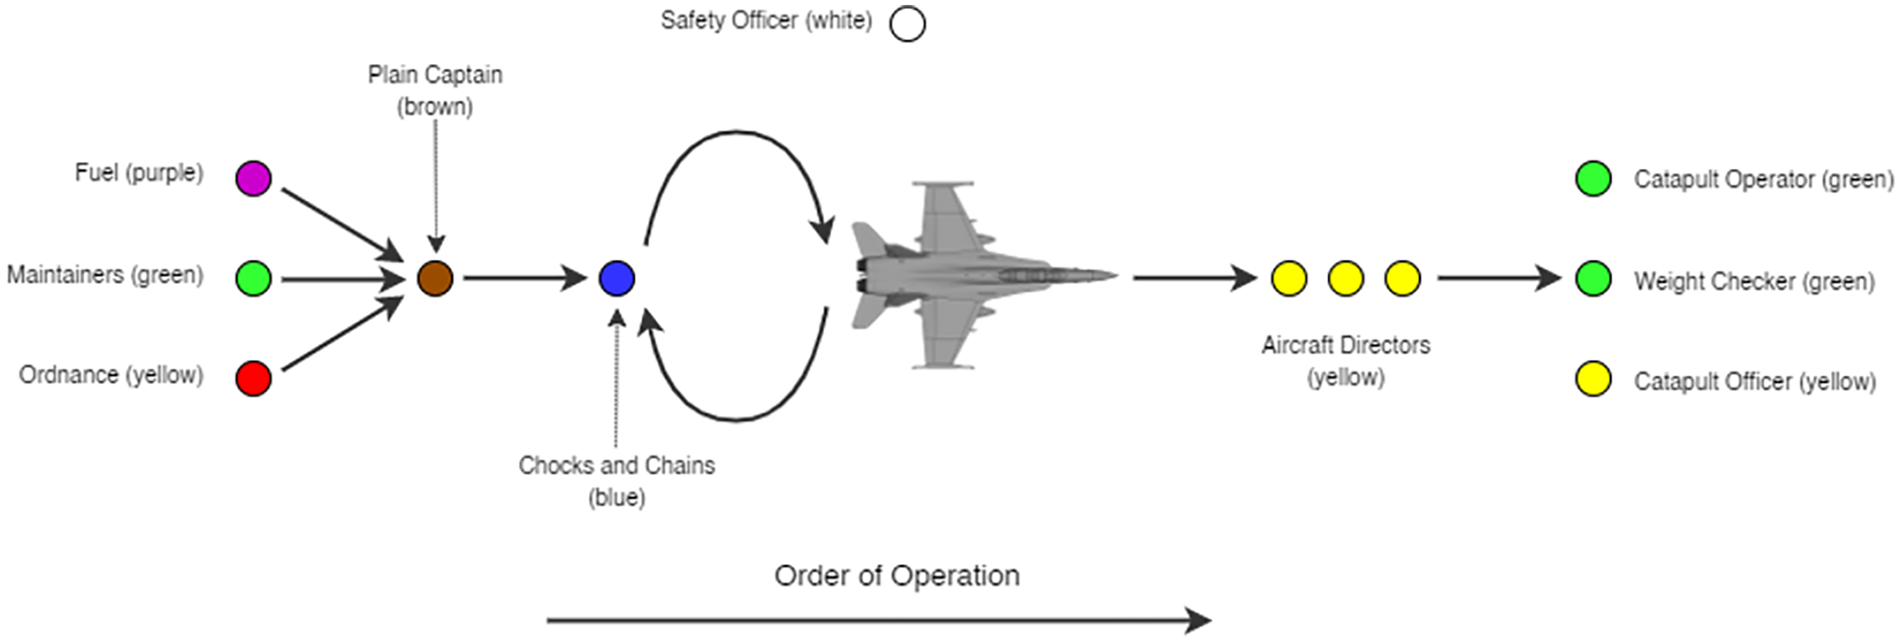
Launch timeline for a single aircraft on an aircraft carrier flight deck.
Figure 1 illustrates how human agents interact on the aircraft carrier deck for launching a single aircraft. People in purple jerseys fuel an aircraft, and green jerseys are the maintenance crew, ensuring all equipment is working. The red shirts attend to any ordnance aircraft carry. Brown shirts, the plane captains, ensure the plane is ready for the pilot, and once the pilot is ready to taxi, the blue shirts remove the tie downs and chocks that keep the plane from rolling around the deck. Yellow shirts are plane directors who direct the planes across the deck and into the four catapults. A green shirt shows the pilot the weight the catapult has been set to on a board, and once the pilot and catapult officer in yellow think the plane is ready, a green shirt hits the actual button to release the plane.
At the beginning of a launch, once ready, aircraft leave their parking spots and taxi across the carrier deck, typically to one of four catapults as seen in Fig. 2. The volume of aircraft movement is also shown in Fig. 2, which reflects areas of possible congestion. The four red dots in Fig. 2 reflect approximate key positions of four yellow shirt plane directors who are responsible for directing the planes across the deck to the catapults. These four people, who are at the greatest risk for injury, do not appreciably move during the launch so that everyone always knows where they are.

Aircraft flow across a carrier deck for a typical launch cycle.
OMS incorporates priority rules for personnel movement, which planes should be launched first and also considers various failures and actions by people and planes in these cases. For example, due to proximity between pairs of catapults on the front of the ship (Fig. 2), neither pair can be simultaneously used. Thus, OMS ensures that while one catapult in a pair is launching, the other is preparing.
OMS models not only the actions of all the personnel in Fig. 1, it also models the likelihood of slips, trips, and falls (STF) as people move about the deck. Because of the hurried pace of operations, as well as the rolling and pitching deck, the highest number of injuries on aircraft carrier decks are attributed to STFs (Parrish, Olsen, & Thomas, 2005). Not only do such falls cause injury, but they can delay operations while personnel recover or are escorted below deck. The STF values used in OMS were the mean STF rates from two observed carrier deck operations in 1999 and 2001 (Parrish et al., 2005), i.e., exponential distribution with parameters M = 0.004 per min, SD = 0.0667 per min.
Measuring Safety
While STFs are common sources for human injuries on the deck, these injuries are generally not life threatening. Most serious deck accidents happen when people come in contact with a moving aircraft. Because of this, the primary safety metric in OMS is the "Halo Violation", defined as the circle around the aircraft from wingtip to wingtip (Fig. 3). If people are inside this circle, a much higher probability exists that a life-threatening injury could be sustained. The longer people are inside this circle, the higher the probability of such an incident. Given that some people like plane captains or ordnance personnel need to be under the aircraft to do their jobs, these Halo Violations (HVs) are referred to as expected HVs. Those HVs that occur when people are in the wingtip circle and are not explicitly supposed to be under the aircraft are called unexpected HVs. Thus, HVs are a function of both frequency and duration
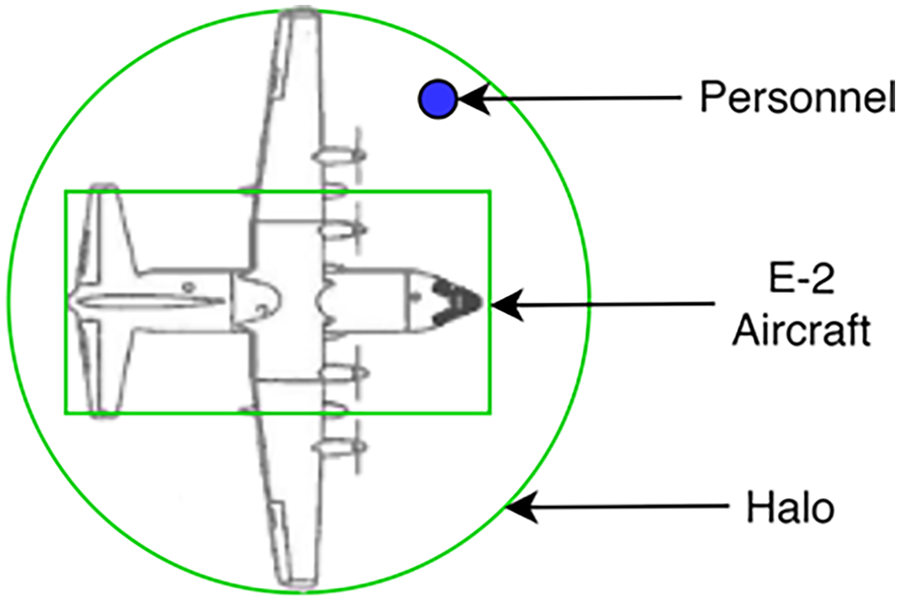
An unexpected halo violation for a blue shirt with an E-2 aircraft.
Unexpected HVs are a risk metric as opposed to a safety one since they indicate an increased probability of a serious accident, and not a guaranteed accident. OMS tracks expected and unexpected HVs in both time and place, which allows for tracking of patterns of increased risk for either individuals, groups of individuals, or locations and times during a launch cycle. This ability to identify ‘blind spots’ and ‘hot zones’ for risks in both a spatial and temporal sense will be explored more fully in the next section.
Simulation Results and Discussion
First, 90 simulations were conducted in OMS with 12 red shirts, 25 blue shirts, 20 green shirts, 16 yellow shirts, 25 brown shirts, 2 purple shirts and 14 white shirts per simulation. There were 30 runs each with 15, 20, and 25 aircraft (13, 17, and 20 high performance jets and 2, 3, and 5 slower aircraft like surveillance planes, respectively). These simulations determined those classes at the highest risk of injury through the unexpected halo violation metric.
Results in Fig. 4 illustrate that two groups clearly experience the highest risk for unexpected halo violations, overall, the yellow shirts (aircraft directors) at 37%, and blue shirts (chocks and chains personnel) at 33%. The next highest class were brown shirts (plane captains) at 20%. While the risk seems slightly higher for the yellow shirts, there are about one-third fewer yellow shirts as blues, thus the aircraft directors’ risk is even higher than Fig. 4 suggests.
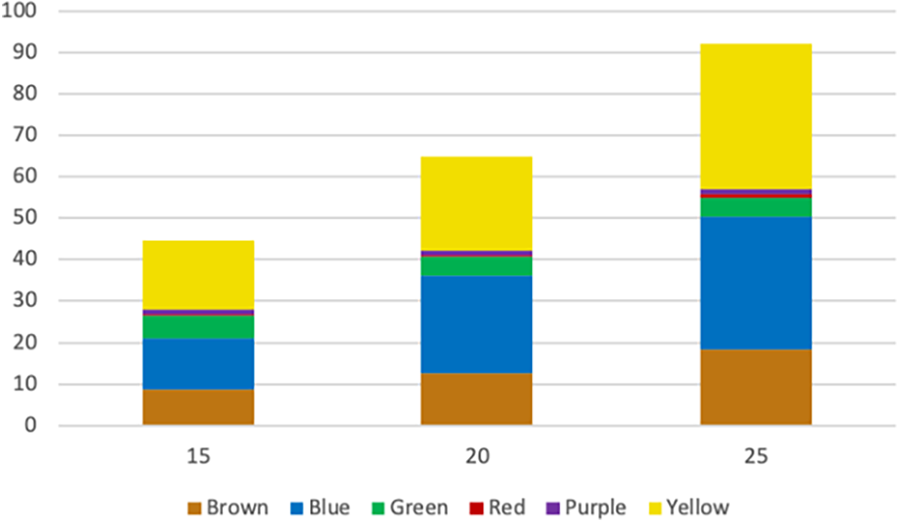
Unexpected halo violations for 15, 20 & 25 aircraft launches.
The next question to be answered using OMS was determining where high-risk areas existed on the carrier deck. First, we examined actual injury data from the Naval Safety Center (NSC), which gives both the approximate location of injuries as well as the severities. Unfortunately, this data set does not indicate which color jersey was worn at the time. The NSC data includes 11 carriers similar to the Nimitz-class carrier used in OMS, spanning 15 years. This data is plotted in Figure 5a, where the colors indicate injury severity. Despite the fact that the NSC data set had more than 7000 reported accidents, only 135 could be mapped to a known location.
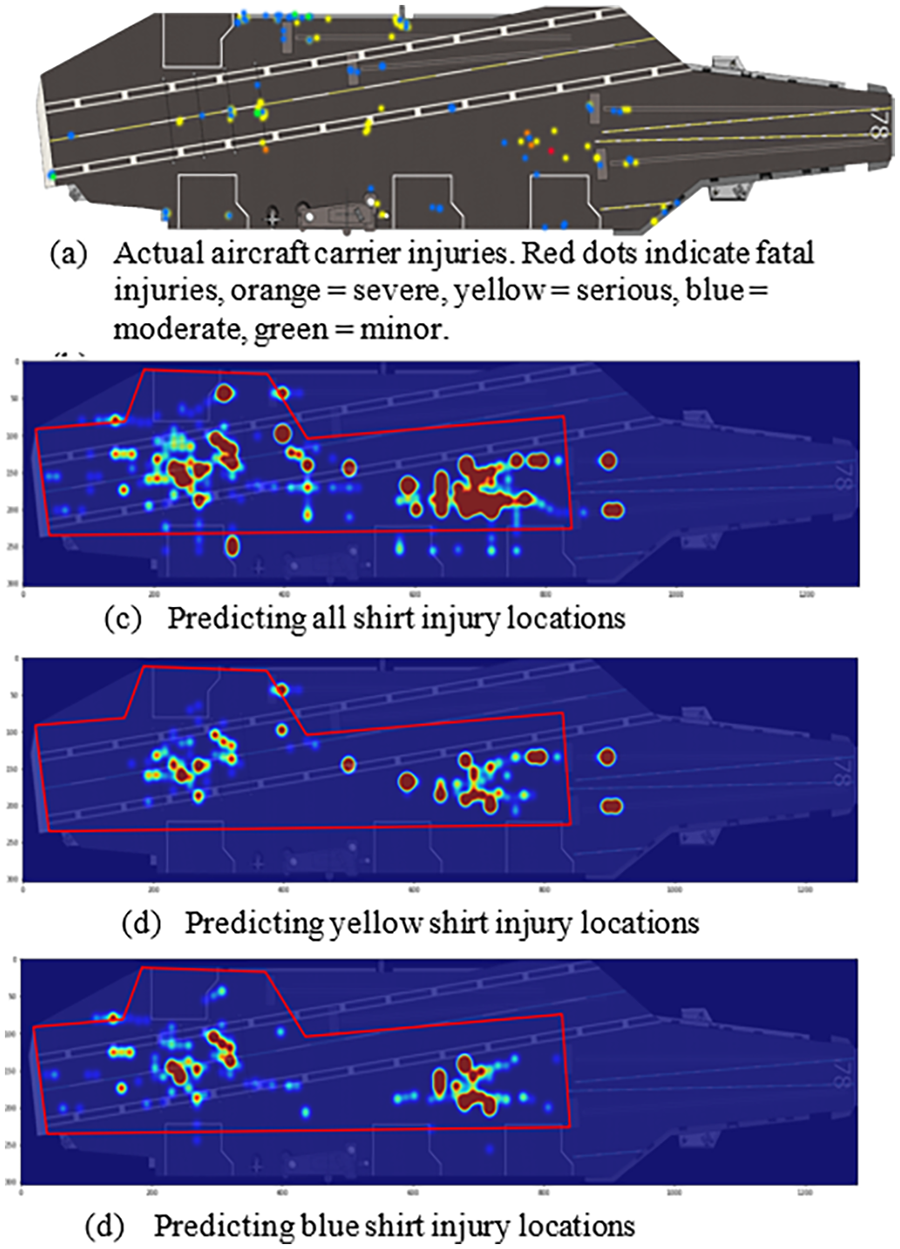
Actual & predicted injury locations.
Then, a separate set of 30 simulations of 25 aircraft with the same balance as above was run, since this represents the most dense operational environment with the greatest risk of injury. Figures 5b, 5c, and 5d show heat maps that indicate where the highest densities of unexpected halo violations occurred for all personnel (5b), yellow shirts (5c) and blue shirts (5d). The red outlines indicate areas where vehicles can travel.
The cluster of unexpected HVs towards the front of the carrier occurred in a place called the Six Pack, which is just behind catapults 1 and 2. This high-risk area was confirmed by SMEs and is typically congested since it is used for parking as well as queuing for catapults 1 and 2. The predicted second-highest region for unexpected HVs was near the arresting wires at the back of the ship.
The results in Fig. 5 show that the simulations, which indicate probability of injury, are in agreement with actual observed data showing where actual injuries have happened. This is an important validation step and these visualizations also indicate clearly where the high-risk areas for different classes of people. For example, when comparing Figs. 5c and 5d, yellow shirts have more risk towards the front of the ship, while blue shirts experience more risk towards the back.
While there is documented evidence for where accidents happen on a carrier deck, the NSC data does not provide any resolution as to when such accidents occur in the context of a launch cycle. Since launch cycles typically take less than 30 minutes, accident reports do not contain such information. Moreover, there are no published accounts of any kind of temporal analysis for these inherently dangerous operations. While understanding where accidents are likely to occur is important in developing safety interventions, understanding when to act is equally important since additional safeguards could be introduced.
To address this gap with OMS, we developed time distribution plots for the same 25-aircraft launch to investigate more deeply the temporal domain of unexpected HVs. Figure 6 provides significantly more detail about when the risk increases for unexpected HVs over the launch cycle. For all personnel, there is a spike in unexpected HVs in the early part of the launch cycle (Fig. 6a). The spike rises quickly, especially for the blue and yellow shirts (Fig. 6c). Indeed, chocks and chains blue shirts experienced more than half their overall unexpected halo violations (53%) in the first third of the launch, as compared to 44% for yellow shirts and 46% for all personnel. This demonstrates just how critical this time window is for reducing personnel risk, as blue shirts are the most inexperienced, yet their risk is highest in the first 7 minutes of a launch.
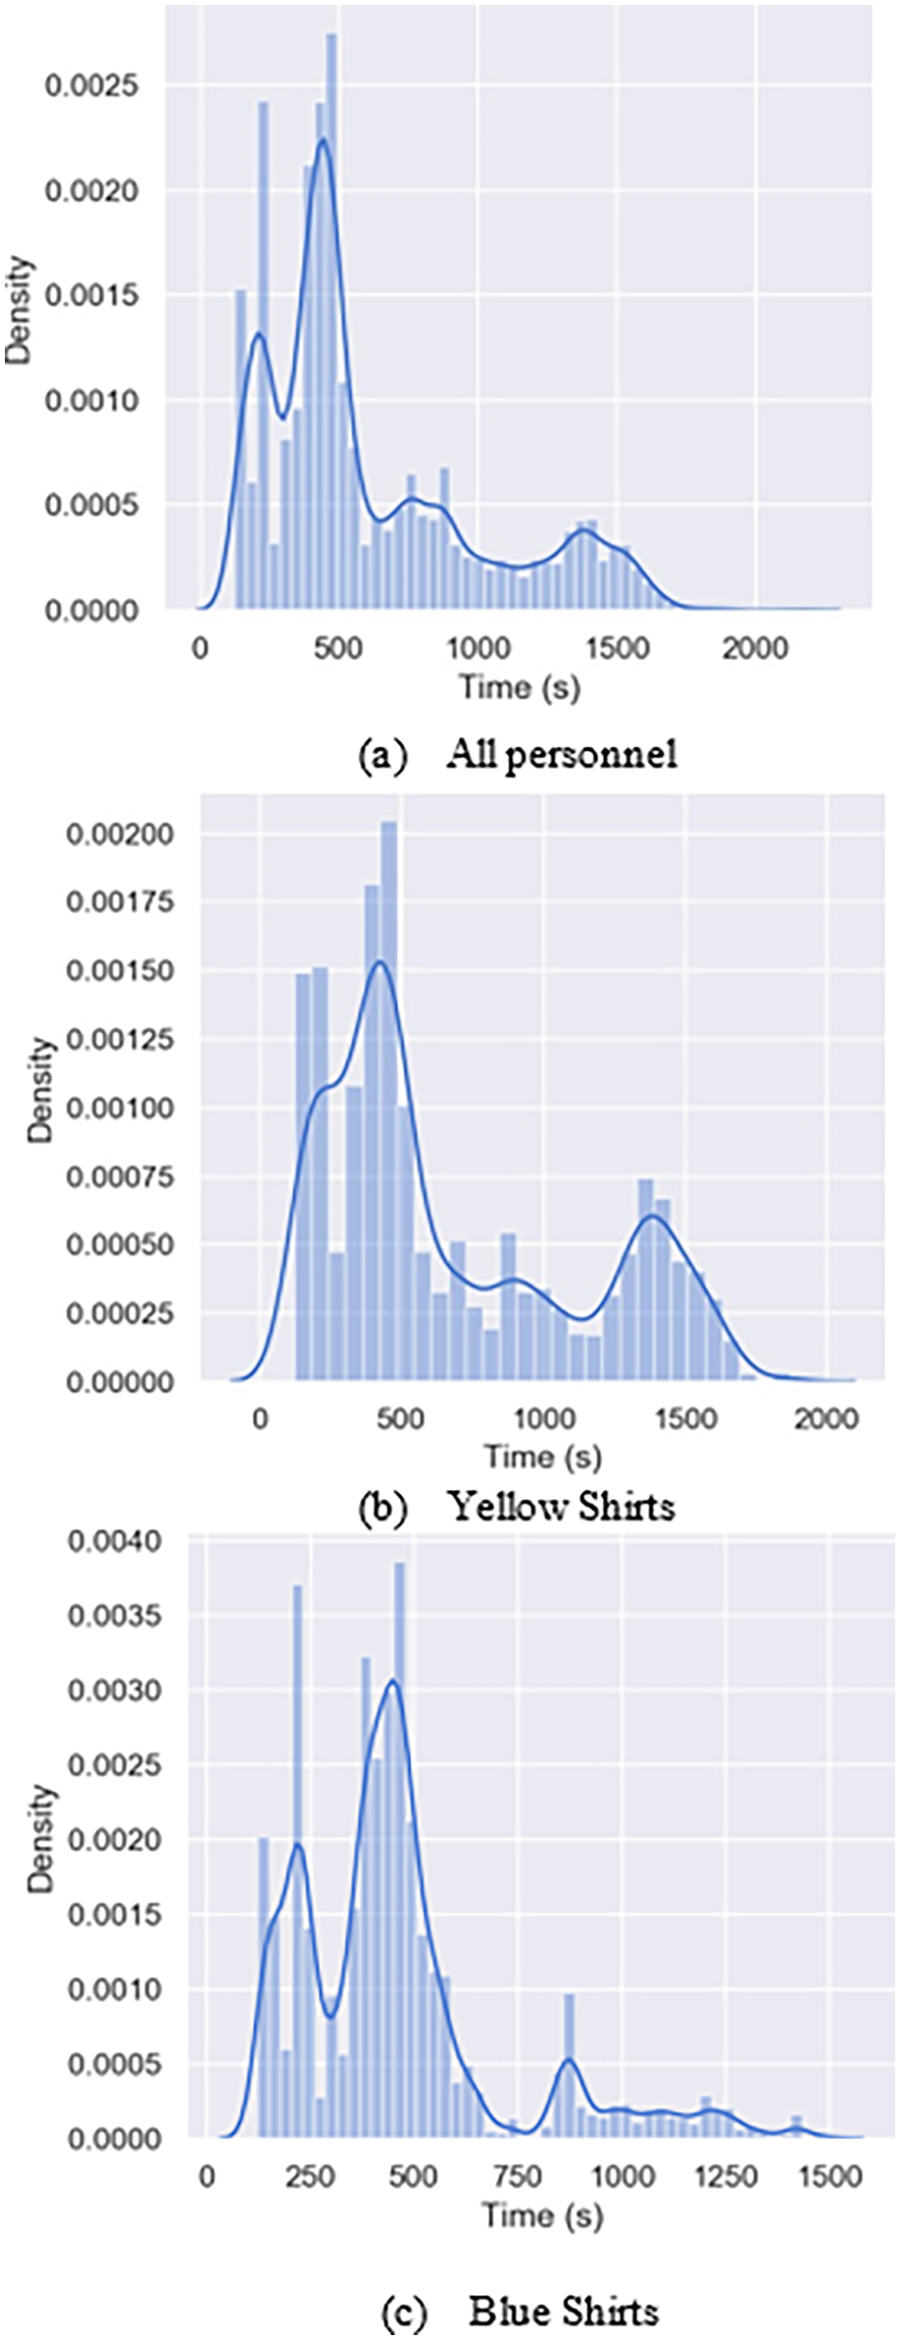
Unexpected halo violations over time for different personnel classes.
This analysis highlights that risk is not uniformly distributed in space or time, and safety protocols should explicitly consider these dynamic relationships. When SMEs were asked about the unanticipated temporal profile of unexpected HVs, they felt the peaks were likely due to personnel moving from a transient to steady state. They posited that blue shirts experienced more unexpected HVs more quickly because of their inexperience and a longer time to build situation awareness (Endsley, 2000). These results are especially important for the Navy who can now redirect training and intervention programs to focus on the first seven minutes of a launch in order to reduce serious and fatal injuries.
The primary limitations of this work are those typically associated with discrete event simulations in that underlying modeling assumptions may not hold for every situation. While OMS was validated (Cummings et al., 2023), the parameters were defined for nominal operations of a Nimitz-class carrier. Any significant deviation from these parameters would result in less confidence in the results.
Conclusion
While previous simulations have been used to develop predictions for potentially unsafe conditions across safety- critical scenarios, very little work has demonstrated how to use such simulations for prescriptive recommendations. This work illustrated how safety-focused agent-based simulations can be used to identify which personnel are at the greatest risk of injury, and also such simulations can uncover when personnel risks significantly increase, in addition to where such risks could occur
This effort illustrated that such an agent-based simulation can lead to new insights, which are especially useful in scenarios where real experimentation is prohibitive. This research showed that the Navy needs to not only pay attention to the areas of high risk on an aircraft carrier deck, which are different for different classes of people, but also to a time window in the launch cycle where the bulk of high-risk scenarios occur. Such a prescriptive capability is especially important when constrained environments like carrier decks cannot engage in experimentation due to operational demands.
In the future, OMS will be used to optimize where different key personnel should or could be located, as well as determining how the introduction of new technologies like autonomous deck navigation on the carrier deck could influence launch cycle metrics. This simulation environment can also be extended to emergency rooms, which also have constrained space and personnel, as well as time pressure.
This methodology could also be extended to warehouse automation (e.g., constrained spatial boundaries, known groups and functions of personnel, limited numbers of robots). Thus, the lessons learned in this aircraft carrier setting can be used to determine where and how general modeling principles can be extending to these and other domains.
Footnotes
Acknowledgements
This research was sponsored by the Office of Naval Research Code 35. We are grateful to the Naval Safety Center for their support of this effort. Songpo Li, Hong Han, Sayan Mandal, Jerry Wang and Meghan Booze assisted in this effort. Carlos Aguilar was also instrumental in verifying this work.
