
Abstract
Stress is a common concern in modern workplaces. However, traditional stress measurements such as selfreported questionnaires have limited application in real-world settings. In this exploratory study, we collected physiological signals via a wristband and an eye tracker from five participants while they were executing a stress-inducing task. Our mixed-effect model revealed that several physiological responses, including electrodermal activity, skin temperature, and average pupil diameter, can be used as indicators of perceived stress levels. Our findings suggest the potential of using physiological sensors to monitor individuals’ perceived stress in real-world scenarios and thus facilitate workplace stress management and intervention.
Introduction
Stress is an inevitable part of the modern work environment. It is defined as undesired physiological and psychological strain that occurs when perceived demands in the environment exceed an individual’s ability and available resources (Clegg, 2001; Driskell & Salas, 2013). In recent years, stress has become an increasingly pervasive concern for human health, especially for individuals working in highstress environments, like healthcare workers and air traffic controllers. These workers are prone to experiencing high levels of stress due to the nature of their work environments, which often involves long working hours, shift work, and high workloads (Basner et al., 2017; Fowler & Ellis, 2019). Stress can not only have negative impacts on workers’ mental and physical health but can also result in serious safety hazards such as medical errors and aviation collisions (Gronwall, 1977; Papp et al., 2004). Such severe consequences resulting from stress highlight the importance of building an accurate and reliable stress monitoring model.
The self-reported questionnaire is one of the most utilized methods for measuring individuals’ perceived stress levels. Two such questionnaires are the Perceived Stress Questionnaire (PSQ; Levenstein et al., 1993) and the Dundee Stress State Questionnaire (DSSQ; Matthews et al., 2002). These questionnaires include a series of questions regarding a respondent’s mental state (e.g., their emotional state) and their expectations and self-evaluation of their task performance. The difference before and after task exposure reflects the state change in respondents’ perceived stress (Matthews et al., 2013). However, the time-consuming, offline, and subjective nature of questionnaires limits their real-world applicability. For example, the PSQ contains 30 items and the DSSQ has as many as 90 items. Repeatedly answering these questionnaires in experimental scenarios can cause fatigue (Helton et al., 2004). Furthermore, such questionnaires typically measure before or after the main task, which limits the continuous measurement of fluctuations over time and is subjective to response biases.
Unlike self-reported questionnaires, modern wearable sensors can continuously record physiological responses without disturbing individuals (Affanni, 2020). The development of sensor technology has made it feasible to use multiple devices simultaneously in real-world settings (Parlak,2021). Previous studies have suggested a range of physiological responses, including electrodermal activity (EDA; Setz et al., 2009; Affanni, 2020), pupil diameter (Pedrotti et al., 2014), and skin temperature (Yamakoshi et al., 2008; Kyriakou et al., 2019), to distinguish between an individual’s stress and non-stress status. Greater sweat production and higher EDA have been associated with stress (Villarejo et al., 2012; Mudassar et al., 2021; Yang et al., 2021). A sympathetic nerve response to stress causes the pupil to dilate, making pupil diameter also an effective indicator (Bertilsson et al., 2019). Changes in skin temperature have also been reportedly associated with stress; Karthikeyan et al. (2012) reported higher skin temperature in the armpit when individuals were under greater stress, while de Arriba Perez and colleagues (2018) found lower skin temperature collected at the wrist area when individuals were engaged in stressinducing activities compared to watching relaxing videos.
In this exploratory study, we aimed to identify physiological responses that can be collected by off-the-shelf devices and capture a change in perceived stress levels. Applying mixed-effect models, we revealed the connections between self-reported stress and physiological responses, which show the potential for researchers to unobtrusively and objectively measure individuals’ stress levels.
Methodology
Participants
We recruited five individuals (three female and two male) with an average age of 28.2 years (SD = 5.89) to participate in this pilot study at the University of Washington. We excluded individuals who had visual or hearing impairments, as well as those with photosensitive epilepsy or a history of sleep disorders. All five participants had normal or corrected-to-normal eyesight. The study was approved by the institutional review board at the University of Washington.
Apparatus
Participants performed the experiment on a 15-inch Dell laptop with a resolution of 1920 x 1080. We used a Tobii Pro X3-120 eye tracker to collect participants’ eye movement data at a sampling rate of 120 Hz. The eye tracker was mounted below the screen of the laptop. The eye movements were recorded using the Tobii Pro Lab software (Tobii). To ensure eye movement data quality, participants were asked to maintain a consistent distance (40 cm) between themselves and the screen after calibration had been completed. We utilized the E4 wristband (Empatica) to collect participants’ skin temperature and electrodermal activity (EDA) with sampling rates of 64 Hz and 4 Hz, respectively. During the experiment, each participant wore the wristband on their nondominant hand to minimize the noise caused by moving their arm.
We used the Paced Auditory Serial Addition Task (PASAT) as the stress-inducing task in our study. The PASAT was developed by Gronwall (1977) and has been used as a stressor in many human factors and psychological studies (Lejuez et al., 2003; Finke et al., 2021). During the PASAT, each participant listened to a series of numbers ranging from 0 to 18, with the largest sum controlled under 20. The participant was required to add the two most recent numbers and select the correct sum from the options displayed on the laptop screen. To be considered correct, the answer had to be submitted before the next number was presented. We controlled the inter-stimulus interval (ISI) to manipulate the task-induced stress from the PASAT (Tanosoto et al., 2015; Ehrhardt et al., 2022). The ISI in the low-stress condition was set to three seconds and the ISI in the high-stress condition was set to two seconds. The PASAT was built based on the Psychology Experiment Building Language (Mueller & Piper, 2014). Figure 1 shows the main user interface of the PASAT used in this study. The correctness of the participant’s most recent response is shown in the center of the screen. The total number of correct responses and the total number of questions presented are also displayed on the screen, next to the correctness indicator.
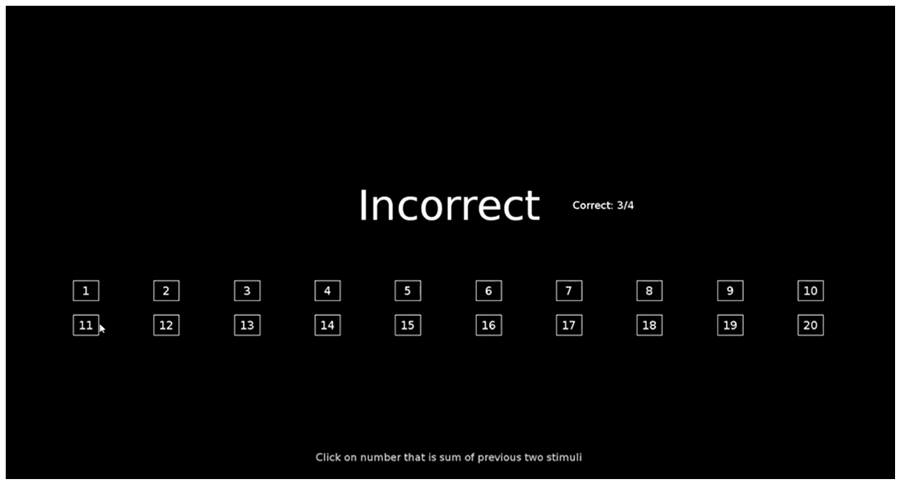
The user interface of the PASAT.
Self-reported questionnaires
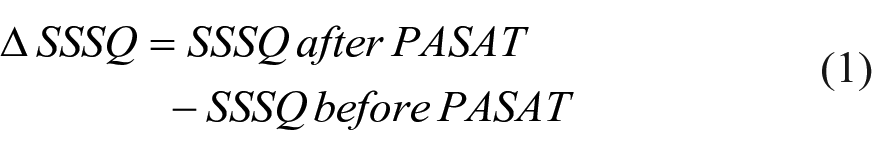
To assess the change in perceived stress due to each PASAT session, we calculated the difference in the SSSQ score (ΔSSSQ) before and after the PASAT, as shown in Equation (1). The SSSQ is a short version of DSSQ, which is developed by Helton et al. (2005). Participants needed to answer 24 questions in terms of three dimensions of stress, i.e., engagement, distress, and worry, and the total score of the three dimensions was calculated.
Physiological measurements
We collected two physiological variables via the E4 wristband: skin temperature and EDA. Four variables were extracted from the participants’ eye movements, including left pupil diameter, right pupil diameter, fixation duration, and number of fixations. Since the pattern of left and right pupil diameters were very likely to be the same, we utilized the average diameter of both pupils directly in our data analysis.
Procedures
We began by screening potential participants for eligibility by administering an online survey that included questions related to the individuals’ demographic information as well as the exclusion criteria. Individuals who passed the screening test were instructed to refrain from consuming caffeine on the day of the experiment. On the day of the experiment, we walked the participants through the experimental procedure before starting. Afterward, we assisted the participants with putting on the E4 wristband and guided them to complete the eye tracker calibration. The practice session of the PASAT started after device set-up. The practice session familiarized the participants with the task and the user interface, presenting 10 questions with longer ISI than the actual tasks in the main experiment to avoid unnecessarily increasing the participants’ stress levels before the main experiment.
Participants filled out a Short Stress State Questionnaire (SSSQ) before completing the first session of the PASAT in the main experiment. After they finished the first PASAT session, they filled out the SSSQ again and took a one-minute break. After the break, they repeated the same process, i.e., filling out a pre-task SSSQ, performing the PASAT, filling out a post-task SSSQ, and taking another oneminute break. Each PASAT session lasted 2.5 minutes (150 seconds). The order of the experimental conditions was randomized. The entire experiment lasted about 25 minutes.
Data preprocessing
We conducted a series of preprocessing steps before analyzing the data. First, we converted the Unix timestamps in the E4 and eye movement data to local timestamps. Second, to match these physiological data with the sessions in the main experiment, we down-sampled the physiological signals to 1 Hz by calculating the average value per second. Third, we removed the outliers in the data for each physiological signal and compensated for them using linear interpolation. Then, we synchronized the E4, eye movement, and PASAT data by using local timestamps. To eliminate the impact of individual differences on the mean values, for each participant’s data, we performed baseline removal on all variables. The data from all five participants were used in our analysis.
Results
Descriptive statistics
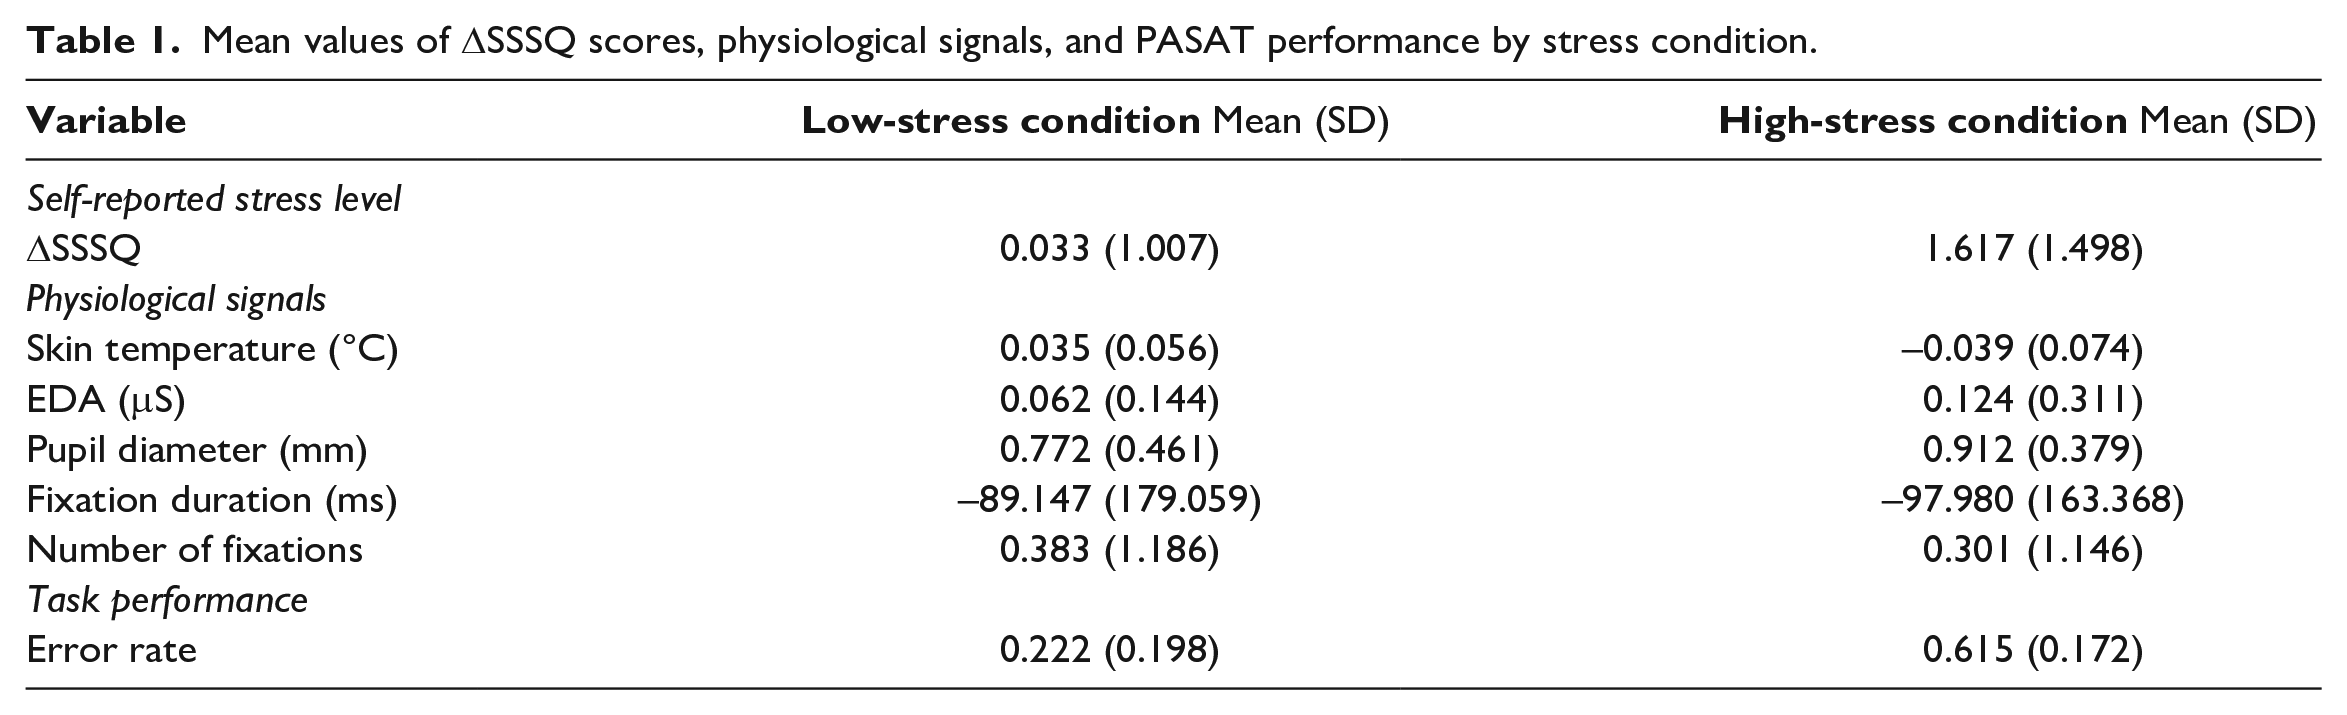
We summarize the mean value and standard deviation for each response across the sample in Table 1 . The positive values in physiological signals indicate that such variables were increased under the given condition compared to the baseline. The ΔSSSQ measured the change in perceived stress, confirming that the PASAT sessions with shorter ISI induced a higher level of perceived stress. In addition, we observed that participants performed worse, i.e., had higher error rates on the low-stress PASATs than on the high-stress ones.
Mean values of ΔSSSQ scores, physiological signals, and PASAT performance by stress condition.
By plotting individuals’ ΔSSSQ scores for the lowstress and high-stress condition in Figure 2 , we observed that though all five participants reported higher ΔSSSQ in the high-stress PASAT sessions than in the low-stress condition, but the degree of change in ΔSSSQ differed among individuals. To examine whether the physiological sensors can reflect individuals’ perceived stress, in the subsequent analysis, we used the ΔSSSQ to provide a more accurate presentation of stress.

ΔSSSQ in low- and high-stress PASAT sessions for five participants (PID indicates participant ID).
Mixed-effect models
To investigate the relationships between changes in perceived stress (ΔSSSQ) and the physiological variables, we fitted the data set using mixed-effect models (Bates et al., 2014) by applying the ‘lme4’ package in R (R Core Team, 2020). We included in the model time on task as an independent variable to explore the potential influence of exposure time to the stress-inducing task on physiological signals. Participant ID and the order of the PASAT sessions were treated as random effects. All the physiological variables were normalized before running the model.
We observed significant relationships between the ΔSSSQ and skin temperature (F(1, 1497) = 453.364, p < 0.001), EDA (F(1, 1344.8) = 16.717, p < 0.001), and average pupil diameter (F(1, 1497.1) = 180.156, p < 0.001), which suggests that such variables can be utilized as indicators of a change in the perceived stress level. More specifically, participants had lower skin temperature, higher skin conductivity, and more dilated pupils when they perceived higher levels of stress. We did not find significant effects of the ΔSSSQ on fixation duration (F(1, 1278.2) = 2.5747, p = 0.109) and only observed a marginal effect on number of fixations (F(1, 365.48) = 2.842, p = 0.093). It is worth noting that time also had a significant impact on EDA (F(1, 1492.9) = 282.406, p < 0.001) and average pupil diameter (F(1, 1493) = 12.981, p < 0.001), meaning both physiological variables were not only related to stress level but also time-dependent.
Discussion and Conclusion
This exploratory study identified multiple physiological responses, i.e., skin temperature, EDA, and average pupil diameter, that can efficiently detect a change in individuals’ perceived stress levels. Our findings have practical implications for workplace stress management. Traditional work stress measurements fall into two main categories: self-reported questionnaires and behavioral responses (Stanton et al., 2001). Both can be time-consuming and require great effort in data collection. The utilization of portable and non-intrusive physiological sensors as indicators not only allows researchers to assess individuals’ stress levels in everyday workplace settings but also accelerates the process of workplace stress evaluation and intervention.
The results of EDA and pupil diameter in this study align with those of previous studies showing that when individuals experience more stress, their skin conductivity is likely to increase (Setz et al., 2009; Affanni, 2020) and the diameters of their pupils become larger (Figueroa-Fankhanel, 2014; Pedrotti et al., 2014). Meanwhile, the impact of stress on skin temperature varies based on the area of the skin considered (Vinkers et al., 2013; Figueroa-Fankhanel, 2014; Chen et al., 2021). For instance, skin temperature tends to decrease at distal skin locations such as fingertips (Vinkers et al., 2013) when a person is under stress. However, it is not often practical to place sensors on distal skin areas in work settings. According to our findings, skin temperature in the wrist area can serve as an alternative location for stress detection in real-world applications.
As this is an exploratory study, there are certain limitations to it that need to be addressed in future work. We conducted this exploratory study to validate the experimental design and test the hypothesis that physiological variables are capable of reflecting individuals’ perceived stress levels when exposure to stressors is relatively short. In our future work, we will expand our participant pool and consider other factors that might contribute to participants’ stress. For instance, individual factors such as sleep deprivation and anxiety levels are known to influence stress levels (Minkel et al., 2012; Nollet et al., 2020). Our future research will incorporate these individual factors as well as physiological signals to construct a more comprehensive metric for accurate stress monitoring and prediction. Participants’ stress may also have been continuously influenced by the performance feedback they received from the PASAT software, resulting in dynamic stress levels. Such time-varying characteristics of stress and the time-dependency of EDA and pupil diameter highlight the necessity of including the time domain in the modeling. Dynamic modeling techniques such as Markov chains and dynamic Bayesian networks can be employed in our future work.