
Abstract
Objective
This study aimed to evaluate the clinical applicability of pB-C2 in assessing reduction and ventral decompression, and to examine its association with postoperative neurological outcomes in patients with type A basilar invagination (BI).
Methods
A retrospective analysis was conducted on 56 surgically treated patients with type A BI and 43 controls. Neurological recovery was assessed using the Japanese Orthopedic Association (JOA) score and its improvement rate. Radiological parameters were measured, and correlation, linear regression, and receiver operating characteristic (ROC) analyses were performed.
Results
The preoperative pB-C2 value in the BI group was significantly higher than that in controls (P < 0.001). Following surgery, 44 of 56 patients showed satisfactory improvement in the JOA score, while 12 demonstrated limited recovery. The mean postoperative pB-C2 decreased from 12.5 ± 2.0 mm to 8.1 ± 1.8 mm (P < 0.01). Significant correlations were identified between cosα·pB-C2 and the modified atlantoodontoid interval (mADI), as well as between cosβ·pB-C2 and Chamberlain’s line (CL), McRae’s line (ML), and Wackenheim’s line (WL) (P < 0.05). Moreover, postoperative pB-C2 and its improvement rate were strongly associated with the cervicomedullary angle (CMA) and the JOA improvement rate. ROC analysis revealed that a postoperative pB-C2 of 8.4 mm or an improvement rate of 80.0% yielded the optimal Youden index.
Conclusion
The pB-C2 provides a practical metric for assessing surgical reduction and ventral decompression in type A BI. Its correlation with the CMA and neurological recovery supports further exploration of pB-C2 as an intraoperative tool in patients with type A BI.
Introduction
Basilar invagination (BI) is a structural deformity of the craniovertebral junction (CVJ) and represents the most common upper cervical anomaly requiring surgical correction. According to the classification proposed by Gole A, BI is divided into type A and type B based on the presence of atlantoaxial dislocation (AAD). 1 In type A BI, the odontoid process prolapses into the foramen magnum. It is frequently associated with both anterior-posterior and vertical AAD, resulting in significant ventral compression of the brainstem or upper cervical spinal cord. 2 Effective management of type A BI typically requires surgical reduction of AAD via anterior, posterior, or combined approaches to relieve ventral compression, followed by fusion to maintain long-term CVJ stability.3,4
Magnetic resonance imaging (MRI)–based assessment of the cervicomedullary angle (CMA) has been reported to correlate with neurological improvement, as reflected by changes in the Japanese Orthopedic Association (JOA) score. As a result, CMA is regarded as a reliable marker of brainstem decompression. 5 However, intraoperative MRI is often impractical in most surgical settings. As an alternative, X-ray and computed tomography (CT) imaging are commonly used for real-time intraoperative evaluation. Previous studies have demonstrated that the clivo-axial angle (CXA), which can be easily measured on CT or X-ray, correlates with CMA and serves as a valuable surrogate indicator of ventral brainstem compression in BI patients.6,7 Moreover, CXA has been applied to guide surgical planning and correction of cervical sagittal alignment, especially in cases of type A BI. 8
Despite its clinical value, CXA primarily reflects the angular relationship between the clivus and the axis, without capturing the degree of odontoid displacement relative to the clivus or foramen magnum. Given that type A BI involves complex displacements in both vertical and horizontal planes, clinicians often rely on several complementary measurements, such as Chamberlain’s line (CL), McRae’s line (ML), and Wackenheim’s line (WL) for vertical displacement, and the atlantodental interval (ADI) or its modified forms for anterior-posterior displacement, to evaluate surgical reduction and decompression.9-14 However, this multi-parameter approach can complicate intraoperative decision-making, extend assessment time, and introduce observer variability. Furthermore, common craniovertebral anomalies associated with BI, including atlas assimilation, odontoid hypertrophy, and platybasia, further obscure anatomical landmarks and make it difficult to define the threshold for adequate reduction or decompression. 15 These limitations may reduce the precision of conventional assessment methods and contribute to suboptimal neurological outcomes despite technically successful surgery. 9
Among the available radiological indicators, the pB-C2 distance has emerged as a sensitive and straightforward metric for evaluating ventral brainstem compression, particularly in Chiari malformation and type B BI. It is frequently used to determine the need for ventral decompression. 16 However, its clinical value in type A BI, especially in assessing intraoperative reduction and predicting postoperative functional recovery, remains insufficiently characterized. Therefore, this study aimed to examine the clinical applicability of pB-C2 as a single, comprehensive parameter for evaluating reduction and ventral decompression, and to explore its correlation with postoperative neurological recovery in patients with type A BI.
Materials and Methods
Participants
This study was approved by the Institutional Review Board of our institution (Approval No. KY2021111). Between January 2013 and December 2022, a consecutive cohort of 104 patients diagnosed with type A BI underwent surgical treatment at our center. All procedures were performed by 2 experienced spine surgeons, Dr Dejun Zhong and Dr Qing Wang, each with more than 15 years of expertise in cervical spine surgery. Intraoperative cranial traction under general anesthesia was applied to guide the selection of surgical techniques, following previously described protocols. 13
Inclusion criteria were as follows: (1) congenital BI accompanied by atlas assimilation; (2) presence of neurological symptoms attributable to anterior brainstem or cervical spinal cord compression; and (3) availability of two-dimensional (2D) or three-dimensional (3D) cervical spine CT imaging obtained both preoperatively and either intraoperatively or within 2 weeks postoperatively.
Exclusion criteria included: (1) coexisting Chiari malformation and/or syringomyelia; (2) BI secondary to systemic or acquired conditions such as rheumatoid arthritis, Paget’s disease, osteomalacia, neoplasms, infections, hyperparathyroidism, osteogenesis imperfecta, Hurler syndrome, or rickets; (3) previous surgery involving the CVJ; (4) neurological impairment caused by trauma; (5) anterior decompression procedures involving odontoidectomy; (6) intraoperative complications, such as spinal cord or vertebral artery injury, or cases requiring revision surgery; (7) lack of preoperative and postoperative MRI; and (8) follow-up duration of less than 2 years.
After applying the inclusion and exclusion criteria, 48 patients were excluded: 21 due to Chiari malformation and/or syringomyelia, 11 because of preoperative neurological deterioration resulting from trauma, 1 who required revision surgery for screw fracture, 1 who underwent revision surgery following postoperative trauma, 13 who lacked intraoperative or early postoperative (≤2 weeks) CT imaging, and 1 with a history of foramen magnum decompression. Therefore, 56 patients were included in the observation group. Among them, 40 underwent posterior fixation and fusion, 11 received posterior lateral mass joint release followed by fixation and fusion, and 5 underwent transoral anterior release combined with posterior fixation and fusion. These patients presented with neurological dysfunction, with a mean symptom duration of 4.8 ± 2.3 years (range: 1-12 years).
The control group consisted of 43 patients with atlas assimilation (with or without C2–C3 fusion) who underwent CT and MRI evaluation of the cervical spine and craniovertebral junction due to cervical radiculopathy or trauma. Imaging confirmed intact neural structures and the absence of brainstem or spinal cord compression, and none showed clinical symptoms suggestive of BI. Further, a normal group of 218 individuals without CVJ deformities who underwent CT examination for lower cervical degenerative conditions was included for reference.
Neurological Function Assessment
Neurological function was assessed using the Japanese Orthopedic Association (JOA) scoring system, with a maximum possible score of 17 points. Functional recovery was expressed as the JOA improvement rate, calculated as: (postoperative score - preoperative score)/(maximum normal score - preoperative score)· 100%. According to this rate, surgical outcomes were classified as excellent (75-100%), good (50-74%), fair (25-49%), or poor (0-24%). An improvement rate below 50% was considered indicative of an unsatisfactory result. 17
Imaging Analysis
Direct measurement of the atlantodental interval (ADI) in patients with type A BI is technically challenging; therefore, a modified ADI (mADI) was utilized in this study. The mADI was defined as the vertical distance from the posterior margin of the anterior arch of the atlas to a plumb line drawn through the apex of the odontoid process, measured on mid-sagittal reconstructed CT images. 10 To assess vertical displacement, the distances between the odontoid tip and CL, ML, and WL were recorded. 3 In addition, the CXA was measured. 7
The pB-C2 parameter was determined using the method described by Hankinson et al
16
and Paul et al,
18
based on mid-sagittal CT reconstructions for both groups. A line was drawn from the basion (point B) to the inferoposterior margin of the C2 vertebral body (point C2), designated as the B–C2 line. The perpendicular distance from this line to the ventral dural surface at the odontoid tip (point O) was defined as pB-C2, representing the extent of ventral canal encroachment (Figure 1A). The intersection between the B–C2 and pB-C2 lines was identified as point D. At this intersection, a horizontal and a vertical (plumb) line were drawn, forming angles α and β with the pB-C2 axis, respectively. Using these angles, cosα·pB-C2 and cosβ·pB-C2 were calculated to represent the magnitudes of anterior–posterior and vertical displacement, respectively (Figure 1B). The pB-C2 improvement rate was calculated using the formula: pB-C2 improvement rate = [(preoperative pB-C2 - postoperative pB-C2)/(preoperative pB-C2 - mean pB-C2 of the control group)] · 100%. Schematic Overview of the Methods for Measuring pB-C2 and the Calculation of cosα*pB-C2 and cosβ*pB-C2. The Purple, Yellow, and Green Circles in Figure 1A Correspond to the Following Bone Reference Points: Basion (Point B), Inferoposterior Aspect of the C2 Body (Point C2), and the Tip of the Odontoid Process to the Ventral Dura (Point O). A Line was Drawn From the Basion (Point B) to the Inferoposterior Margin of the C2 Vertebral Body (Point C2), Designated as the B-C2 Line (Blue). The Perpendicular Distance From This Line to the Ventral Dural Surface at the Odontoid Tip (Point O) was Defined as the pB-C2 (Red), Serving as an Indicator of Ventral Canal Encroachment (Figure 1A). The Intersection Point Between the B-C2 and pB-C2 Lines was Labeled Point D (Red Circle) in Figure 1B. At This Point, a Horizontal (Dark Blue) and a Vertical (Plumb) (Light Blue) Line Were Drawn, Forming Angles α and β With the pB-C2 Axis, Respectively. Using These Angles, cosα*pB-C2 and cosβ*pB-C2 Were Computed to Represent the Degrees of Anterior-Posterior and Vertical Dislocation, Respectively (Figure 1B)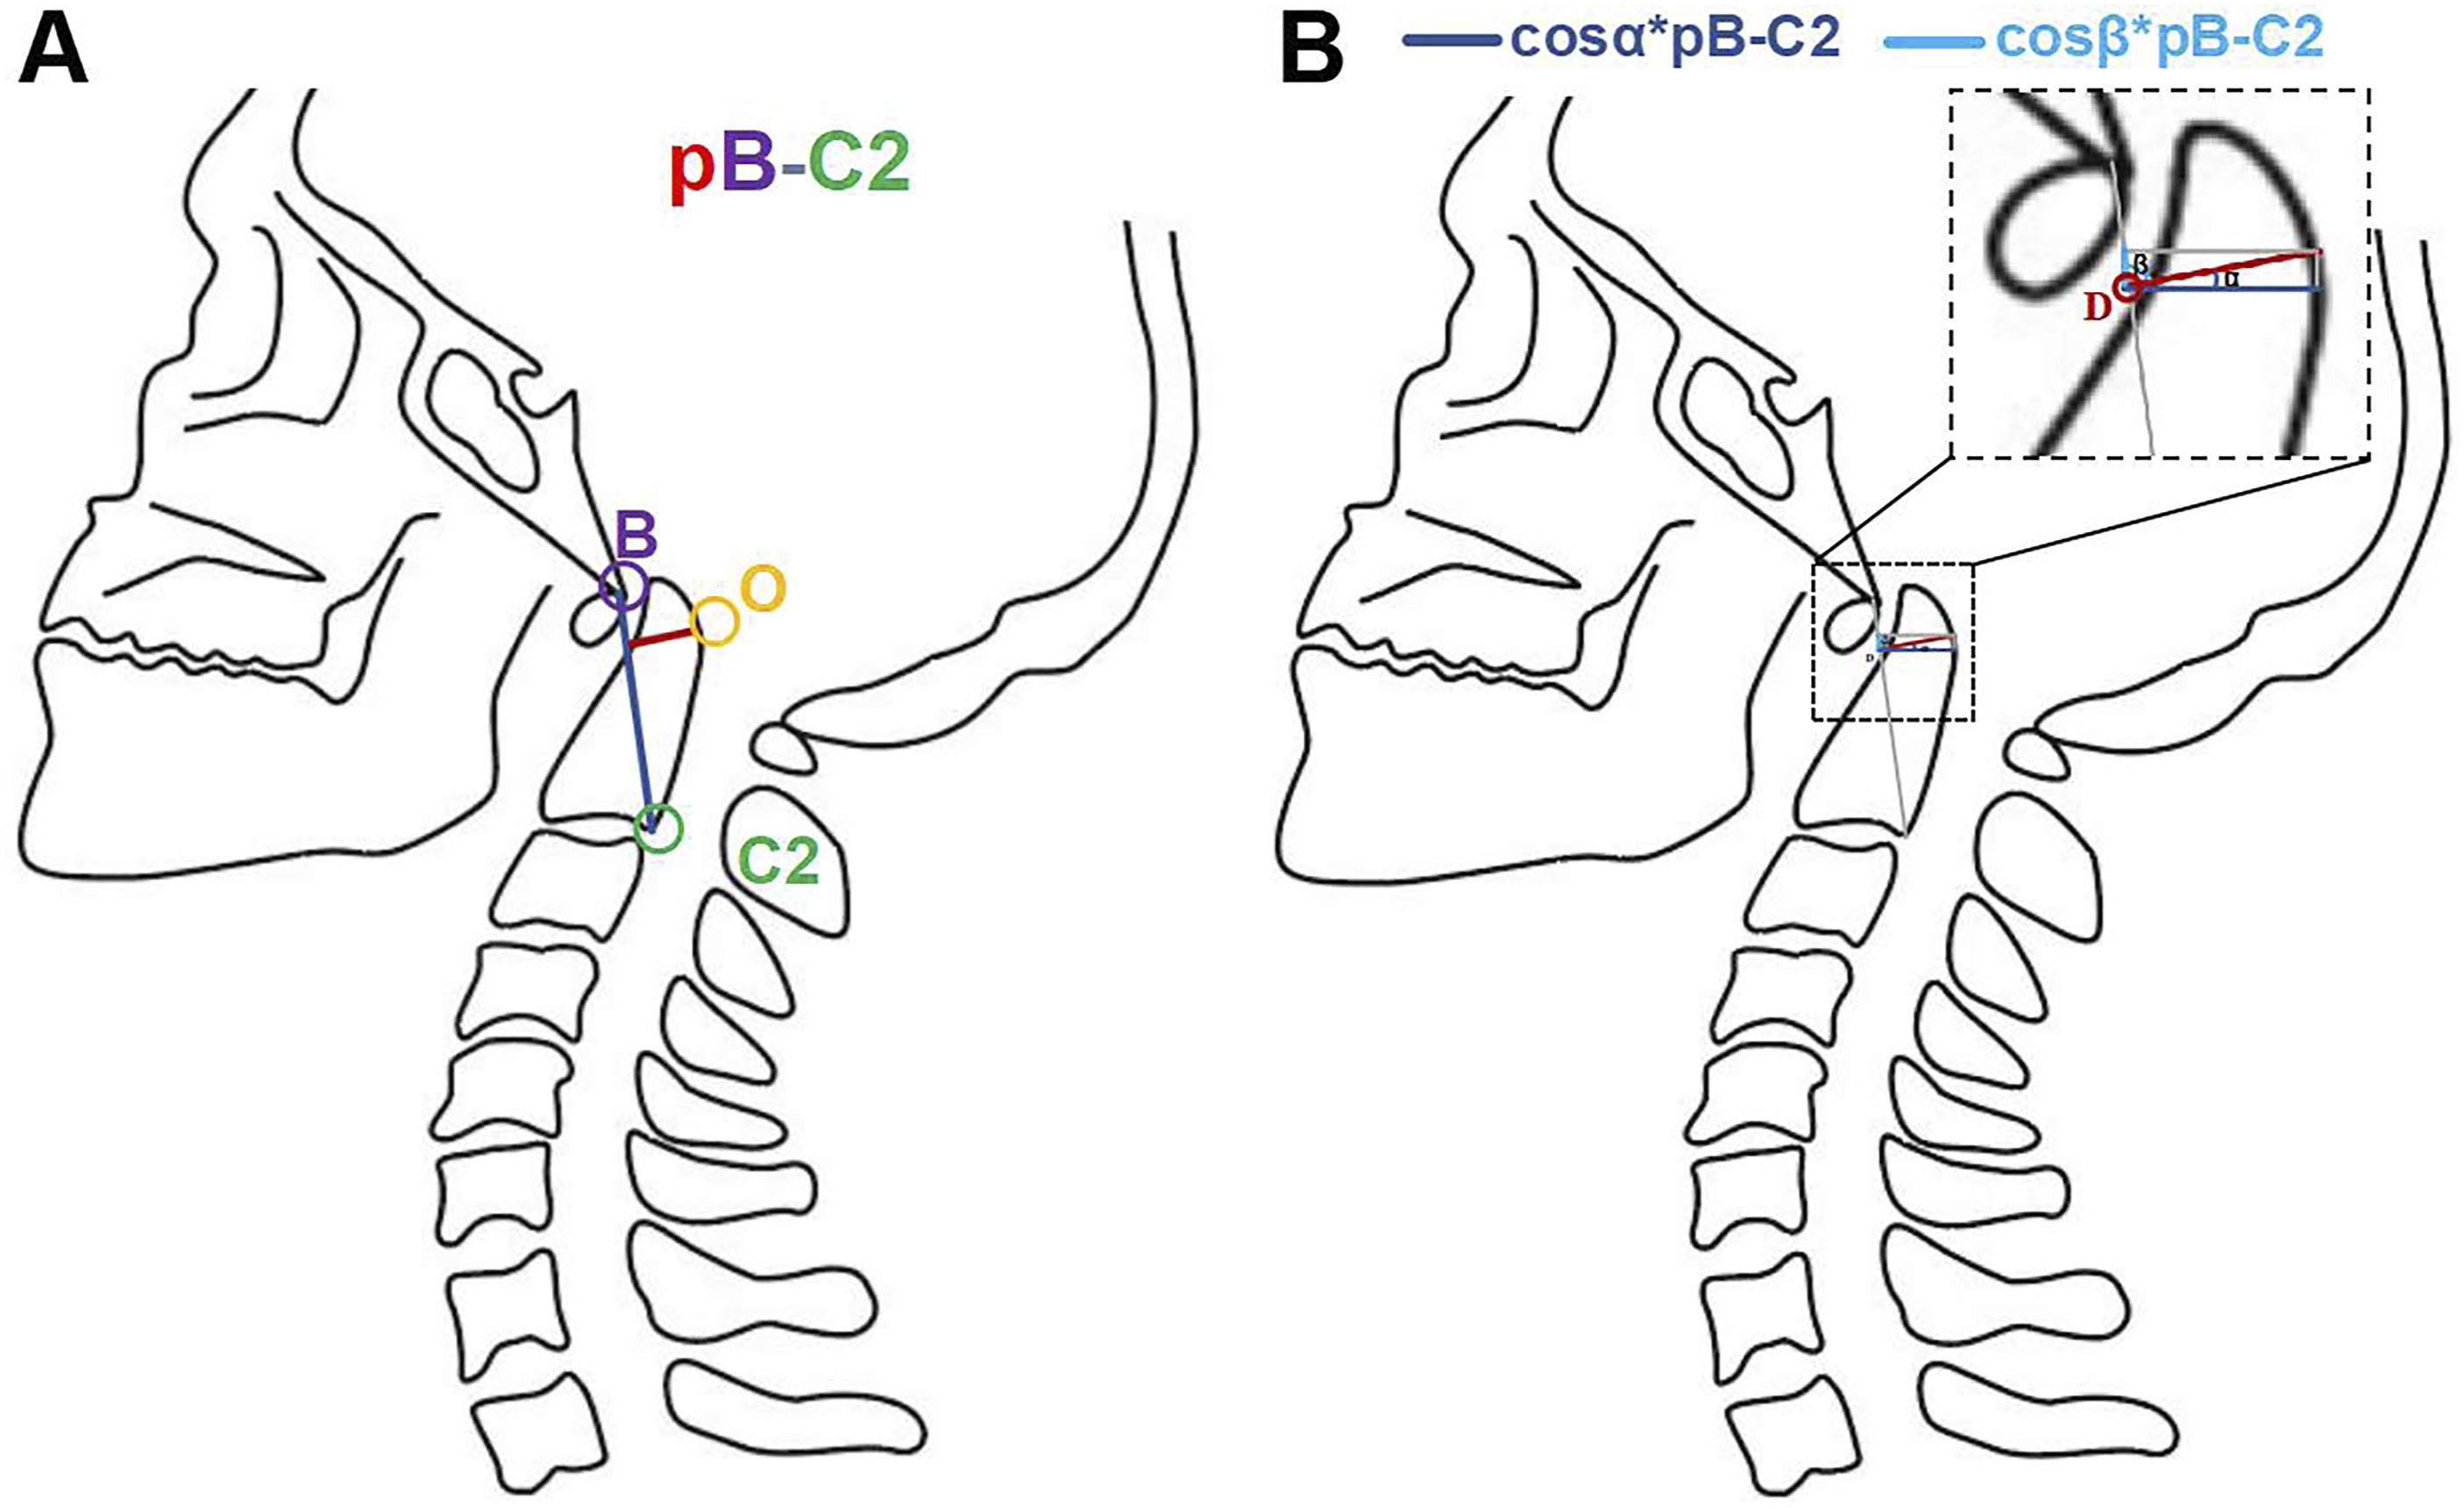
Unlike MRI-based measurements, which often depend on soft-tissue landmarks and are variable due to decompression effects or postoperative tissue remodeling,19,20 pB-C2 relies solely on fixed bony landmarks, offering greater reproducibility and intraoperative feasibility. For this reason, the pB-C2 method was adopted to ensure measurement consistency and accuracy.
19
In cases involving C2–C3 fusion, commonly observed in congenital BI, the C2 reference point was determined by drawing a line through any remaining intervertebral disc tissue at the fusion site and identifying its intersection with the posterior surface of the fused vertebral complex (Figure 2). Approach to the Measurement of pB-C2 in Patients With C2-C3 Fusion. A White Line Indicates the Intervertebral Disc Residue at the C2-C3 Vertebral Fusion Site. The C2 Point was Defined as the Point Where This Line Intersects With the Posterior Wall of the Fused Vertebrae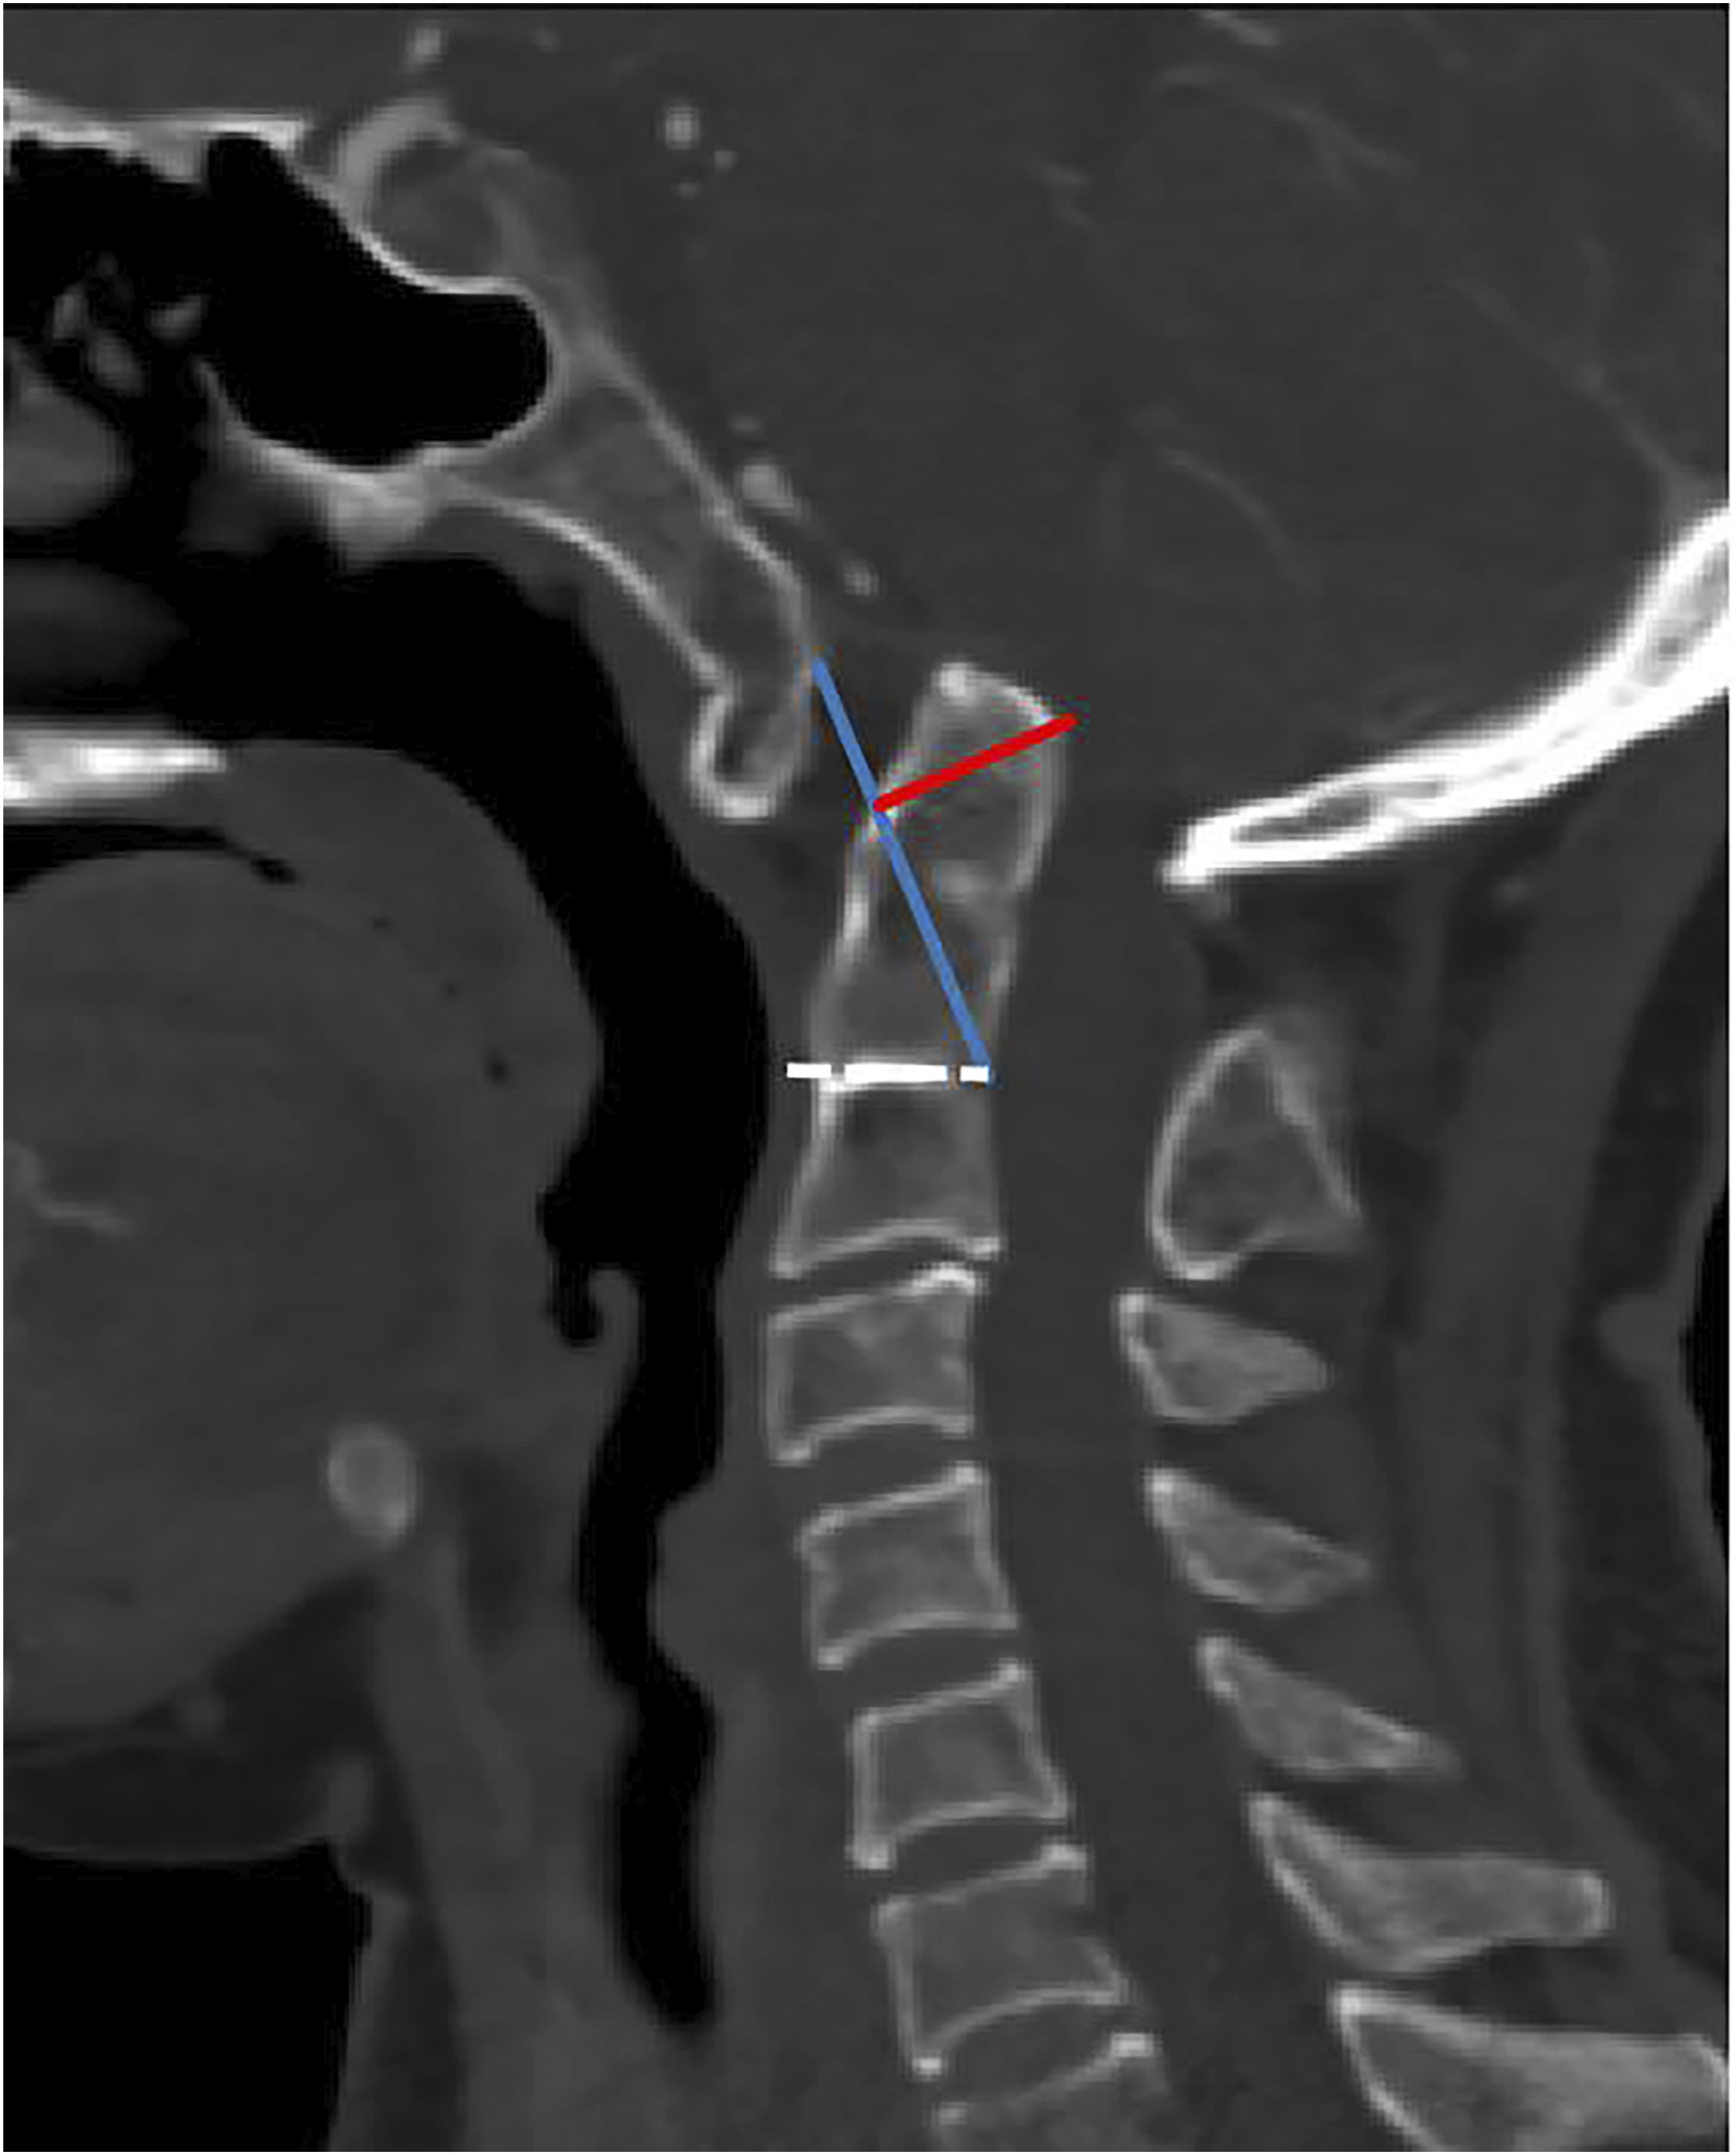
All radiological parameters were measured and analyzed using the Advantage Workstation (ADW; GE Healthcare, USA). The α angle was measured independently by 2 experienced spine surgeons. Each examiner conducted the measurements in 3 separate sessions at one-week intervals, and the mean value of their measurements was used as the final result. The CT scans were obtained using either a 64-slice or 256-slice spiral CT scanner (Somatom Series, Siemens, Germany). The scanning parameters included a slice thickness and interslice spacing of 0.625 mm, with measurement accuracies of 0.1 mm for distance measurements and 0.1° for angular measurements.
To evaluate brainstem compression, the CMA was measured on T2-weighted sagittal MRI. The CMA was defined as the angle formed between a line parallel to the anterior surface of the medulla oblongata and a second line drawn along the anterior surface of the upper cervical spinal cord. 5
Statistical Analyses
All statistical analyses were performed using SPSS version 22.0 (IBM Corp., USA) and GraphPad Prism version 10.1.2 (GraphPad Software, USA). Data normality was evaluated using the Shapiro–Wilk test. Continuous variables were expressed as mean ± standard deviation (SD) and analyzed using paired-sample t-tests, independent-sample t-tests, or the Mann–Whitney U test, as appropriate. Categorical variables were presented as counts and percentages, and compared using the chi-squared test or Fisher’s exact test. In the observation group, correlations between continuous variables before and after surgery were assessed using Pearson’s or Spearman’s correlation coefficients, depending on the data distribution. Linear regression analysis was performed to determine the predictive value of imaging parameters. A P-value <0.05 was considered statistically significant.
Results
Baseline Characteristics
Characteristics of Patients in the Observation and Control Groups
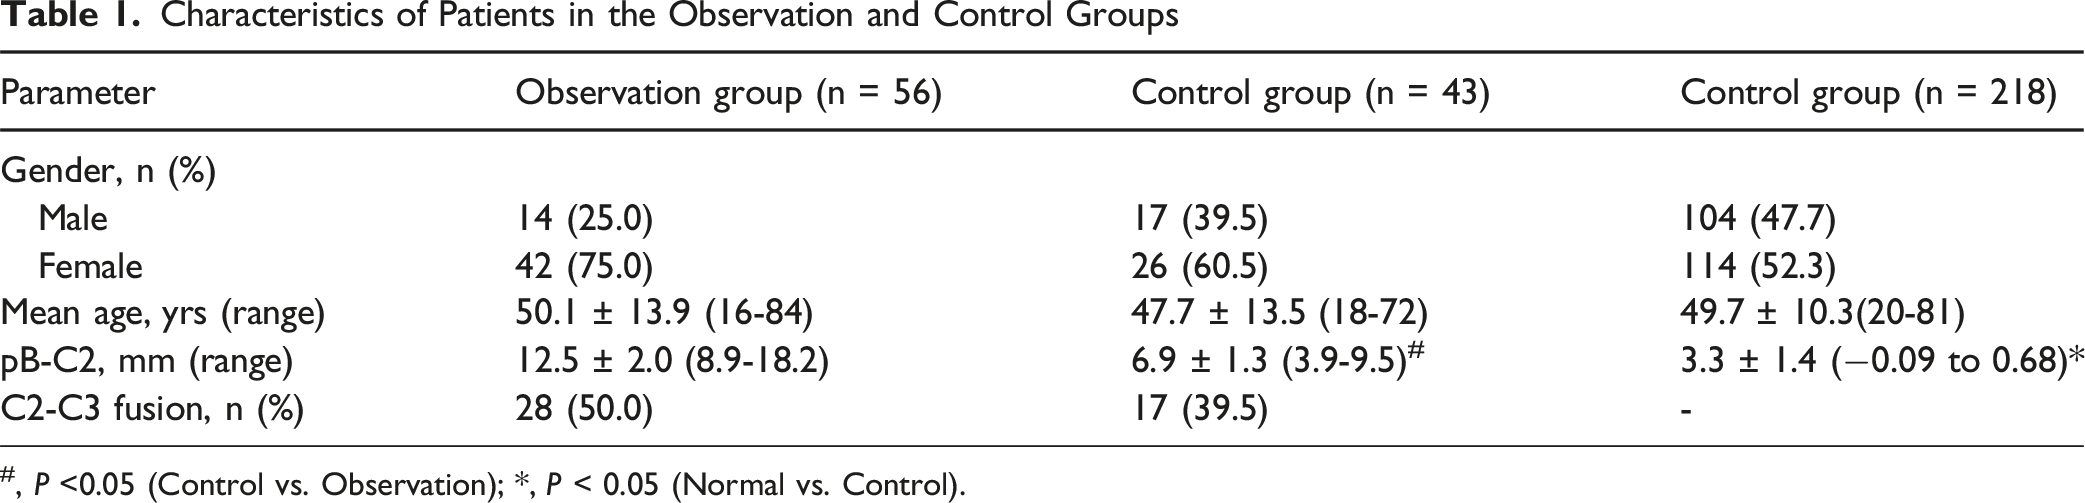
#, P <0.05 (Control vs. Observation); *, P < 0.05 (Normal vs. Control).
Neurological Function
At the final follow-up, patients in the observation group displayed significant neurological improvement. The mean JOA score increased significantly from 12.2 ± 1.9 (range: 7-16) preoperatively to 14.7 ± 1.6 (range: 10-17) postoperatively (P < 0.001). Among the 56 patients, 44 (78.6%) achieved satisfactory functional recovery, including 7 with excellent improvement and 37 with good improvement. The remaining 12 patients (21.4%) had unsatisfactory outcomes, comprising 8 with fair and 4 with poor recovery.
Radiological Findings
Intrarater and Interrater Reliability of Angle α Measurement
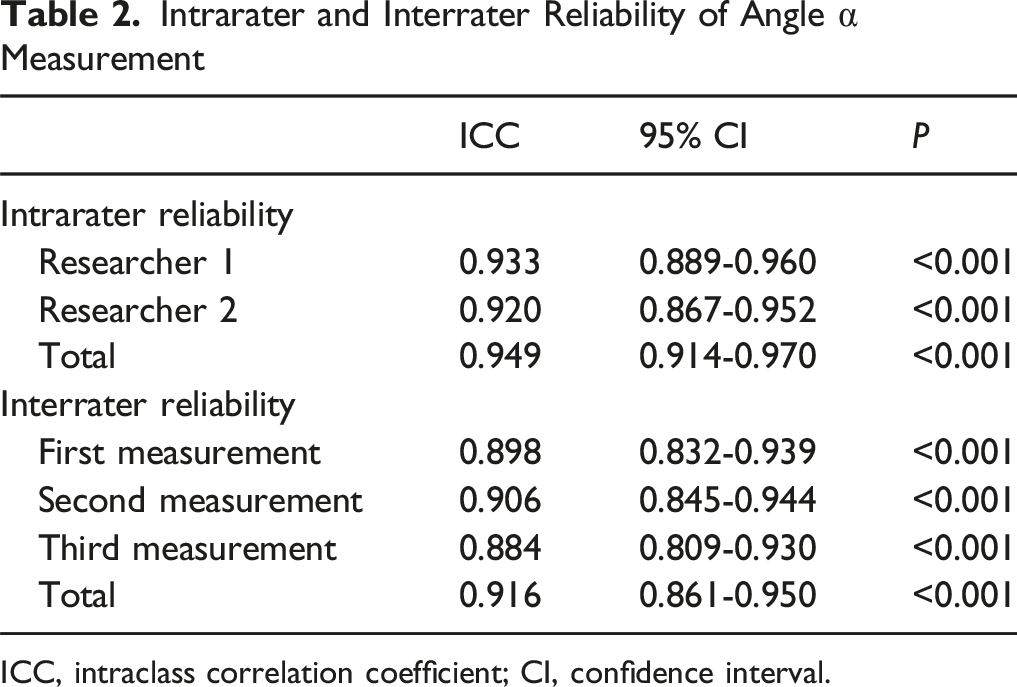
ICC, intraclass correlation coefficient; CI, confidence interval.
In the normal group, the mean pB-C2 value was 3.3 ± 1.4 mm (range: −0.09–6.8 mm), which was significantly lower than that of both the control and observation groups (P < 0.001 for both comparisons). Preoperatively, the mean pB-C2 in the observation group was 12.5 ± 2.0 mm (range: 8.9-18.2 mm), significantly higher than the control group mean of 6.9 ± 1.3 mm (range: 3.9-9.5 mm) (P < 0.001). Only one patient in the observation group showed a preoperative pB-C2 value (8.9 mm) within the control range.
Preoperative and Postoperative Clinical and Imaging Outcomes in The Observation Group
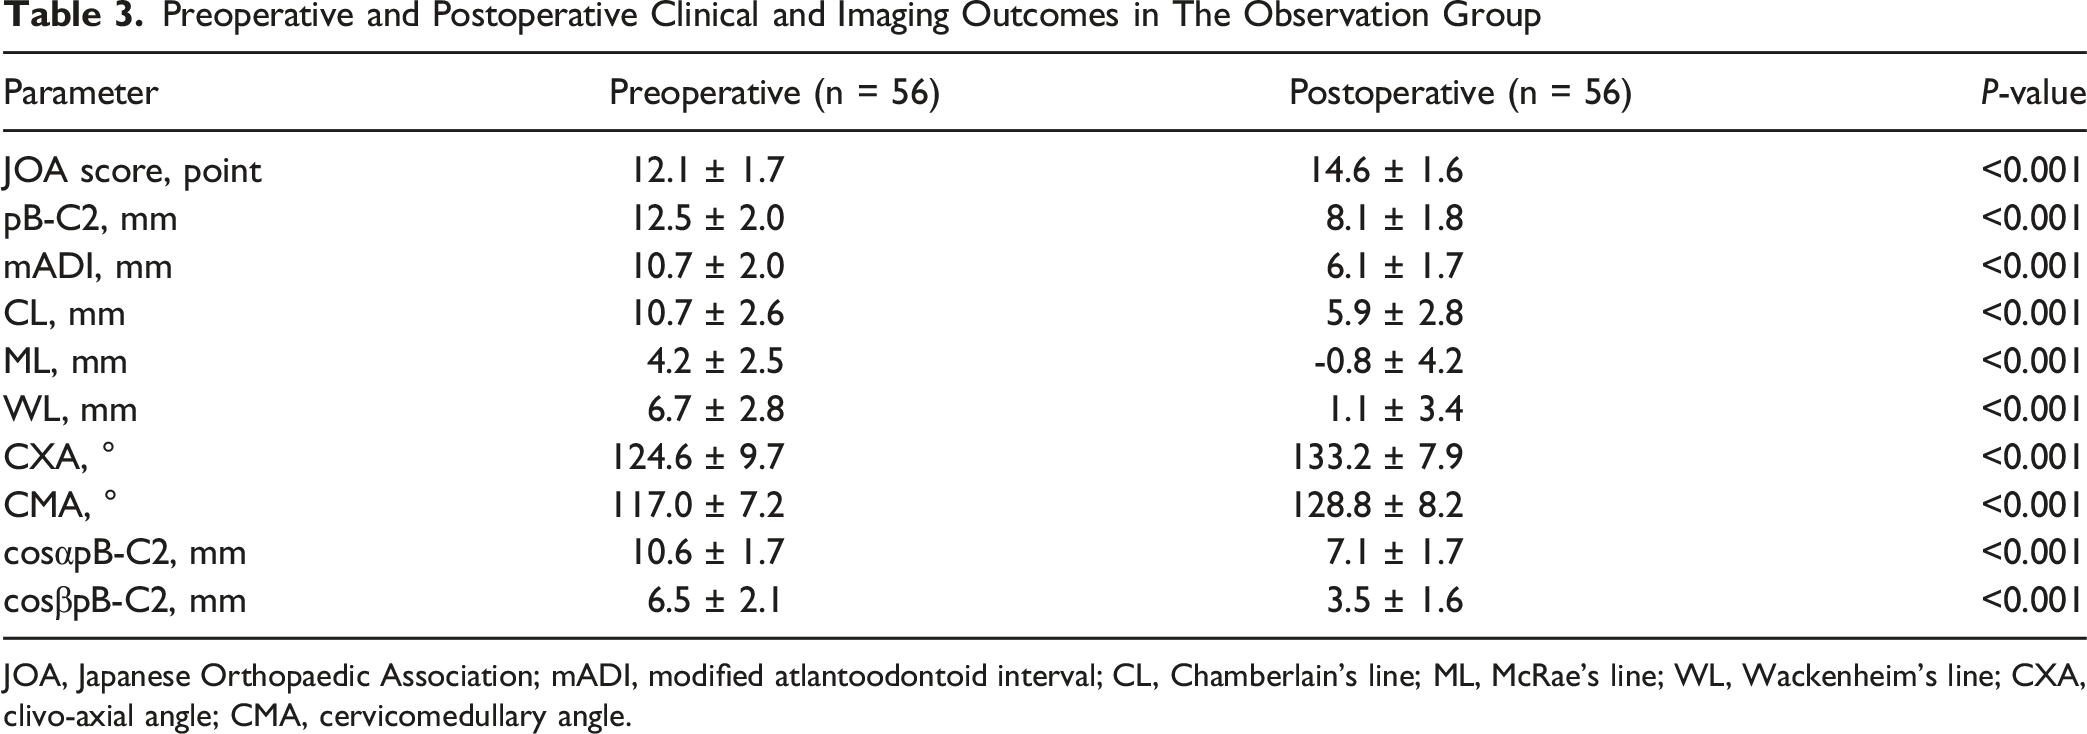
JOA, Japanese Orthopaedic Association; mADI, modified atlantoodontoid interval; CL, Chamberlain's line; ML, McRae’s line; WL, Wackenheim’s line; CXA, clivo-axial angle; CMA, cervicomedullary angle.
Comparisons Between Patients With Satisfactory and Unsatisfactory Neurological Improvement in The Observation Group
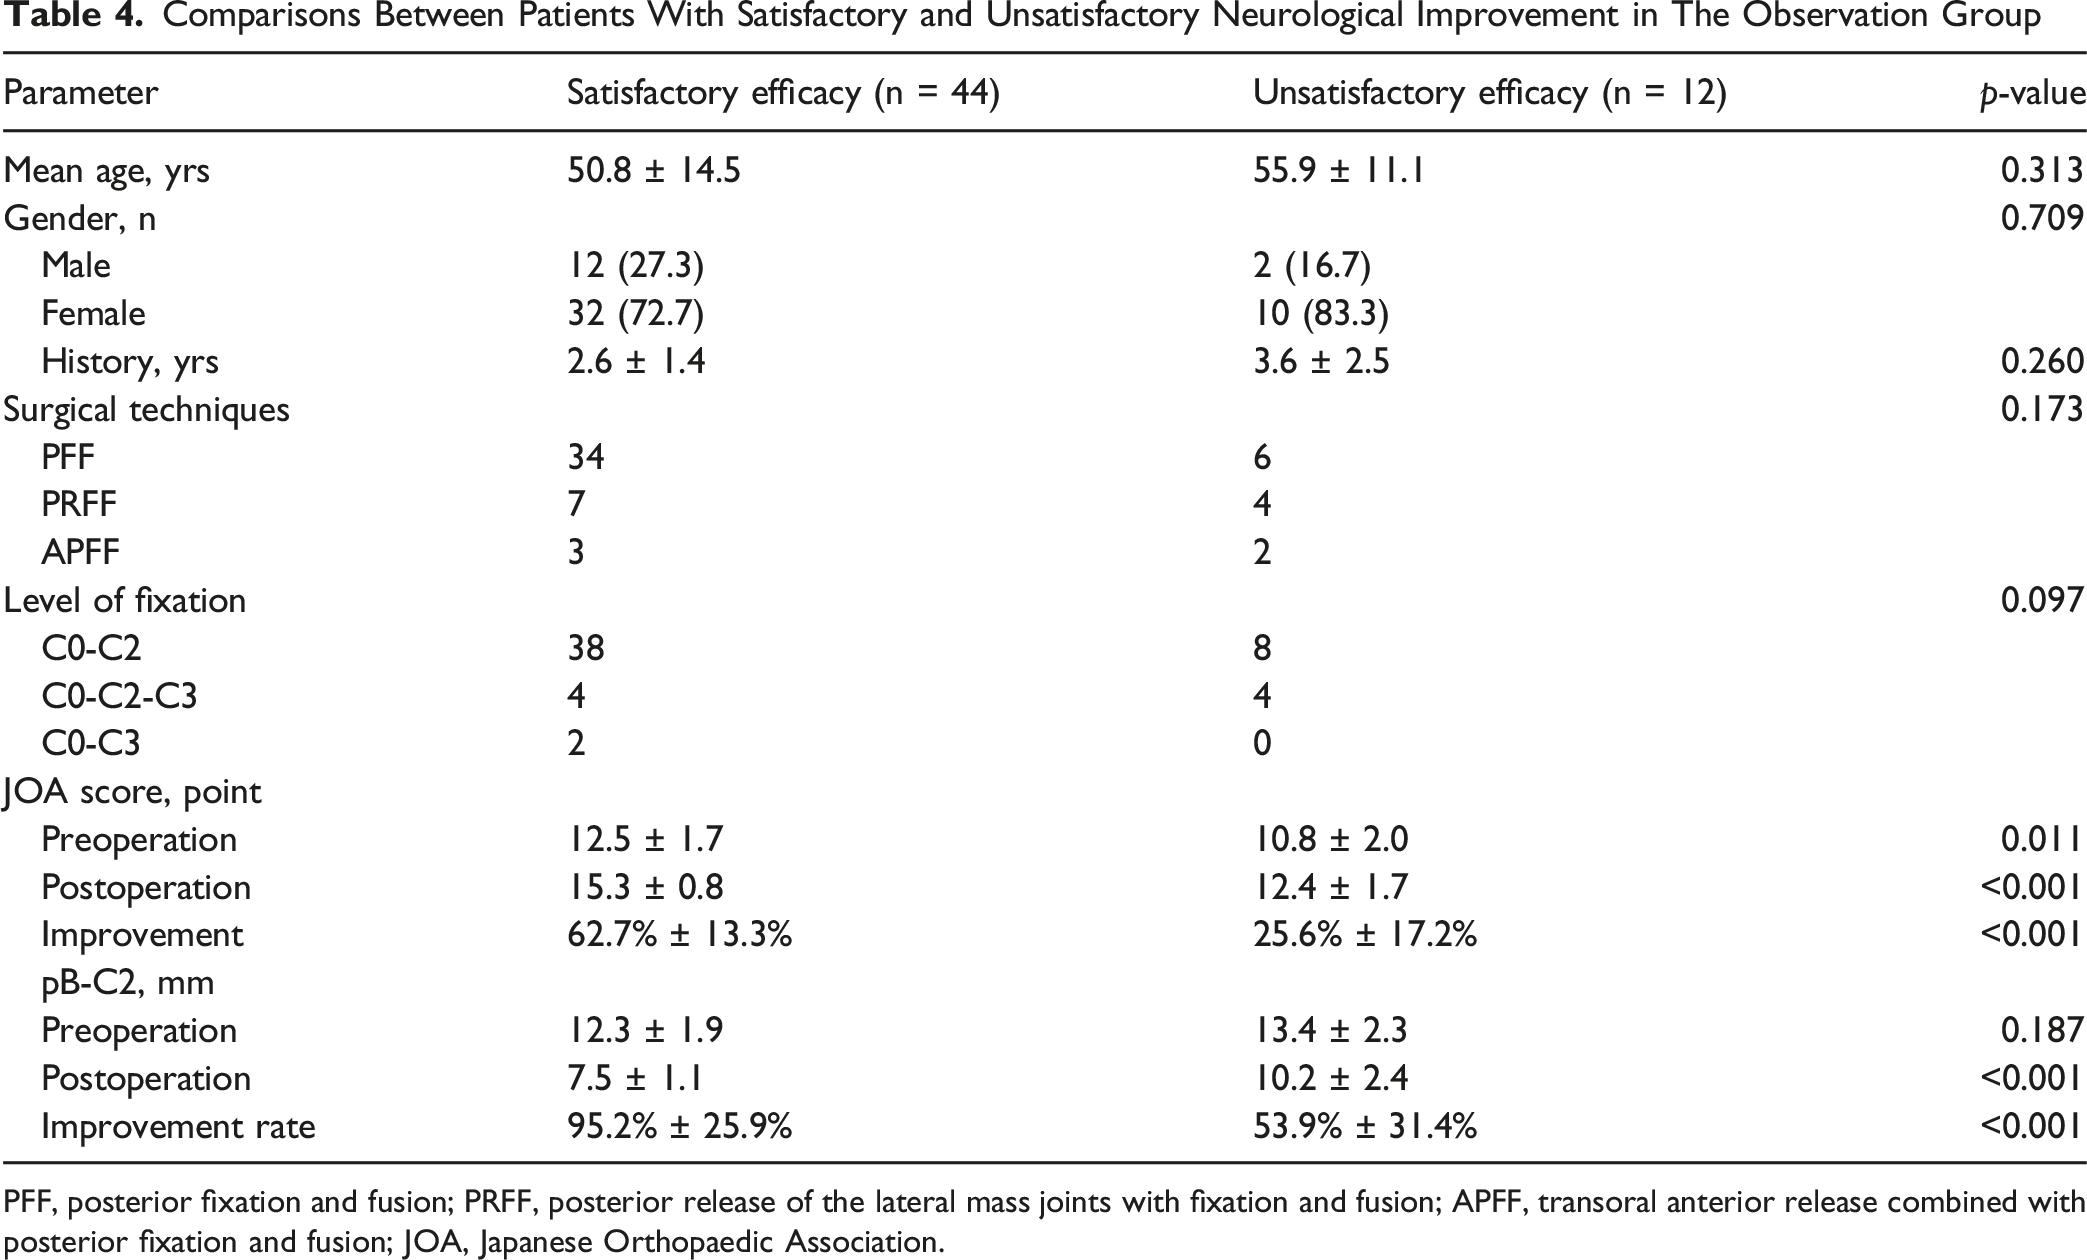
PFF, posterior fixation and fusion; PRFF, posterior release of the lateral mass joints with fixation and fusion; APFF, transoral anterior release combined with posterior fixation and fusion; JOA, Japanese Orthopaedic Association.
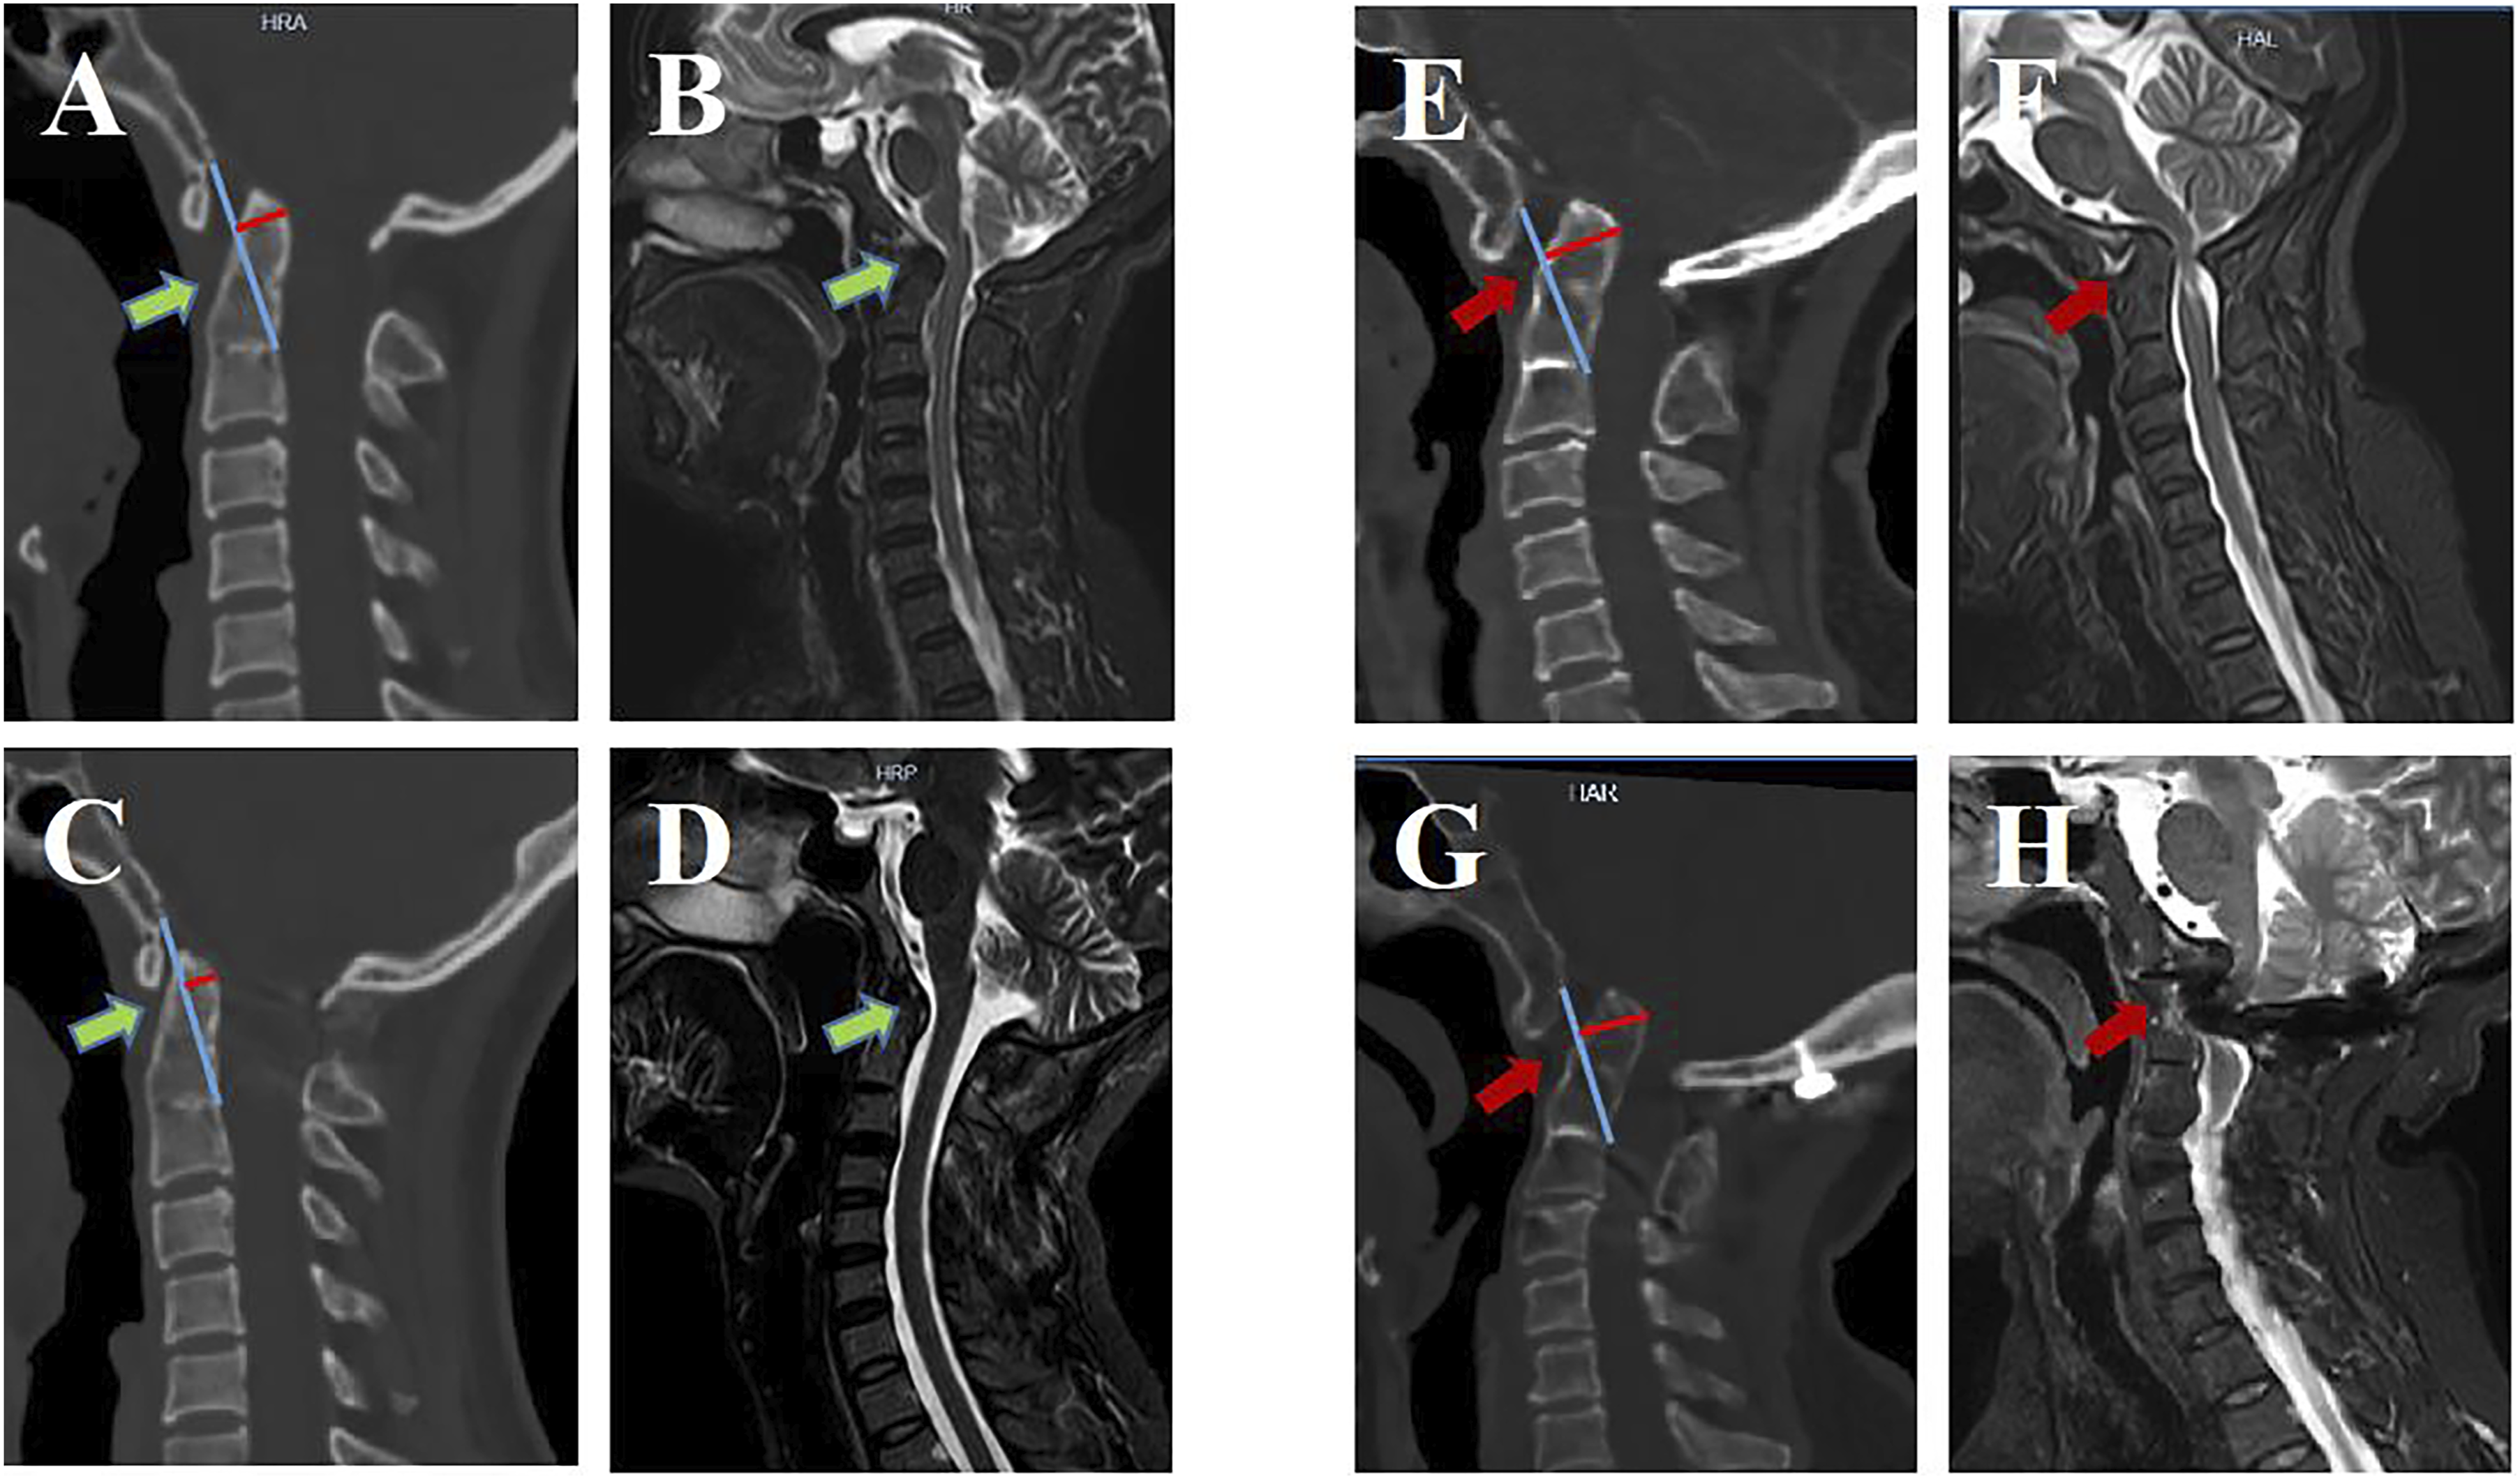
Preoperative and Postoperative CT and MRI Images From Two Type A BI Patients. (A) Preoperative CT Scans From the First Patient (Female With Type A BI) Showed a pB-C2 of 10.4 mm. Preoperative MRI Revealed Spinal Cord Compression With a CMA of 130.6°. At One Week Post-surgery, CT Scanning Revealed a Reduction in pB-C2 to 6.1 mm, While MRI Demonstrated a CMA of 159.4°. Over a 30-Month Follow-Up Interval, the JOA Score Improved From 15 to 17 Points, Corresponding to a 100% Improvement Rate. (B) Preoperative CT Scans From the Second Patient (Female With Type A BI) Showed a pB-C2 of 18.9 mm, while MRI Scans Revealed Spinal Cord Compression With a CMA of 121.2°. Three Days Postoperatively, CT and MRI Scans Revealed a pB-C2 of 16.7 mm, Corresponding to an 18.3% Improvement Rate and a CMA of 124.7°. Over a 36-Month Follow-Up Interval, JOA Scores Improved From 13 to 14, Corresponding to an Unsatisfactory 25% Improvement Rate (<50%)
Correlation, Regression, and ROC Analyses
Correlation analyses confirmed the effectiveness of pB-C2 and its directional derivatives (cosα·pB-C2 and cosβ·pB-C2) in evaluating both the anterior–posterior and vertical components of AAD reduction. Significant correlations were identified between cosα·pB-C2 and mADI, as well as between cosβ·pB-C2 and the vertical displacement parameters ML, CL, and WL, both preoperatively and postoperatively, except for preoperative CL (Figure 4). Outcomes From Correlation Analyses Exploring the Relationships Between cos α*pB-C2 and mADI, and Between cos β*pB-C2 and CL, ML, and WL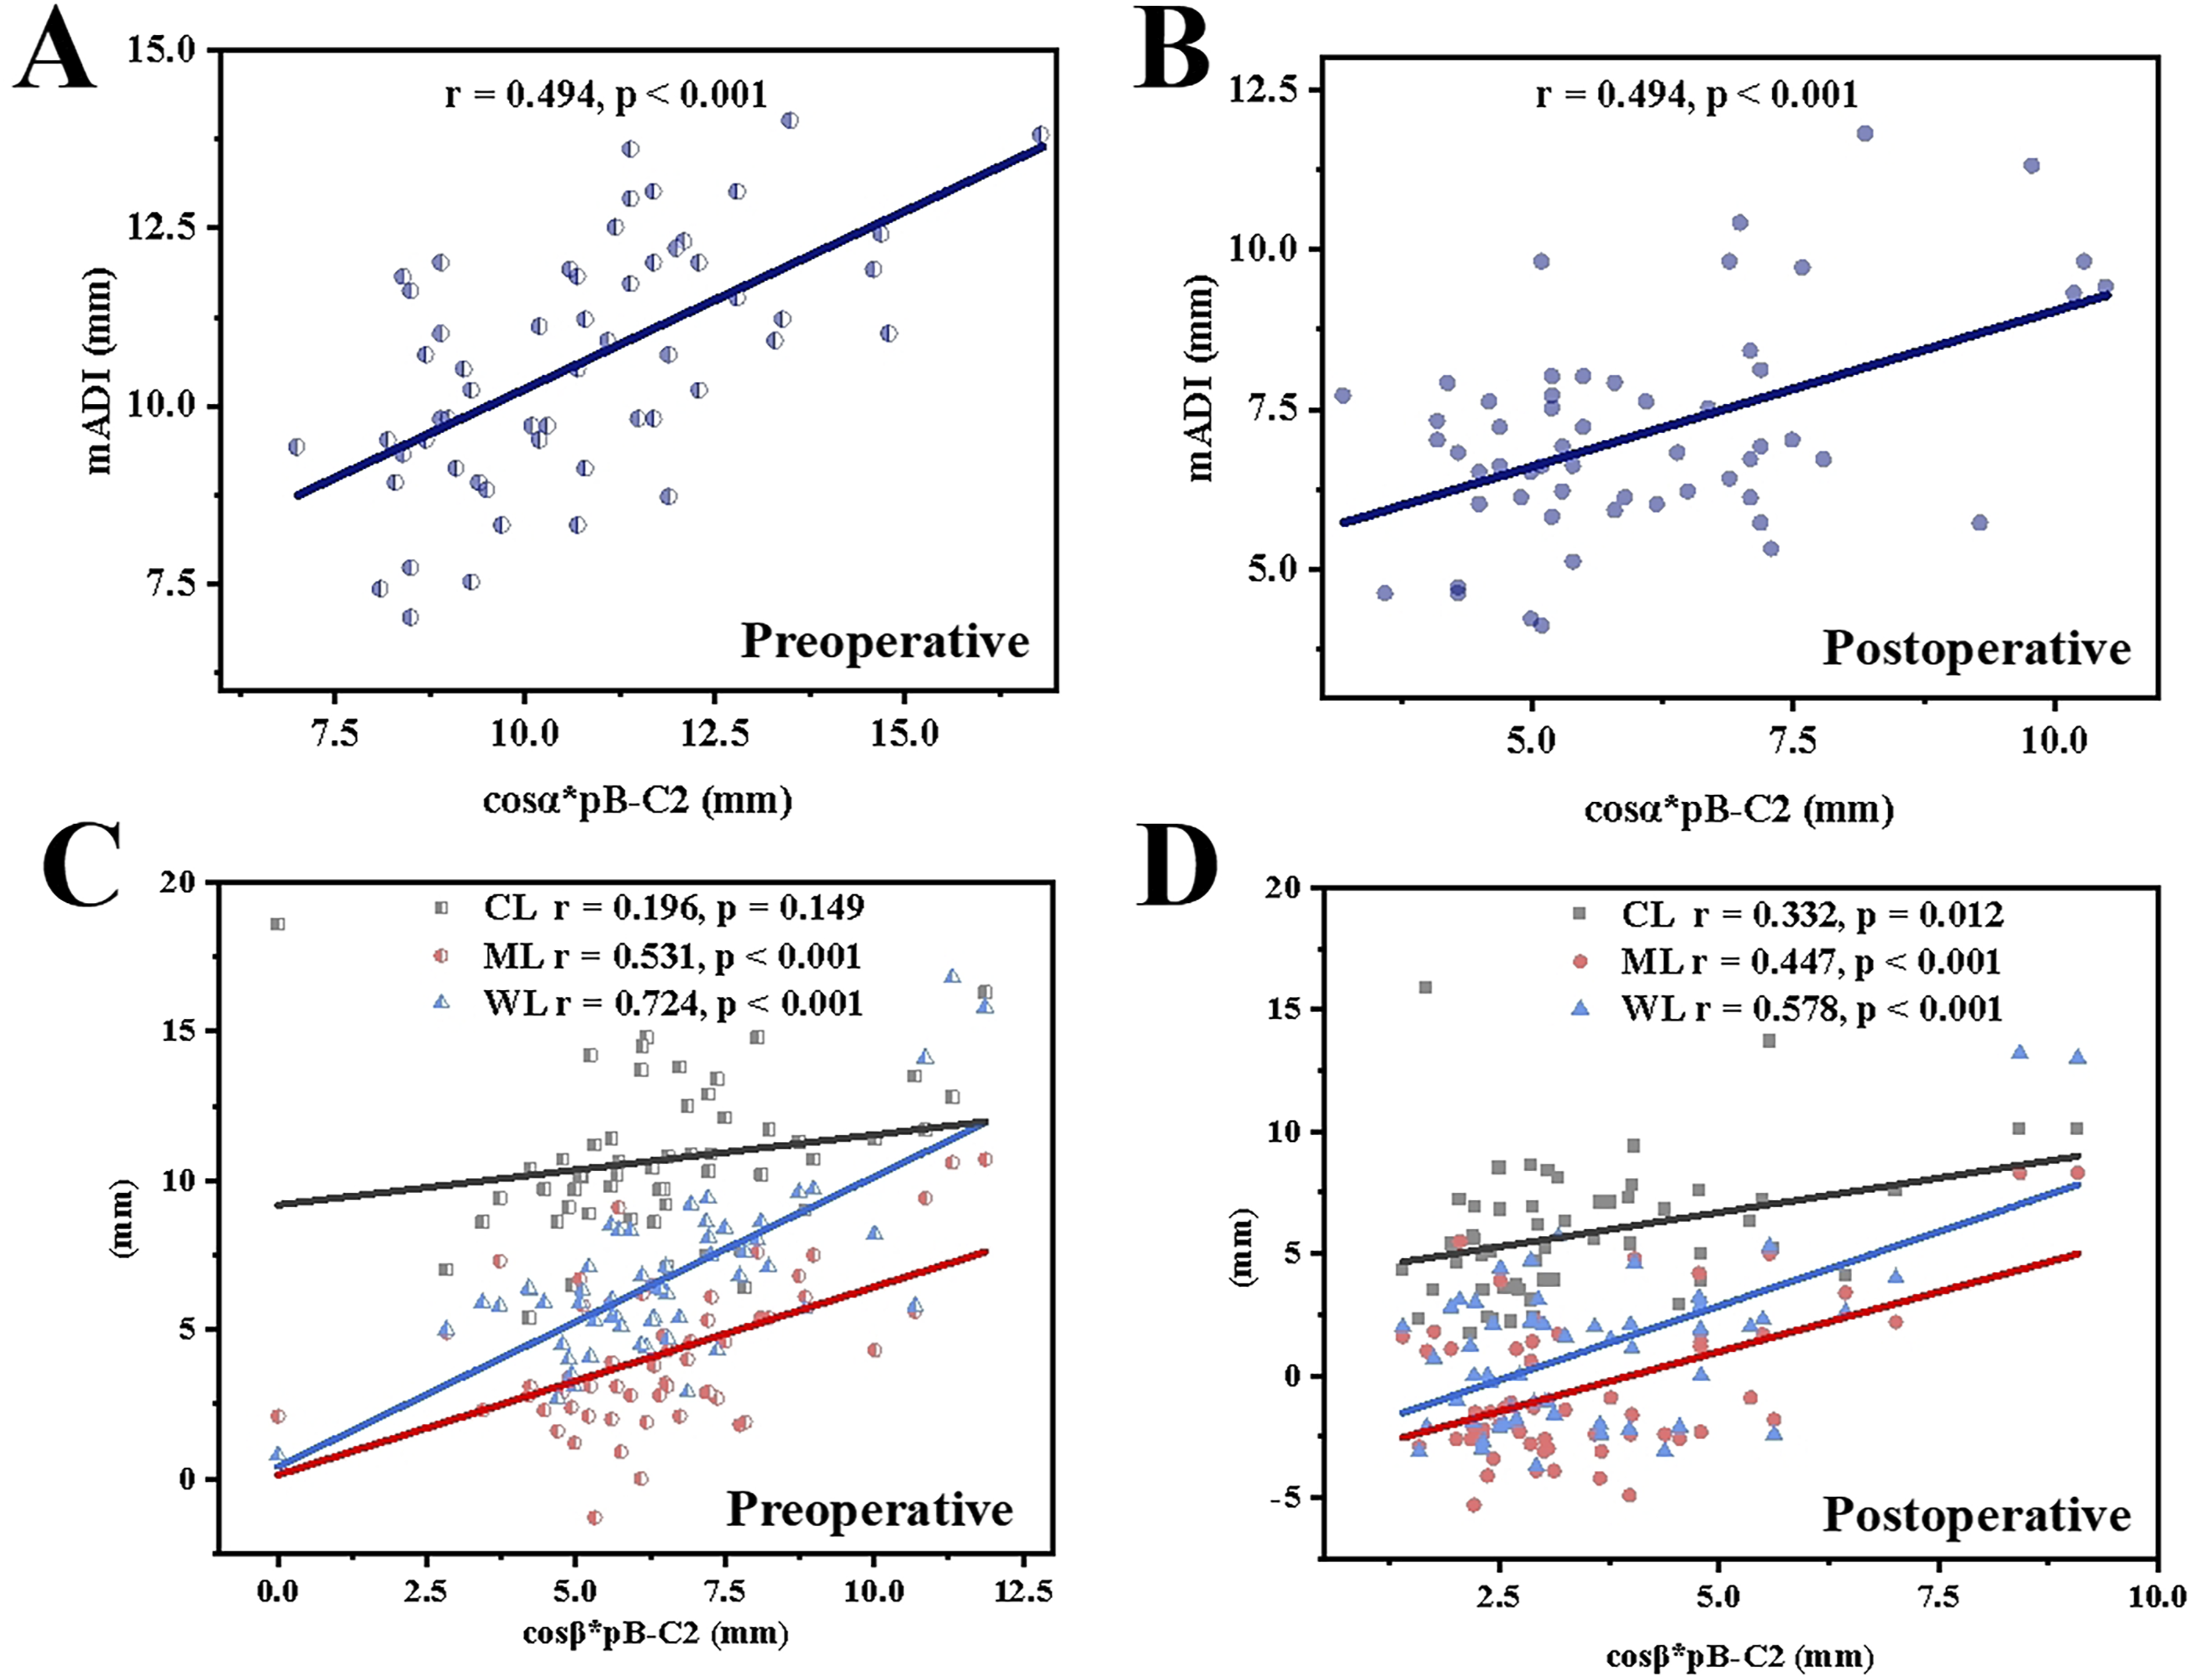
Analyses of Correlations Between Specific Parameters, JOA Score Improvement Rates, and Postoperative CMA in the Observation Group
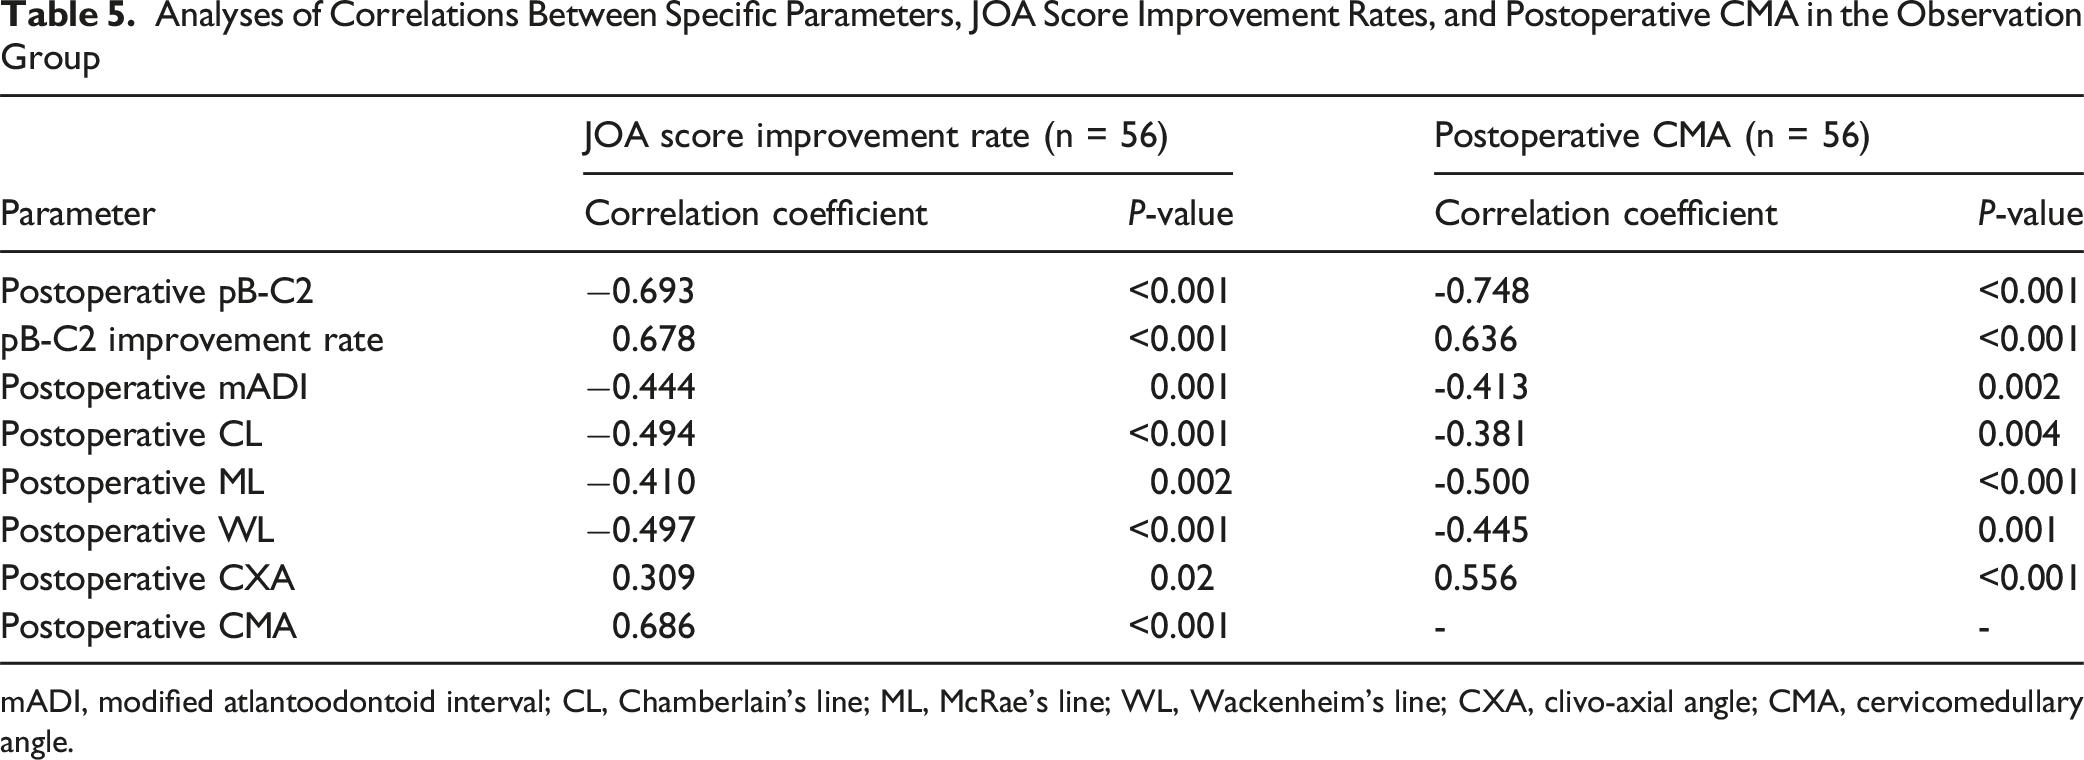
mADI, modified atlantoodontoid interval; CL, Chamberlain’s line; ML, McRae’s line; WL, Wackenheim’s line; CXA, clivo-axial angle; CMA, cervicomedullary angle.
Linear regression analysis further indicated that a postoperative pB-C2 value below 8.7 mm or a pB-C2 improvement rate exceeding 75.6% predicted a favorable neurological outcome, defined as a JOA improvement rate of ≥50% (Figure 5A and B). The ROC curve analysis revealed AUCs of 0.879 and 0.890 for postoperative pB-C2 and pB-C2 improvement rate, respectively. The optimal Youden’s index (sensitivity + specificity – 1) was achieved when the postoperative pB-C2 reached 8.4 mm or the improvement rate was 80.0% (Figure 5C and D). (A, B) Results of Linear Regression Analyses Assessing the Relationship Between pB-C2 and the JOA Score Improvement Rates. (C, D) Results of ROC Analysis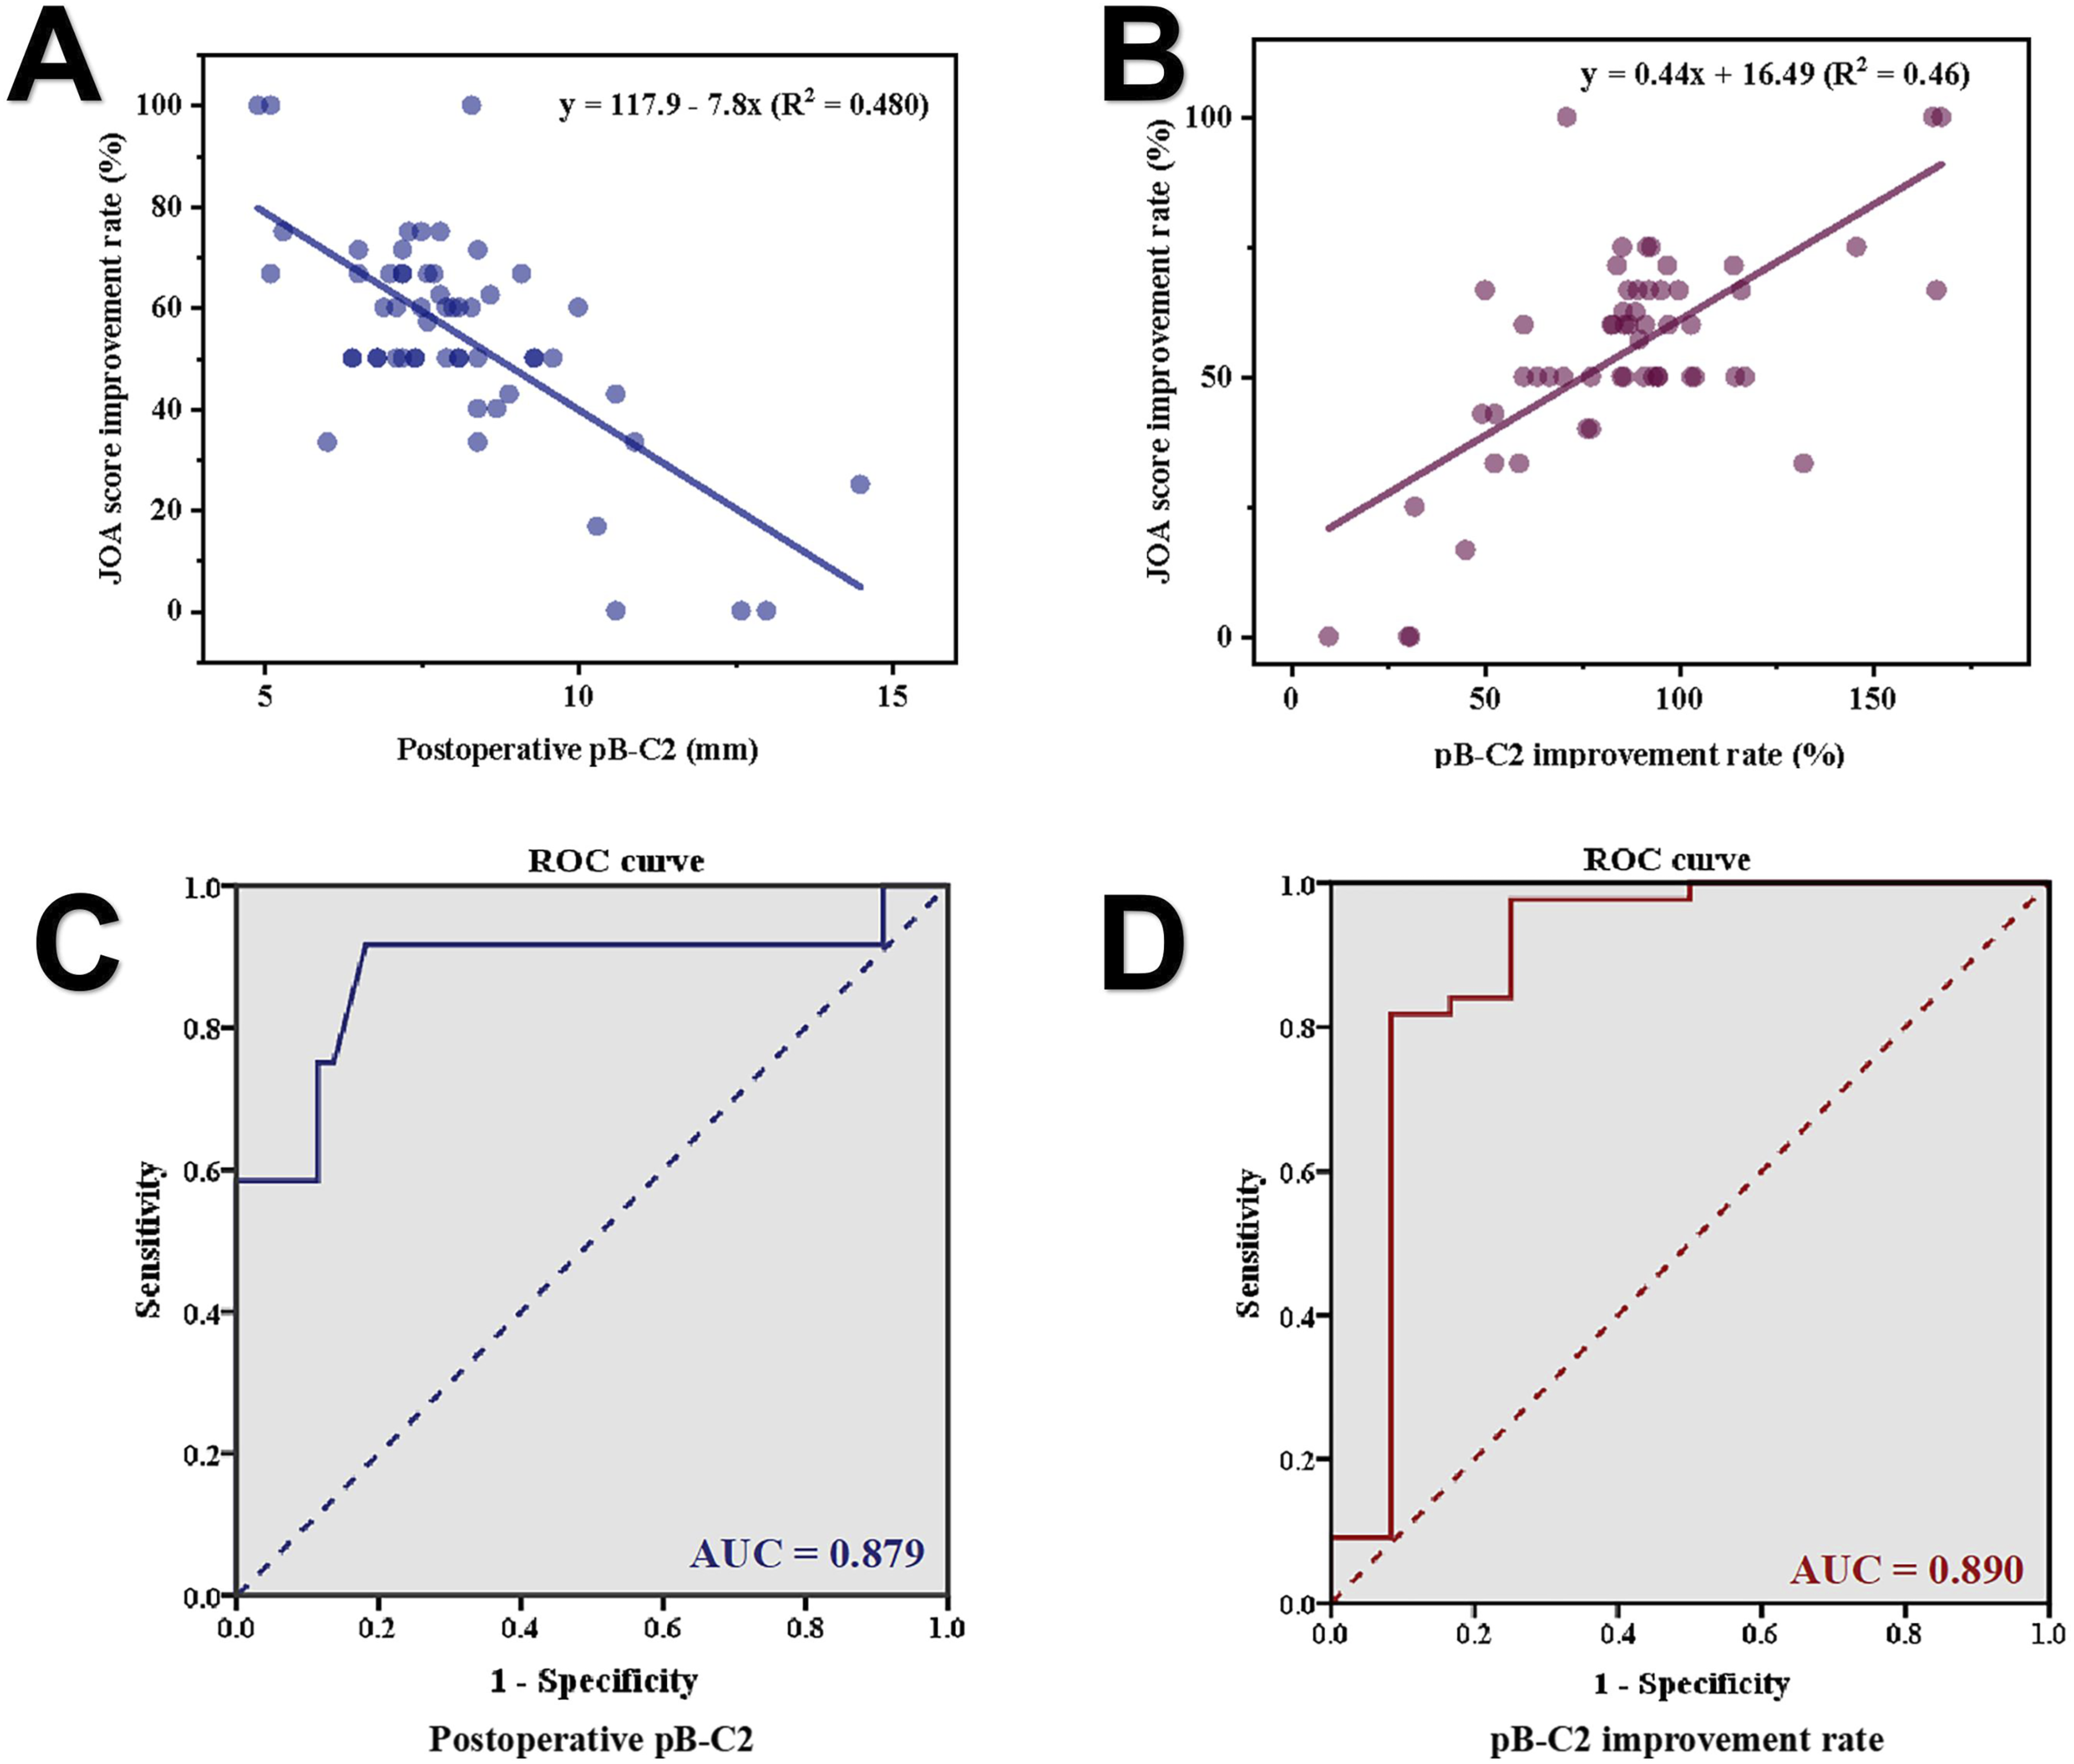
Discussion
In type A BI, reduction of a AAD inherently produces anterior decompression of the brainstem. Various imaging parameters have been proposed to evaluate the adequacy of this reduction. Among these, the CXA, defined as the intersection of Wackenheim’s clival line with the posterior surface of the odontoid process and the axis, is one of the most commonly used indicators. The CXA primarily reflects the posterior sagittal tilting of the axis relative to the clivus or foramen magnum. However, it fails to adequately represent the superior and posterior translation of the odontoid tip in relation to the clivus.
Several modified CXA-derived parameters, such as the clivodens angle (CDA) 21 and the clivopalate angle (CPA), 15 inherit similar limitations. Importantly, a study conducted by Wei et al 9 reported no significant correlation between CXA and postoperative improvement in JOA scores in patients with type A BI. This suggests that CXA alone may not reliably predict successful decompression or neurological recovery following surgery.
Traditionally, anterior–posterior and vertical displacements of the odontoid process have been assessed using a combination of parameters, including the ADI or its modified form, along with the distances from the odontoid tip to ML, CL, and WL. Because BI is frequently accompanied by complex, often asymmetric CVJ anomalies, surgeons typically rely on multiple complementary indices to assess the adequacy of reduction.11-13
However, clinical observations have revealed significant inconsistencies in these traditional metrics. For instance, some patients achieve satisfactory decompression and neurological recovery despite having an ADI greater than 5 mm, whereas others with an ADI below 3 mm continue to experience ventral compression. Similarly, postoperative measurements such as ML >3 mm or CL >5 mm may still be associated with favorable decompression and functional outcomes. These discrepancies underscore the limitations of conventional parameters in accurately determining the adequacy of reduction and decompression during surgery, particularly in patients with pronounced skeletal abnormalities of the CVJ.
Given these limitations, there is a clear need for a reliable, straightforward parameter that directly quantifies the degree of anterior compression or decompression. Craniocervical volume, calculated from 3D CT reconstructions, has been identified as a highly sensitive indicator of ventral brainstem compression resulting from odontoid displacement. Previous work by Wei et al 9 highlighted the clinical value of this metric for assessing compression severity and predicting postoperative neurological recovery in patients with BI. However, the labor-intensive nature and technical complexity of 3D volume reconstruction limit its feasibility for routine intraoperative or real-time surgical assessment.
The pB-C2 distance has traditionally been utilized to evaluate odontoid retroflexion and posterior axial rotation in the sagittal plane, particularly in patients with type B BI or Chiari malformation. In these conditions, it is recognized as a highly sensitive and direct indicator of ventral brainstem compression. Owing to its definition relative to anatomical reference lines that delineate the spatial relationship between the odontoid process and the clivus, pB-C2 also indirectly reflects the posterior and vertical displacement of the odontoid.
Previous studies have demonstrated that type A BI is associated with progressive worsening of AAD and ventral brainstem compression over time, as posterior, superior, and sagittal rotations of the odontoid become more pronounced on CT imaging.2,22 Similarly, pB-C2 values increase in parallel with these deformities (Figure 6). Based on this rationale, it is proposed that pB-C2 is applicable not only to type B BI and Chiari malformation but also serves as a reliable parameter for assessing the severity and reduction of AAD and ventral compression in type A BI. Commonly Utilized Imaging Evaluation Parameters for Type A BI, and the Significance of pB-C2. (A) Modified ADI (mADI) was Used to Assess Posterior Displacement of the Odontoid (Anteroposterior Dislocation). CL, ML, and WL Were Used to Assess Upward Displacement of the Odontoid (Vertical Dislocation). CXA was Used to Assess Sagittal Posterior Rotation. (B) Posterior Displacement (Anteroposterior Dislocation), Upward Displacement (Vertical Dislocation), and Sagittal Posterior Rotation of the Odontoid Process During AAD Onset and Progression in Type A BI Patients, Leading to Increased pB-C2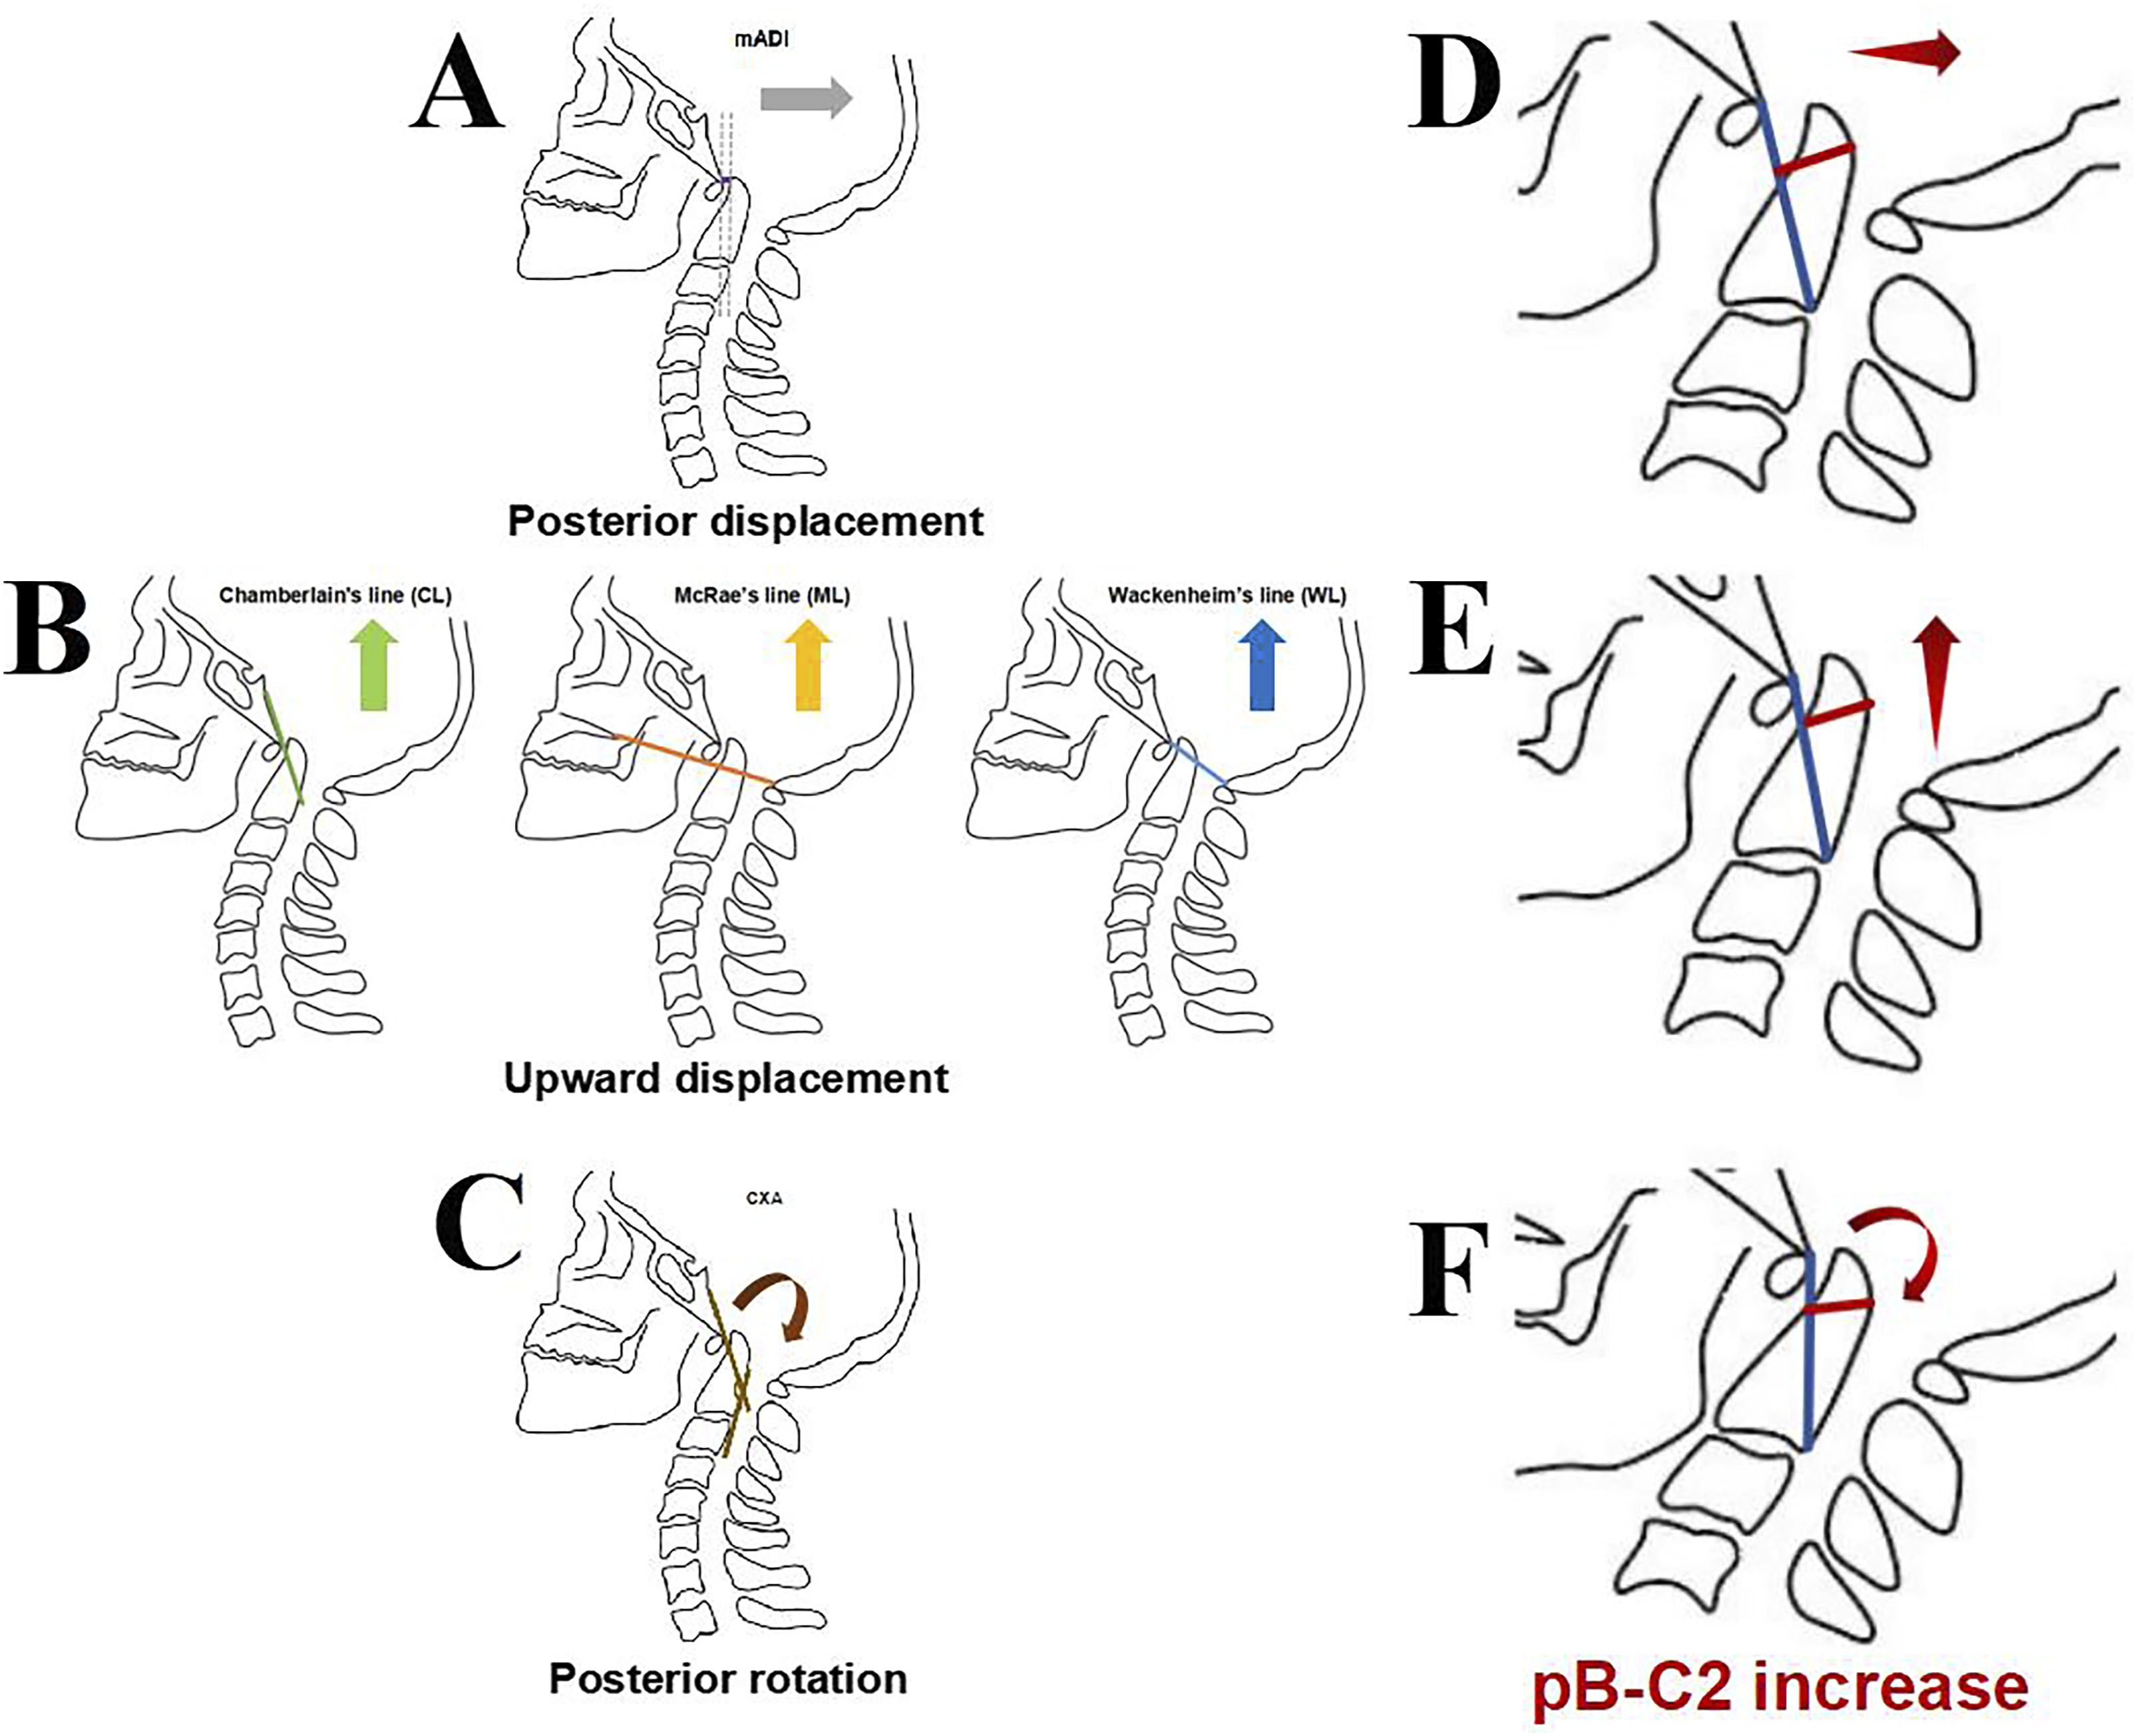
In the present study, a control group was incorporated to represent the typical CVJ alignment observed in pre-symptomatic or early-stage disease. The mean pB-C2 in the normal group was significantly smaller than that in the control group (3.3 mm vs 6.9 mm). Thus, attempting intraoperative reduction to match values within the normal range in type A BI may not only increase surgical difficulty but also risk over-reduction and potential lower cranial nerve injury. 23 Therefore, using the control group as a reference for anatomically satisfactory reduction may offer a more appropriate and clinically meaningful benchmark than comparison with a healthy population.
Consistent with this interpretation, the results of this study demonstrated a significantly higher mean pB-C2 value in the observation group than in controls (12.5 mm vs 6.9 mm, P < 0.001), supporting its robustness as an indicator of ventral brainstem compression in type A BI.
To evaluate whether pB-C2 could serve as a substitute for conventional parameters assessing anterior–posterior and vertical dislocation, the pB-C2 measurement was decomposed into 2 orthogonal components using trigonometric projection: cosα·pB-C2 to represent anterior–posterior dislocation and cosβ·pB-C2 to represent vertical dislocation. Both components demonstrated strong correlations with established radiological indices; cosα·pB-C2 correlated with the mADI, while cosβ·pB-C2 correlated with CL, ML, and WL. These relationships suggest that pB-C2 can serve as a single, comprehensive parameter for quantifying dislocation across both planes.
As the primary objective of surgical intervention in type A BI is to alleviate ventral compression and restore neurological function, the CMA, JOA score, and JOA improvement rate were employed as key outcome indicators. Correlation analyses revealed that postoperative pB-C2 values and their improvement rates were more strongly associated with postoperative CMA and JOA improvement than traditional parameters such as mADI, CL, ML, WL, or CXA. Patients who achieved satisfactory neurological recovery demonstrated significantly lower postoperative pB-C2 values and greater pB-C2 improvement compared with those who showed minimal or unsatisfactory recovery. These findings highlight the value of pB-C2 as a surrogate marker for evaluating surgical reduction and decompression efficacy and for predicting postoperative neurological outcomes in type A BI.
Given these advantages, pB-C2 may hold promise as an intraoperative assessment tool, particularly in settings where intraoperative CT imaging is available. Linear regression analysis indicated that achieving a postoperative pB-C2 value below 8.7 mm or a pB-C2 improvement rate exceeding 75.6% predicted favorable neurological recovery, defined as a ≥50% increase in JOA score. ROC curve analysis further supported these findings, yielding high AUCs of 0.879 for postoperative pB-C2 and 0.890 for its improvement rate. The Youden’s index reached its maximum at a postoperative pB-C2 of 8.4 mm, corresponding to an improvement rate of 80%, values consistent with the predictive thresholds derived from regression modeling.
Hankinson et al 16 reported comparable ICC values for pB-C2 measurements obtained from both MRI and CT, underscoring the complementary utility of these imaging modalities. MRI provides superior soft-tissue resolution, making it particularly valuable for evaluating the extent of ventral brainstem compression before and after surgery.16,19 However, CT is more practical and widely accessible for intraoperative assessment, especially in type A BI, where MRI use during surgery is often limited. CT imaging enables immediate, high-resolution visualization of osseous structures, which is clinically advantageous because soft tissue remodeling around the odontoid process typically lags behind bony correction and continues to evolve postoperatively. 20 Accordingly, in this study, pB-C2 measurements were obtained from mid-sagittal CT reconstructions to align with intraoperative requirements and to ensure accurate evaluation of reduction and decompression.
An alternative metric, known as the CVJ triangle area, has also been proposed to visualize ventral brainstem compression. 20 This parameter quantifies the two-dimensional space occupied by the odontoid process and adjacent soft tissue structures. However, several limitations restrict its intraoperative applicability. First, calculating the CVJ triangle area is more complex and time-consuming than measuring pB-C2. Second, it encompasses anatomical regions that do not necessarily correspond to the site of compression, reducing its specificity. Moreover, following successful reduction, although the pB-C2 value typically decreases, the base of the triangle may increase, potentially leading to overestimation of residual compression. Lastly, the relationship between the CVJ triangle area and postoperative neurological improvement remains poorly established and warrants further investigation.
This study has several limitations. First, it was a retrospective, single-center investigation with a relatively small sample size, which may introduce selection bias and limit the generalizability of the findings. Although rigorous statistical analyses were performed, the limited number of cases may affect the robustness of certain conclusions.
Second, while surgical reduction and decompression are key determinants of postoperative neurological improvement and can be objectively quantified using parameters such as pB-C2, other factors also contribute to outcomes. These include patient age, symptom duration, surgical approach, adherence to rehabilitation, and the presence of comorbidities or perioperative complications. Although patients with trauma were excluded and most of these variables were controlled for, complete adjustment for all potential confounders was not feasible. Furthermore, multivariate analysis was not possible due to the limited cohort size.
Third, although this study focused primarily on pB-C2 as a marker of decompression and neurological prognosis, future research should integrate parameters assessing cervical sagittal alignment to ensure spinal balance is preserved alongside neurological recovery.
Conclusion
In summary, this study found that the pB-C2 parameter appears to be a reliable and practical metric for evaluating AAD and assessing intraoperative reduction in patients with type A BI. Both the absolute pB-C2 value and its improvement rate demonstrated significant correlations with the CMA and neurological recovery, as reflected by the JOA score improvement rate. These findings suggest that pB-C2 may serve as a useful intraoperative indicator of decompression adequacy and postoperative neurological prognosis, warranting further validation in larger, prospective studies.
Footnotes
Acknowledgments
The authors would like to thank all the patients of our center for allowing to publish the paper and to use their clinical datums taken during hospital admission.
Ethical Approval
This study was conducted following approval from the institutional review board (IRB) of our institution (No. KY2021111).
Informed Consent
Since this was a retrospective study, written informed consent was waived.
Author Contributions
Conceptualization: Fei Ma, Shicai Xu,Qingquan Kong, Dejun Zhong, Formal Analysis: Fei Ma, Shicai Xu, Shuang Zhang, Yiling Xiong, Investigation: Fei Ma, Shicai Xu, Yebo Leng, Chuan Guo, Yuheng Liu, Yu Wang, Dengbo Yao Methodology: Fei Ma, Yehui Liao, Qiang Tang Project Administration: Fei Ma, Dejun Zhong, Qingquan Kong Writing – Original Draft: Fei Ma, Shicai Xu, Shuang Zhang, Yiling Xiong, Chao Tang Writing – Review & Editing: Qing Wang, Qingquan Kong, Dejun Zhong
Funding
The author(s) disclosed receipt of the following financial support for the research, authorship, and/or publication of this article: the Sichuan Science and Technology Program (grant number: 2024NSFSC0682) and the Sichuan Medical Association Fund (grant number: Q22078).
Declaration of Conflicting Interests
The author(s) declared no potential conflicts of interest with respect to the research, authorship, and/or publication of this article.
Data Availability Statement
The datasets generated during and/or analysed during the current study are available from the corresponding author on reasonable request.