
Abstract
Study Design
Systematic Review and Meta-analysis.
Objective
Poor preoperative bone quality is a key risk factor for postoperative cage subsidence (CS) following degenerative lumbar fusion surgery. Computed tomography (CT)-based Hounsfield unit (HU) values, and magnetic resonance imaging (MRI)-based vertebral bone quality (VBQ) and endplate bone quality (EBQ) scores, are reliable tools for assessing bone quality. This study is the first meta-analysis comparing the predictive value of HU, VBQ, and EBQ for postoperative CS.
Methods
A comprehensive literature search was conducted through databases such as PubMed up to April 5, 2025. The QUADAS-2 was used to evaluate the quality of included studies. Calculate the pooled sensitivity, specificity and hierarchical summary receiver operating characteristic (HSROC) curve, and perform subgroup analyses and meta-regression to identify sources of heterogeneity.
Results
20 studies involving a total of 2648 patients were included. The quality of these studies was relatively low. The areas under the HSROC curves for HU value, VBQ, and EBQ were 0.78 (95% CI, 0.74-0.81), 0.86 (95% CI, 0.83-0.89), and 0.83 (95% CI, 0.79-0.86), respectively. The pooled sensitivities were 0.84, 0.82, and 0.80, while the pooled specificities were all 0.76. The corresponding diagnostic odds ratios (DORs) were 16.34 (95% CI, 7.43-35.93), 14.67 (95% CI, 10.51-20.48), and 12.24 (95% CI, 5.63-26.61), respectively.
Conclusion
The HU value, VBQ, and EBQ all demonstrate relatively high efficacy in predicting CS, with the VBQ showing a modest advantage. Collectively, these indicators can provide valuable information for preoperative risk stratification and individualized surgical decision-making.
Keywords
Introduction
Lumbar fusion is an established treatment for degenerative lumbar spine diseases, demonstrating clear efficacy in relieving neural compression and restoring spinal stability.1,2 However, postoperative complications related to the implant remain common, with cage subsidence (CS) being one of the most frequent.3,4 CS not only compromises implant stability but may also result in fusion failure, recurrent intervertebral stenosis, and reduced clinical outcomes. 3 Previous studies have identified poor preoperative bone quality as a significant risk factor for CS, with the prevalence of osteopenia/osteoporosis reaching up to 65.2% in patients undergoing lumbar spine surgery. 5 Therefore, accurate preoperative assessment of bone quality is crucial for optimizing surgical planning and minimizing postoperative complications. 6
In recent years, computed tomography (CT)-derived Hounsfield unit (HU) values have emerged as a potential tool for evaluating bone quality. 7 HU values have shown a strong correlation with both DXA T-scores and BMD measured by quantitative CT (QCT).8-10 In addition, the magnetic resonance imaging (MRI)-based vertebral bone quality (VBQ) score indirectly reflects bone quality by quantifying fat infiltration within the vertebral body and has demonstrated an accuracy of up to 81% in predicting osteopenia/osteoporosis. 11 The endplate bone quality (EBQ) score, by contrast, focuses on the signal characteristics of the endplate at the fusion interface, offering a more localized assessment of bone quality at the site of implant insertion and potentially providing a more direct correlation with the risk of CS. 12 Several studies have preliminarily explored the predictive value of HU values, VBQ scores, and EBQ scores for CS following lumbar spine surgery.12-14
However, the diagnostic performance and relative advantages of HU values, VBQ scores, and EBQ scores in predicting CS have not been systematically summarized. Therefore, this study aims to compare the accuracy of the aforementioned three indicators in predicting postoperative CS in lumbar spine surgery, thereby providing a basis for selecting appropriate imaging indicators for preoperative assessment.
Materials and Methods
This study was conducted in accordance with the PRISMA (Preferred Reporting Items for Systematic Reviews and Meta-Analyses) guidelines 15 and has been registered in PROSPERO (CRD420251160603).
Search Strategy and Screening
We conducted a comprehensive literature search across PubMed, Embase, Web of Science, Cochrane Library, and the China National Knowledge Infrastructure (CNKI), without language restrictions, with a cut-off date of April 5, 2025. The search aimed to identify original studies evaluating the utility of HU values, VBQ, and EBQ in predicting CS following degenerative lumbar spine surgery. The search strategy was based on the following keywords: “vertebral bone quality,” “Hounsfield unit,” “endplate bone quality,” “cage subsidence,” “magnetic resonance imaging,” and “lumbar vertebrae.”
Inclusion and Exclusion Criteria
After removing duplicates, two authors independently screened the titles and abstracts of all retrieved studies. Full texts of potentially eligible articles were then assessed for inclusion. Discrepancies were resolved through discussion and consensus. Studies were included if they investigated the use of HU values, VBQ scores, or EBQ scores in relation to CS following lumbar spine surgery. The exclusion criteria were: (1) studies not related to postoperative CS prediction using HU values, VBQ scores, or EBQ scores; (2) studies using enhanced CT or non–T1-weighted MRI for HU, VBQ, or EBQ measurements; (3) studies focused on the cervical or thoracic spine; and (4) studies with incomplete outcome data or review articles.
HU Value, VBQ and EBQ Measurement Methods
The HU value was measured according to the method described by Schreiber et al.
16
Three regions of interest (ROIs), as large as possible, were delineated on non-contrast lumbar CT axial images: just below the upper endplate, at the mid-vertebral level, and just above the lower endplate of the lumbar vertebra. Areas of cortical bone, venous plexus, and bony islands were carefully avoided. The average of these three measurements was defined as the HU value of the vertebral body (Figure 1A). VBQ scoring was first proposed by Ehresman et al.
17
using non-contrast T1-weighted median sagittal MRI images of the lumbar spine. ROIs were placed on the cancellous bone of the L1–L4 vertebrae to obtain vertebral signal intensity (SI). If the median sagittal slice was unsuitable, a parasagittal slice was used. The VBQ score was calculated by dividing the mean SI of the L1–L4 vertebral bodies by the SI of the cerebrospinal fluid (CSF) at the L3 level (Figure 1B). The EBQ score, as described by Jones et al.,
12
was also obtained from non-contrast T1-weighted MRI images. ROIs were placed 3 mm below the cartilage of both the upper and lower endplates of the operated segments. The EBQ score was calculated by dividing the mean SI of the upper and lower endplates by the SI of the L3-level CSF (Figure 1C). A represents an example of HU value measurement based on lumbar spine CT; B and C represent examples of VBQ and EBQ measurements from lumbar spine T1-weighted MRI, respectively
Definition of Cage Subsidence
The definition of CS was based on measurements obtained from mid-sagittal CT or radiographic images during postoperative follow-up. Most studies defined CS as a vertical displacement of more than 2 mm.1,4,13,14,18-30 In contrast, two studies12,20 evaluated subsidence severity according to the percentage of intervertebral disc height loss, using the grading system proposed by Marchi et al. 31 Additionally, three studies28,32,33 defined CS as cephalad or caudal migration of the fusion device into the adjacent endplates.
Given the differences in the definition of CS in various studies, a meta-regression analysis will be conducted subsequently to assess the potential heterogeneity arising from different CS criteria.
Data Extraction
Data were independently extracted from eligible studies by two reviewers. Discrepancies were resolved through consultation with a third author to ensure consistency. Extracted data included HU values, VBQ, and EBQ scores for both CS and non-CS groups; counts of true positives (TP), false positives (FP), false negatives (FN), and true negatives (TN); as well as study characteristics such as first author, publication year, country, incidence of CS, patient age, gender, body mass index (BMI), follow-up duration, CS definitions, sample sizes, cut-off values, sensitivity, and specificity.
Assessment of Methodological Quality
The quality of included studies was evaluated using the Quality Assessment of Diagnostic Accuracy Studies 2 (QUADAS-2) tool.34,35 QUADAS-2 is specifically designed to evaluate risk of bias in diagnostic accuracy studies across four domains: patient selection, index test, reference standard, and flow and timing. For each domain, risk of bias was assessed, and applicability concerns were evaluated for the first three domains. Each of the seven signaling questions was answered as “yes,” “no,” or “unclear.” A domain was considered to have low risk of bias only if all signaling questions were answered “yes.” If any signaling question was answered “no,” potential bias was indicated. The “unclear” response was used when available data were insufficient to make a definitive judgment.
Statistical Analysis
Data were analyzed using Review Manager (version 5.4.1, Thomson Research Soft, Carlsbad, CA, USA) and STATA (version 18.0, StataCorp, College Station, TX, USA). The diagnostic performance of HU values, VBQ, and EBQ scores for identifying CS after lumbar spine surgery was evaluated by calculating mean differences (MD) with 95% confidence intervals (CI). Threshold effect-related heterogeneity was assessed using the Spearman correlation coefficient. Extracted data on TP, FP, FN, and TN were pooled to calculate sensitivity, specificity, positive likelihood ratio (PLR), negative likelihood ratio (NLR), diagnostic odds ratio (DOR), and their 95% CI.
To synthesize diagnostic accuracy across studies, we constructed hierarchical summary receiver operating characteristic (HSROC) curves. The HSROC model was fitted to all available data, accounting for variations in test accuracy among studies and the correlation between sensitivity and specificity within each study. Publication bias was assessed using funnel plots, and Fagan nomograms were applied to estimate the post-test probability of disease based on positive or negative test results. Subgroup and meta-regression analyses were performed to identify potential sources of heterogeneity. A P-value <0.05 was considered statistically significant.
Results
Included Studies
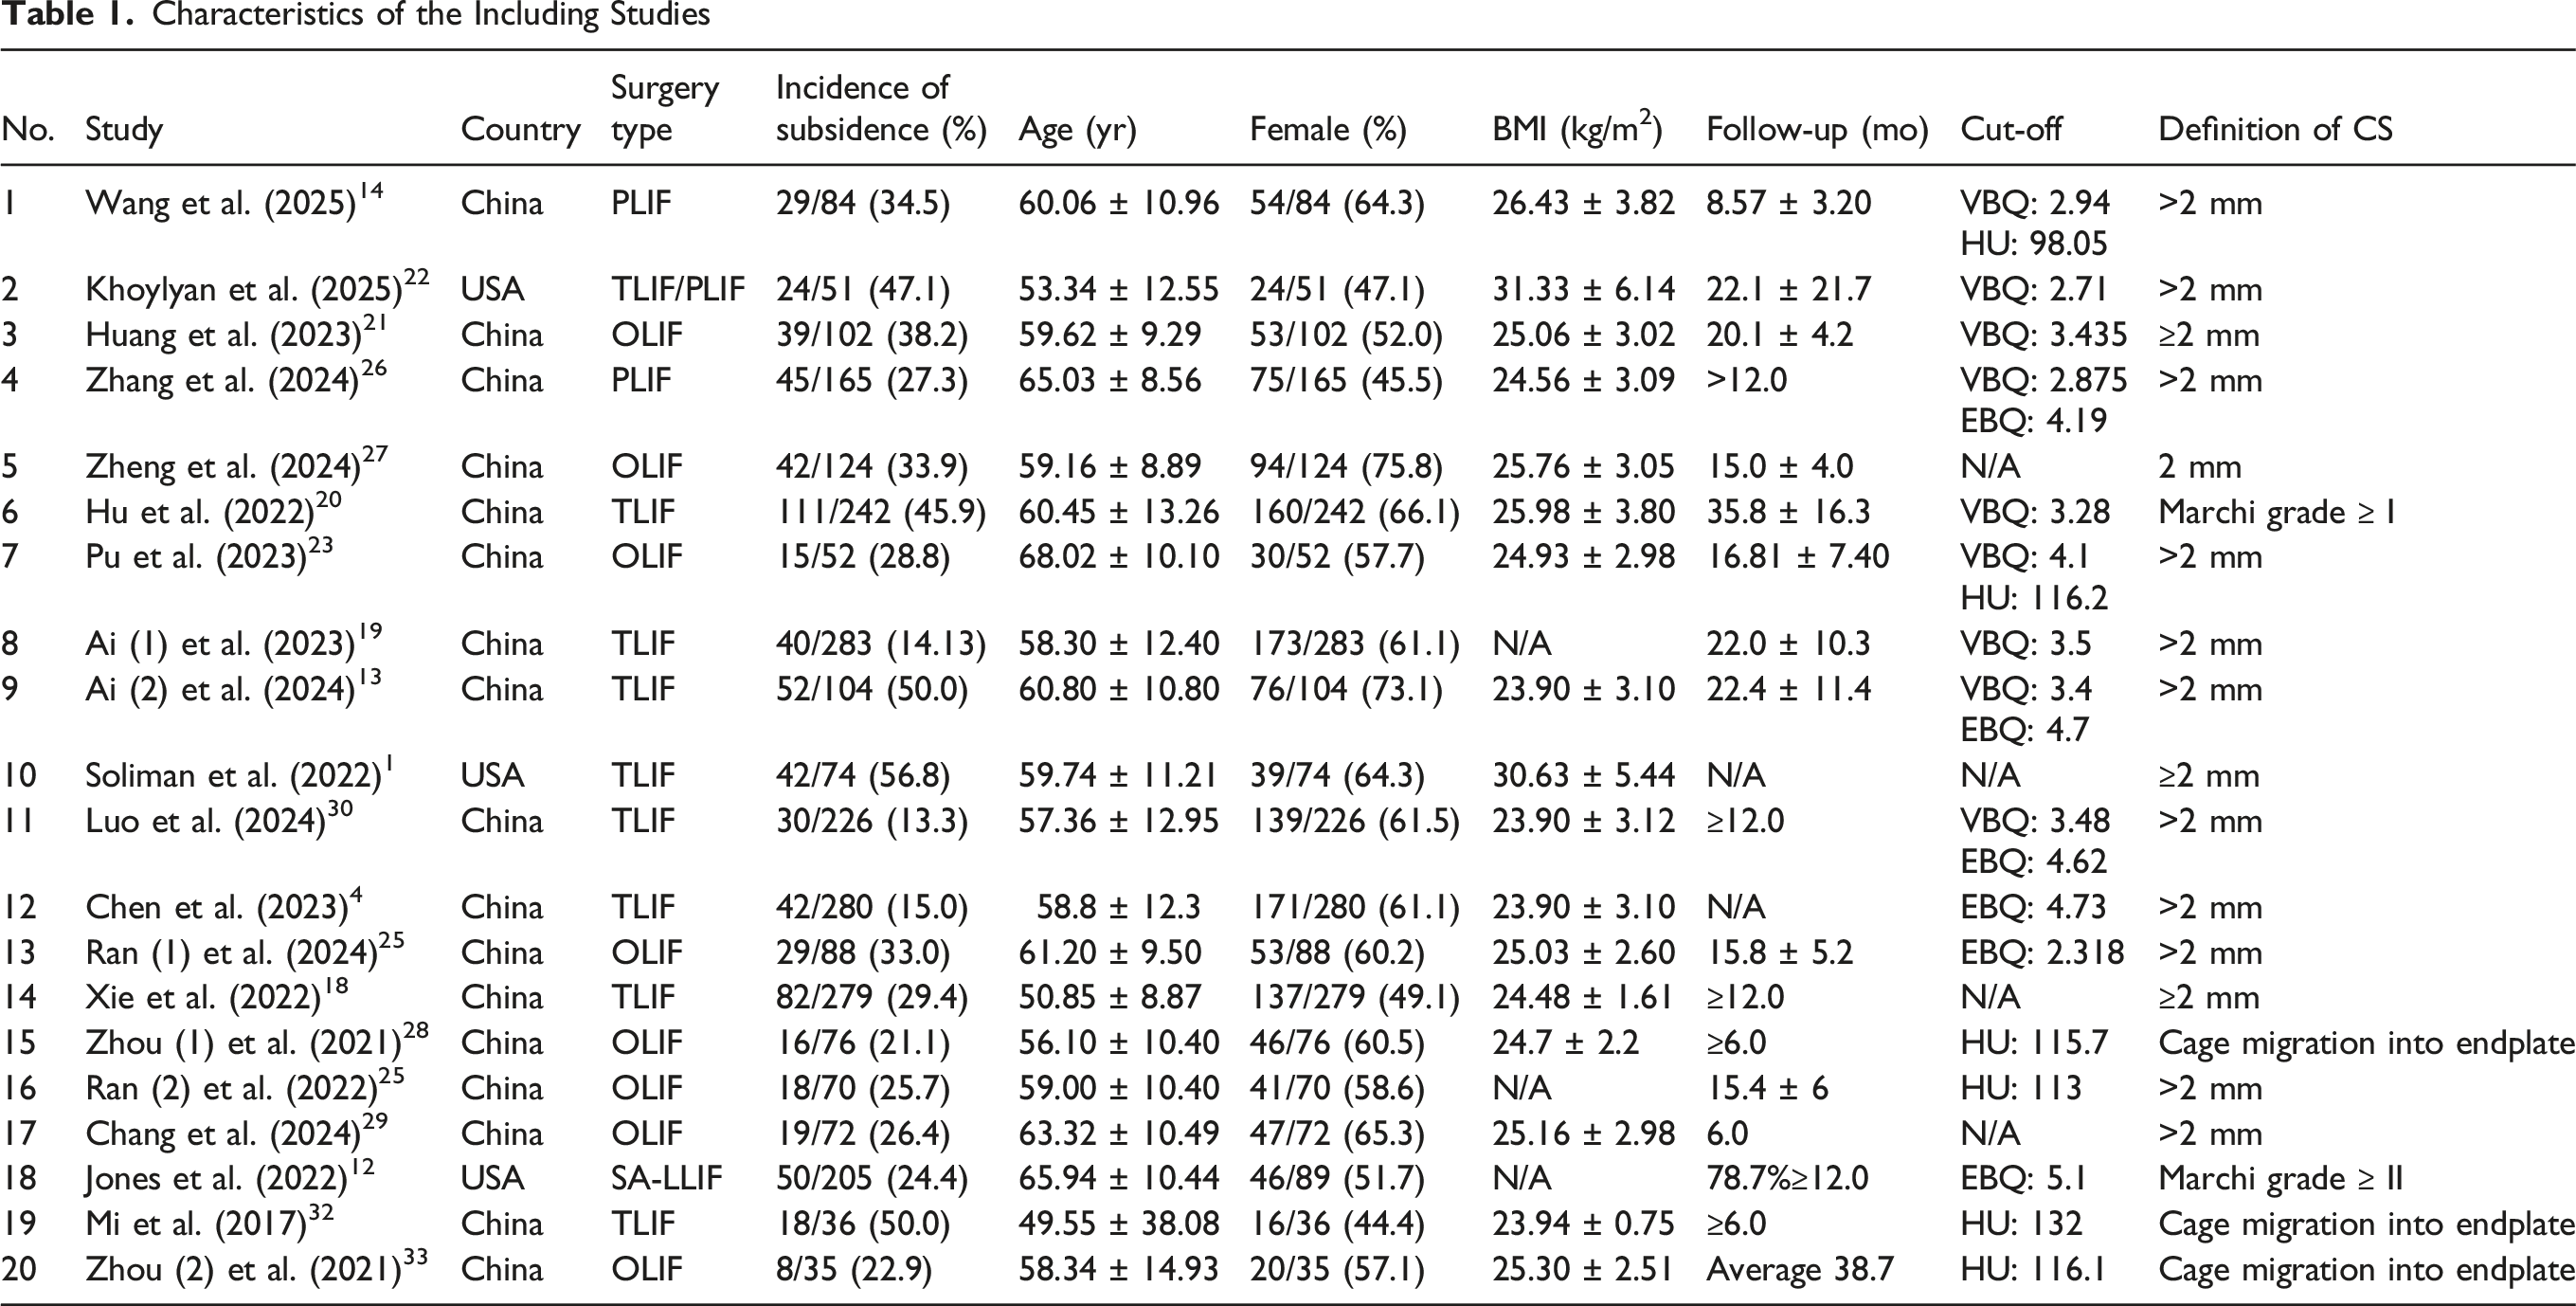
Figure 2 illustrates the flow of the stepwise literature review. According to the inclusion and exclusion criteria, 20 studies were ultimately included. The characteristics of the included studies are summarized in Table 1. Of these, 17 studies were conducted in China,4,13,14,18-21,23-30,32,33 and 3 were conducted in the USA,1,12,22 encompassing a total of 2648 patients. Eight studies employed oblique lateral interbody fusion (OLIF),21,23-25,27-29,33 eight used transforaminal lumbar interbody fusion (TLIF),1,4,13,18-20,30,32 two used posterior lumbar interbody fusion (PLIF),14,26 one used lateral lumbar interbody fusion (LLIF),
12
and one used both TLIF and OLIF,
22
which may represent a potential source of heterogeneity. Flowchart of study selection Characteristics of the Including Studies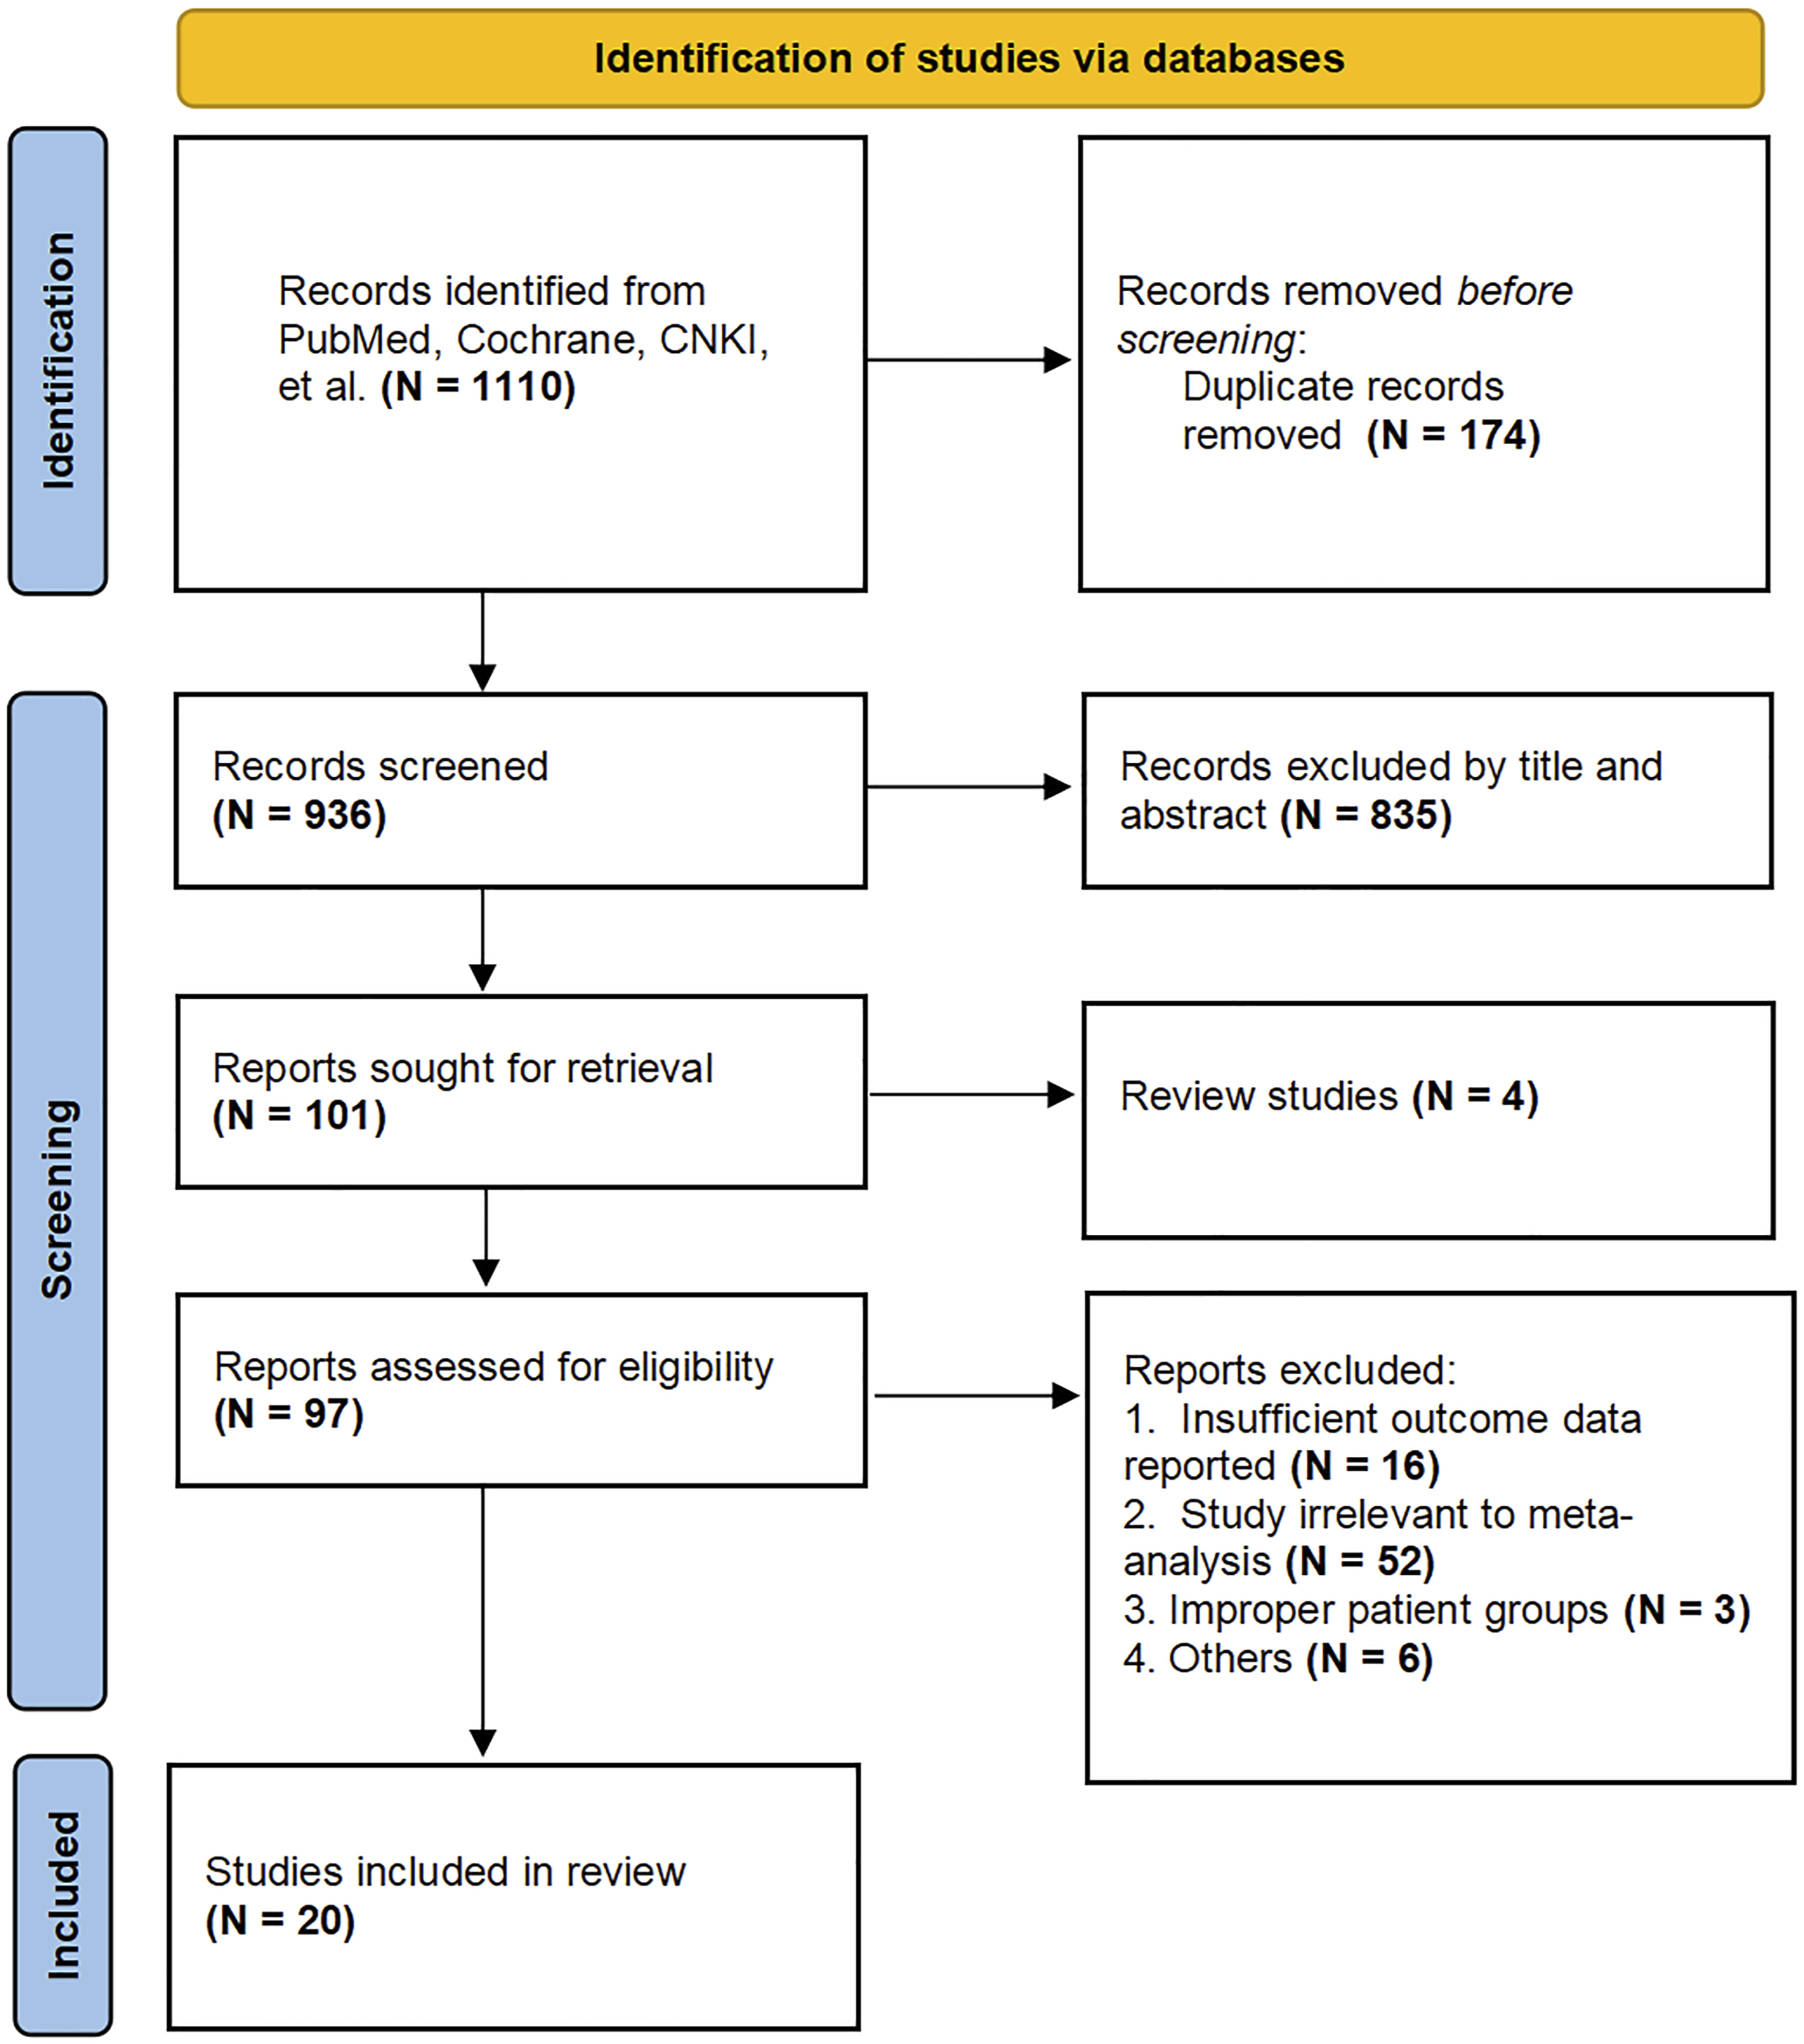
Quality of the Included Studies
A graphical summary of the QUADAS-2 methodological assessment for these studies is presented in Figures 3A and 2B. In the patient selection domain, which assesses potential selection bias, 15 of the 20 studies did not specify whether patients were consecutively enrolled, resulting in an unclear risk of bias. The index test domain, which evaluates whether the index test interpretation was performed blinded to the reference standard and if the threshold was predetermined, showed high risk of bias in 3 studies and unclear risk in 11. The reference standard domain, assessing accuracy and blinding of the reference standard, identified high risk of bias in 3 studies and unclear risk in 10. The flow and timing domain, which examines the interval between index test and reference standard, consistency of reference standard application, and inclusion of all patients in analyses, showed unclear risk in 1 study. Regarding applicability concerns, the patient selection domain was judged unclear in 2 studies for potentially not matching the review question. The index test domain had high applicability concerns in 3 studies due to mismatch with the evaluation of complications. Similarly, the reference standard domain showed high applicability concerns in 3 studies. QUADAS-2 quality assessment; (A) Overall results. (B) Results of individual studies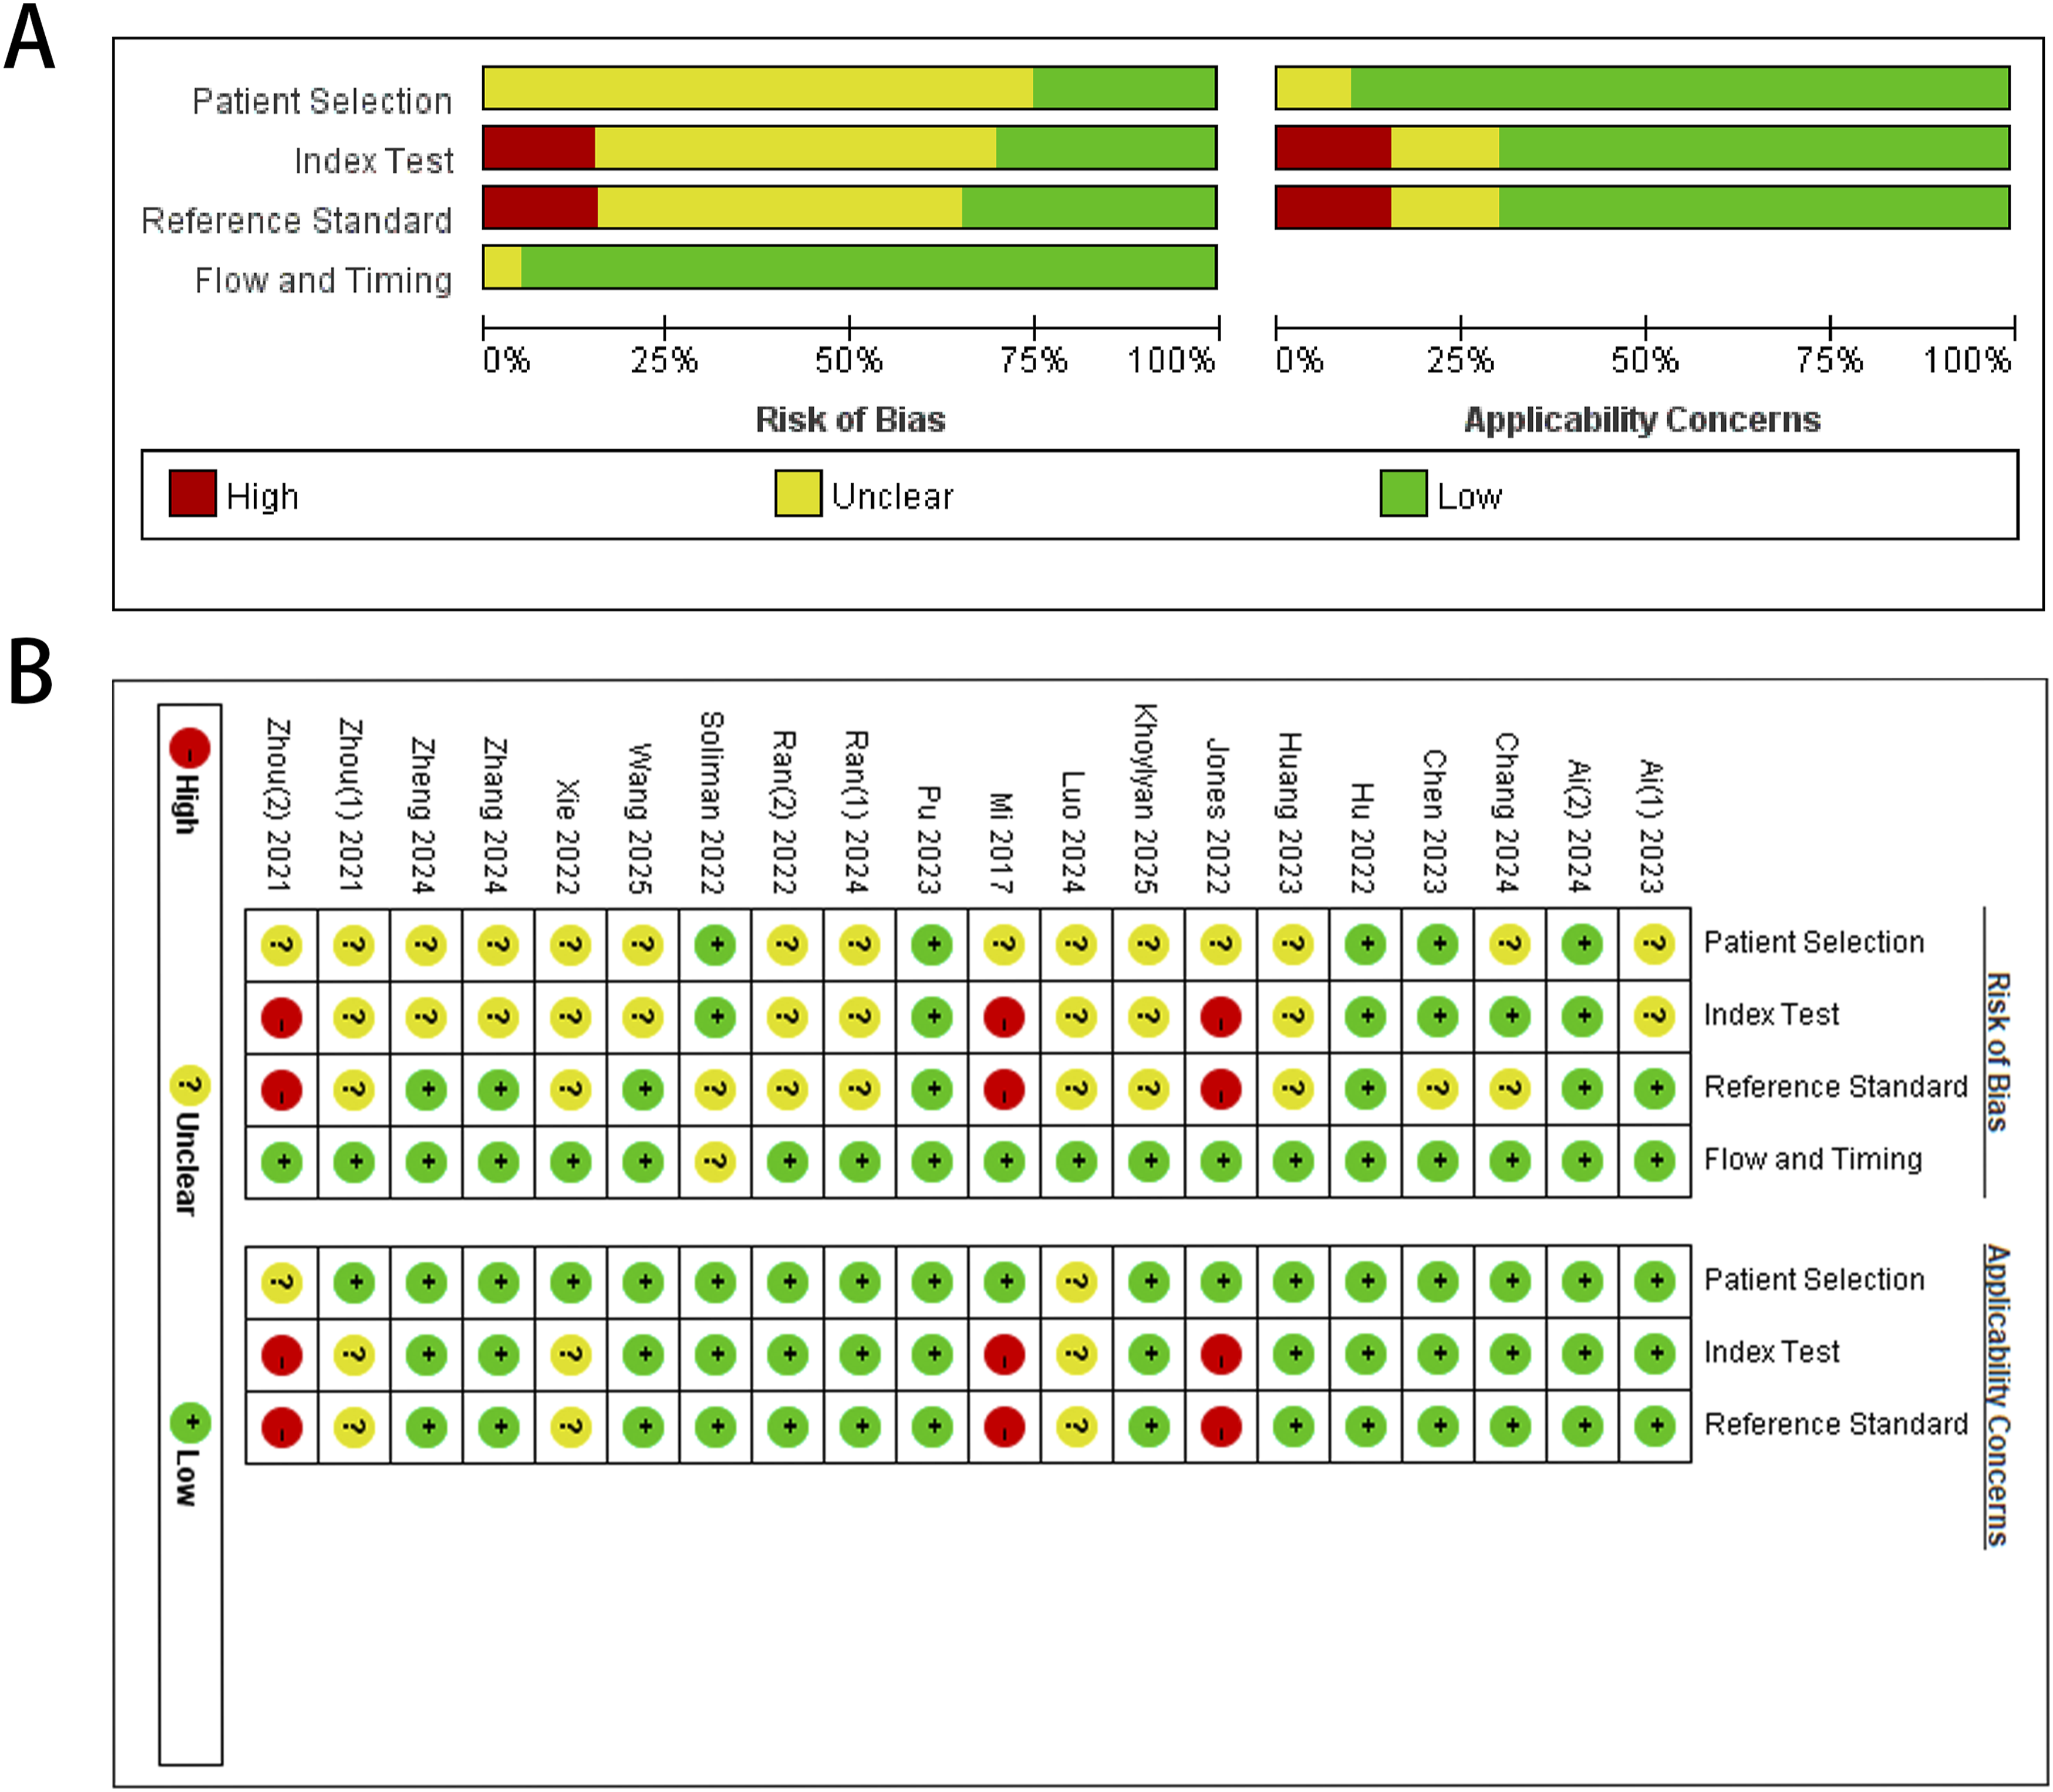
In summary, the QUADAS-2 assessment indicates that the included studies have methodological limitations and potential risks of bias, which should be considered when interpreting the review findings.
Validity of HU Values, VBQ and EBQ in Identifying Cage Subsidence
8 studies14,18,23,24,28,29,32,33 reported HU values predicting CS in a total of 704 patients. The overall incidence of CS was 29.1% (205/704), as shown in Figure 4. HU values were significantly lower in the CS group compared to the control group (MD, −31.08; 95% CI, −37.23 to −24.92; P < 0.001; I2 = 68%; random-effects model). When grouped by surgical type, three studies14,18,32 involving TLIF/PLIF surgeries included 399 patients, with a postoperative CS incidence of 32.3% (129/399). HU values were significantly lower in the CS group (MD, −29.61; 95% CI, −33.22 to −25.99; P < 0.001). Five studies23,24,28,29,33 involving OLIF/LLIF included 305 patients, with a CS incidence of 24.9% (76/305). HU values were again significantly lower in the CS group than in controls (MD, −32.30; 95% CI, −44.70 to −19.89; P < 0.001). No significant differences were observed between subgroups (P = 0.68, I2 = 0%), indicating that surgical approach did not significantly affect HU values. To further explore potential sources of heterogeneity, we conducted a sensitivity analysis by sequentially removing individual studies. Excluding the study by Chang et al
29
markedly reduced heterogeneity to an acceptable level (I2 = 35%), while the effect size remained statistically significant (mean difference = −37.88, 95% CI: −44.34 to −31.42, P < 0.001). These findings suggest that the study by Chang et al was the primary contributor to heterogeneity. Forest plot of HU values grouped by type of surgery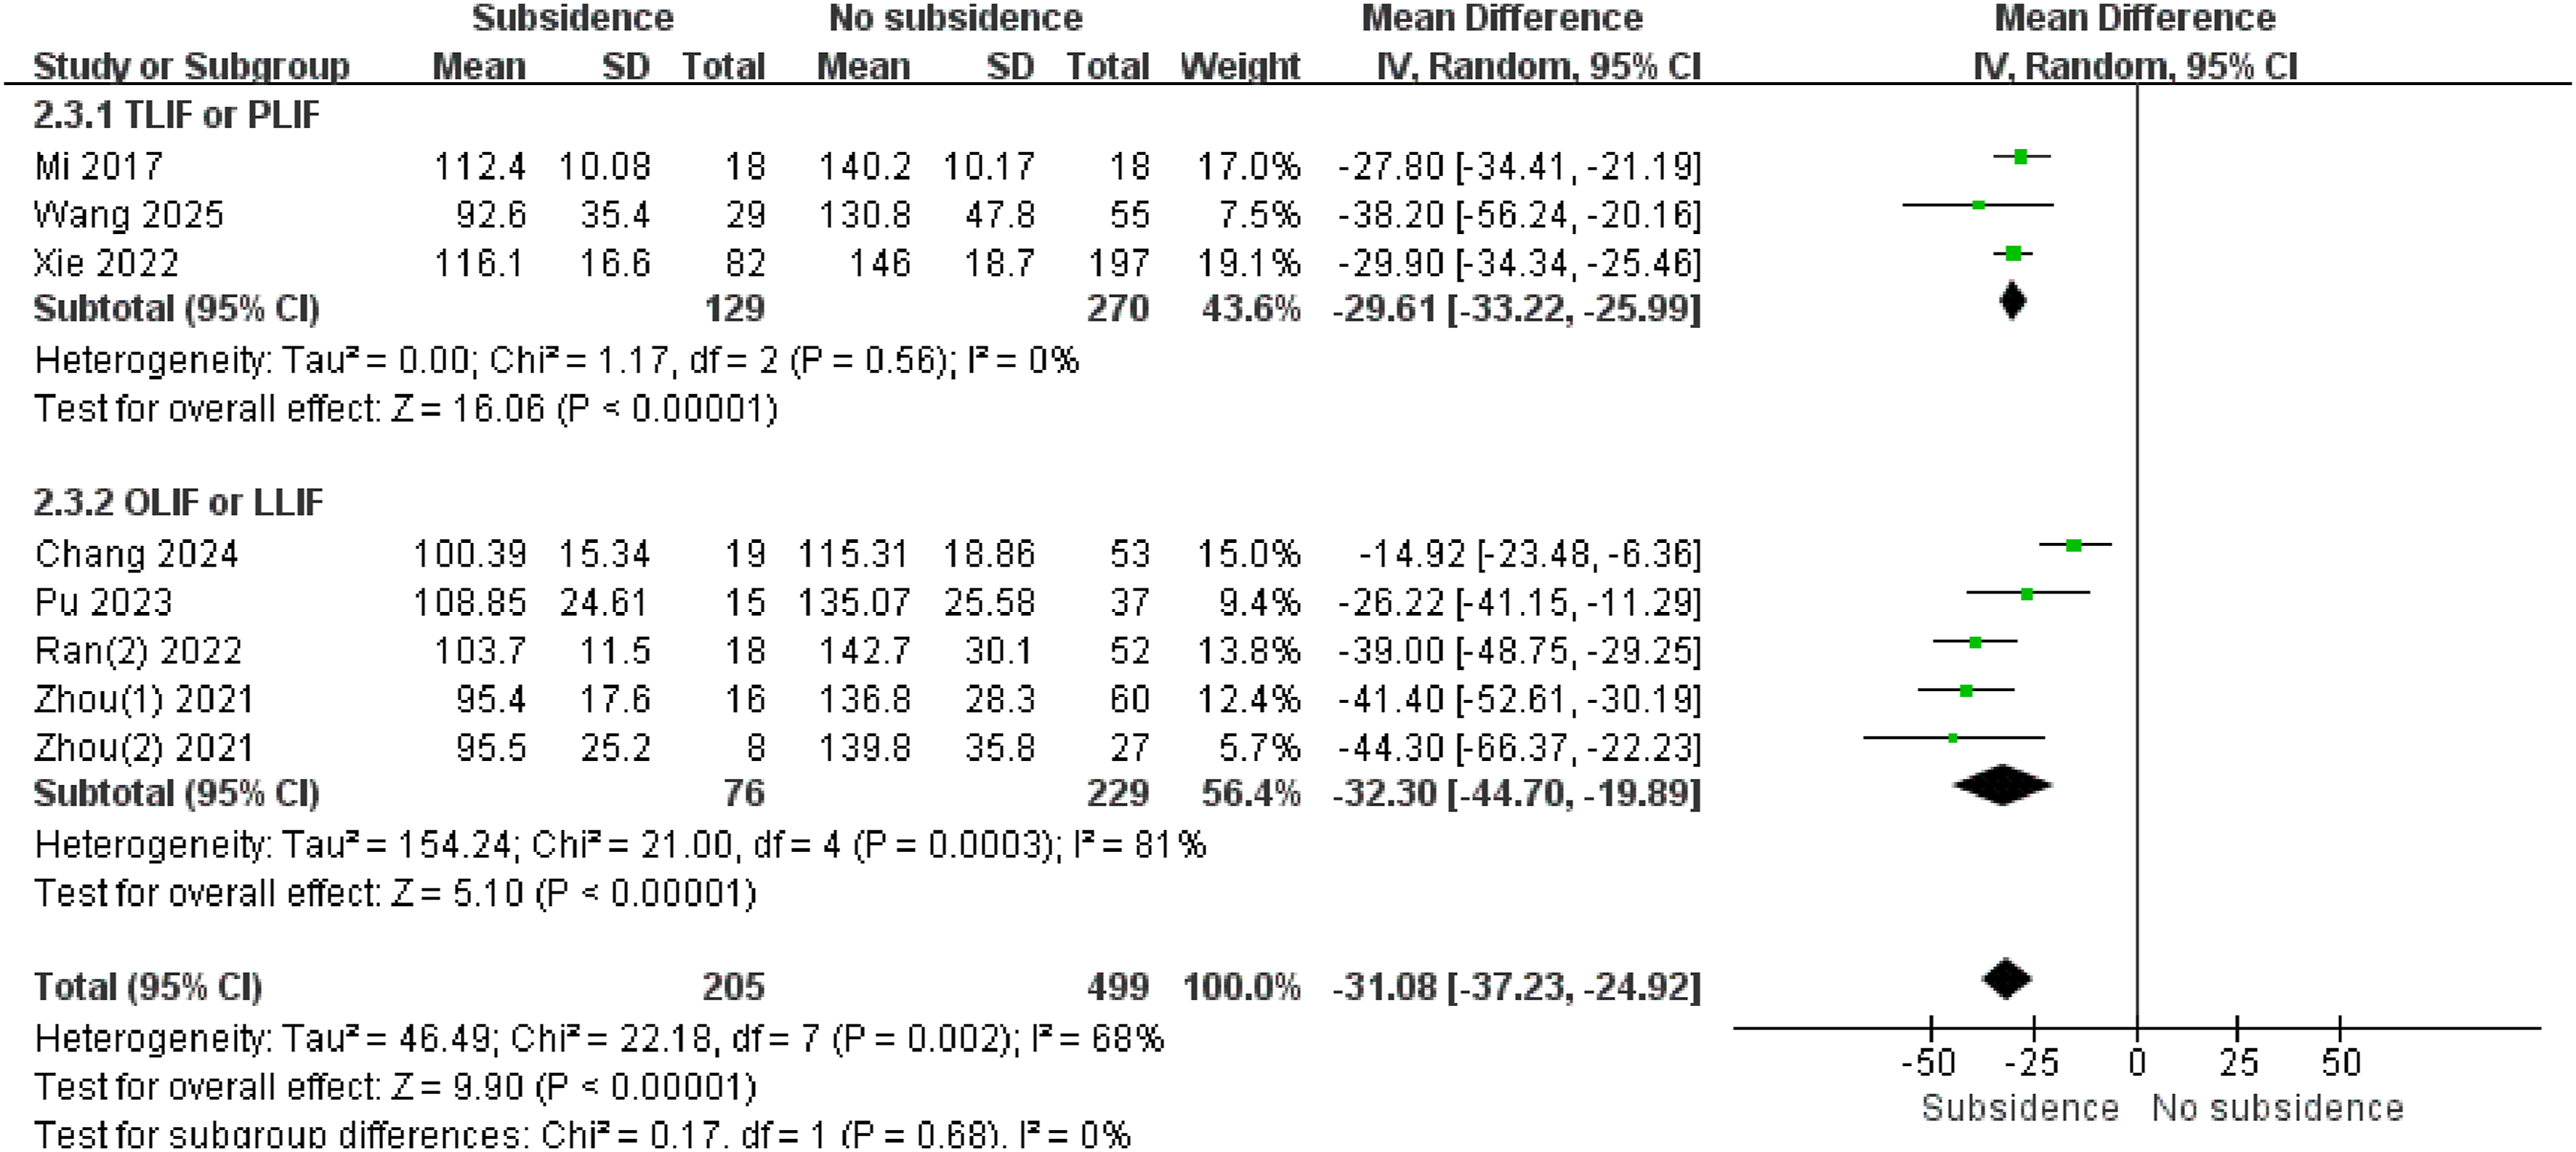
12 studies1,12-14,19-23,26,27,30 reported VBQ scores predicting CS in a total of 1712 patients. The overall incidence of CS was 30.3% (519/1712), as shown in Figure 5. VBQ scores were significantly higher in the CS group than in the control group (MD, 0.60; 95% CI, 0.46-0.74; P < 0.001; I2 = 75%; random-effects model). Grouped by surgical type, 8 studies1,13,14,19,20,22,26,30 involving TLIF/PLIF surgeries included 1229 patients, with a postoperative CS incidence of 30.3% (373/1229). VBQ scores were significantly higher in the CS group (MD, 0.61; 95% CI, 0.48-0.75; P < 0.001). 4 studies12,21,23,27 involving OLIF/LLIF procedures included 483 patients, with a CS incidence of 30.2% (146/483). VBQ scores were again significantly higher in the CS group than in controls (MD, 0.65; 95% CI, 0.26-1.04; P < 0.001). No significant difference was observed between subgroups (P = 0.88, I2 = 0%), indicating that surgical approach did not significantly affect VBQ scores. After eliminating each individual study one by one, the heterogeneity did not significantly decrease. Forest plot of VBQ scores grouped by type of surgery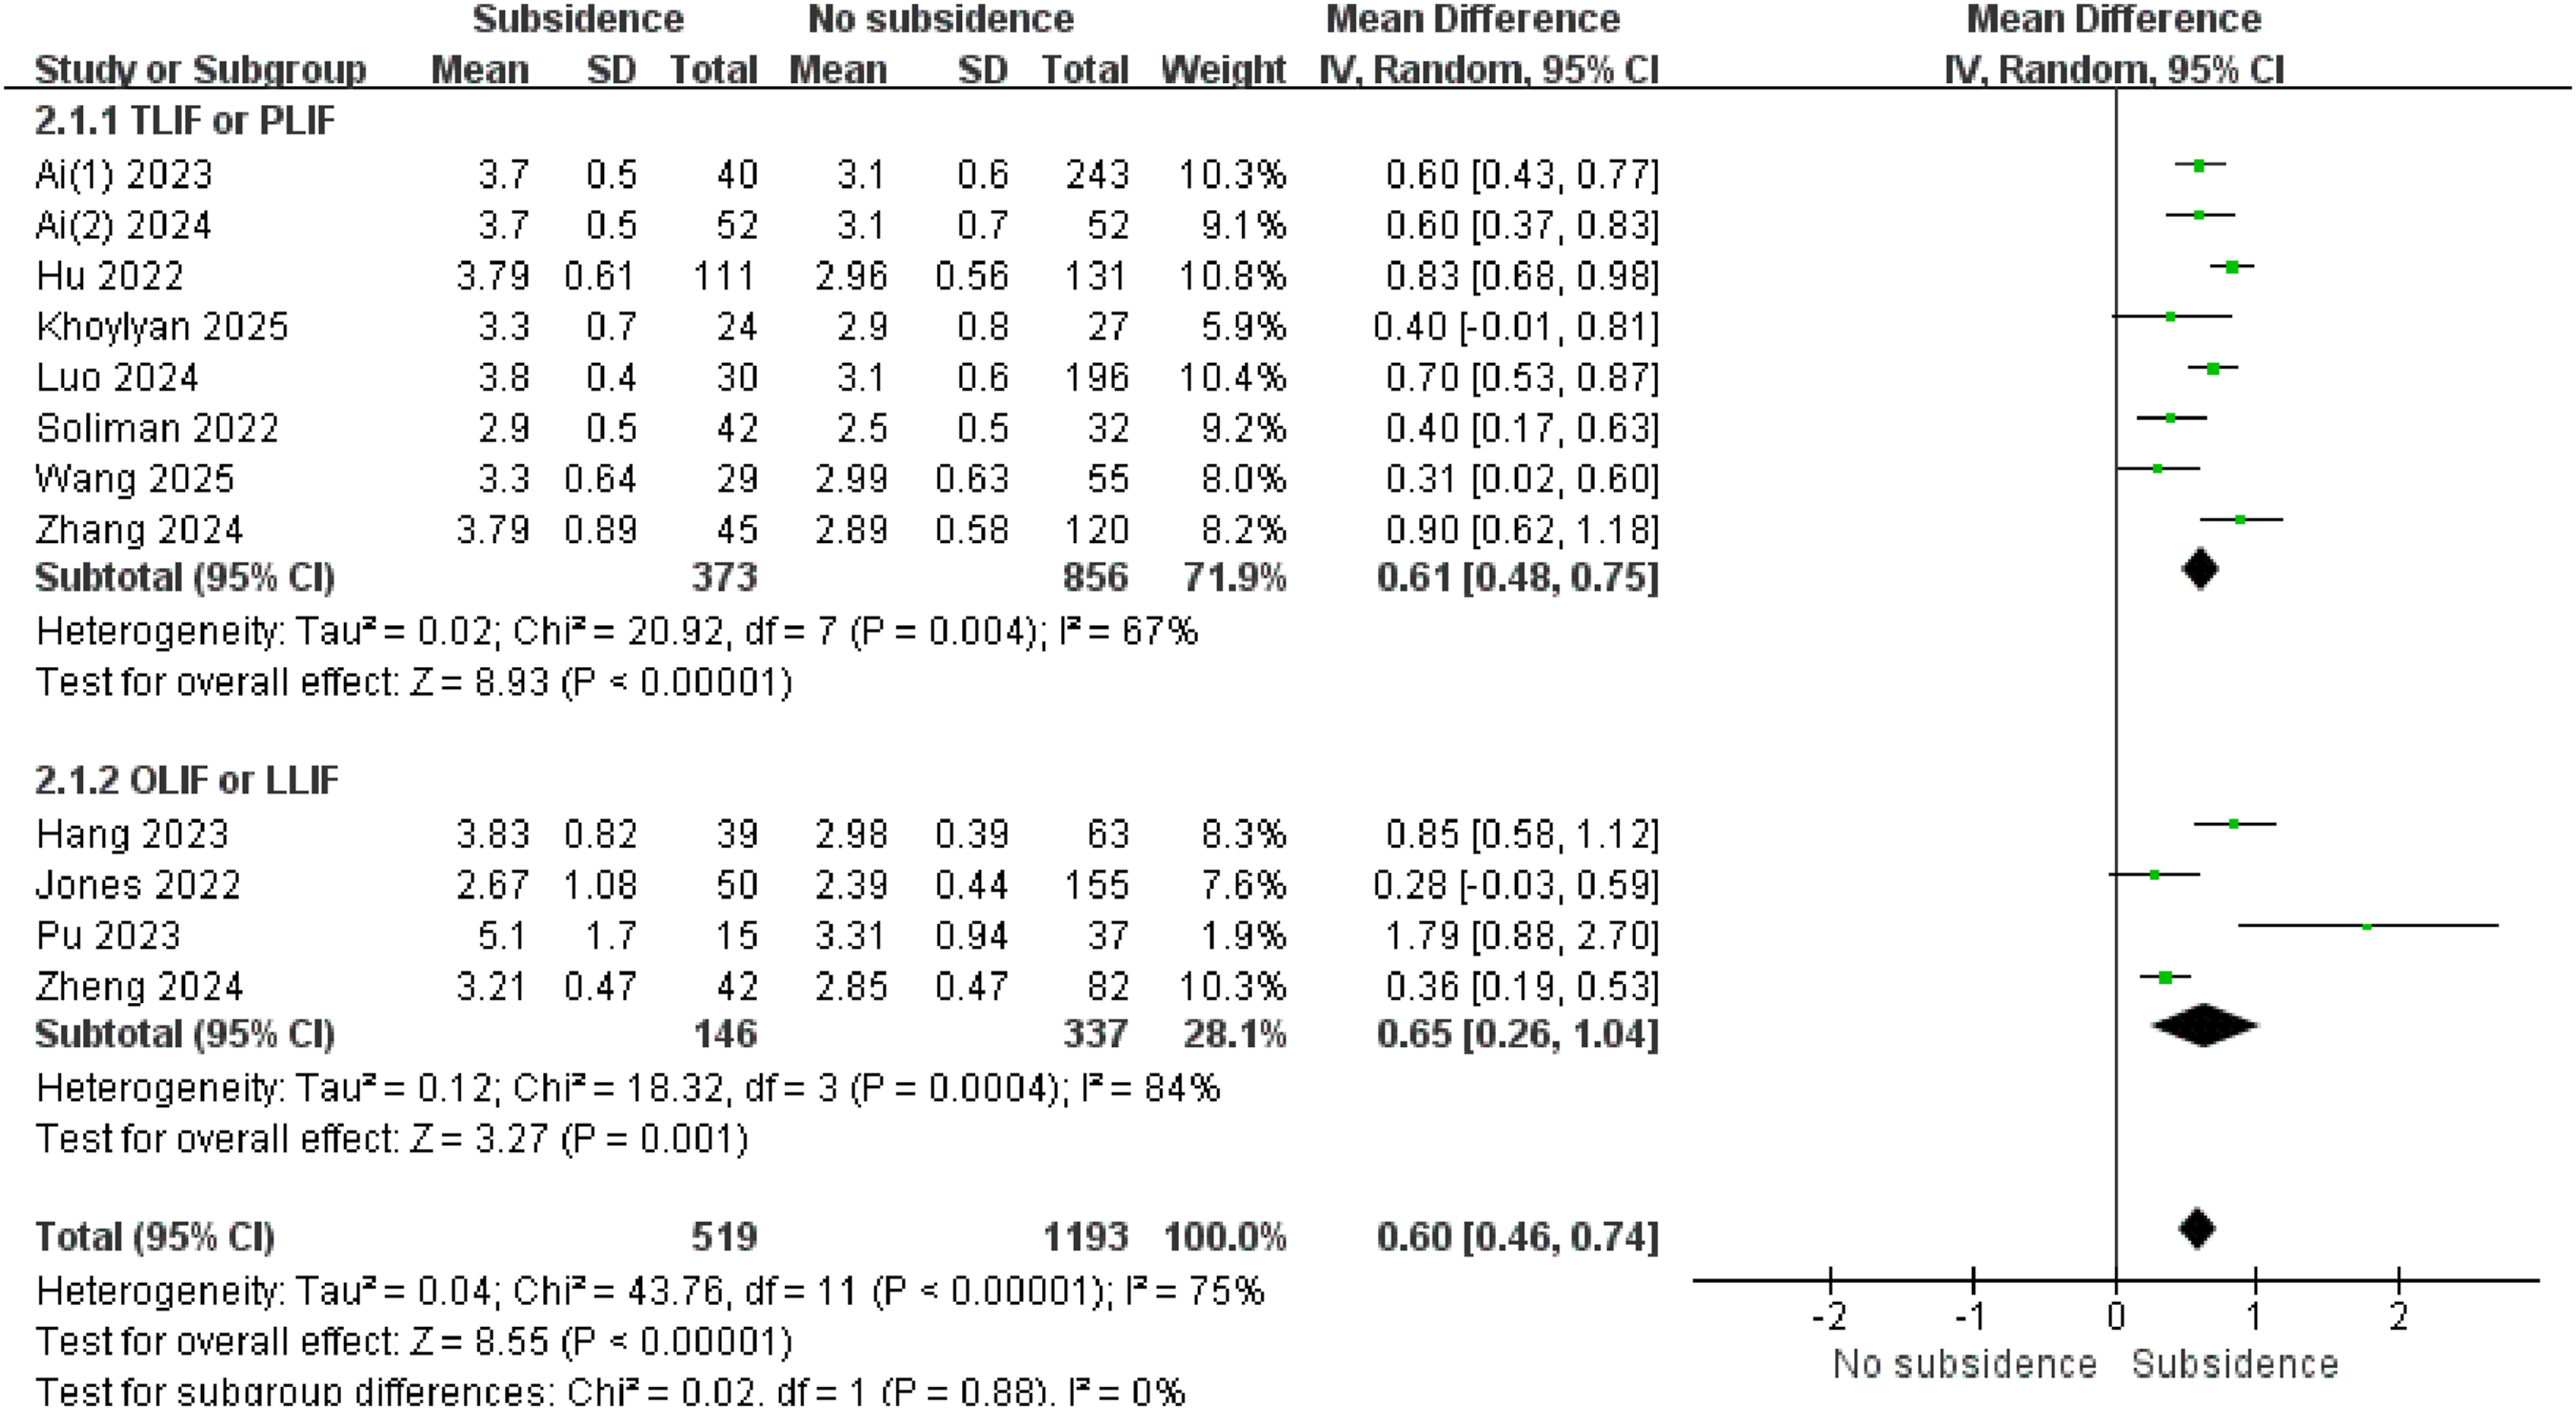
7 studies4,12,13,25-27,30 reported EBQ scores predicting CS in a total of 1192 patients. The overall incidence of CS was 24.3% (290/1192), as shown in Figure 6. EBQ scores in the CS group were significantly higher than those in the control group (MD, 0.77; 95% CI, 0.65-0.88; P < 0.001; I2 = 3%; fixed-effects model). When grouped by surgical type, 4 studies4,13,26,30 involving TLIF/PLIF surgeries included 775 patients, with a CS incidence of 21.8% (169/775). EBQ scores were significantly higher in the CS group (MD, 0.75; 95% CI, 0.62-0.87; P < 0.001). The remaining three studies12,25,27 reported on OLIF/LLIF procedures involving 417 patients, with a postoperative CS incidence of 29.0% (121/417). Again, EBQ scores were significantly higher in the CS group (MD, 0.92; 95% CI, 0.57-1.26; P < 0.001). No significant difference was observed between the subgroups (P = 0.37, I2 = 0%), suggesting that surgical approach did not significantly affect EBQ scores.The pooled analysis showed low heterogeneity (I2 = 3%), indicating strong consistency among the study results. Forest plot of EBQ scores grouped by type of surgery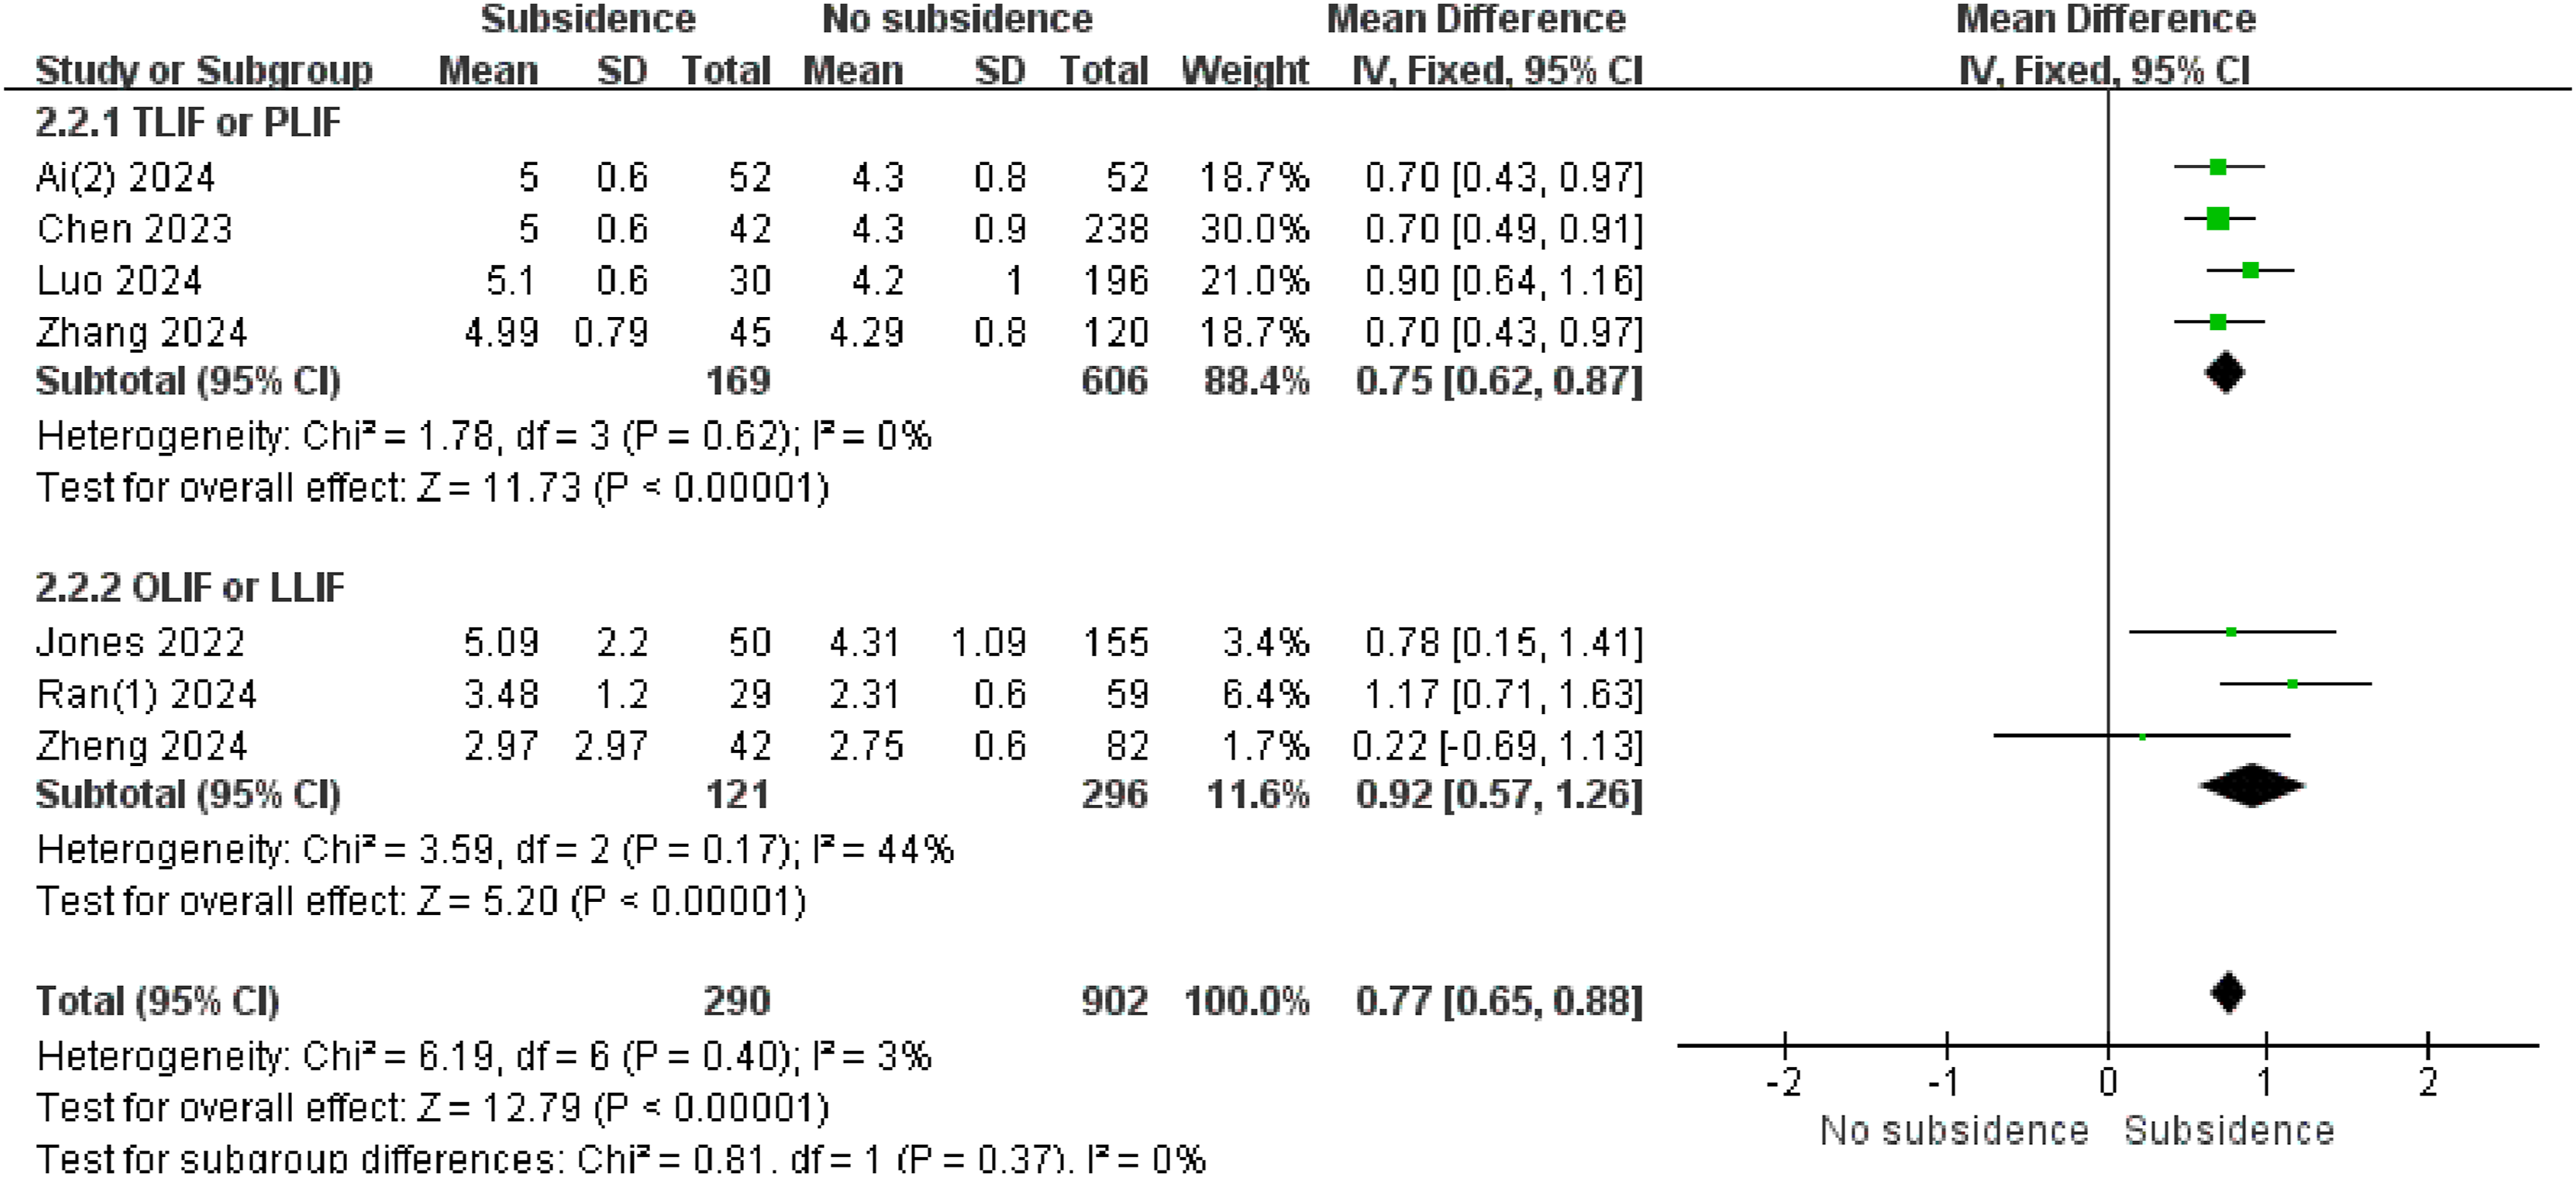
Diagnostic Value of HU Value, VBQ and EBQ for CS after Lumbar Spine Surgery
Seven studies14,18,23,24,28,32,33 reported information on TP, FP, FN, and TN outcomes. Given the considerable variation in thresholds (HU 98-132; mean, 115.18 ± 10.80), we conducted a threshold effect test. The results indicated no significant heterogeneity (P = 0.787). The pooled sensitivity and specificity were 0.84 (95% CI, 0.70-0.92) and 0.76 (95% CI, 0.71-0.80), respectively (Figure 7). The PLR was 3.47 (95% CI, 2.83-4.25), the NLR was 0.21 (95% CI, 0.11-0.41), and the DOR was 16.34 (95% CI, 7.43-35.93), as summarized in Table 2. The HSROC curve, shown in Figure 8A, yielded an AUC of 0.78 (95% CI, 0.74-0.81). The forest plot of the combined sensitivity and specificity of HU for assessing CS Sensitivity, Specificity, Positive Likelihood Ratio (PLR), Negative Likelihood Ratio (NLR), and Diagnostic Odds Ratio (DOR) of HU, VBQ, and EBQ for Predicting Postoperative Cage Subsidence (CS) Hierarchical summary receiver operating characteristic (HSROC) curves for predicting postoperative CS. (A) HU value, (B) VBQ, and (C) EBQ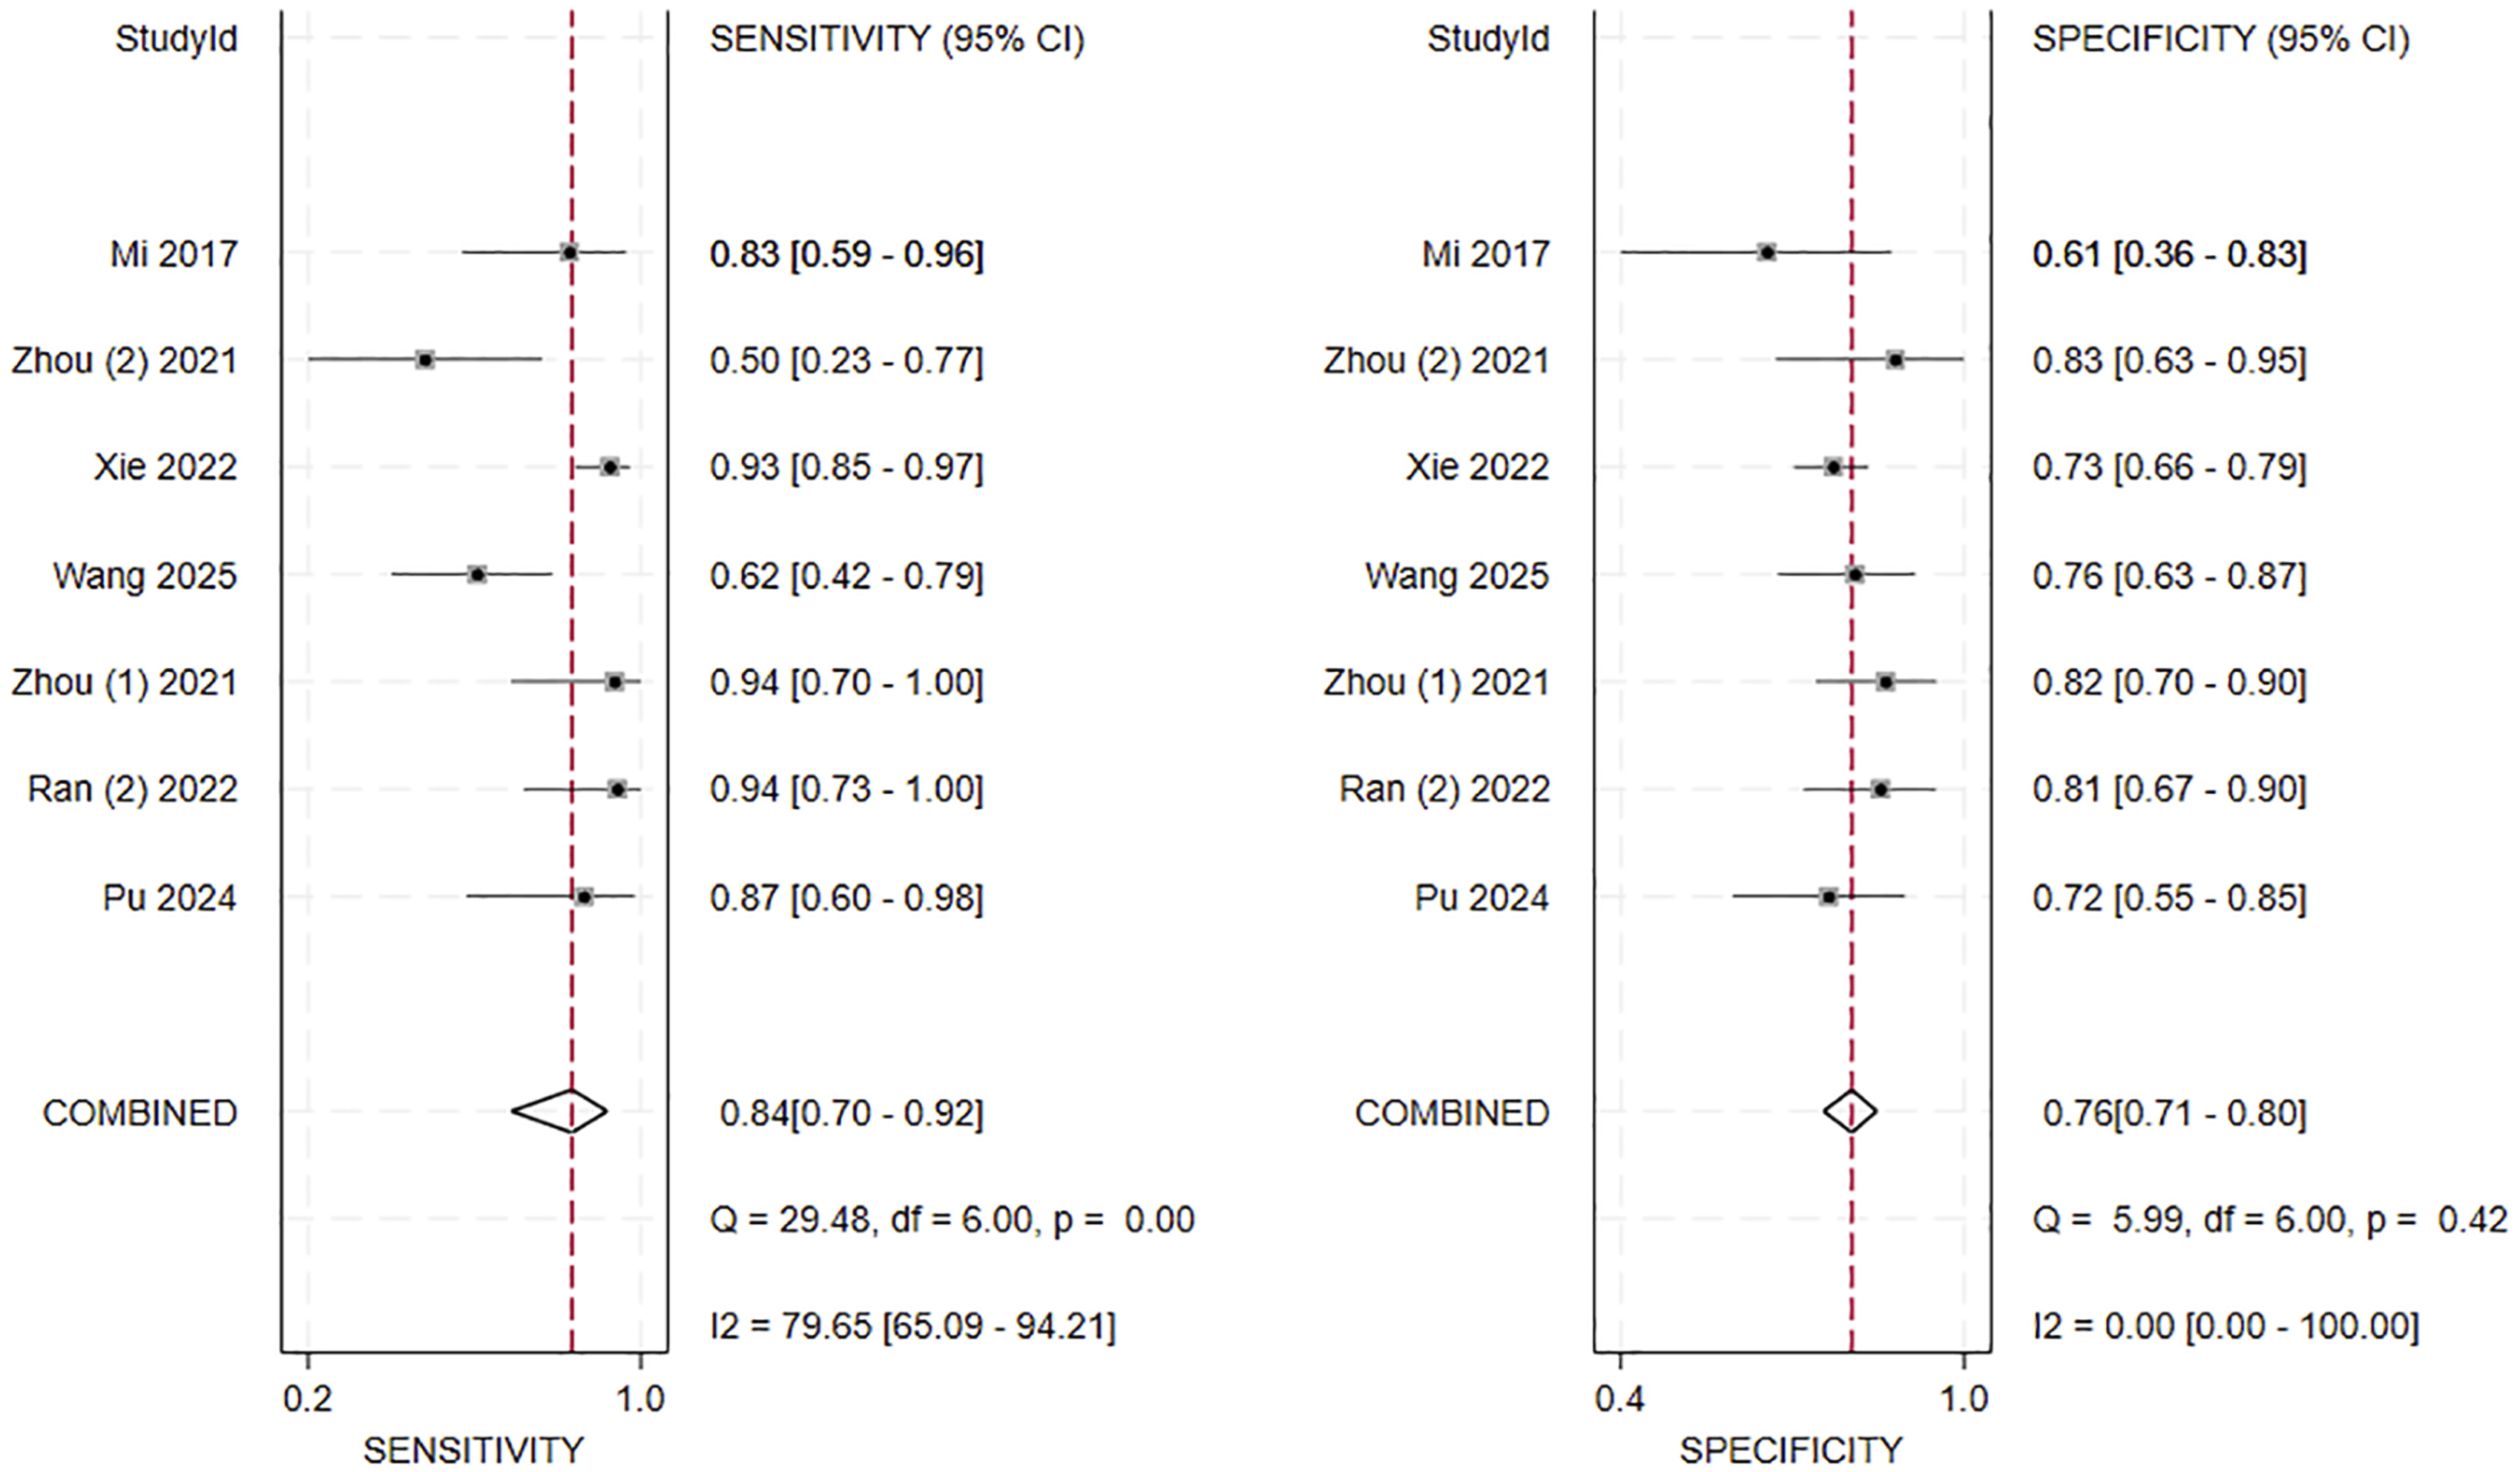

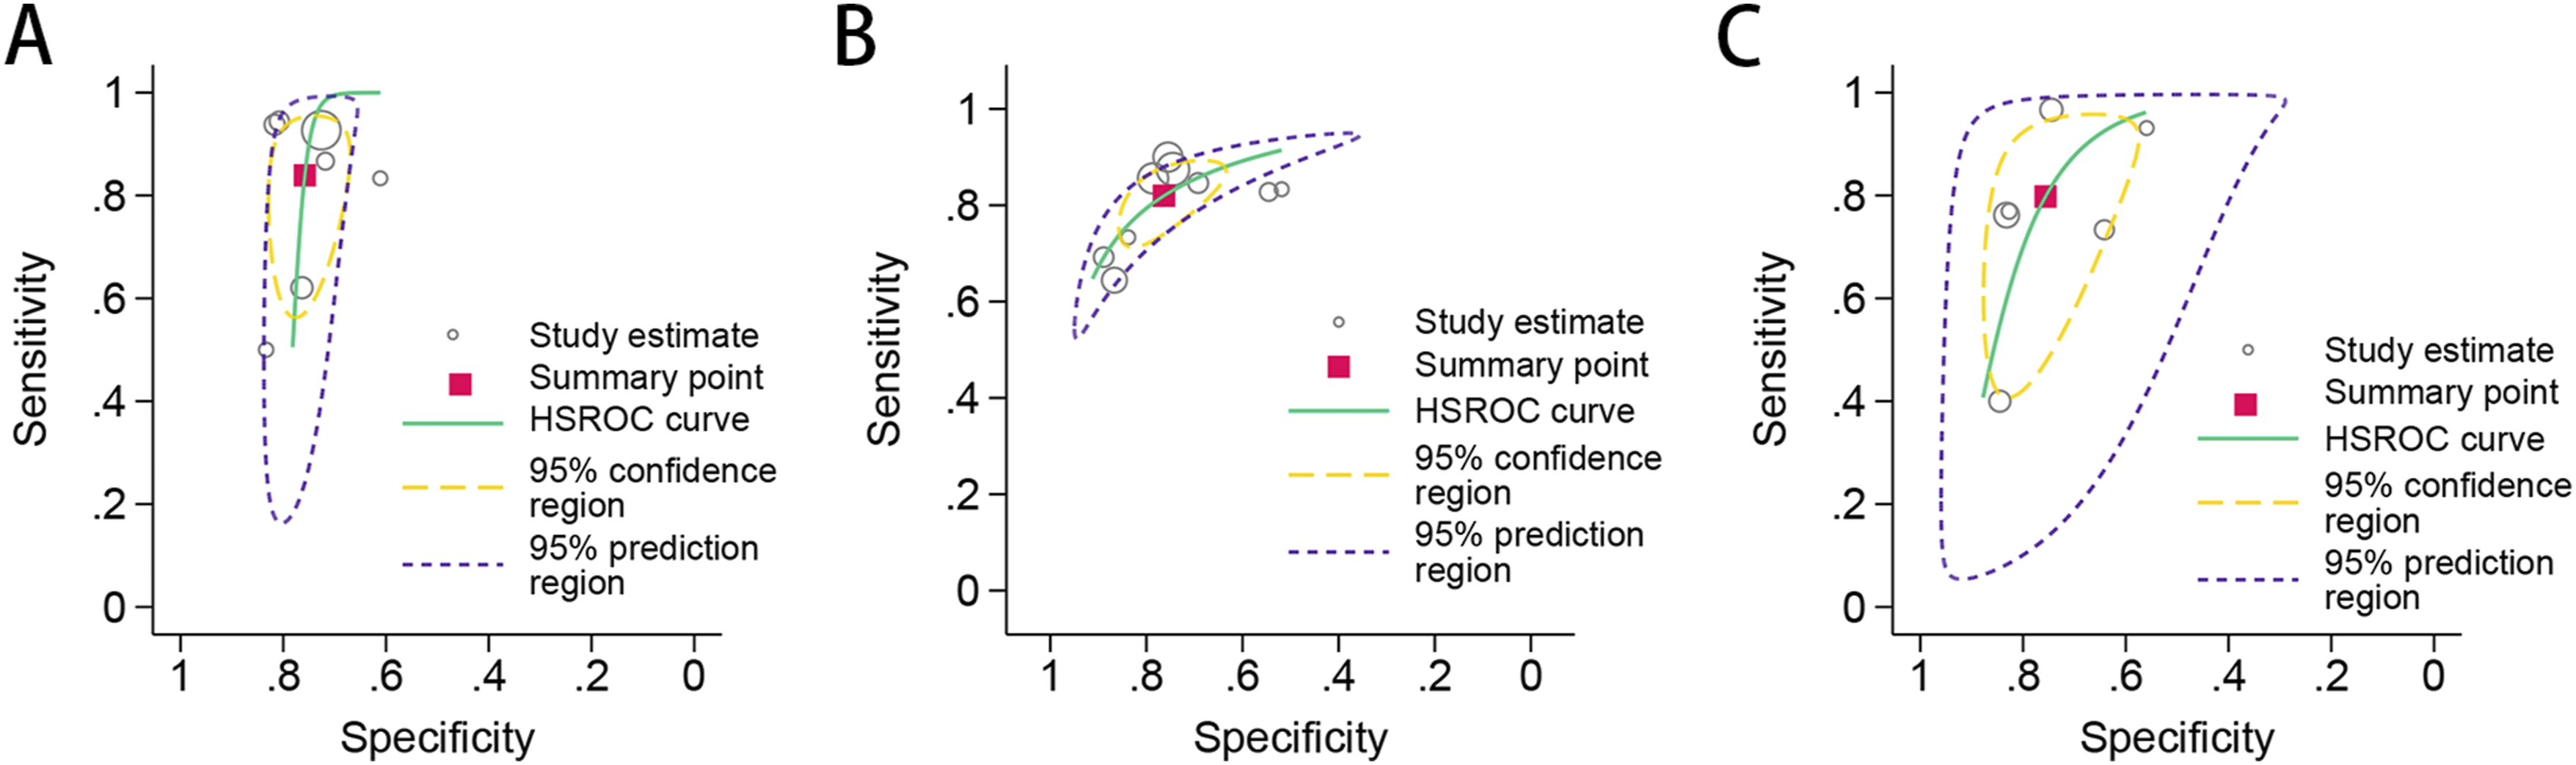
Nine studies13,14,19-23,26,30 reported information on TP, FP, FN, and TN outcomes. The VBQ threshold ranged from 2.71 to 4.10, with a mean of 3.30 ± 0.42. The threshold effect test revealed no significant heterogeneity (P = 0.205). The pooled sensitivity and specificity were 0.82 (95% CI, 0.76-0.87) and 0.76 (95% CI, 0.68-0.83), respectively (Figure 9). The pooled PLR was 3.46 (95% CI, 2.66-4.51), the NLR was 0.24 (95% CI, 0.18-0.31), and the DOR was 14.67 (95% CI, 10.51-20.48), as summarized in Table 2. The HSROC curve in Figure 8B yielded an AUC of 0.86 (95% CI, 0.83-0.89). Forest plot of the combined sensitivity and specificity of VBQ for assessing CS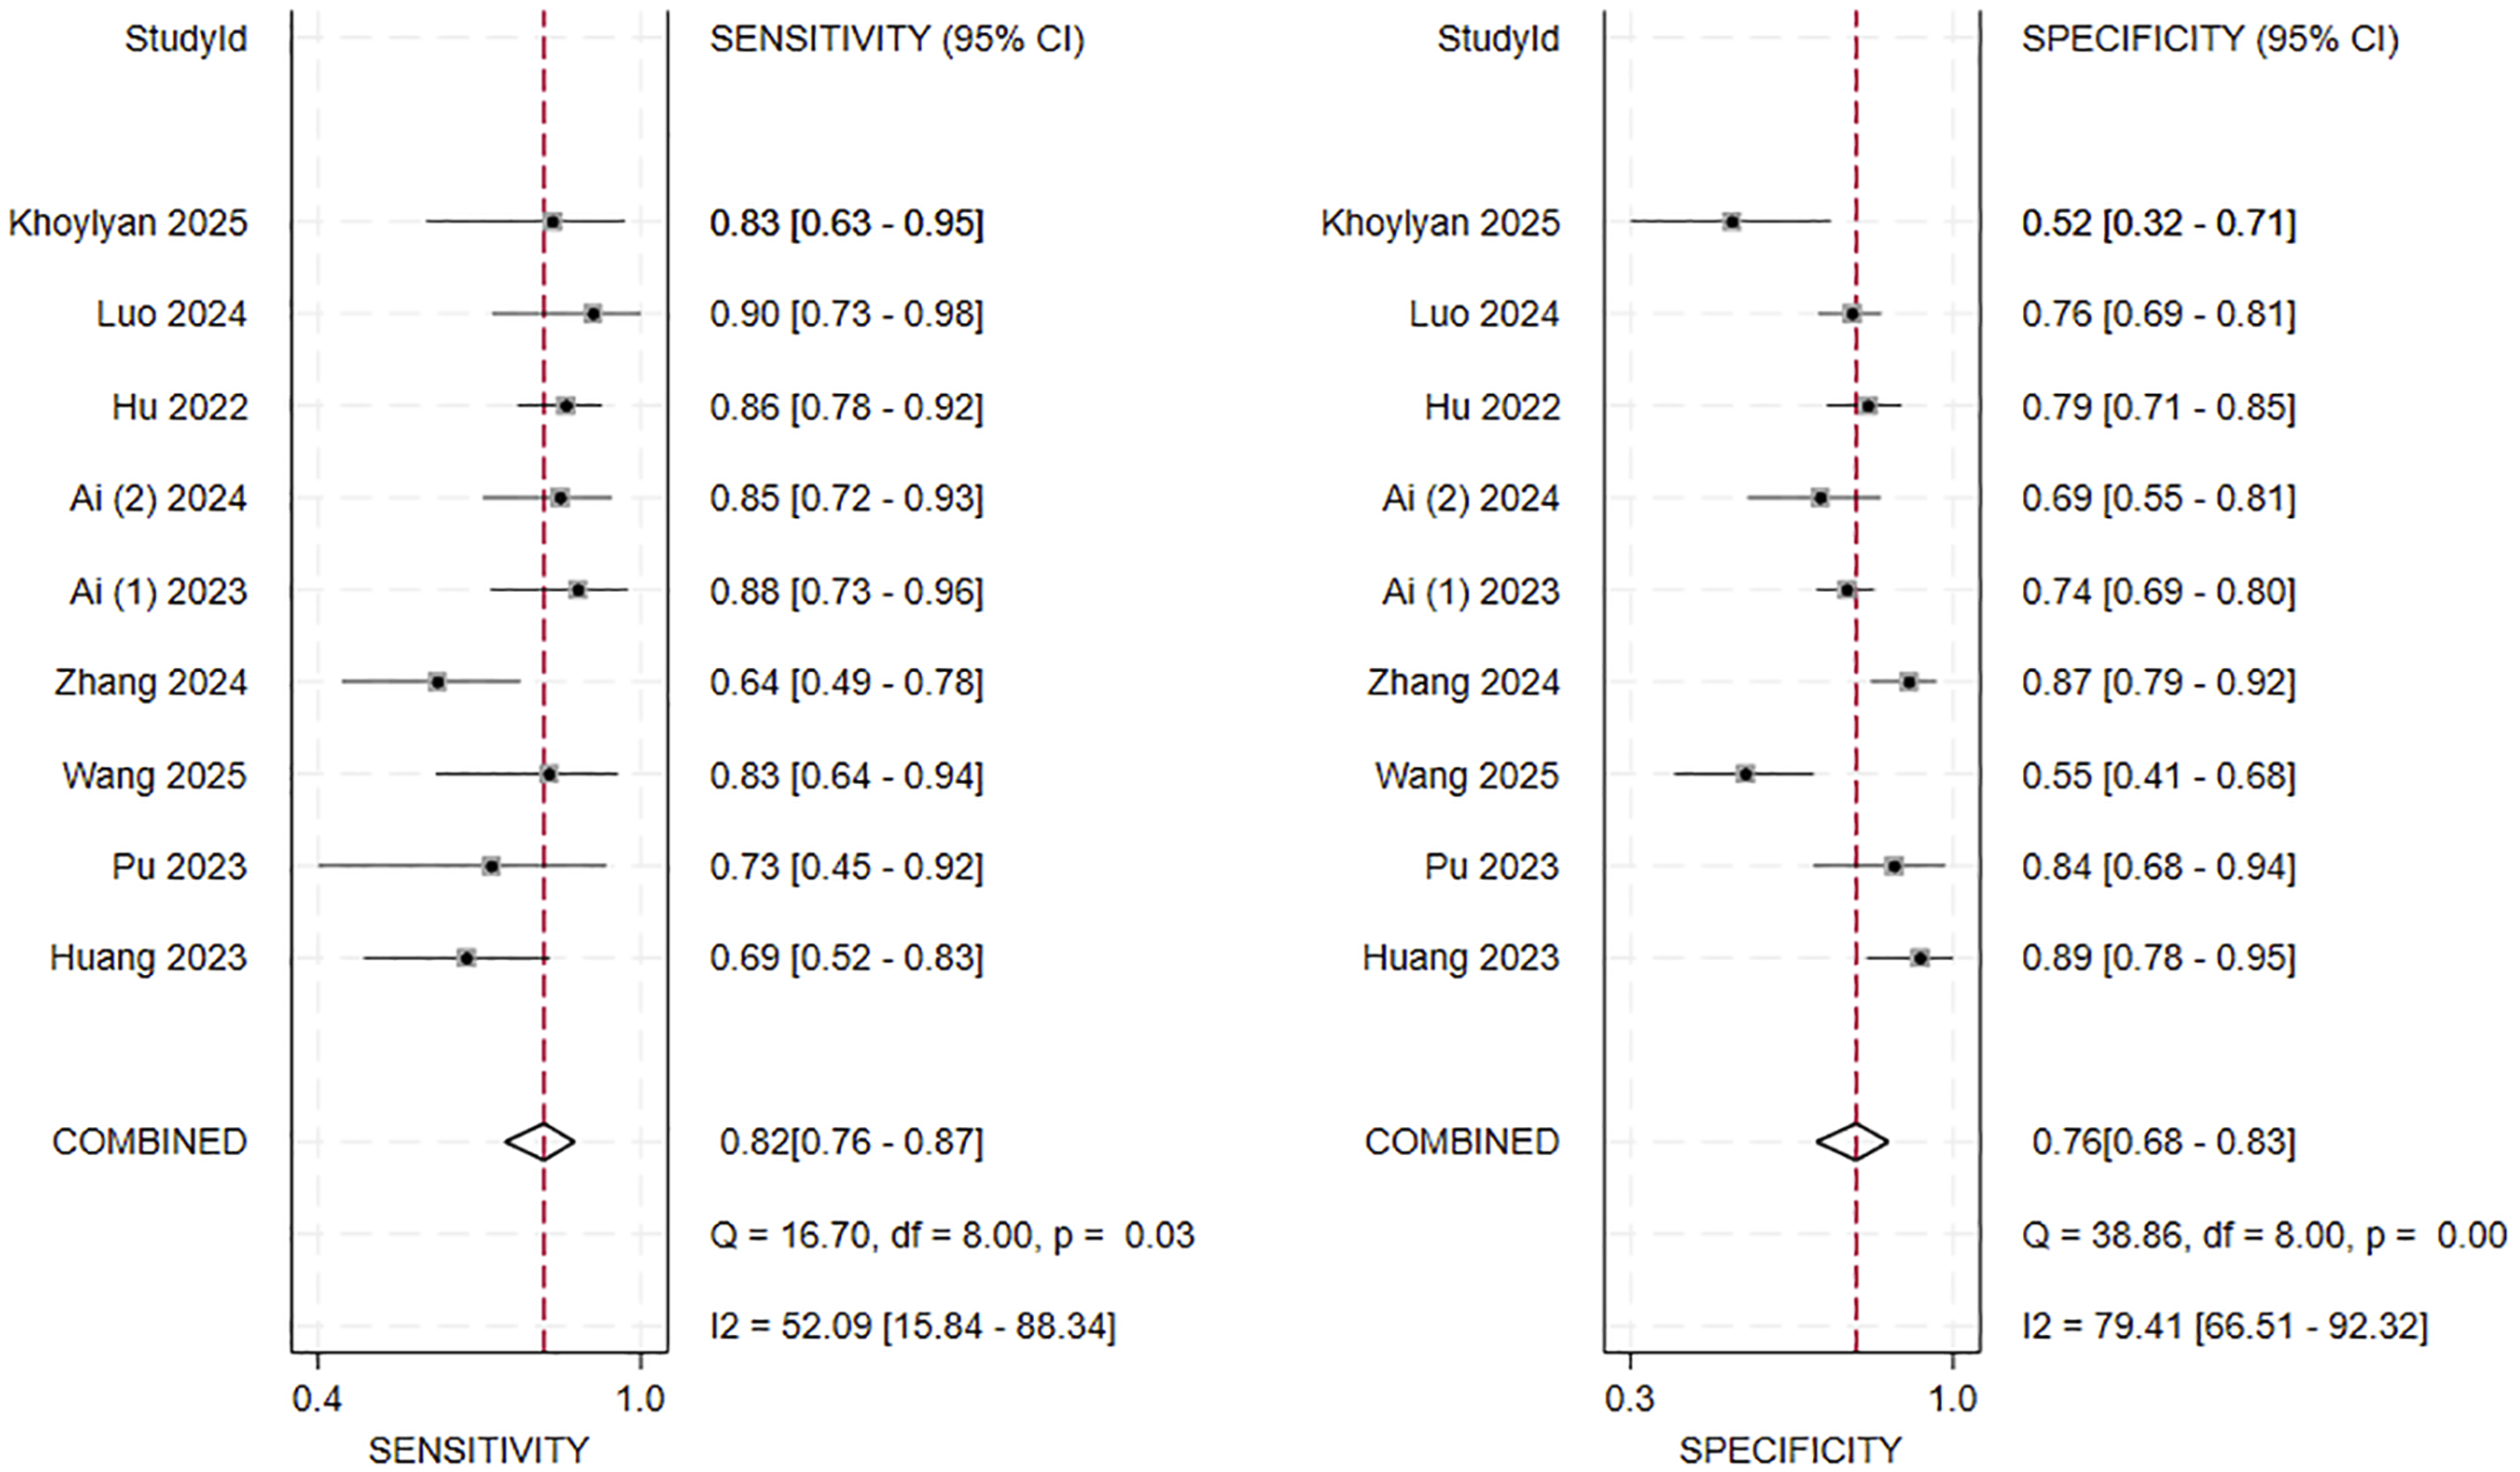
Six studies4,12,13,25,26,30 reported information on TP, FP, FN, and TN outcomes. The EBQ threshold ranged from 2.318 to 5.100, with a mean of 4.28 ± 1.00. The results of the threshold effect analysis indicated no significant heterogeneity (P = 0.266). The pooled sensitivity and specificity were 0.80 (95% CI, 0.61-0.91) and 0.76 (95% CI, 0.67-0.83), respectively (Figure 10). The PLR was 3.27 (95% CI, 2.48-4.32), the NLR was 0.27 (95% CI, 0.13-0.53), and the DOR was 12.24 (95% CI, 5.63-26.61), as presented in Table 2. The HSROC curve, illustrated in Figure 8C, showed an AUC of 0.83 (95% CI, 0.79-0.86). Forest plot of the combined sensitivity and specificity of EBQ for assessing CS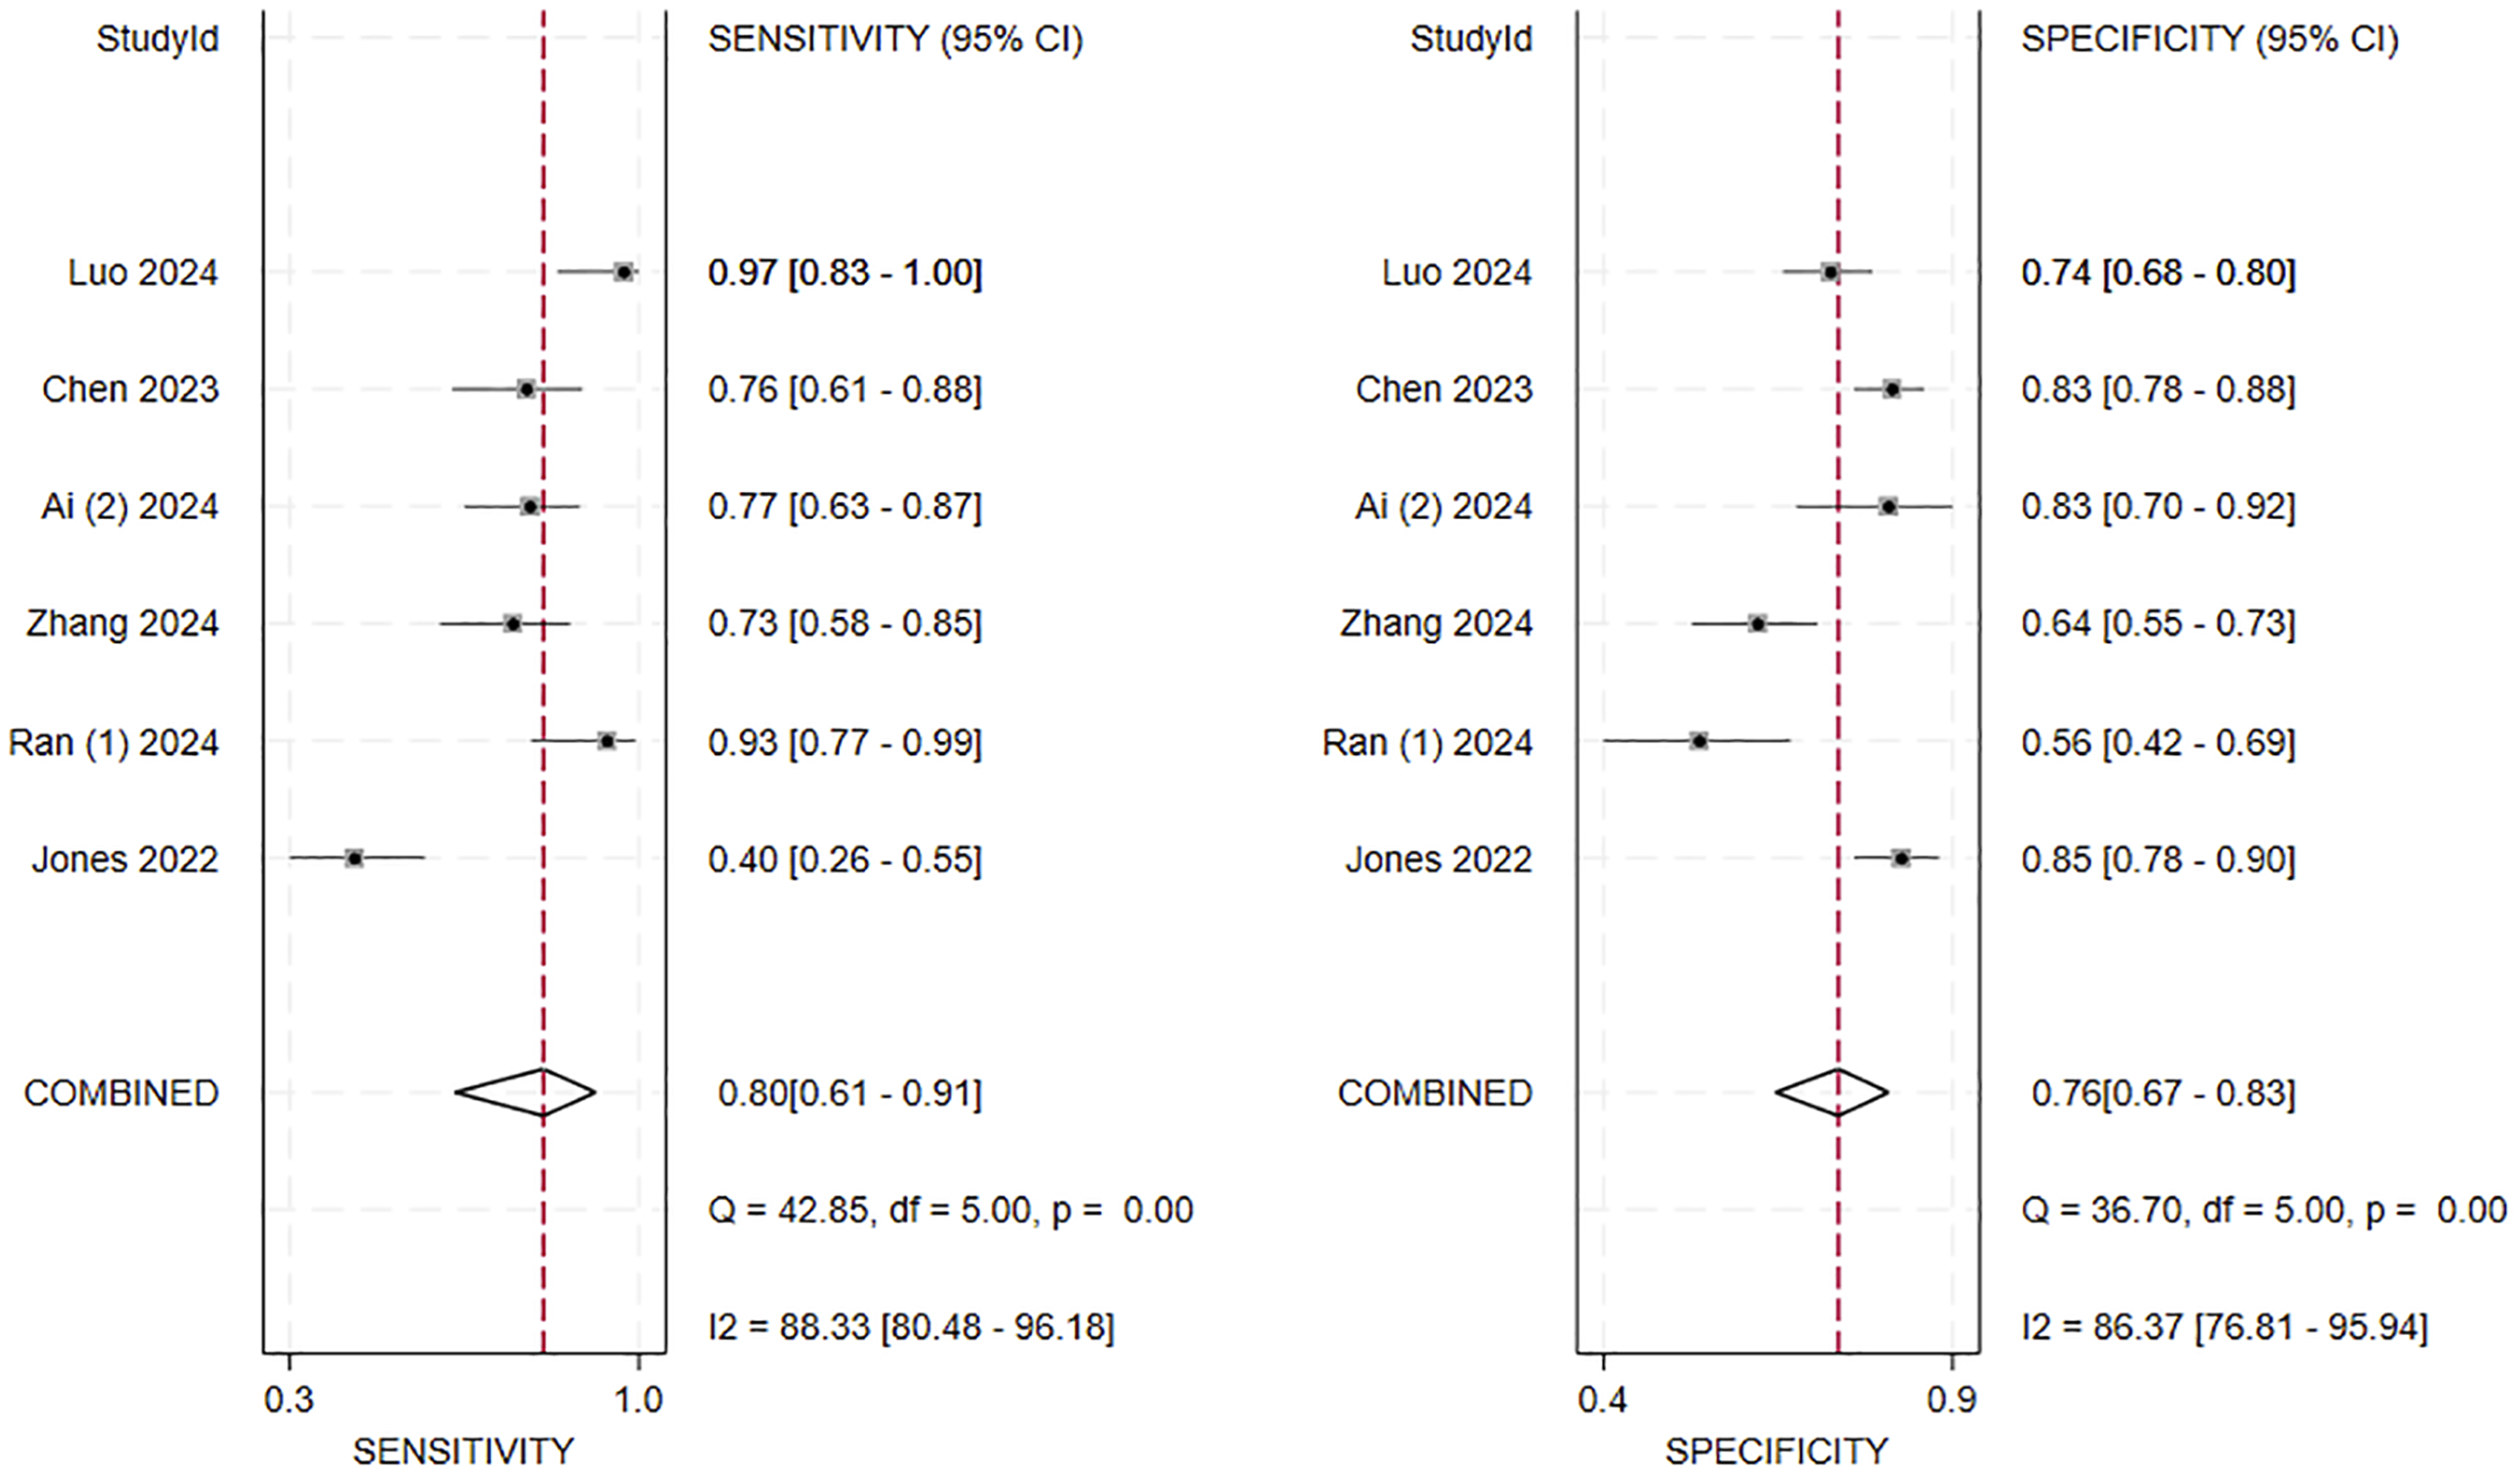
Furthermore, the meta-regression analysis using HU, VBQ, and EBQ as covariates showed that there was no statistically significant difference in diagnostic accuracy among these three indicators (P > 0.05), indicating that they exhibited approximately equivalent diagnostic performance in predicting CS.
Risk of Publication Bias
Figure 11A–C presents the funnel plots of HU value, VBQ and EBQ. The results indicate that the risk of publication bias for these three indicators is relatively low, with P values of 0.43, 0.09 and 0.25 respectively. Deeks’ funnel plots for assessing publication bias in predicting postoperative CS. (A) HU value, (B) VBQ, and (C) EBQ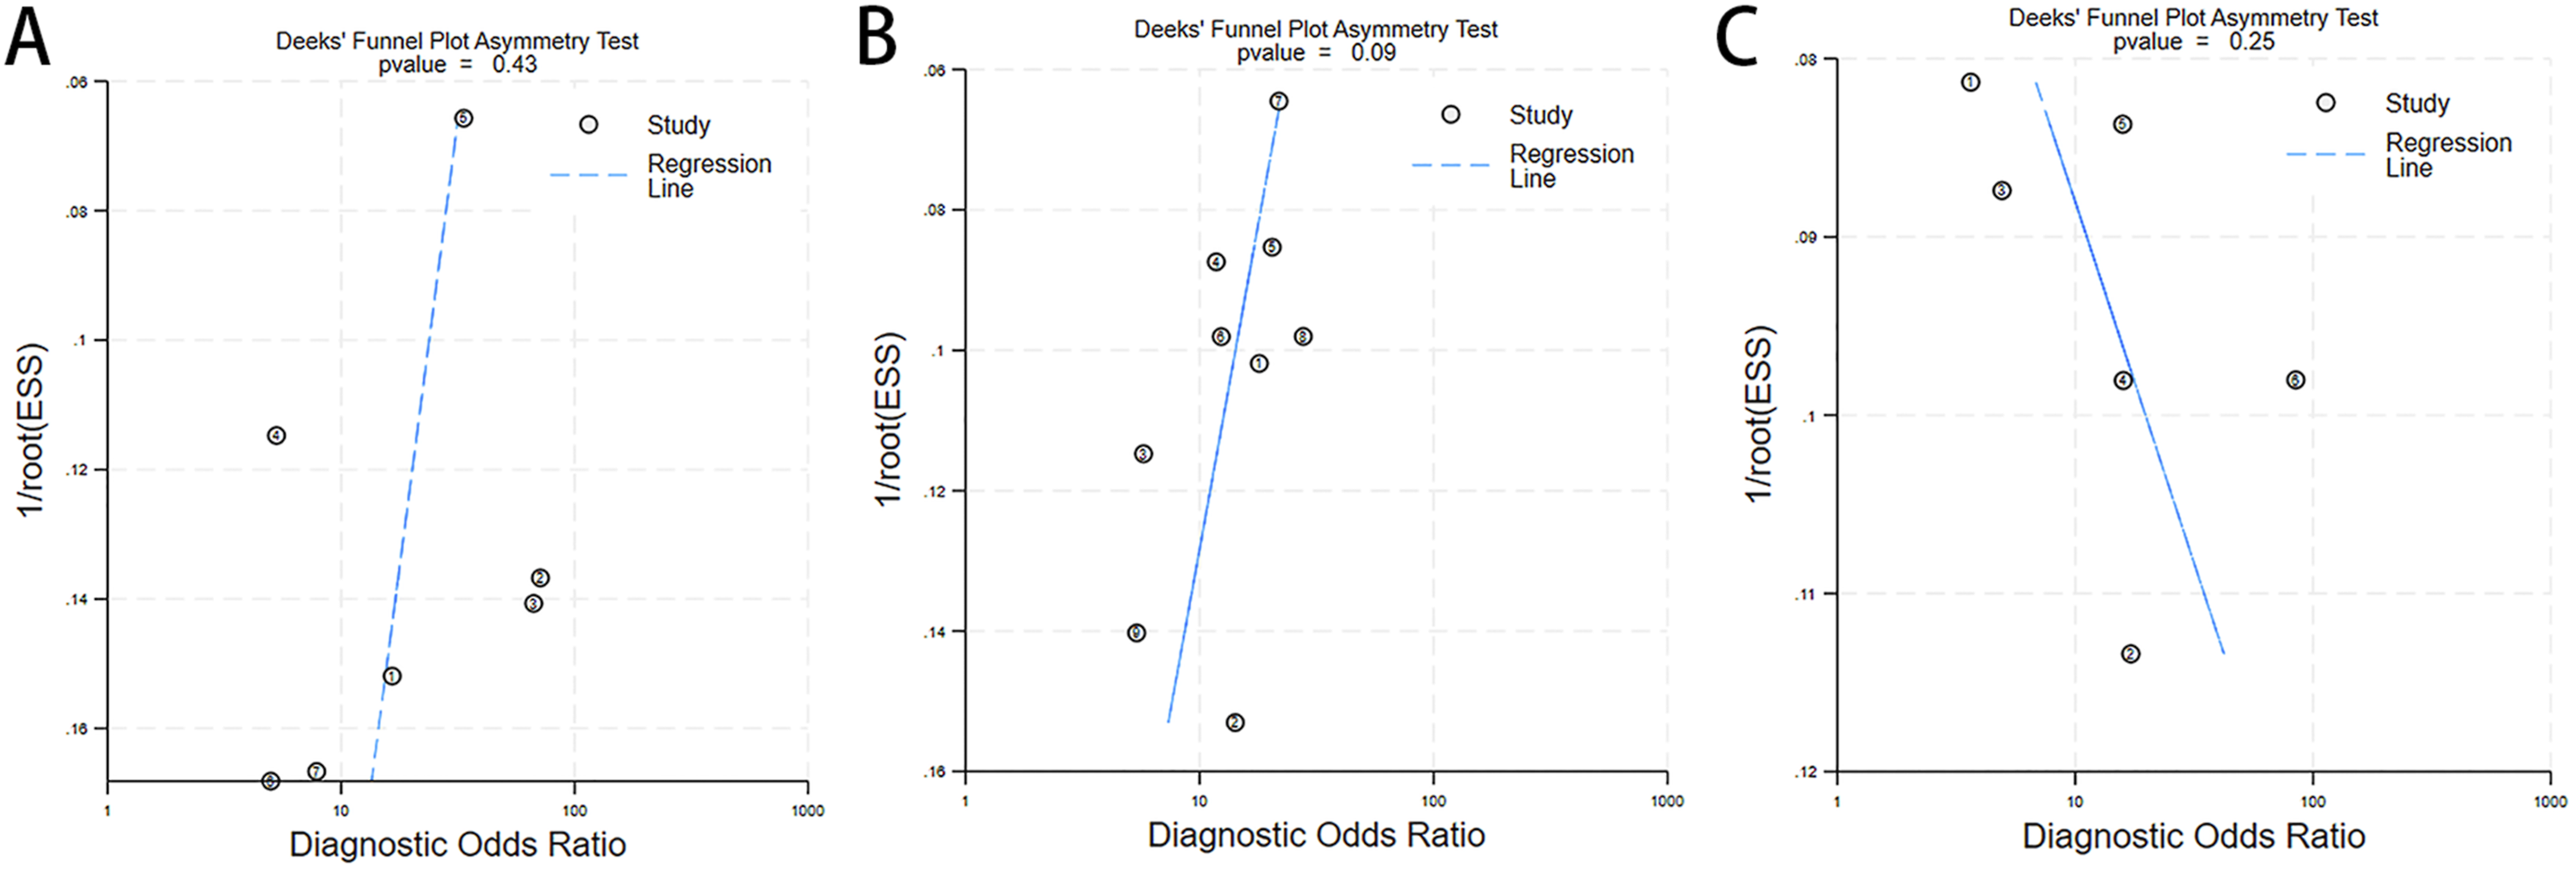
Fagan Plots
The clinical applicability of HU value, VBQ, and EBQ for identifying high-risk patients with CS was further evaluated using the Fagan nomogram (Figure 12A–C). Assuming a pre-test probability of 30% (consistent with the approximate prevalence in the included studies), a positive test result increased the post-test probabilities to 60%, 60%, and 58% for HU value, VBQ, and EBQ, respectively. Conversely, a negative test result reduced the post-test probabilities to 8%, 9%, and 10%. These findings suggest that the positive and negative predictive capacities of the three indicators are largely comparable. Fagan nomograms for predicting postoperative CS. (A) HU value, (B) VBQ, and (C) EBQ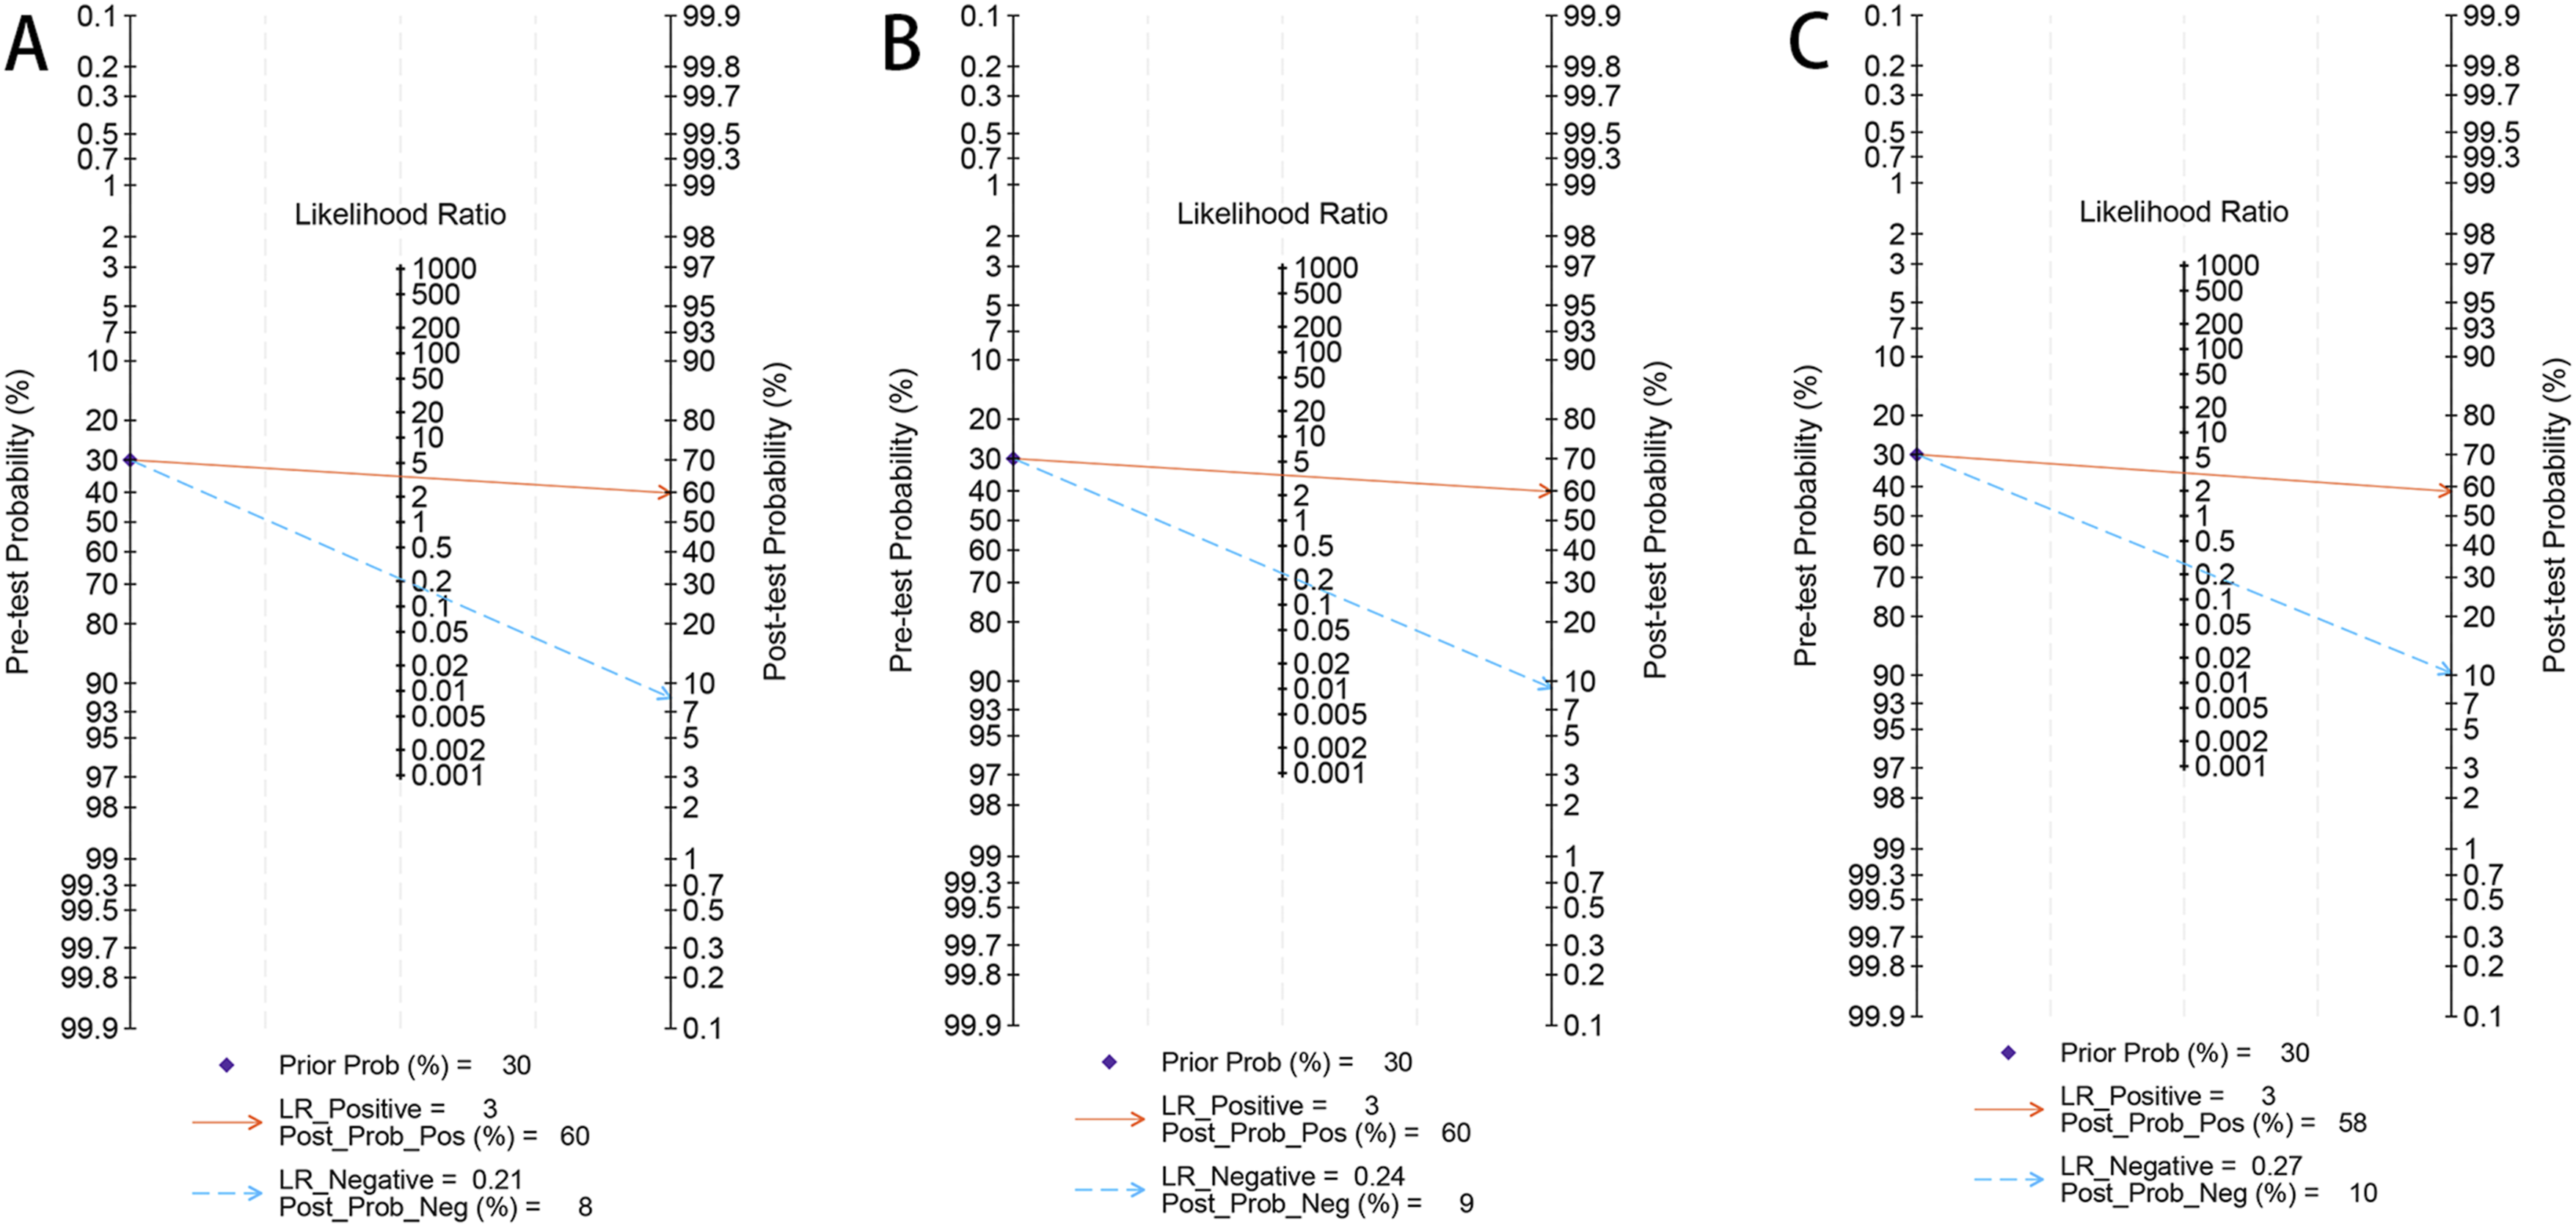
Meta-Regression Analysis
To further investigate potential sources of heterogeneity for HU values, VBQ, and EBQ, we performed a meta-regression analysis (Figure 13A–C). The covariates included study country, CS definition, surgical type, cutoff value, age, gender ratio, BMI, sample size, and follow-up duration. The analysis indicated that the proportion of female patients might contribute to heterogeneity in VBQ, while CS definition, country, cut-off, and BMI were significant sources of heterogeneity for EBQ (P < 0.05). In contrast, no covariates were identified as significant sources of heterogeneity for HU values. Meta-regression analysis of included studies to identify sources of heterogeneity in predicting postoperative CS. (A) HU value, (B) VBQ, and (C) EBQ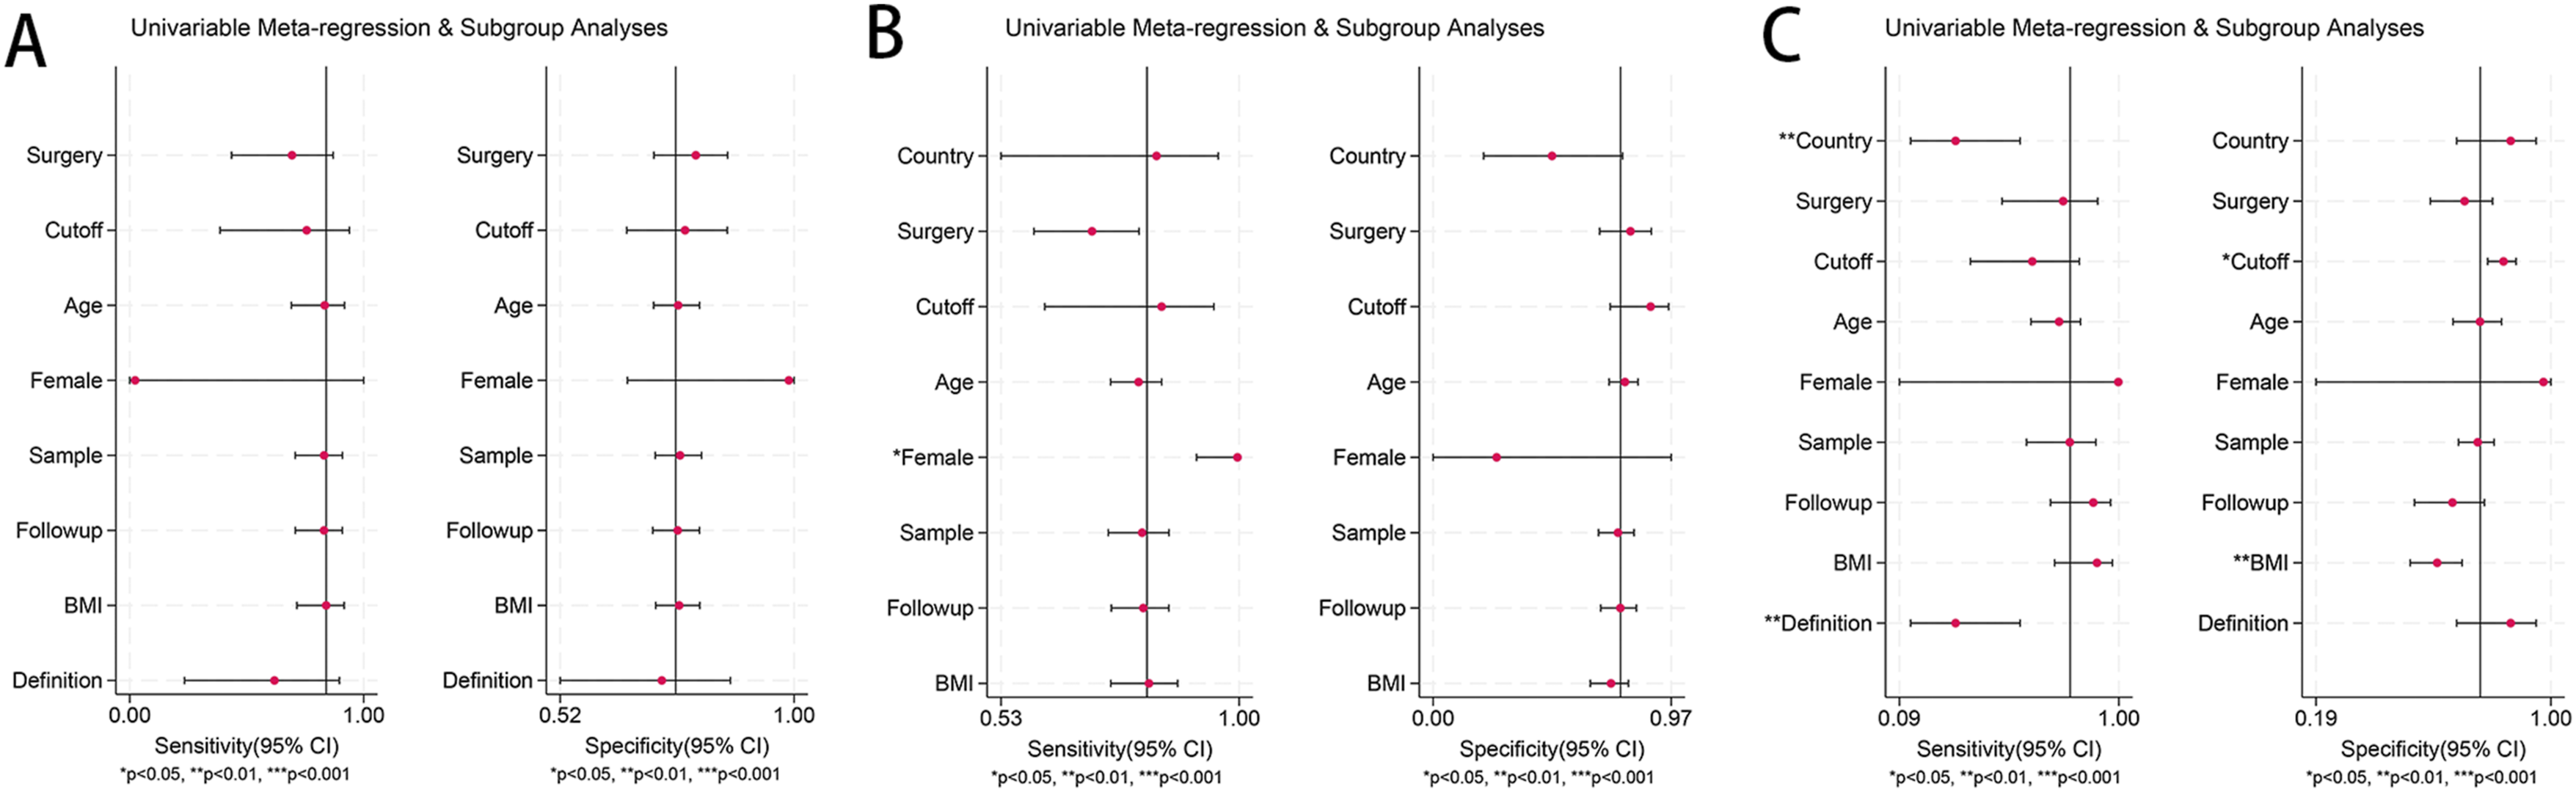
Discussion
In this study, the diagnostic efficacy of HU values, VBQ scores, and EBQ scores in predicting CS after degenerative lumbar fusion was evaluated for the first time using a combination of systematic review and meta-analysis. Based on 20 included studies encompassing 2648 patients, our findings confirmed that all three imaging metrics differed significantly between the CS and non-CS groups. The mean cut-off values were 115.18 ± 10.80 for HU, 3.30 ± 0.42 for VBQ, and 4.28 ± 1.00 for EBQ. Among these, the VBQ score demonstrated the highest diagnostic accuracy, with a pooled AUC of 0.86 (95% CI: 0.83-0.89), suggesting its superior potential for preoperative identification of patients at high risk for CS.
Preoperative Bone Quality Assessment: HU, VBQ, and EBQ Scores
Poor preoperative bone quality has been identified as a significant risk factor for CS in patients undergoing spinal surgery.4,19 To improve clinical outcomes, spinal surgeons should carefully assess patients’ bone quality before surgery and implement timely interventions to reduce the risk of postoperative complications. DXA is considered the gold standard for evaluating osteoporosis. 36 However, in patients with degenerative lumbar spine disease, factors such as osteophyte formation, aortic calcification, vertebral endplate degeneration, and prior compression fractures can interfere with DXA accuracy in assessing cancellous BMD of the vertebrae.37-39 Therefore, there is a critical need for a simple, accurate method to assess preoperative bone quality.
CT-based HU values are considered a reliable alternative for assessing bone quality by placing a ROI in the cancellous bone of a vertebra while avoiding cortical bone and vascular structures, thus directly obtaining vertebral HU measurements. 16 Studies have shown that HU values may offer improved accuracy for osteoporosis screening compared to DXA, and lumbar spine CT is routinely performed as part of preoperative assessment in spinal surgery.37,40 This allows for opportunistic evaluation of bone quality and prediction of postoperative complications without additional cost or radiation exposure.14,23
The VBQ score was first proposed by Ehresman et al 11 and has since been validated in subsequent studies. Salzmann et al 10 demonstrated a significant correlation between the VBQ and BMD measured by QCT, confirming its ability to distinguish between normal BMD and osteopenia/osteoporosis. The VBQ score is based on the principle that adipose tissue appears hyperintense on T1-weighted MRI, and it is calculated as the SI ratio between the vertebral body and CSF. This metric indirectly reflects bone quality, with higher scores indicating poorer bone quality. 41 Like HU values, the VBQ score can be derived from routine preoperative imaging—specifically MRI—and offers the advantages of being non-invasive, radiation-free, and widely accessible, making it a practical tool for opportunistic preoperative assessment of bone quality. Studies have shown that the VBQ score not only predicts fragility fractures 42 but is also strongly associated with postoperative complications such as CS 13 and screw loosening. 43
With increasing recognition of the importance of endplate bone quality at the fusion interface, 44 research has shown that compromised bone quality in this region significantly elevates the risk of CS and may lead to poor clinical outcomes or even necessitate revision surgery.45,46 In response, Jones et al 12 introduced the EBQ score, which assesses local bone quality at the fusion surface by measuring the SI ratio of the superior and inferior endplates of the operative segment to the CSF at the L3 level on MRI. The EBQ score has been shown to be closely associated with postoperative CS and may address the limitations of the VBQ score in evaluating localized endplate changes.13,26,30
Diagnostic Performance and Clinical Implications
The AUC is widely used to assess the diagnostic accuracy of tests, with values between 0.75 and 0.92 generally considered favorable. 47 In this study, the AUC for HU values was 0.78, which was lower than that of VBQ (0.86) and EBQ (0.83), suggesting that HU values may provide relatively limited predictive accuracy for postoperative CS following lumbar surgery. Further analysis showed that the pooled sensitivity and specificity of the VBQ score were 0.82 and 0.76, respectively, indicating a relatively strong diagnostic value. In contrast, the EBQ score demonstrated pooled sensitivity and specificity of 0.80 and 0.76, suggesting slightly inferior overall performance compared with VBQ.
This difference in diagnostic performance may be attributed to the distinct measurement focuses of the two methods. The VBQ score emphasizes the overall SI and structural integrity of vertebral cancellous bone, thereby reflecting global bone quality. In contrast, the EBQ score evaluates localized regions of the endplate and is more susceptible to confounding factors such as endplate sclerosis, degenerative changes, and MRI signal variability. For instance, some studies included patients with Modic changes in the endplate, 13 which are characterized by low SI on T1-weighted images and may affect the accuracy of EBQ measurements. Additionally, the EBQ score requires precise measurement of the subchondral bone within 3 mm beneath the endplate, which can be challenging in cases of irregular endplate morphology or poor image clarity. In contrast, the VBQ score covers a broader area of cancellous bone and is less prone to measurement bias, making it more standardized and easier to apply across studies.
It is worth noting that the HU values demonstrated higher sensitivity (0.84) and diagnostic odds ratio (16.34) than VBQ and EBQ, indicating certain advantages in identifying high-risk patients. However, its overall AUC was relatively low, likely reflecting susceptibility to factors such as tube voltage, contrast agent use, and slice thickness.48,49
Source of Heterogeneity
The HU values in this study exhibited considerable heterogeneity. After excluding the study by Chang et al., 29 the I2 value decreased significantly from 81% to 35%, suggesting that this study might be the main source of heterogeneity. The reason for this difference might be that measuring only one layer of the vertebrae resulted in it, while other studies measured three layers of the vertebrae and took the average value.24,29 However, after including variables such as surgical methods, thresholds, and age in the Meta regression analysis, it was found that these factors did not significantly affect the heterogeneity of HU values.
The meta-analysis of VBQ scores also showed high heterogeneity. Through meta-regression, the gender ratio was identified as a potential source of heterogeneity. The proportion of females in the included studies varied greatly (45%–73%), and women, especially postmenopausal women, had a significantly higher incidence of osteoporosis and more pronounced decline in vertebral bone quality, making VBQ more sensitive to this. Additionally, variations in EBQ scores were primarily attributed to differences in CS definition, study country, cut-off values, and BMI (P < 0.05).
Therefore, in future studies, efforts should be made to maintain consistent measurement methods, balance the gender ratio of the study subjects, and standardize threshold settings to enhance the comparability among different studies and the reliability of the results.
Limitations and Future Research Directions
To our knowledge, this is the first systematic meta-analysis to compare the diagnostic value of HU values, VBQ, and EBQ scores for predicting the risk of postoperative CS in lumbar spine surgery. Despite the reference value of our findings, several limitations should be acknowledged. First, most included studies were conducted in China, with the majority of participants being middle-aged or elderly and of East Asian descent, which may limit the generalizability of the findings to younger or healthier populations and to other regions. Second, most studies employed retrospective designs, which are prone to selection bias, and the overall quality of the included studies was relatively low. Third, many studies only reported using ‘CT’ or ‘T1-weighted MRI’ for HU, VBQ, or EBQ measurement, without providing detailed imaging parameters such as CT tube voltage (kVp), slice thickness, or MRI field strength, limiting our ability to identify sources of heterogeneity in meta-regression analyses. Fourth, although HU values, VBQ scores, and EBQ scores demonstrated diagnostic utility, direct head-to-head comparative studies evaluating all three modalities within the same cohort are still lacking, limiting comprehensive assessment of their relative strengths. Fifth, thresholds for VBQ varied widely; although Spearman correlation analysis suggested minimal threshold effect, the optimal cut-off values require further investigation.
Future research should prioritize prospective, multicenter studies, include more diverse populations, and employ standardized imaging protocols—such as consistent CT tube voltage, uniform slice thickness, and fixed MRI field strength and sequence parameters. In addition, direct head-to-head comparisons of HU, VBQ, and EBQ within the same cohort are required to verify their relative diagnostic performance.
Conclusion
This study systematically assessed the diagnostic value of HU values, VBQ scores, and EBQ scores for predicting CS following lumbar fusion surgery, incorporating 20 studies with a total of 2648 patients. The results demonstrated that all three imaging metrics effectively distinguished patients with CS, with the VBQ score showing slightly superior diagnostic performance (AUC = 0.86). Therefore, the VBQ score represents a valuable preoperative tool for evaluating bone quality, aiding in the identification of high-risk patients, guiding surgical decision-making, and contributing to the prevention of postoperative complications.
Footnotes
Funding
The authors disclosed receipt of the following financial support for the research, authorship, and/or publication of this article: This work was supported by National Natural Science Foundation of China (82360438), Guangxi Natural Science Foundation (2023GXNSFAA026339), and Joint Project on Regional High-Incidence Diseases Research of Guangxi Natural Science Foundation (2024GXNSFDA010043).
Declaration of Conflicting Interests
The authors declared no potential conflicts of interest with respect to the research, authorship, and/or publication of this article.