
Abstract
Study design
This was a monocentric-retrospective study in a high-volume spine center.
Objective
Osteoporosis and sarcopenia frequently coexist and contribute to increased fracture risk and functional decline. Their relationship is however confounded by age and sex. This study compared lumbar muscle morphology in patients with osteoporotic vertebral fractures (OVFs) and matched fracture-free controls.
Methods
This study screened 221 patients with manifest osteoporosis and radiologically confirmed OVFs and 500 fracture-free controls who underwent spinal MRI and CT. After 1:1 propensity score matching for age and sex, 166 OVF patients (OF group) and 166 controls (Non-OF group) were included. BMD was assessed using Hounsfield units (HU). Lumbar muscle metrics were quantified from axial MRI at L4, including psoas (pCSA), paraspinal (psCSA) cross-sectional areas, indices normalized to height (pMI, psMI), vertebral body–adjusted indices (pLVI, psLVI), and fat infiltration (pFI, psFI) together with functional cross-sectional area (pfCSA, psfCSA).
Results
Groups were balanced for age and sex. OF patients had significantly lower HU (73.1 ± 23.3 vs 119 ± 36.3 P < 0.001), lower hemoglobin and albumin levels. Absolute psoas and paraspinal muscle areas and muscle indices were comparable between groups. However, OF patients showed higher FI and reduced fCSA. In addition, in OF patients vertebral body–normalized muscle indices were lower, and HU correlated positively with functional muscle area and inversely with muscular fat infiltration, whereas no such associations were observed in controls.
Conclusions
In elderly OVFs patients, reduced vertebral bone mineral density is associated with impaired muscle quality rather than muscle quantity, supporting a disease-specific bone–muscle interaction relevant for integrated osteosarcopenia assessment.
Keywords
Introduction
Osteoporosis and sarcopenia are distinct yet closely interrelated musculoskeletal conditions that increasingly influence the health trajectory of the aging population. Osteoporosis, characterized by reduced bone mineral density (BMD) and deterioration of bone microarchitecture, predisposes to fragility fractures that represent a major source of morbidity, loss of independence, and increased mortality in older adults.1–3 Sarcopenia, the progressive decline in skeletal muscle mass and function, has been recognized as a core component of frailty, with profound implications for physical performance, fall risk, and survival. 4 Both conditions share common risk factors, and their coexistence often termed “osteosarcopenia” is associated with higher vulnerability to falls, fractures, functional decline and mortality.5,6
The strong bidirectional relationship between osteoporosis and sarcopenia is well documented, and their biological interplay has increasingly been investigated. 7 Bone and muscle share common embryologic origins, respond to similar endocrine and nutritional signals, and interact mechanically across the lifespan. Muscle wasting contributes to skeletal fragility both directly, by reducing mechanical loading and impairing postural stability, and indirectly, through myokine and inflammatory pathways that accelerate bone resorption. 8 Conversely, osteoporotic fractures frequently precipitate immobilization, thereby accelerating muscle atrophy and perpetuating further functional decline. 9 This growing understanding of the bone-muscle unit provides a strong rationale for combined diagnostic and therapeutic approaches in older patients with frailty. 10
Diagnosis of sarcopenia in osteoporotic patients, however, is methodologically challenging. This difficulty arises mainly from key diagnostic metrics for sarcopenia, including muscle cross-sectional area and derived indices, which are strongly influenced by age, sex, and body size.11,12 Furthermore, the cut-off values for diagnosis in these quantitative measurements often rely on normative data from a reference population of young adults. Even normalization-based muscle indices including muscle index and lumbar vertebra index show clear age- and sex-dependence requiring age- and sex-specific reference values.13,14 Consequently, osteoporotic patients—who are typically older, predominantly female, and of lower body mass—are inherently predisposed to meet sarcopenia criteria even in the absence of pathological muscle wasting, raising the risk of overestimation.15–17 Thus, the need for well-designed studies with age- and sex-matched controls in sarcopenia analyses has been increasingly recognized.18,19
In this study, we compared quantitative measurements of lumbar muscle morphology in patients with osteoporotic vertebral fractures (OVFs) in a propensity score matched-cohort analysis based on age and sex.
Methods and Materials
Study Design
This retrospective cohort study included patients diagnosed with OVFs within a 4-year period (January 2020 – December 2024) at a single high-volume institution. These patients were matched 1:1 with a control group comprised of patients with no documented osteoporotic fractures. Ethical approval was obtained from the local ethics committee of the Berlin Chamber of Physicians (Ärztekammer Berlin, Approval number: Eth-SB-25-009), and the study complied with the Declaration of Helsinki guidelines. Given the retrospective design of the study, the requirement for informed consent was waived.
Study Population
Eligible participants were identified through the institutional database. The osteoporotic fracture (OF) group consisted of patients who fulfilled the following inclusion criteria: (1) age ≥18 years, (2) diagnosis of one or more acute symptomatic and radiologically confirmed OVFs, and (3) availability of axial magnetic resonance imaging (MRI) of the lumbar spine for muscle assessment. The control group (Non-OF) comprised of patients without documented OVFs who underwent spinal MRI for other indications (eg, degenerative spine disease or diagnostic work-up for back pain) during the same time frame. Patients with high-energy trauma, pathological fractures due to malignancy or infection, prior spinal instrumentation interfering with imaging landmarks, or missing clinical data were excluded.
A total of 221 patients with OVFs and 500 patients without documented fractures were identified from records in the specified 4-year time. Propensity scores were estimated using age and sex as covariates, and a total 166 patients in the OF group were successfully paired with 166 Non-OF controls (see Figure 1). Flow chart of patient recruitment and matching. OVFs – Osteoporotic vertebral fractures, OF – Osteoporotic fracture, MRI – Magnetic resonance imaging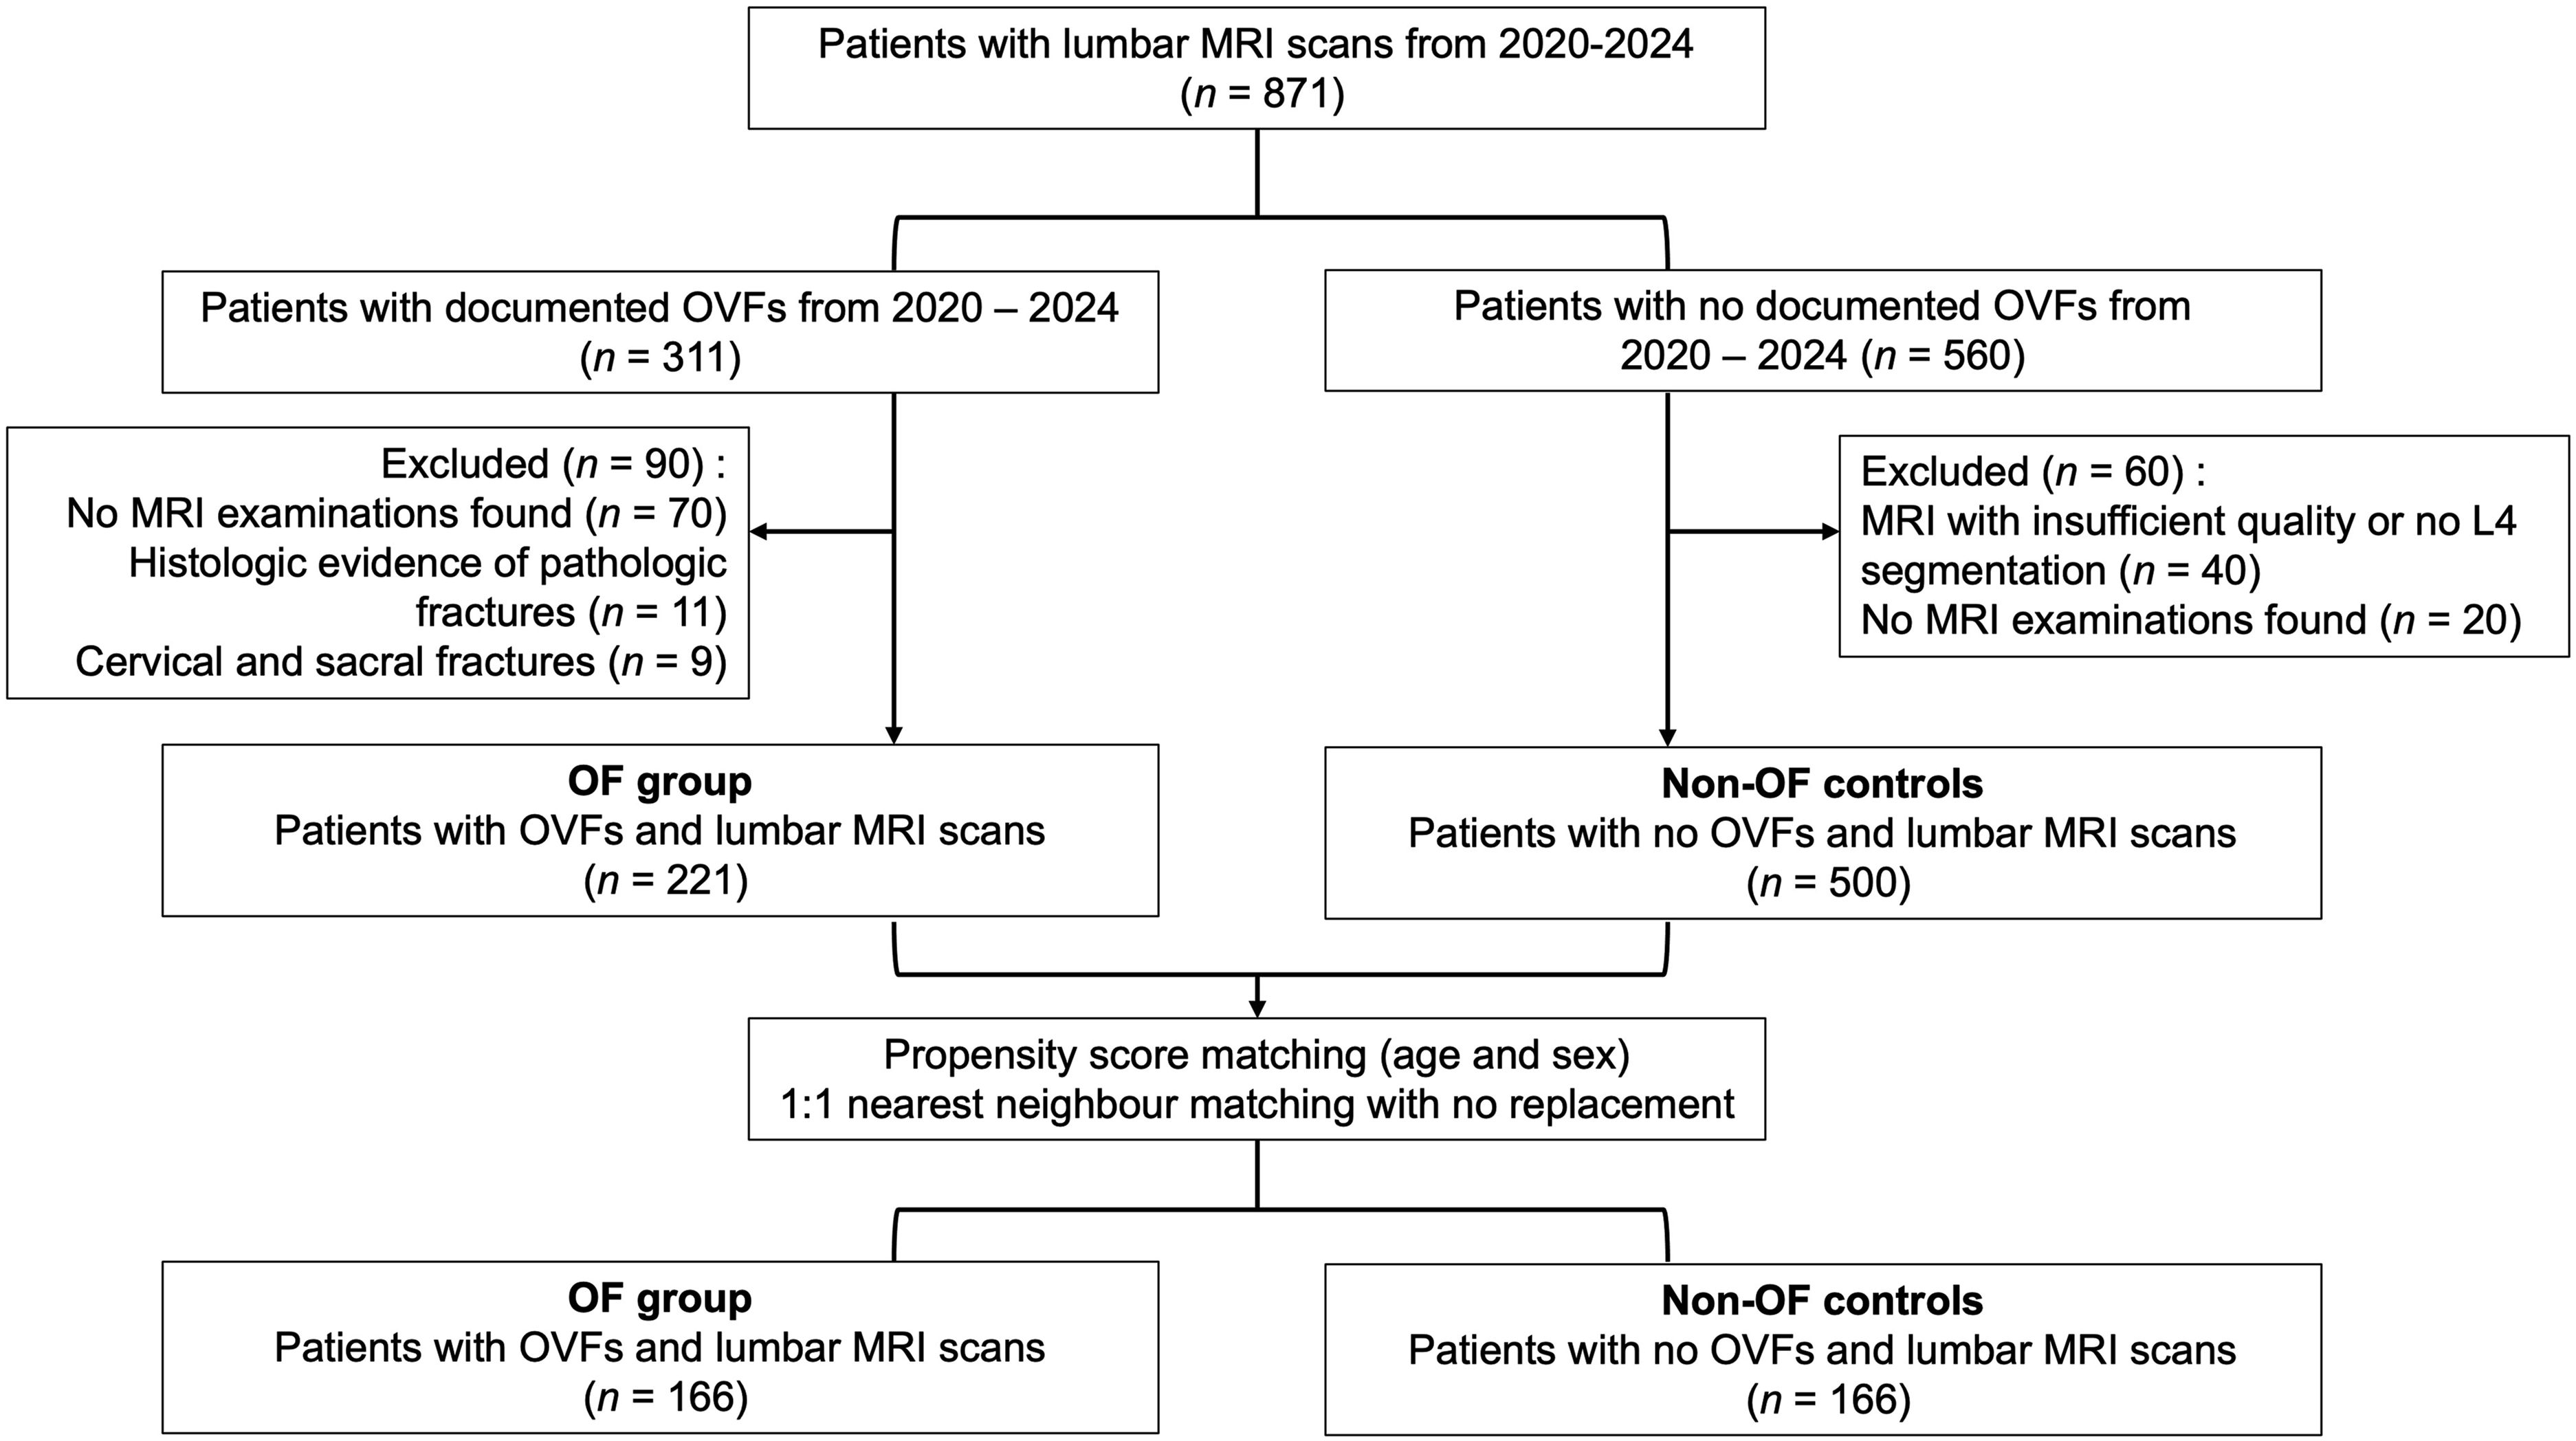
Propensity Score Matching
To reduce bias from demographic and anthropometric differences, a 1:1 propensity score matching was performed between OF patients and Non-OF controls. Propensity scores were calculated using logistic regression based on age and sex, variables known to strongly influence both muscle mass and fracture risk. Nearest-neighbor matching without replacement was applied, ensuring a standardized mean difference <0.1 for matched variables, indicating optimal balance.
Before matching, significant imbalances were observed between the groups: the mean age of patients in the OF group was higher than in the Non-OF controls (78.6 ± 8.7 vs 66.8 ± 9.9 years, standardized mean difference [SMD] = 1.36), and the proportion of females was also greater in the OF group (72.4% vs 57.6%, SMD = 0.33). After matching, all covariates were well balanced, with SMDs <0.05 for age and <0.001 for sex. Covariate balance before and after matching is shown in Figure 2 below. Covariance balance before and after matching. Reference line at SMD = 0.10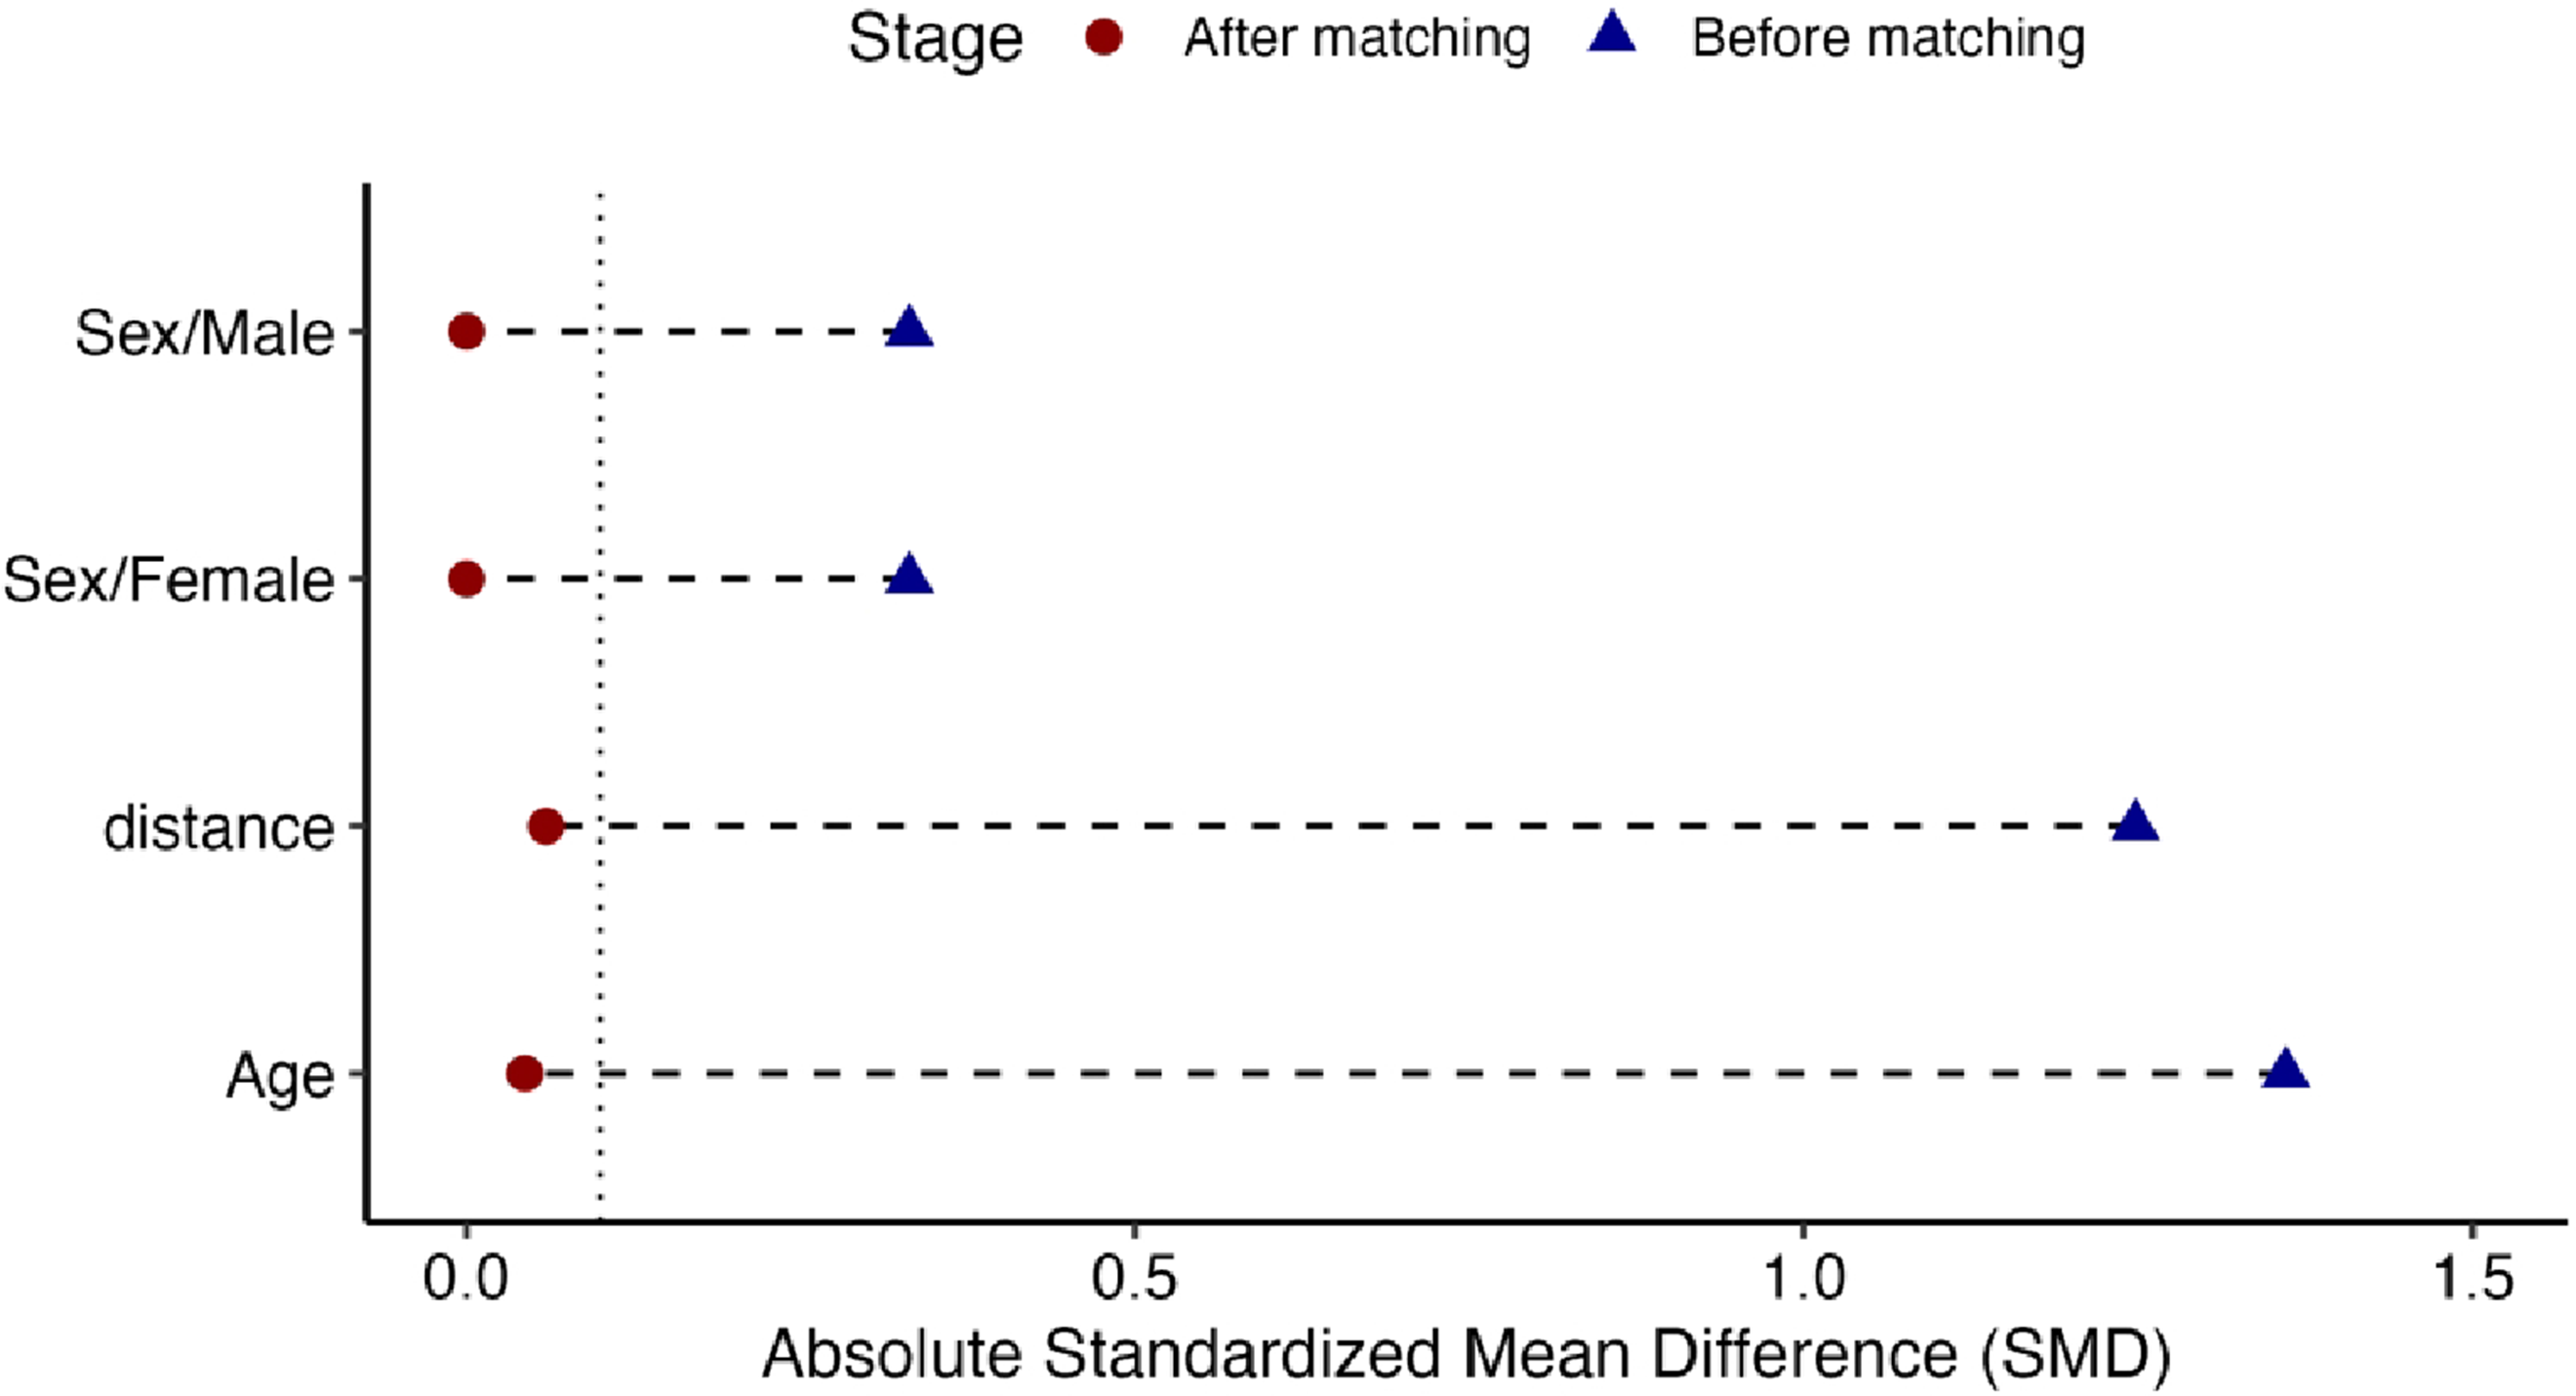
Data Collection and Muscle Indices
Demographic data (age, sex, body mass index [BMI]), laboratory parameters and comorbidities were extracted from electronic medical records. Dual energy X-ray absorptiometry (DXA) to assess T-scores was conducted using Lunar Prodigy device (General Electric, GE Healthcare, USA). Hounsfield units (HU) were determined using lumbar spine computer tomography imaging (CT; SOMATOM Definition AS+, Siemens Healthineers, Germany) according to a standardized institutional protocol. MRI imaging of the lumbar spine was performed with a 1.5-Tesla MRI machine (MAGNETOM Avanto; Siemens Healthineers, Forchheim, Germany). Muscle mass was assessed using axial T2-weighted MRI images at the mid-pedicle level of the L4 vertebra. The cross-sectional area of psoas muscles (pCSA) and paraspinal muscles, namely erector spinae and multifidus, (psCSA) were manually measured using ImageJ® image analysis software (version 1.54 g, National Institutes of Health, Bethesda, Maryland) and averaged after measuring the cross-sectional area bilaterally. Normalization was done using height and vertebral body area as follows: psoas muscle index (pMI = pCSA [cm2]/height
2
[m2]), psoas to lumbar vertebral body area ratio (pLVI = pCSA[cm
2
]/vertebral body area[cm
2
]), paraspinal muscle index (psMI = psCSA [cm2]/height
2
[m2]) and the paraspinal to lumbar vertebral body area ratio (psLVI = psCSA[cm
2
]/vertebral body area[cm
2
]). Fatty infiltration of the psoas muscle (pFI) and paraspinal muscles (psFI) were assessed semi-quantitatively using Image J as previously described.
20
Thresholds were manually set for each image and the amount of fat infiltration (FI) was expressed in % (FI = (FAT/CSA) X 100). Functional cross-sectional areas (fCSA) were determined as the difference between cross-sectional area and fatty tissue (FAT
Statistical Analysis
Descriptive statistics were reported as means ± standard deviation (SD) or medians with interquartile range (IQR) for continuous variables, or as absolute frequencies and percentages for categorical variables. Distribution of variables was assessed using the Shapiro-Wilk test. Between-group comparisons were conducted using paired t-tests or Wilcoxon signed-rank tests for continuous variables and McNemar’s test for categorical variables. Muscle indices were compared between OF and Non-OF groups overall, as well as within sex- and HU-stratified subgroups. Adjustment for multiple comparisons was performed using Bonferroni correction where applicable. Correlations between vertebral bone mineral density (as quantified by Hounsfield Units) and muscle morphology variables were assessed using Spearman’s rank correlation coefficients. Statistical significance was defined as P < 0.05. Analyses were conducted using SPSS® software (IBM Corp. 2021. IBM SPSS Statistics for Macintosh, Version 28.0. Armonk, NY: IBM Corp).
Results
Demographics
Summary of Demographics and Muscle Indices
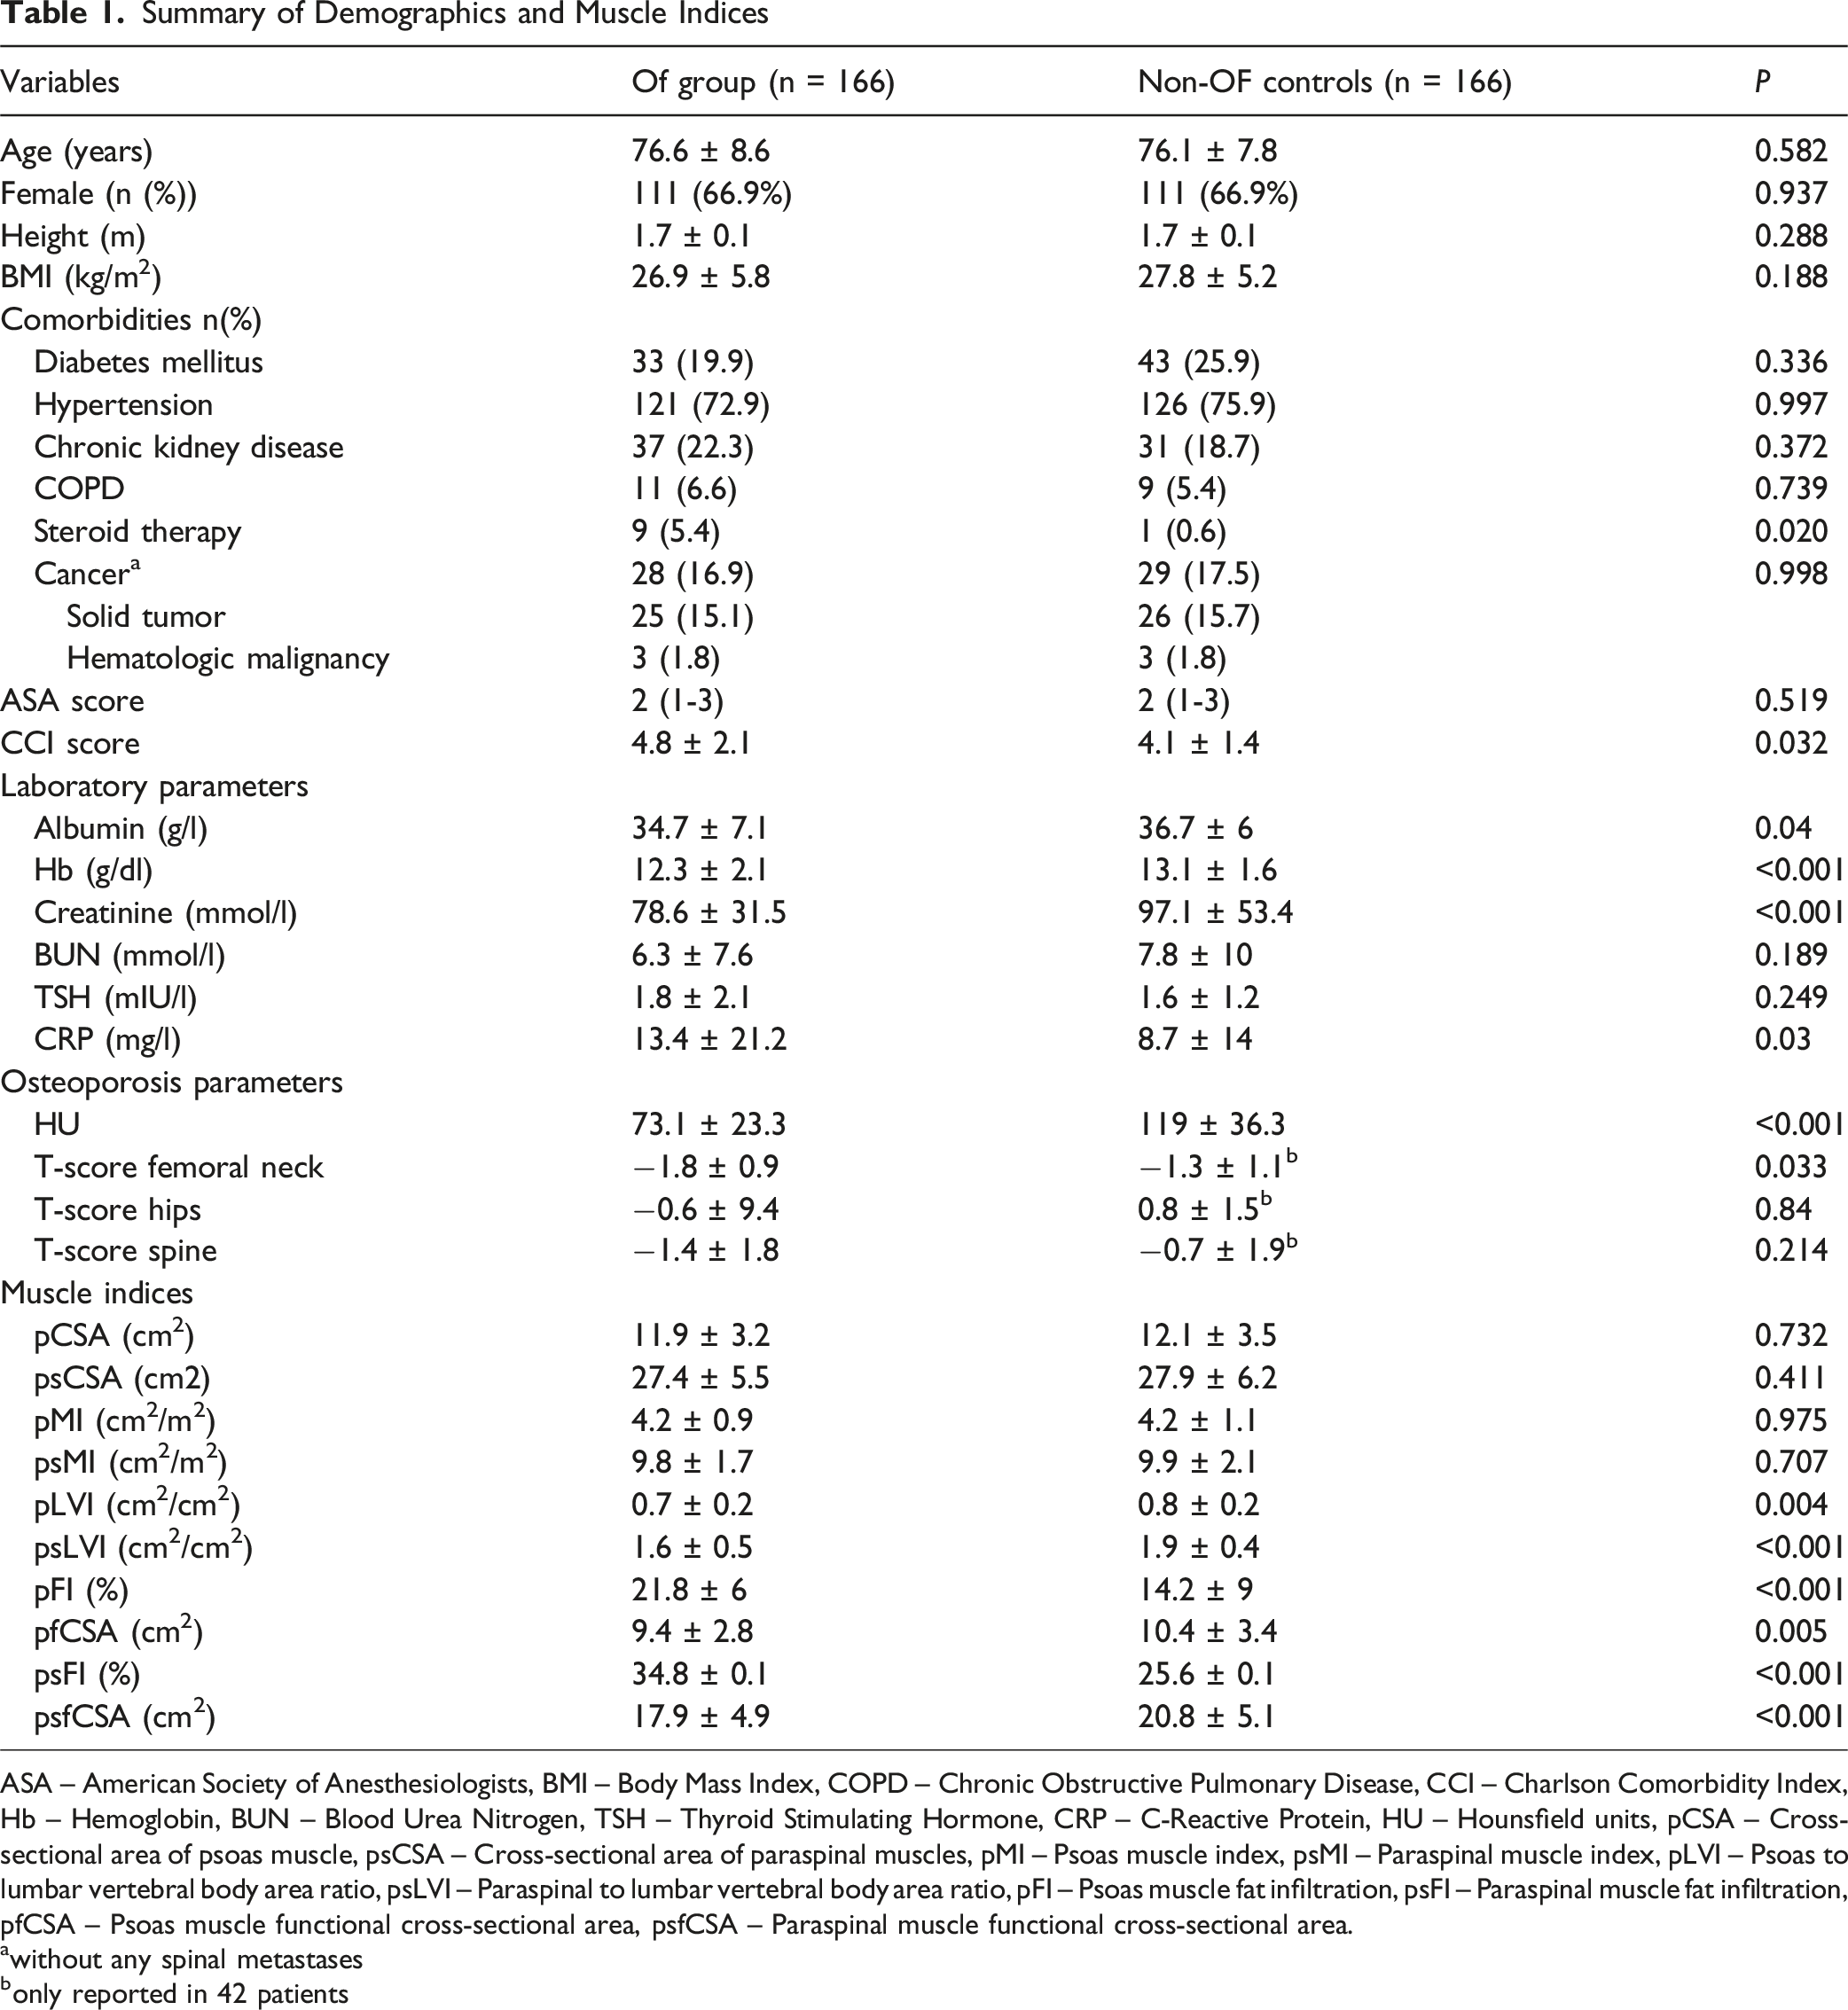
ASA – American Society of Anesthesiologists, BMI – Body Mass Index, COPD – Chronic Obstructive Pulmonary Disease, CCI – Charlson Comorbidity Index, Hb – Hemoglobin, BUN – Blood Urea Nitrogen, TSH – Thyroid Stimulating Hormone, CRP – C-Reactive Protein, HU – Hounsfield units, pCSA – Cross-sectional area of psoas muscle, psCSA – Cross-sectional area of paraspinal muscles, pMI – Psoas muscle index, psMI – Paraspinal muscle index, pLVI – Psoas to lumbar vertebral body area ratio, psLVI – Paraspinal to lumbar vertebral body area ratio, pFI – Psoas muscle fat infiltration, psFI – Paraspinal muscle fat infiltration, pfCSA – Psoas muscle functional cross-sectional area, psfCSA – Paraspinal muscle functional cross-sectional area.
awithout any spinal metastases
bonly reported in 42 patients
Osteoporosis Parameters
The Non-OF control group showed no radiologic evidence of vertebral fractures on either MRI or CT. Consistent with more advanced skeletal fragility, the OF group exhibited markedly reduced BMD, with mean lumbar HU values almost 40% lower than those of controls (73.1 ± 23.3 vs 119 ± 36.3, P < 0.001). A total of 137 (82.5%) patients in the OF group and 22 (13.3%) in the Non-OF controls were below the threshold for HU to define osteoporosis as described previously (HU ≤ 90). 21 Femoral neck T-scores were also significantly lower in the OF group (−1.8 ± 0.9 vs −1.3 ± 1.1, P = 0.033), while T-scores at the lumbar spine and hips showed no statistically significant differences. However, DXA scans were only available in 42 patients in the Non-OF controls.
Lumbar Muscle Indices
Muscle morphology revealed preserved absolute psoas and paraspinal muscle areas and muscle indices between groups; however, muscle quality metrics diverged markedly. The OF group demonstrated significantly greater intramuscular fat infiltration of both the psoas (pFI: 21.8% vs 14.2%, P < 0.001) and paraspinal muscles (psFI: 34.8% vs 25.6%, P < 0.001). Correspondingly, functional muscle area was reduced, with lower pfCSA (9.4 ± 2.8 vs 10.4 ± 3.4 cm2, P = 0.005) and psfCSA (17.9 ± 4.9 vs 20.8 ± 5.1 cm2, P < 0.001). Lumbar vertebral body–adjusted muscle indices (pLVI and psLVI) were also significantly lower in the OF group (both P < 0.01), indicating disproportionate degeneration of paraspinal and psoas musculature relative to vertebral size. (see Table 1).
Sex-Stratified Muscle Indices
Sex-stratified analyses demonstrated distinct patterns in muscle quality differences between patients in the OF group and matched controls. Among female and male patients, absolute psoas and paraspinal muscle areas and their respective muscle indices did not differ significantly between groups; however, qualitative muscle parameters consistently favored controls.
Female Muscle Indices
Sex Stratified Sarcopenia Parameters
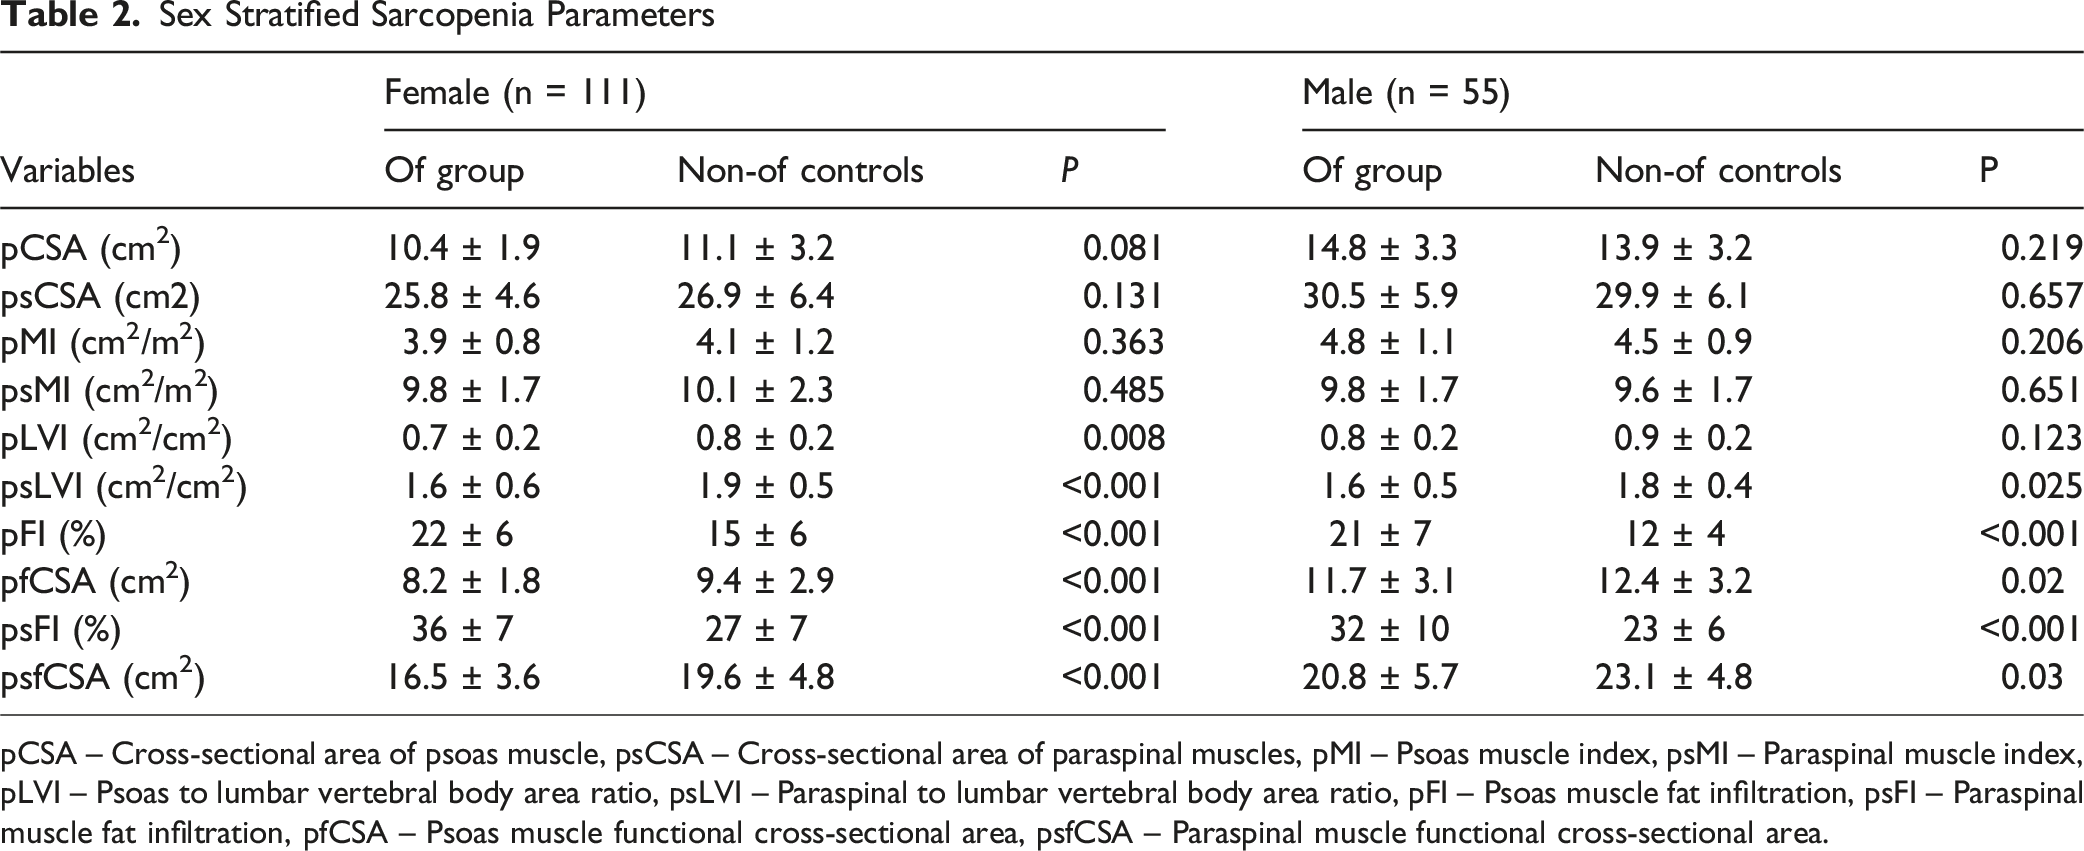
pCSA – Cross-sectional area of psoas muscle, psCSA – Cross-sectional area of paraspinal muscles, pMI – Psoas muscle index, psMI – Paraspinal muscle index, pLVI – Psoas to lumbar vertebral body area ratio, psLVI – Paraspinal to lumbar vertebral body area ratio, pFI – Psoas muscle fat infiltration, psFI – Paraspinal muscle fat infiltration, pfCSA – Psoas muscle functional cross-sectional area, psfCSA – Paraspinal muscle functional cross-sectional area.

Comparison of fat infiltration in 1:1 matched cohort stratified by sex. (A).pFI stratified by sex show significantly lower values in the non-OF group, P < 0.001. (B) psFI stratified by sex show significantly lower values in the OF group, P < 0.001
Male Muscle Indices
Similar trends were observed in male patients with OVFs, although absolute muscle size was larger overall compared to Non-OF controls. Male OF patients also demonstrated significantly greater psoas and paraspinal fat infiltration than controls (pFI: 21% vs 12%, P < 0.001; psFI: 32% vs 23%, P < 0.001), as well as reduced functional CSA (pfCSA: 11.7 ± 3.1 vs 12.4 ± 3.2 cm2, P = 0.020; psfCSA: 20.8 ± 5.7 vs 23.1 ± 4.8 cm2, P = 0.030). While absolute CSA measures and pMI/psMI were comparable between male OF and Non-OF patients, vertebral-normalized paraspinal muscle area remained significantly lower in the male OF-cohort (psLVI: 1.6 ± 0.5 vs 1.8 ± 0.4, P = 0.025). (see Table 2).
Taken together, these findings indicate that qualitative muscle degeneration, particularly increased intramuscular fat and reduced functional area, is consistently more pronounced in OF patients of both sexes, despite largely preserved muscle size (see Table 2).
Muscle Indices and Laboratory Markers
Hemoglobin demonstrated weak positive correlations with psoas muscle quantity measures, including pCSA, PMI and pLVI, but showed stronger inverse correlations with quality measures including fatty infiltration (pFI: ρ = −0.266, P < 0.001; psFI: ρ = −0.236, P < 0.001) and fCSA suggesting a closer relationship with muscle quality than muscle size. Creatinine correlated weakly with muscle quantity including pCSA, psCSA and pLVI and associated with psFI. Albumin and CRP were unrelated to muscle quantity, whereas albumin showed inverse associations with pFI and pfCSA and CRP demonstrated positive correlations with pFI and pfCSA, supporting an inflammatory and nutritional contribution to muscle compositional degeneration (See Supplemental Table 1).
Muscle Indices and BMD (HU-Stratified Analysis)
In subgroup analyses stratified by vertebral bone mineral density (HU ≤ 90 vs > 90), patients in the OF group with low HU exhibited significantly reduced muscle mass and quality.
Sarcopenia Parameters Stratified by CT Hounsfield Units
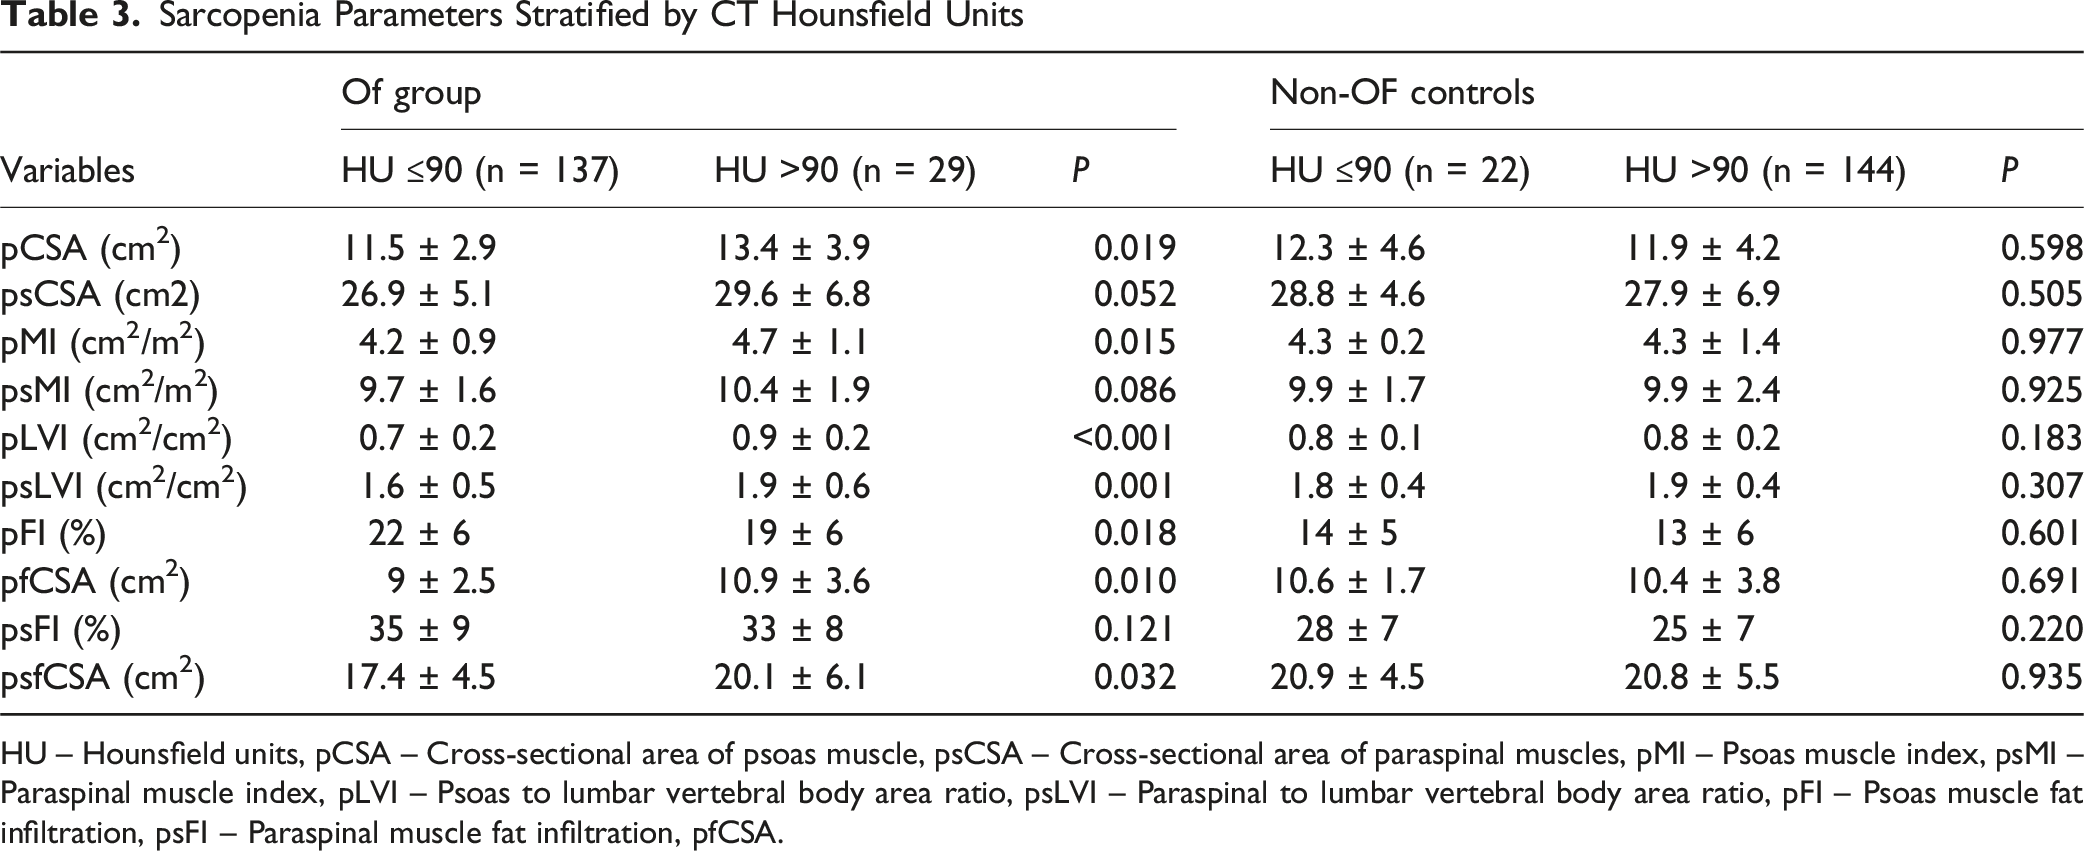
HU – Hounsfield units, pCSA – Cross-sectional area of psoas muscle, psCSA – Cross-sectional area of paraspinal muscles, pMI – Psoas muscle index, psMI – Paraspinal muscle index, pLVI – Psoas to lumbar vertebral body area ratio, psLVI – Paraspinal to lumbar vertebral body area ratio, pFI – Psoas muscle fat infiltration, psFI – Paraspinal muscle fat infiltration, pfCSA.
These findings were corroborated by correlation analysis between HU and muscle parameters (see Figure 4). In the OF group, HU values demonstrated significant correlations with muscle size and quality metrics, including pCSA (ρ = 0.23), PMI (ρ = 0.28), and PLVI (ρ = 0.24), as well as functional muscle mass (pfCSA: ρ = 0.24). In contrast, HU correlated inversely with fat infiltration (pFI: ρ = −0.21, psFI: ρ = −0.15; both P < 0.05), reinforcing the link between declining bone mineral density and deteriorating muscle quality in manifest osteoporosis. Importantly, these associations were absent in the Non-OF controls, where HU showed no significant correlation with any of the muscle indices (all ρ between −0.16 and 0.15, P > 0.05). Correlation between vertebral bone mineral density (HU) and lumbar muscle parameters in matched cohorts. Forest plot depicting Spearman correlation coefficients (ρ) and 95% CIs between lumbar vertebral Hounsfield units (HU) and muscle metrics in the Non-OF controls (top) and OF group (bottom). Squares denote point estimates and horizontal lines indicate 95% CIs, with significant correlations (P < 0.05) marked by an asterisk. HU – Hounsfield units, pCSA – Cross-sectional area of psoas muscle, psCSA – Cross-sectional area of paraspinal muscles, pMI – Psoas muscle index, psMI – Paraspinal muscle index, pLVI – Psoas to lumbar vertebral body area ratio, psLVI – Paraspinal to lumbar vertebral body area ratio, pFI – Psoas muscle fat infiltration, psFI – Paraspinal muscle fat infiltration, pfCSA – Psoas functional cross-sectional area, pfsCSA – Paraspinal muscle cross-sectional area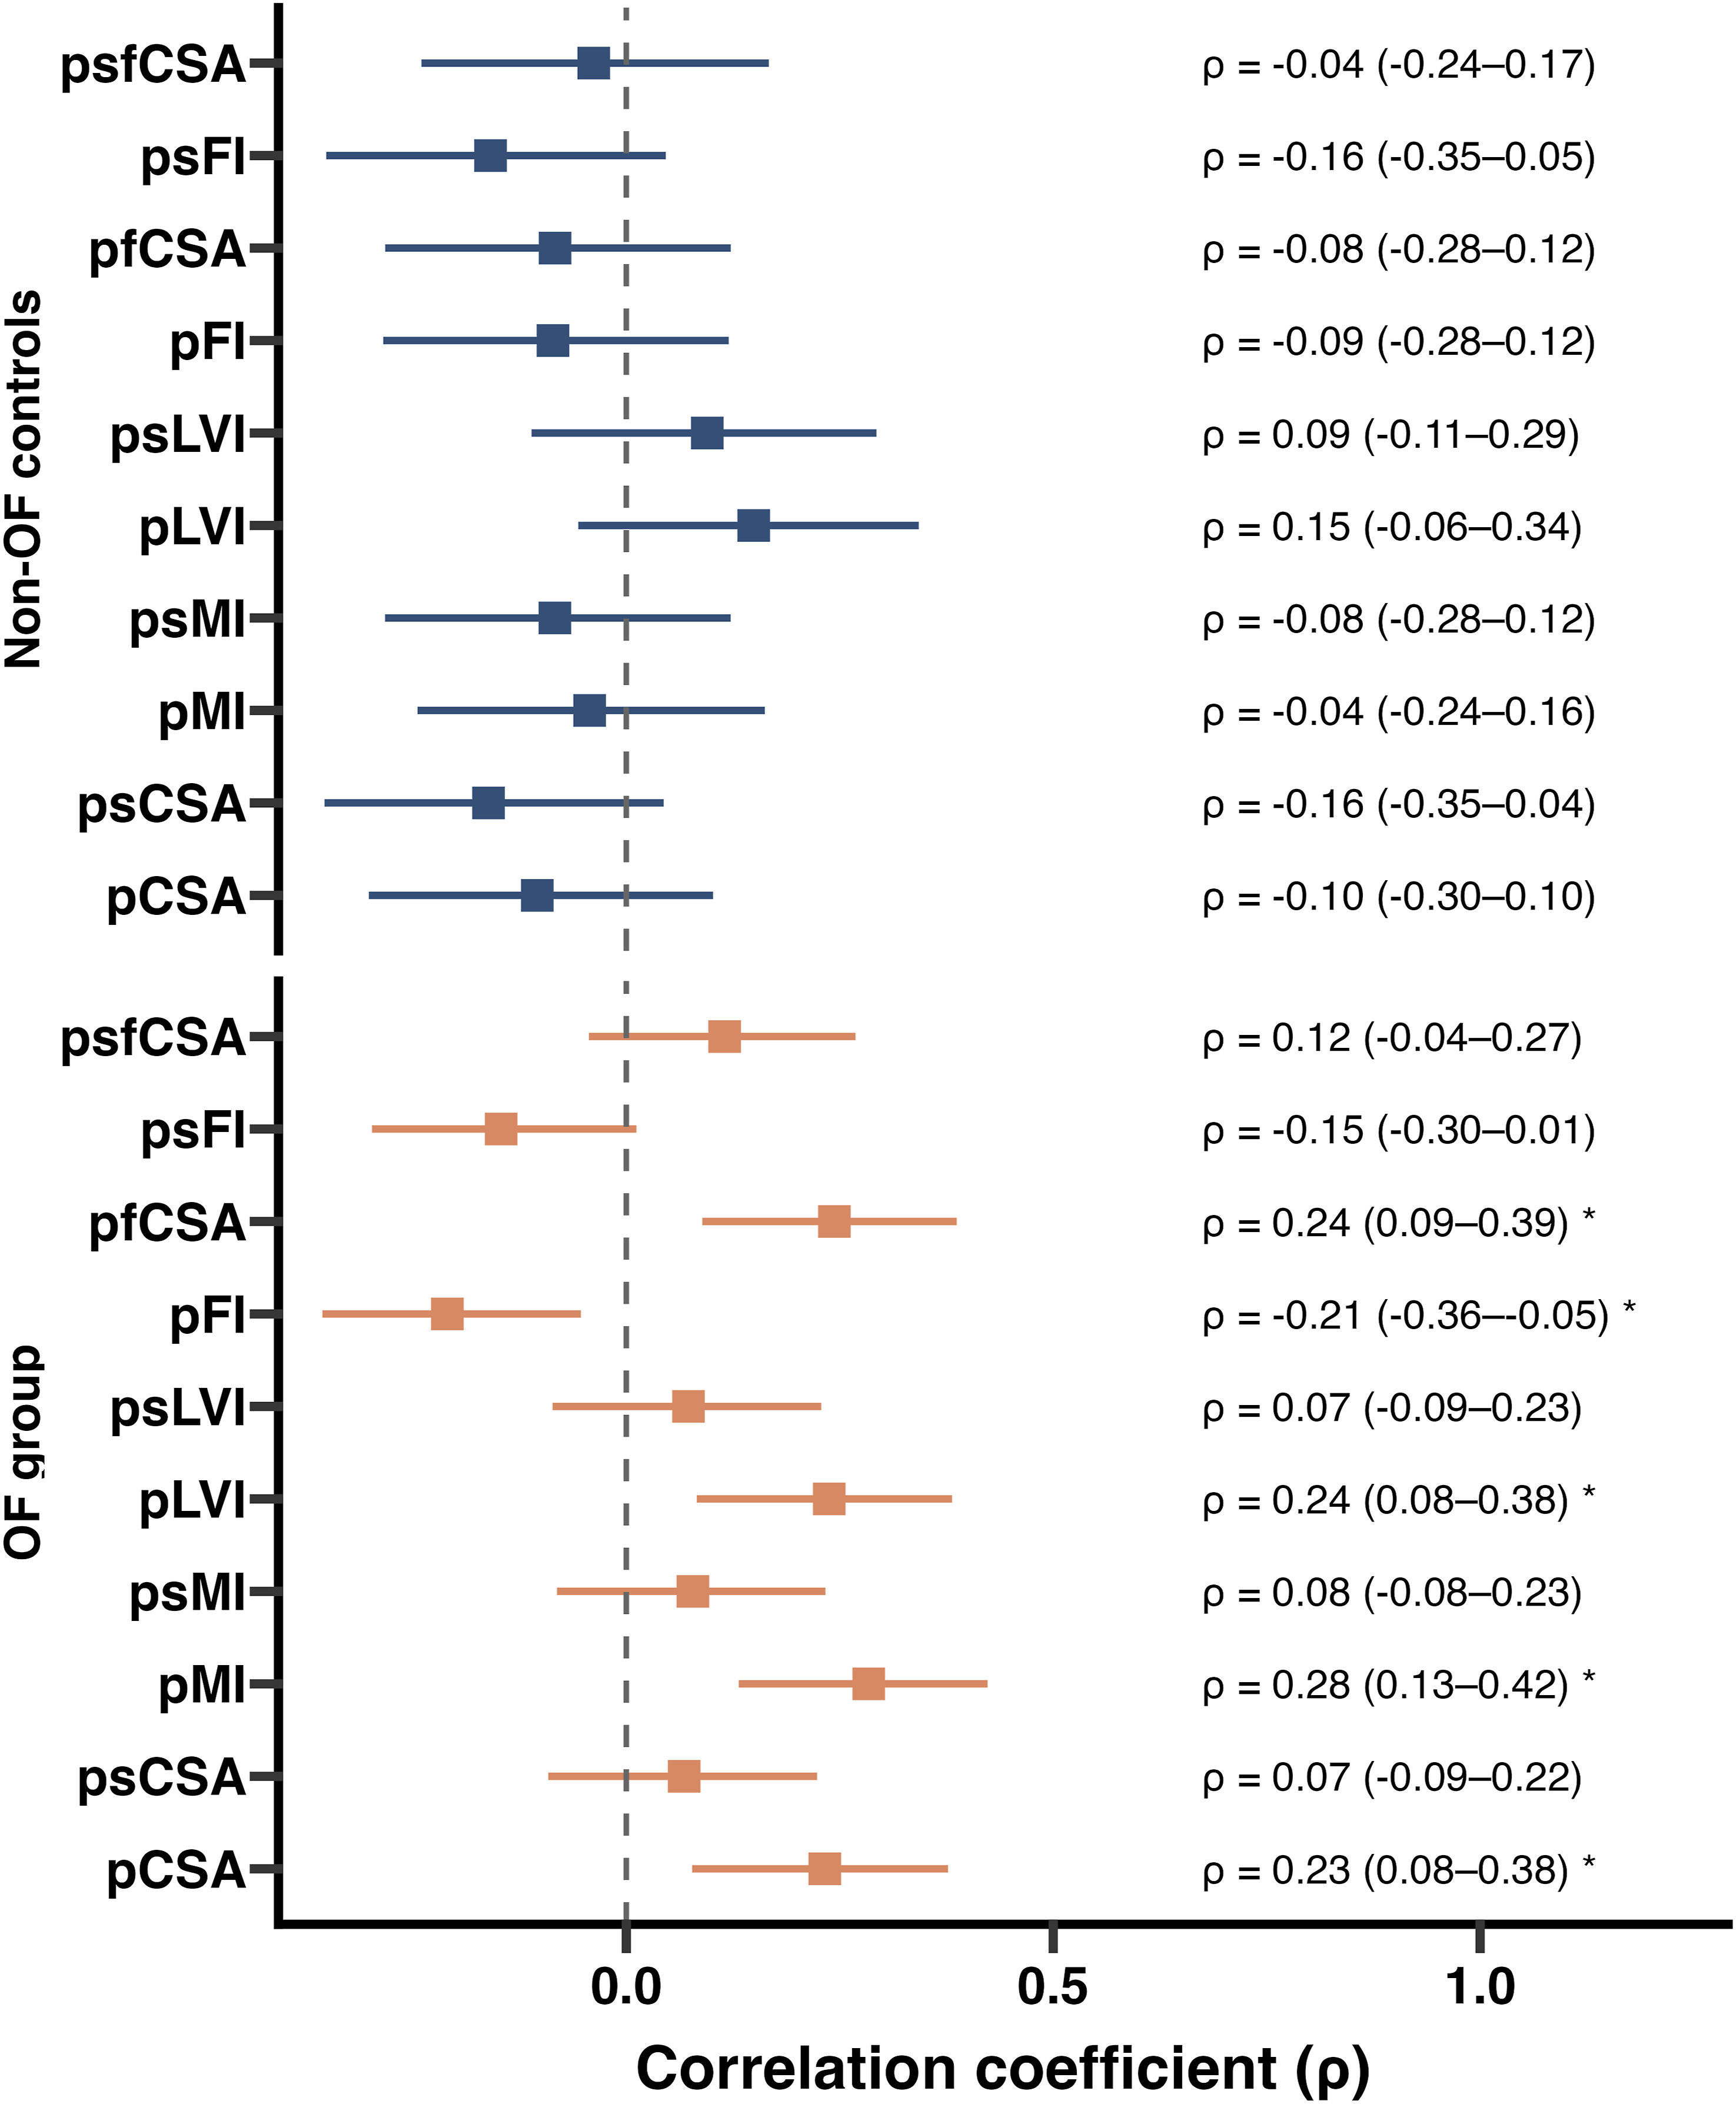
Discussion
In this matched cohort study, rigorous control of demographic and anthropometric variables revealed that muscle quality, rather than muscle size, differs significantly between patients with OVFs and matched controls. Although no significant differences in muscle CSA or muscle index were seen between groups, the OF group consistently demonstrated higher fat infiltration and lower functional CSA indicating altered muscle composition despite preserved muscle bulk. These findings were reinforced by systemic frailty markers, which showed stronger relationships with muscle fatty degeneration than with muscle quantity, suggesting that compositional muscle deterioration represents a central feature of osteosarcopenia. Furthermore, subgroup analysis showed a strong relationship between BMD and muscle quality metrics, underlining the close pathophysiological interplay between osteoporosis and sarcopenia in older adults with manifest osteoporosis.
Several studies have described lower muscle mass in elderly individuals with vertebral fractures, supporting the concept of osteosarcopenia.22,23 However, many of these studies rely on muscle mass measures that correlate strongly with body size and often did not comprehensively adjust for demographics, BMI, frailty, or comorbidity. A few studies have challenged the idea that sarcopenia independently predicts fractures. Trajanoska et al 2 24 demonstrated in a large population-based cohort that low muscle mass was not independently associated with fractures once BMD was accounted for, while Anand et al 2 25 reported that although sarcopenia was more common among older fracture patients, it did not independently predict fracture risk after accounting for confounders. Our findings are therefore consistent with the emerging view that muscle mass alone does not capture the relevant bone-muscle changes and fracture risk.5,26 Instead, qualitative muscle changes, reflected by fatty infiltration and reduced functional muscle area, may be a more sensitive and clinically relevant marker of musculoskeletal decline in manifest osteoporosis. Yang et al, reported that greater fat infiltration of the lumbar paraspinal muscles was associated with lower spine volumetric BMD, whereas muscle CSA showed no association. 27 Han et al, showed that patients with osteoporosis had comparable CSA but higher fat infiltration when compared to patients with normal BMD. 28 Zhao et al, reported that fat infiltration was associated with low BMD when controlled for age, sex and BMI. 29 Similarly, Jeon et al, showed that paraspinal muscle fatty degeneration was the sole significant predictor of progressive vertebral body collapse. 30 Furthermore, Goodpaster and colleagues established that intramuscular fat is influenced by age and metabolic factors independent of BMI, 31 explaining why fat infiltration may remain significantly different between groups even when anthropometric characteristics are matched. Importantly, muscle fat infiltration is also strongly linked to poor muscle function, and falls 32 ; mechanisms highly relevant to vertebral fragility. Thus, our findings reinforce the concept that fat infiltration is a robust, anthropometry-independent indicator of sarcopenic muscle impairment.
Our study shows that HU correlates significantly with muscle metrics only in patients with manifest osteoporosis and not in matched controls. This further supports the relevance of the underlying bone-muscle crosstalk in the pathologic state. This has already been well documented in several studies. Even though fat infiltration predicts vertebral collapse in patients with OVFs, large population-based studies have reported no independent association between sarcopenia and fracture risk beyond the effect of BMD, suggesting that the bone–muscle axis becomes more pronounced in manifest osteoporotic states. 30
Our findings have several clinical implications. First, assessing muscle quality and fat infiltration may be a more clinically informative parameter than muscle size in older patients with manifest osteoporosis. Higher FI can unmask poor muscle functional status that might be overlooked by other parameters such as CSA measurements. Furthermore, fat infiltration can be adequately measured in lumbar MRI without the need for special FI measurements such as MRI Dixon fat fraction or ultrasound measurements. This can help identify high-risk patients in daily clinical practice and tailor adequate therapies without additional costs. More importantly, emerging evidence from neurotrauma and spinal cord injury populations similarly demonstrates that muscle composition and frailty are associated with prolonged hospitalization, impaired neurological recovery, and increased complication rates, underscoring that muscle quality represents a relevant diagnostic marker of physiological reserve across neurosurgical conditions34,35.
To the best of our knowledge, this study is the first to perform a 1:1 age- and sex-matched cohort in patients with manifest osteoporosis. This allowed for the control of confounding demographic and anthropometric factors. Furthermore, measurement of sarcopenic muscle parameters included both psoas and paraspinal muscles and included CSA, muscle index, normalized values and FI which enabled a comprehensive assessment of relevant parameters. Nevertheless, several limitations merit discussion. First, its cross-sectional design precludes any inference of causality. Whether fatty infiltration precedes fractures or resulted from immobilization cannot be determined. A longitudinal study with more time points of assessment might help disentangle cause and effect. Second, our sample consisted of Caucasian patients from a single center which might not fully represent the broader population of community-dwelling older adults or other ethnicities. In addition, all measurements were performed by a single observer, and interobserver reliability as well as the reproducibility of manual measurements were not formally assessed. Furthermore, despite careful matching of confounding factors between the two groups, the presence of residual confounding (eg, unmeasured differences in nutrition, inflammatory status, or physical activity) could not be excluded.
Conclusion
In summary, our study underscores that muscle quality, as evidenced by fat infiltration, is a distinguishing feature of patients with OVFs and closely associated with low vertebral bone mineral density. These findings encourage a shift in both research and clinical practice toward prioritizing muscle quality assessment and highlight fat infiltration as a fracture-specific phenotype and potential therapeutic target than merely a correlate of aging or frailty.
Supplemental Material
Supplemental material - Muscle Quality Over Quantity: Paraspinal and Psoas Muscle Fat Infiltration Distinguishes Patients With Osteoporotic Vertebral Fractures From Matched Controls
Supplemental material for Muscle Quality Over Quantity: Paraspinal and Psoas Muscle Fat Infiltration Distinguishes Patients With Osteoporotic Vertebral Fractures From Matched Controls by Biniam Melese Bekele, Ina Moritz and Yu-Mi Ryang in Global Spine Journal
Footnotes
Ethical Considerations
Ethical approval was obtained from the local ethics committee of the Berlin Chamber of Physicians (Ärztekammer Berlin, Approval number: Eth-SB-25-009), and the study complied with the Declaration of Helsinki guidelines. Given the retrospective design of the study, the requirement for informed consent was waived.
Funding
No form of financial support has been received by any of the authors in preparation of this study. Publication costs were covered by the open access funding.
Declaration of Conflicting Interests
Biniam Melese Bekele, and Ina Moritz declare that they have no conflict of interest. Yu-Mi Ryang has served as a speaker and lecturer at various symposiums organized by Brainlab®, DePuy Synthes (Johnson & Johnson), Icotec AG and Medtronic. She is also involved in annual courses and trainings organized by AO Spine, the German Spine Society (DWG), the European Association of Neurosurgical Societies (EANS), and EUROSPINE.
Supplemental Material
Supplemental material for this article is available online.
Appendix
References
Supplementary Material
Please find the following supplemental material available below.
For Open Access articles published under a Creative Commons License, all supplemental material carries the same license as the article it is associated with.
For non-Open Access articles published, all supplemental material carries a non-exclusive license, and permission requests for re-use of supplemental material or any part of supplemental material shall be sent directly to the copyright owner as specified in the copyright notice associated with the article.