
Abstract
Background:
Although genetically-engineered mouse models are revolutionizing our understanding of numerous human diseases, some of them fail to reproduce or to mimic the human condition or even exhibit distinct disease features depending on the mouse genetic background, on the environment conditions, and/or on unknown parameters.
Objective:
Experiments aimed at further characterizing the muscle defects associated with the I-T substitution at position 4898 of the human type 1 ryanodine receptor (RyR1) protein sequence, responsible for central core disease in affected patients, to use this model for therapeutic development. RyR1 is a cationic channel in the sarcoplasmic reticulum membrane that is responsible for the Ca2+ release flux that triggers muscle contraction. The above I-T change was previously described to alter RyR1 channel permeation so as to produce muscle weakness.
Methods:
We used the corresponding I4895T mouse model, previously shown unviable in the homozygous form, and with heterozygous animals suffering from depressed RyR1-mediated Ca2+ flux and muscle force production. We performed a full characterization, at the molecular level of the RYR1 gene and transcript, and at the functional level at the isolated fiber or whole animal levels.
Results:
We found no significant deficit in the heterozygous animals, from force and activity parameters at the whole organism level, to contraction of isolated muscles and Ca2+ release in single isolated muscle fibers.
Conclusions:
Our results prompt the need for caution when using this model, and point to its potential limited relevance for preclinical studies.
Introduction
Muscle contraction relies on a timely and spatially controlled calcium release flux, generated at the triad of skeletal muscle by a macromolecular protein machinery, the calcium release complex (CRC). Two calcium channels constitute the core of this complex: the dihydropyridine receptor (DHPR) and the type 1 ryanodine receptor (RyR1), inserted in two different membranes. The DHPR is a voltage gated calcium channel localized in the transverse tubule membrane and activated by the membrane depolarization. RyR1 is a calcium channel localized in the junctional part of the sarcoplasmic reticulum, at the triad, and is responsible for the release of calcium from sarcoplasmic reticulum into the cytosol leading to muscle contraction upon activation by the DHPR. 1 This mechanism, called excitation-contraction (EC) coupling, relies on a physical interaction between DHPR and RyR1. 2 RyR1 being the corner stone of EC coupling, mutations in the RYR1 gene encoding the RyR1 protein result in defect in calcium release leading to skeletal muscle disorders. These disorders, gathered under the name “RyR1-related disorders” (RyR1-RD) 3 include congenital myopathies such as central core disease (CCD), 4 multi-minicore disease (MmD), 5 centronuclear myopathy, 6 and pharmacogenetic disorders like malignant hyperthermia. 7
Three pathophysiological mechanisms have been identified: gain-of-function, loss-of-function and absence of protein. 1 These mechanisms have different consequences at the molecular level, on amplitude of calcium release, and at physiological level, on muscle strength. Gain-of-function mutations are schematically characterized by hypersensitivity of the channel to a stimulation, either endogenous or exogenous, resulting in either i) an excessive calcium flux upon stimulation and no associated alteration in muscle strength, or ii) a permanent calcium leak leading to reduction in the amplitude of calcium release, and at physiological level, a reduction in muscle strength. Loss-of-function mutations are characterized by a reduction in the amplitude of calcium release upon stimulation, and reduction in muscle strength with a myopathic presentation. Mutations leading to reduction in protein amount result in alteration in calcium release and in muscle strength.
To gain a better understanding of the pathophysiological mechanisms associated with RYR1 mutations and to test therapeutic approaches for RyR1-related diseases, mouse models reproducing the human mutation(s) and the corresponding patho-mechanisms are very precious tools. The relevance of the model for the human disease is critical, and the extent of similitude or discrepancy between the mouse phenotype and the human phenotype is of major importance for in depth, accurate understanding of the human disease and for therapeutic development. Among the different mouse models developed for RyR1-RD 8 some reproduced a gain-of-function mutation identified in human, such as the Y522S 9 and R163C 10 mouse models, which exhibit volatile anesthetics sensitivity inducing death as observed in human with malignant hyperthermia sensitivity. A mouse model with an inducible and muscle specific RyR1 reduction has been recently developed, 11 to mimic in mouse the effect of reduction in protein amount. In this model, the severity of the disease correlates with the amount of protein: when the reduction in RyR1 amount reaches 50% of the initial amount, the mice present a severe non-lethal muscle weakness similar to the phenotype of patients affected with Dusty Core Disease, a subgroup of Central Core Disease. 12 The work in the present study was focused on a mouse model with the RyR1 dominant mutation I4895T, equivalent to the human I4898T mutation, a mutation previously characterized as a RyR1 loss-of-function. 13 This mutation has been identified as one of the frequent CCD mutations in humans with variable penetrance.4,14,15 The mutation, located in the selectivity filter of the channel, leads to CCD with a variable phenotype ranging from mild to severe forms. At homozygous state in mouse, this mutation is lethal at birth due to respiratory deficiency. 16 This is consistent with in vitro findings showing that myotubes produced from homozygous newborn mice (IT/IT) have impaired Ca2+ release channel function without any alterations in RyR1 protein expression. However, at the heterozygous state, in vitro and in vivo functional studies resulted in more controversial results between human and mouse. Myotubes from patients heterozygous for the I4898T mutation showed reduced calcium release upon stimulation. 17 Along the same line, myotubes generated from heterozygous IT/+ knock-in mice showed reduced RyR1 Ca2+ release despite a normal level of sarcoplasmic reticulum (SR) Ca2+ content, 18 so that the mutation was proposed to alter the coupling between DHPR and RyR1.
In vivo in mouse, the mutation has been described to lead to a progressive core myopathy with various degrees of severity, with a possible involvement of the genetic background. The I4895T mutation was first studied on 129SV background (generated on 129S6/SvEvTac and maintained on a congenic 129S2/SvPasCrl background), and heterozygous mice were shown to exhibit a variable myopathic phenotype, with some mice showing muscle weakness starting at 6 months of age. 19 Using the same model, Loy et al. 18 reported reduced animal strength using grip strength and hanging task, and reduced (by ∼ 35%) SR Ca2+ release in isolated fibers (from Flexor Digitorum Brevis/FDB muscles). Analysis of aged animals reported a mild CCD phenotype with reduced electrically-evoked Ca2+ transients (by ∼15% and 30% in FDB fibers from 4–6 and 18-month-old animals, respectively), and fiber type-specific ultrastructure defects, reminiscent of aging muscle. 20 The mutation was further engineered on the C57BL/6 background by Lee et al. 21 who reported muscle weakness, and a small reduction (visually by ∼10%) of the amplitude of electrically-evoked Ca2+ transients from FDB fibers, with overall results suggesting that reduced Ca2+ release is not the predominant driver of the myopathy.
With the prospect of using the IT mouse model for therapeutic development, we performed a full characterization of the RyR1-I4895T heterozygous mice (IT/+) on the mixed 129S6/SvEvTac-129S2/SvPasCrl background as provided by Jackson Laboratories. In our hands, the I4895T mutation leads to RyR1-dysfunction discernable in cultured myotubes, but not in isolated fibers, and does not result in measurable in vivo muscle defects as challenged with multiple recognized physiological tests.
Materials and methods
Mice and genotyping
RyR1I4895T/+ knock-in mice in the SV129 background (129S6/SvEvTac*129S2/SvPasCrl), described previously 22 were obtained from the Jackson Laboratory (129S-Ryr1tm1.1Dhm/J, Strain #025199). As described by the Jax datasheet, after initial amplification and backcross on 129S2/SvPasCrl, the colony was maintained by inbreeding between +/+ and heterozygous animals. Animal care and experimental procedures were approved by the institutional ethics committee (CEEAGIN 04, N_134) and followed the guidelines from Directive 2010/63/EU of the European Parliament on the protection of animals used for scientific purposes. Mice were housed collectively (littermate of both genotype and same sex) in cages with environmental enrichment, in a temperature-controlled room with a 12-h light/dark cycle with ad libitum access to water and food.
The I4895T knock-in (KI) mouse model was generated by introduction of the c.T14693C mutation into the RYR1 murine gene through homologous recombination in ES cells. In addition to the T > C substitution in exon 102, a 101 bp foreign DNA was present and used for the genotyping of animals. Genomic DNA was extracted using DirectPCR Lysis Reagent with proteinase K (#EU0090, Euromedex) and subsequently analysed through PCR. The PCR amplification has been initially performed using the Jackson laboratories primers and was followed by sequencing to confirm the presence of the mutation in heterozygous animals. To ensure fast genotyping, the following PCR primers were routinely used, flanking the foreign DNA left after excision of the cassette (Forward 5′CTAGTCAGGGAAGAAGCCCA 3′ and Reverse 5′ TGTCTCAGGTCTCACAGTAAGG 3′).
RNA analysis
Total RNA was isolated from frozen quadriceps of 10-month-old mice +/+ and IT/+ using NucleoSpin RNA Set for NucleoZOL (Macherey–Nagel). RNA was quantified using a NanoDrop 1000 spectrophotometer (ThermoScientific, Waltham, MA). Total RNA was reverse transcribed using iScript Reverse Transcription Supermix for RT-PCR (Bio-Rad Laboratories, Hercules, CA). The region of RYR1 mRNA encompassing the c.T14693C mutation (corresponding to p.I4895T) was amplified by PCR using the following primers (Forward 5′TCACAGACAACTCTTTCCTG 3′ and Reverse 5′GTAGTCACTGCCTATTCCAC 3′), and the sequences were confirmed by Sanger sequencing of PCR products. The area of the peaks at the position of the mutation was quantified using the EditR software. RYR1 transcript expression was measured by quantitative real-time polymerase chain reaction (RT-qPCR). RT-qPCR was conducted using SsoAdvanced™ Universal SYBR® Green Supermix (Bio-Rad Laboratories) as described previously, 11 and 0.5 μl cDNA was used to detect the transcript of interest. All reactions were run in triplicate. RT-qPCR reactions were run on an CFX96 Touch™ Real-Time PCR Detection System (Bio-Rad). The primer sequences for RYR1 (forward 5′ GGTCTGATTATTGATGCTTTTGGGG 3′ and reverse 5′ TGGTCTCCATGTCTTCCTTCACTTG 3′), for ACTB (forward 5′ AAGATGACCCAGATCATGTTTGAGACC 3′ and reverse 5′ TGGGCAGTGTGGGTGACC3′) and for HPRT (forward 5′ GCAAGCTTGCTGAAAAGGAC 3′ and reverse 5′ TTGTCTGGAATTTCAAATCCAACAAAG 3′) were designed using Primer designing tool from the NCBI. The amplification steps were the following: 95 °C for 30 s; 39 cycles composed of 95 °C for 10 s, 60 °C for 20 s; 60 °C to 90 °C with increment of 0.5 °C every 5 s. A threefold RNA dilution series was used to determine efficiency of each qPCR assay. Amplification data were analyzed with CFX manager software (Bio-Rad). Expression was normalized to two endogenous controls (HPRT and ACTB) using the ΔΔCt method.
Primary culture
Muscles were collected from E18.5–19.5 embryos obtained by cesarean section, after mating heterozygous animals. Primary cell cultures were prepared individually from each embryo. Muscles from each embryo were digested first in 0.5 ml of a digestion mix composed of IMDM medium with 0.5 mg/ml collagenase (Sigma) and 3.5 mg/ml dispase (Sigma) in thermomixer at 37°C (1200 rpm) for 15 min. The supernatant was collected and the muscles further digested in the same medium for 40 min. Cells were collected by centrifugation and fibroblasts were removed after 3 h preplating in IMDM with Glutamax (Life Technologies) supplemented with 10% fetal bovine serum (Life Technologies) and 2% penicillin-streptomycin (Life Technologies). Myoblasts were further cultured in proliferation medium containing IMDM with Glutamax supplemented with 20% FBS, 1% penicillin-streptomycin and 1% chicken embryo extract (MP Biomedical) onto a matrigel-coated dish. Differentiation was induced in myoblasts plated at 100.000 cells/cm2 on laminin (#354232, Corning-Falcon) by a switch to differentiation medium composed of DMEM low glucose with Glutamax (Life Technologies) supplemented with 2% horse serum (Life technologies) and 1% penicillin-streptomycin.
Calcium imaging in cultured myotubes
Myotubes were produced from +/+, IT/+ and IT/IT myoblasts after three to four days in differentiation medium. Changes in intracellular calcium were measured using the calcium-sensitive fluorescent dye Fluo 4-Direct (Molecular Probes) diluted in differentiation medium, as described previously. 23 Calcium measurement was performed in Krebs buffer (136 mM NaCl, 5 mM KCl, 2 mM CaCl2, 1 mM MgCl2, 10 mM HEPES, pH7.4). KCl stimulation (140 mM final concentration) was performed by application of Krebs in which NaCl was replaced by KCl (140 mM KCl, 2 mM CaCl2, 1 mM MgCl2, 10 mM HEPES, pH7.4). 4-chloro-meta-cresol (4-CmC) was diluted at 500 µM final concentration in Krebs. Data are presented as the mean ± S.E.M of the values obtained in n myotubes in each condition, from at least 3 different experiments.
CaV1.1 Ca2+ current and SR Ca2+ release activated by depolarizing voltage-clamp pulses in isolated muscle fibers
Muscle fibers were isolated from the flexor digitorum brevis (FDB) and interosseus muscles following a previously described procedure.24,25 Single fibers were isolated by gentle mechanical trituration of a muscle within a 50-mm wide culture μ-dish (Ibidi) filled with culture medium containing 10% bovine fetal serum (MI199; Fisher Scientific), and the bottom of which had been covered, before, with a thin layer of silicone grease. Under these conditions, single fibers could be partially embedded within silicone so that only a short end-portion of fiber (typically ∼100 µm long) remained in contact with the extracellular medium. The culture medium was then replaced by the experimental external solution containing (in mM) 140 TEA-methane-sulfonate, 2.5 CaCl2, 2 MgCl2, 1 4-aminopyridine, 10 HEPES, 0.001 tetrodotoxin. A glass micropipette was filled with our standard internal solution containing (in mM) 120 K-glutamate, 5 Na2-ATP, 5 Na2-phosphocreatine, 5.5 MgCl2, 5 glucose, and 5 HEPES. Solutions were adjusted to pH 7.20. For simultaneous measurements of CaV1.1 Ca2+ current and SR Ca2+ release, the internal solution also contained the Ca2+-sensitive dye rhod-2 at 0.1 mM. The micropipette tip was inserted within the silicone-embedded part of the fiber and crushed against the bottom of the chamber to ease intracellular dye equilibration and reduce the access resistance. Analog compensation was also used to decrease the effective access resistance. Fibers were held at a resting level of −80 mV, from which 0.5s-long depolarizing pulses were delivered. This was achieved through connexion of the silver–silver chloride wire inside the micropipette to an RK-400 patch-clamp amplifier (Bio-Logic) used in whole-cell voltage-clamp configuration. Command voltage pulse generation and data acquisition were done with pClamp 9 software (Axon Instruments) driving a Digidata 1440A converter (Axon Instruments). For CaV1.1 current and Ca2+ release measurements, fibers isolated from the FDB muscles were used. For imaging of rhod-2 fluorescence, a Zeiss LSM 800 microscope equipped with a 63× oil immersion objective (numerical aperture 1.4) was used. Measurements of rhod-2 Ca2+ transients were performed in line-scan (x,t) mode at a frequency of 980 Hz, using excitation from a 561 nm diode laser. Rhod-2 transients were expressed as F/F0, with F0 the baseline fluorescence. Quantification of the SR Ca2+ release flux (dCaTot/dt) from the rhod-2 transients was achieved as previously described25,26 using the concentration values and kinetic parameters described by Sanchez et al. 27 EGTA was included with a binding sites concentration assumed to be 7.2 mM, and values for on and off rate constants and corresponding equilibrium dissociation constant taken from. 28 The voltage-dependence of the peak Ca2+ release flux was fitted with a Boltzmann function: dCaTot/dt = Max dCaTot/dt /(1 + exp[(V0.5−V)/k]), with Max dCaTot/dt the maximum peak Ca2+ release flux, V0.5 the mid-activation voltage and k the steepness factor.
CaV1.1 current analysis was performed as previously described 29 : in brief, the linear leak component of the membrane current was removed using the scaled steady change in current elicited by a −20 mV voltage step. The voltage dependence of the peak current was fitted with the following function: I (V) = Gmax(V−Vrev)/{1 + exp[(V0.5−V)/k]} + slope(V + 80), with I(V) the peak current density at voltage V, Gmax the maximum conductance, Vrev the apparent reversal potential, V0.5 the half-activation voltage, k the steepness factor and slope the conductance of a residual linear component.
Intramembrane charge movement
CaV1.1 charge movement was measured from interosseus muscle fibers held at a resting voltage of −100 mV. The same voltage-clamp conditions as described above were used, but with solutions of distinct composition: the extracellular solution contained (in mM) 140 TEA-methane-sulfonate, 0.1 CaCl2, 3 MgCl2, 0.5 MnCl2, 1 CdCl2, 1 4-aminopyridine, 10 HEPES, 0.001 tetrodotoxin. The internal solution contained (in mM) 140 TEA-methane-sulfonate, 5 Na2-phosphocreatine, 5.5 MgCl2, 5 glucose and 5 HEPES. Solutions were adjusted to pH 7.20. Intramembrane charge movement currents were extracted from membrane current records following previously described procedures. 25 In brief, control current records elicited by 20 mV hyperpolarizing pulses of 25 ms duration were appropriately scaled and subtracted from the current elicited by test depolarizing pulses of the same duration to various levels. The amount of charge was measured by integrating the on portion of the processed test current records. The steady-state distribution of charge density was fitted with a Boltzmann function: Q(V)=Qmax/{1 + exp[(V0.5−V)/k]}, with Qmax the maximal available charge, V0.5 the voltage of equal charge distribution and k the steepness factor.
Hanging grip test
The hanging grip strength test was performed during 5 months, between 3 and 8 months of age, on males (15 +/+ and 17 IT/+) and females (15 +/+ and 13 IT/+). The animals were trained 3 times on 3 different days over the week before the test began, and were subsequently tested once per week. The animals were positioned on a cross-wired surface where they could hold on with all four paws. The grid was then turned upside down above a padded support. The total time during which each animal was able to hold on the grid before falling was recorded, up to a maximum of 600 s, with tree falls allowed.
Grip strength test
The grip strength test was conducted using a grip strength meter (Bioseb) once a month for 5 months, between 3 and 8 months of age on males (15 +/+ and 17 IT/+) and females (15 +/+ and 13 IT/+). The mouse was allowed to grasp the bar with its forelimb and was gently pulled by the tail with a consistent force until the forelimb detached from the grid. The maximum strength was recorded at that point as the force in grams recorded on a digital force transducer. Three consecutive measurements were taken for each mouse, and the maximal value was kept.
Treadmill test
The treadmill test was performed on males (15 +/+ and 17 IT/+) and females (15 +/+ and 13 IT/+) at 9 months of age. Mice were first trained for one week on a five-lane treadmill with very small electric stimulation at the end (Bioseb), during 5 min every day at 10 cm/s, without slope. The following running protocol was further performed: warm up 2 min at 9 cm/s, no slope, followed by 2 min at 9 cm/s with a slope of 30°. The slope was maintained at 30° and the speed was increased by 2 cm/s every two minutes up to 53 cm/s for males and 35 cm/s for females, adapted from the protocol described by Dayal et al. 30 The exercise ended when the mice stopped running. Total distance (in meter) and total running time (in min) were recorded.
Open-field test
Spontaneous activity of mice was measured as the total distance travelled in cage similar to their home-cage environment with free access to hydrated food. Each animal was individually housed and automatically tracked all night using a video tracking system (Noldus, Ethovision XT 16 software) with an infrared camera. Males (15 +/+ and 17 IT/+) and females (15 +/+ and 13 IT/+) were tested at 8 months of age. The total distance per night (12 h) and the distance per hour were calculated from the analysis of the movie recorded for each animal.
Noninvasive investigation of gastrocnemius muscle function under electrostimulation
Gastrocnemius muscle anatomy and mechanical performance were investigated noninvasively using nuclear magnetic resonance (NMR) measurements in 5 +/+ and 5 IT+/- male littermates and 7 +/+ and 9 IT+/- female littermate of 10–11 months as described previously. 11 Anesthetized mice were placed into a home-built device allowing the NMR investigation of the left gastrocnemius muscle function inside the 7-Tesla horizontal magnet of a preclinical 70/16 PharmaScan NMR scanner (Bruker, Karlsruhe, Germany). Ten consecutive axial anatomic images (1-mm thickness; 0.25-mm spaced; 0.078 × 0.078 mm2 spatial resolution) covering the region from the knee to the ankle were acquired at rest. Muscle function was evaluated with a dedicated ergometer throughout a tetanic contraction (100 Hz; 0.25-s duration) and during a fatiguing bout of exercise electrically induced by square-wave pulses (1 ms duration) using transcutaneous surface electrodes and consisting in 6 min of maximal isometric contractions repeated at a frequency of 2 Hz. Gastrocnemius contractile force was recorded and processed using the Powerlab 35 series system driven by the LabChart v8.1 software (AD Instruments, Oxford, United Kingdom). In order to calculate muscle volume, NMR images were processed using custom software code written in Python. For each image, region of interest was manually outlined so that the corresponding cross-sectional area of the gastrocnemius muscle was measured.
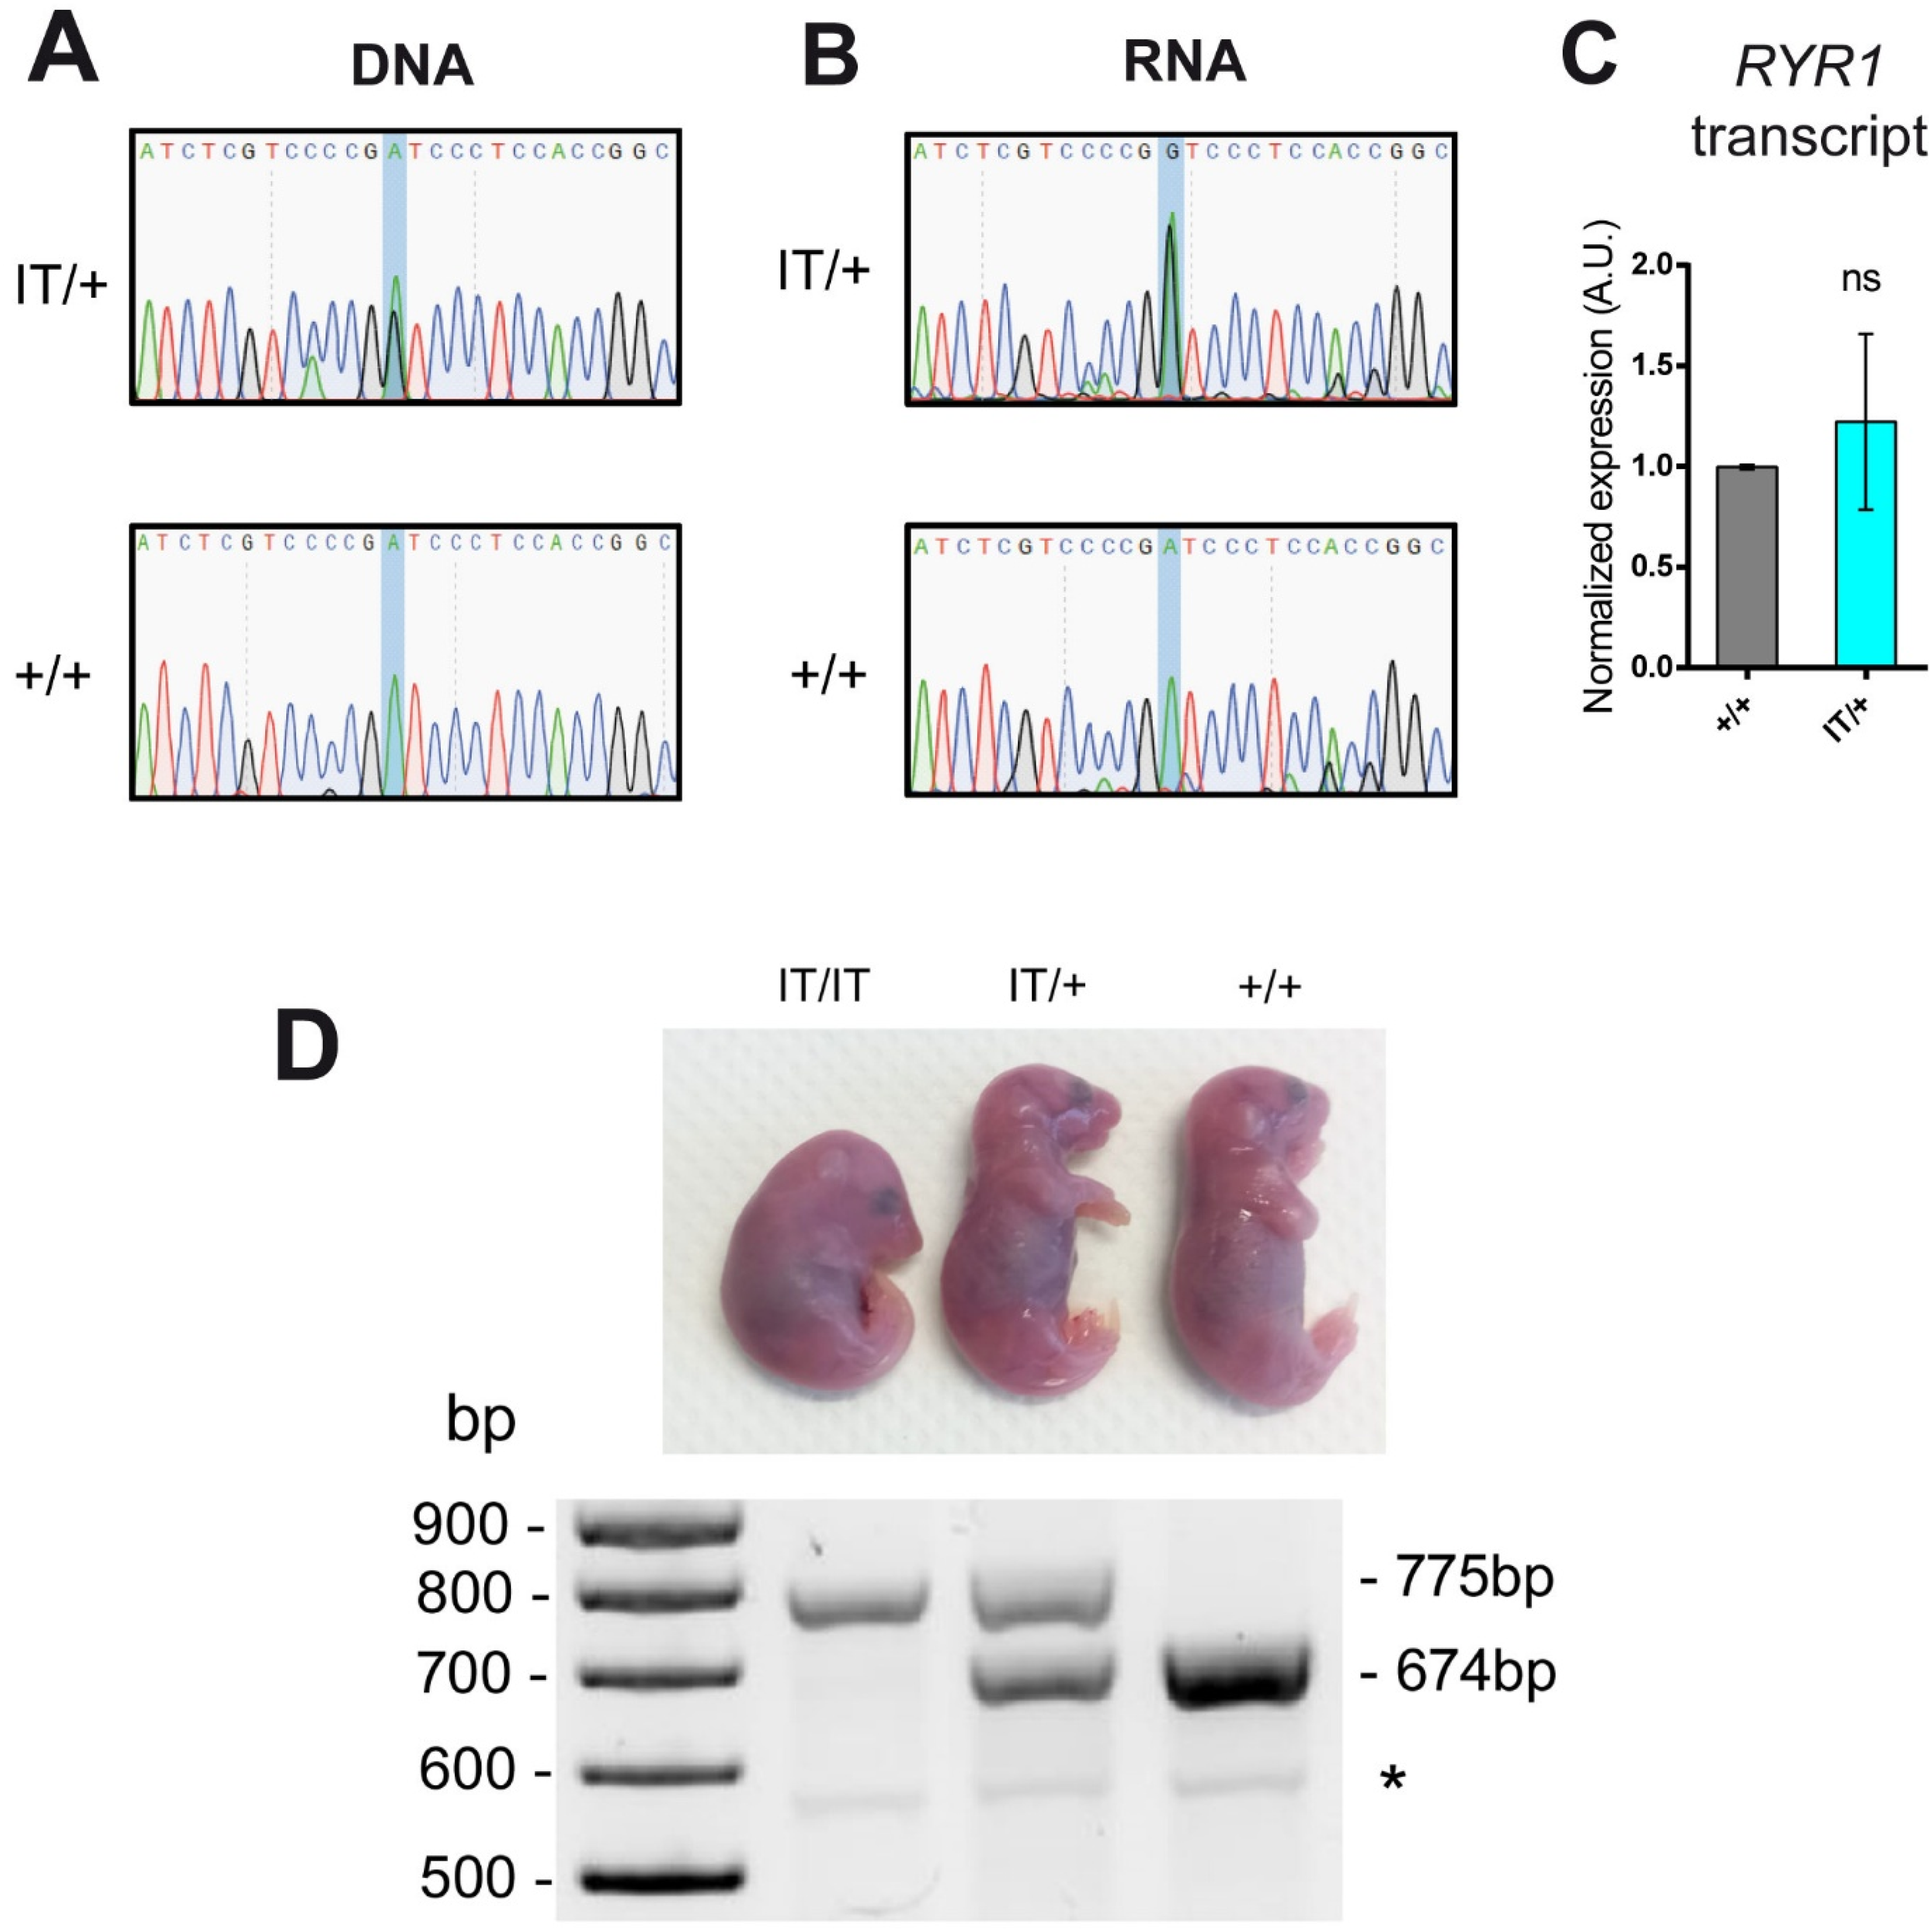
Molecular characterization. (A) The presence of the mutation was confirmed by PCR amplification of a 300 bp region of genomic DNA encompassing the mutation, using the JAX primers, followed by sequencing for IT/+ and +/+ mice. On the electropherogram of IT/+ mice two peaks are observed for the mutation, unlike +/+ mice. (B) The mRNA extracted form muscle of IT/+ and +/+ animals was reverse transcribed, amplified and Sanger sequenced. The presence of the mutation is confirmed at the mRNA level in the IT/+ animal. (C) The total amount of RYR1 transcripts was quantified using RT-qPCR in muscle from four IT/+ and two +/+ animals. No difference was observed between both genotype, confirming the equal stability and amount of the WT and IT transcript. Data are presented as mean ± SEM of the 2 to 4 animals. Statistical analysis: unpaired t-test it/+ vs +/+ p = 0.7488, ns: non specific. (D) The morphology of IT/IT E19.5 embryo (curved position) is clearly different from the IT/+ or the +/+ which are undistinguishable, and can be differentiated only by genotyping. The genotype of each animal was determined by PCR amplification as presented on the lower gel, with the in-house designed primers taking advantage of the 101 bp foreign DNA, allowing the amplification of a band at 674 bp for the WT allele and at 775 bp for the IT allele. The star (*) correspond to a non specific band.
Statistics
The statistical analysis has been done with GraphPad Prism 6.0 software. The normal distribution of samples has been checked and the number of samples with the name of the parametric or nonparametric test applied is indicated in each figure legend. For experiments on intact muscle fibers isolated from +/+ and IT/+ mice, statistical comparison was achieved using a nested analysis, taking into account the number of fibers from each animal, implemented in GraphPad Prism 10 software. Results are considered significant when p < 0.05, the exact value for p is indicated in the text or figure legends. Data are shown as mean ± SEM or ± SD as described in text.
Results
Characterization of the mice at the molecular level
The RyR1-I4895T mouse line, on an 129S6/SvEvTac*129S2/SvPasCrl background, was obtained from the Jackson laboratories (Jax). The genotype of the mice was confirmed according to the protocol provided by the Jax (Figure 1), and confirmed by sequencing of the PCR fragment (Figure 1(A)). To further confirm the expression of the knock-in allele in heterozygous IT/+ mice, RT-PCR was performed on mRNA extracted from the quadriceps of one +/+ and four IT/+ mice. Sequencing of +/+ and IT/+ cDNA confirmed the presence of the mutant transcript and WT transcript in equivalent amount in IT/+ mice, as shown in Figure 1(B) and supplementary Figure 1. In addition, the total amount of RYR1 transcript has been evaluated using RT-qPCR on 2 +/+ and 4 IT/+ mice, and no difference in the mean amount of RYR1 transcript was observed between +/+ and IT/+, thus confirming a similar expression level between the WT and the IT allele (Figure 1(C)). The heterozygous IT/+ mice were viable and fertile without apparent skeletal deformities, whereas homozygous IT/IT mice didn’t survived up to birth but were easily distinguishable among E19 embryos because they maintained a curved embryonic position and did not respond to stimuli (Figure 1(D)). These results confirmed that both the WT and the IT mutant alleles are expressed, and that the heterozygous animals are similar on a molecular point of view to the previously described animals on this background.16,18–20
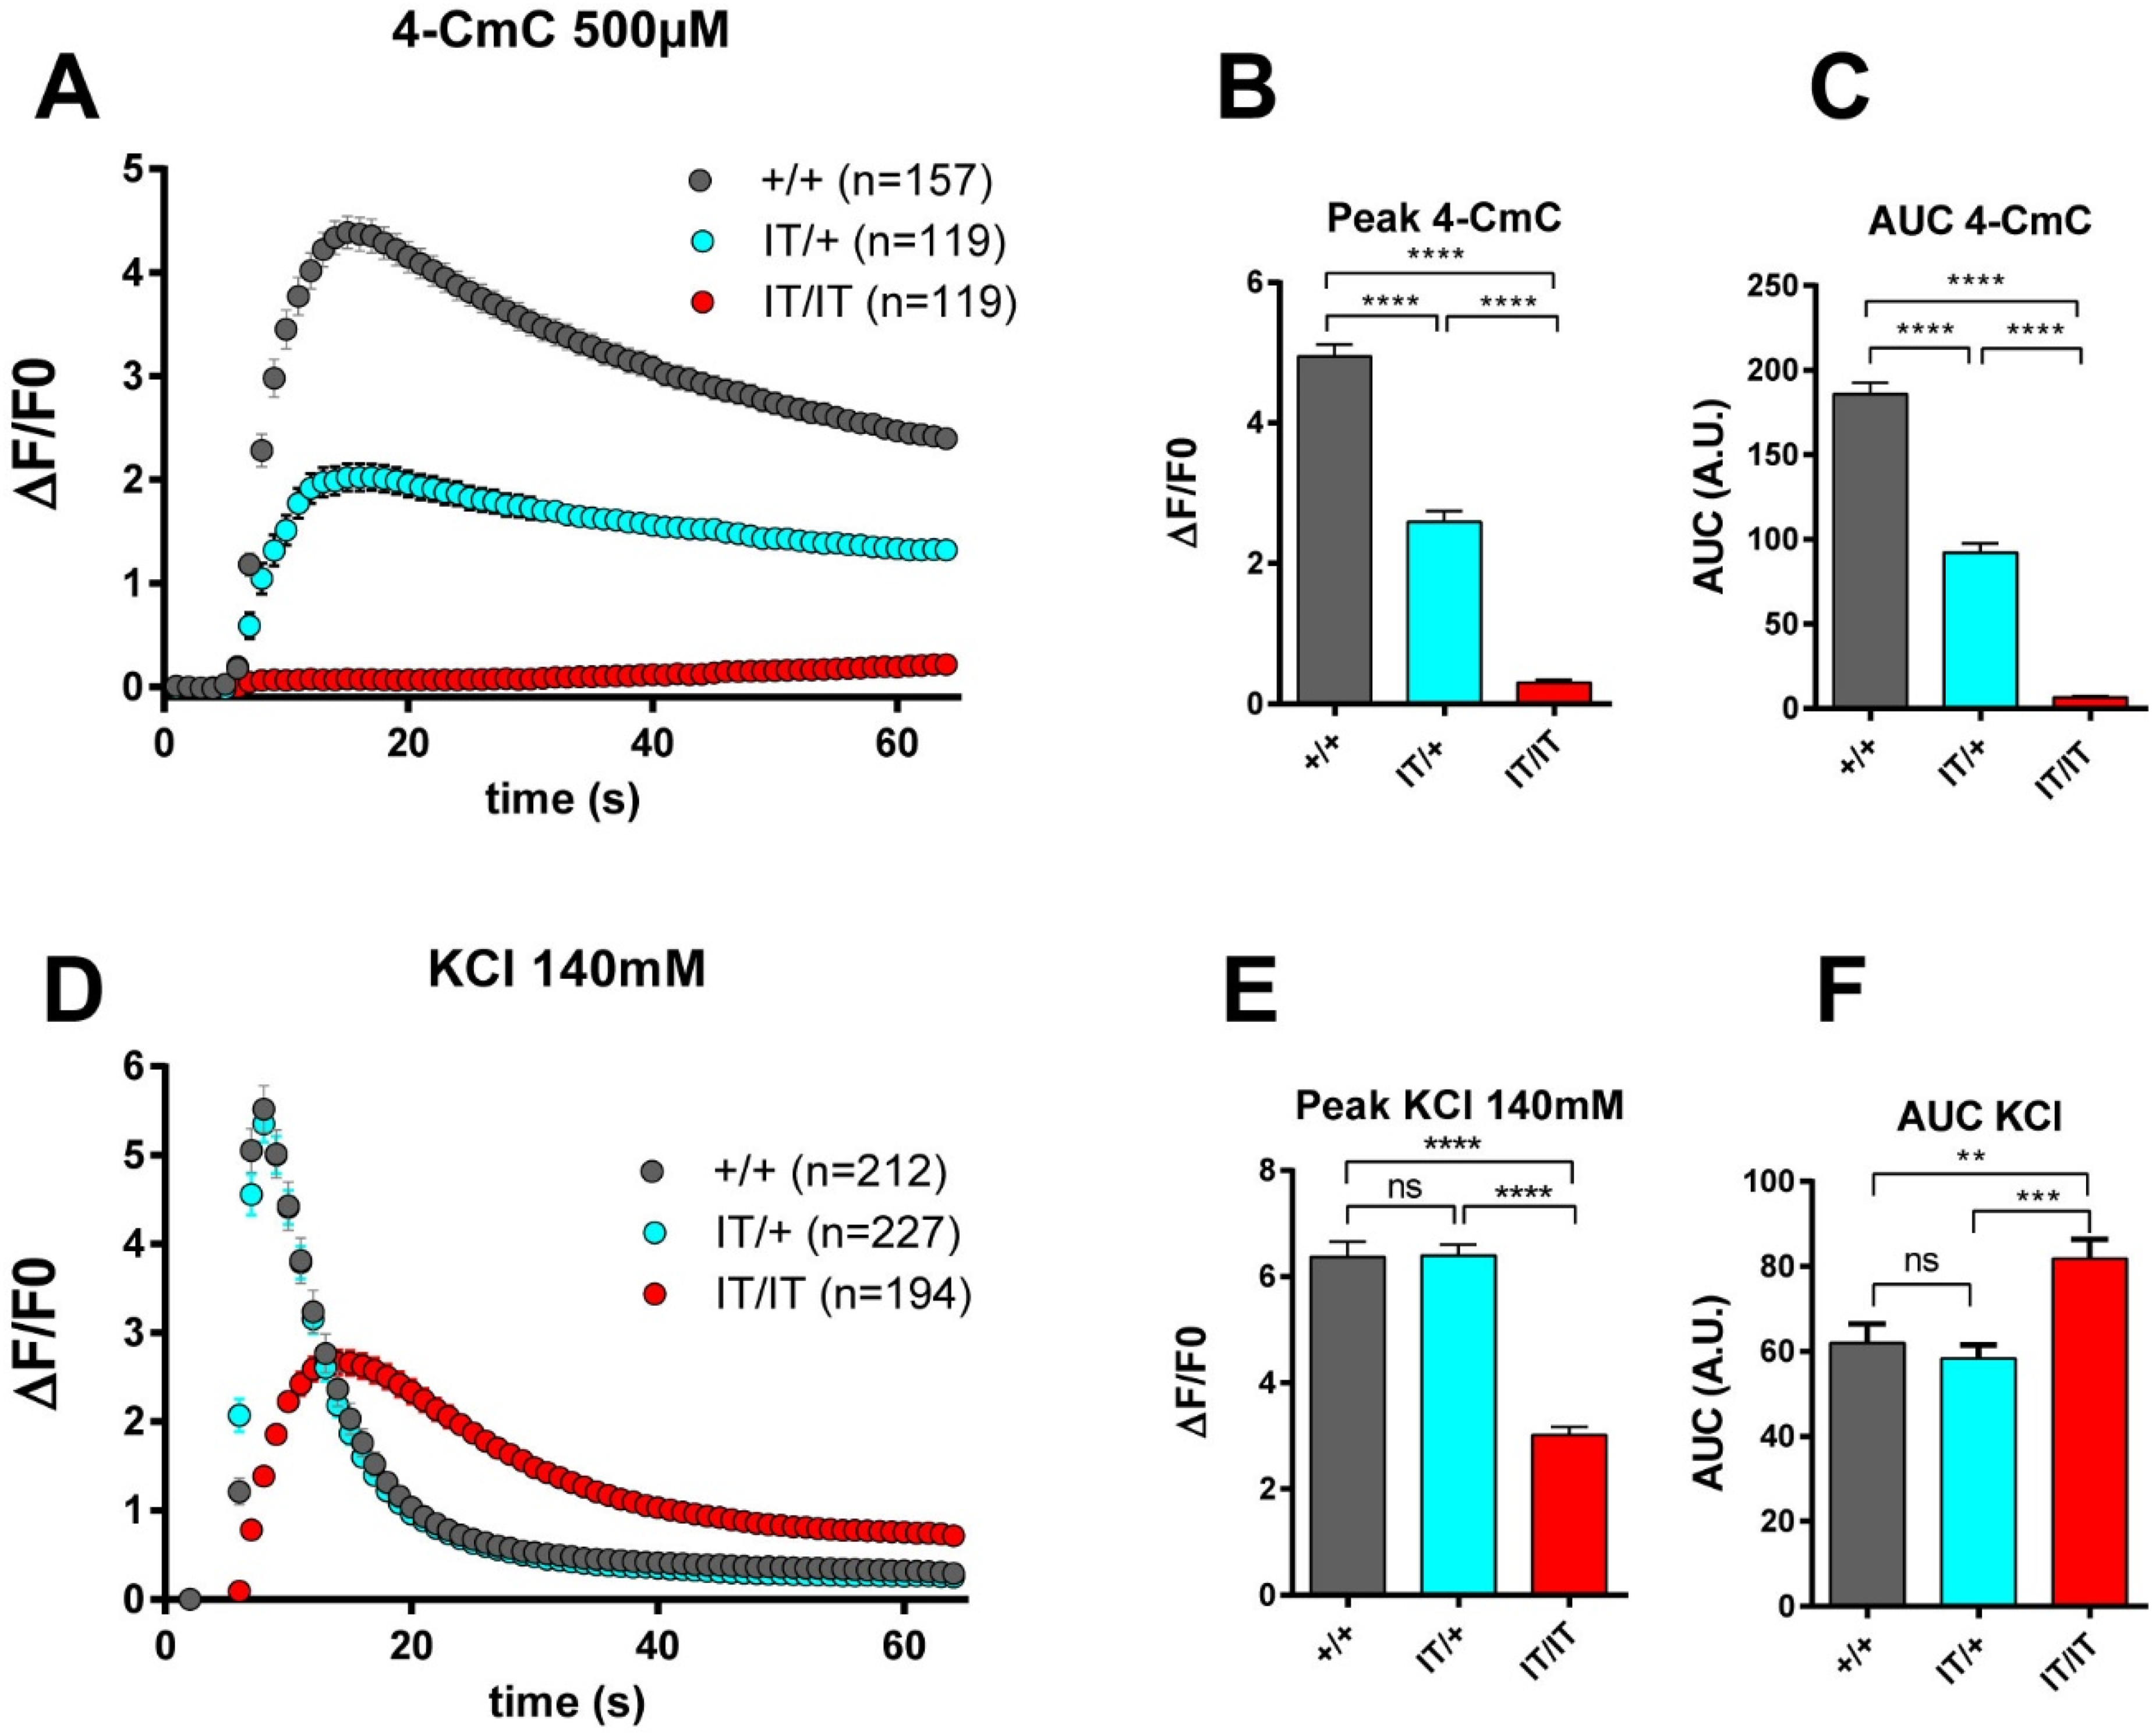
Calcium release in cultured myotubes. Fluo-4 calcium imaging performed on myotubes produced from +/+, IT/+ and IT/IT embryonic muscles. The curves represent the fluorescence variation in +/+ myotubes (black curve), IT/+ myotubes (blue curve), IT/IT myotubes (red curve). The stimulation was performed at 5 s, and the fluorescence variation (ΔF/F0) recorded for 1 min. All values are presented as mean ± standard error of mean (SEM) of n myotubes. In each condition, n = 119 to 227 myotubes have been analyzed, from at least 4 different experiments (exact number indicated for each curve). (A) Kinetics of calcium release upon stimulation by 4-CmC 500 µM. (B) Peak amplitude of calcium release after 4-CmC stimulation presented as mean ± SEM of the maximum for each myotube. Statistical analysis: Kruskal-Wallis test with Dunn's multiple comparisons test. IT/+ vs +/+: p < 0.0001; IT/IT vs +/+ p < 0.0001; IT/IT vs IT/+ p < 0.0001. (C) Mean area under the curve presented as mean ± SEM of the AUC for each myotube. Statistical analysis: Kruskal-Wallis test with Dunn's multiple comparisons test. IT/+ vs +/+: p < 0.0001; IT/IT vs +/+ p < 0.0001; IT/IT vs IT/+ p < 0.0001. (D) Kinetics of calcium release upon stimulation by KCl 140 mM. (E) Peak amplitude of calcium release after KCl stimulation presented as mean ± SEM of the maximum for each myotube. Statistical analysis: Kruskal-Wallis test with Dunn's multiple comparisons test. IT/+ vs +/+: ns; IT/IT vs +/+ p < 0.0001; IT/IT vs IT/+ p < 0.0001. (F) Mean area under the curve presented as mean ± SEM of the AUC for each myotube. Statistical analysis: Kruskal-Wallis test with Dunn's multiple comparisons test. IT/+ vs +/+: ns; IT/IT vs +/+ p < 0.001; IT/IT vs IT/+ p < 0.01.
Characterization of Ca2+ release in cultured myotubes
To confirm the impact of the mutation on the RyR1 function, calcium release was studied using calcium imaging with the calcium sensitive dye Fluo-4 in primary cultures produced from E19 embryo muscles. Calcium release was induced in 3 days differentiated myotubes produced from +/+, IT/+ and IT/IT primary muscle cultures by direct 4-chloro-m-cresol (4-CmC) RyR1-stimulation or by KCl membrane depolarization. As observed on Figure 2, IT/+ myotubes displayed a reduced calcium release upon 4-CmC stimulation compared to +/+ myotubes, characterized by reduction in peak amplitude and reduction in the area under the curve. The calcium release was abolished in IT/IT myotubes. No difference was observed using KCl membrane depolarization between +/+ and IT/+ myotubes, and alteration in KCl-induced calcium release is observed only in IT/IT myotubes (Figure 2(D)–(F)). These results are consistent with the results obtained directly on patient's cells for 4-CmC but not for KCl stimulation: human myotubes with this mutation, produced from central core disease patient, exhibited reduced calcium release in response to 4-CmC and KCl. 17 The increase in intracellular Ca2+ observed upon KCl stimulation in IT/IT myotubes could be due to extracellular calcium influx, as the same stimulation in the absence of extracellular calcium didn't result in any quantifiable cytosolic calcium increase (Supplemental Figure 2). It may be considered that saturation of fluo-4 during Ca2+ release could impede detection of a small difference in KCl-induced Ca2+ release between WT and IT/+ fibers. Assuming a resting Ca2+ level of 0.1 µM, an equilibrium dissociation constant of the Ca2+-fluo-4 binding reaction of 1 µM 31 and a ratio of 100 for the fluo-4 fluorescence intensity at saturating [Ca2+] to that at zero [Ca2+], 31 the measured levels of peak ΔF/F0 values (∼5–6) would correspond to 60–70% of fluo-4 saturation, a range that should definitely allow to detect a change between the two groups.
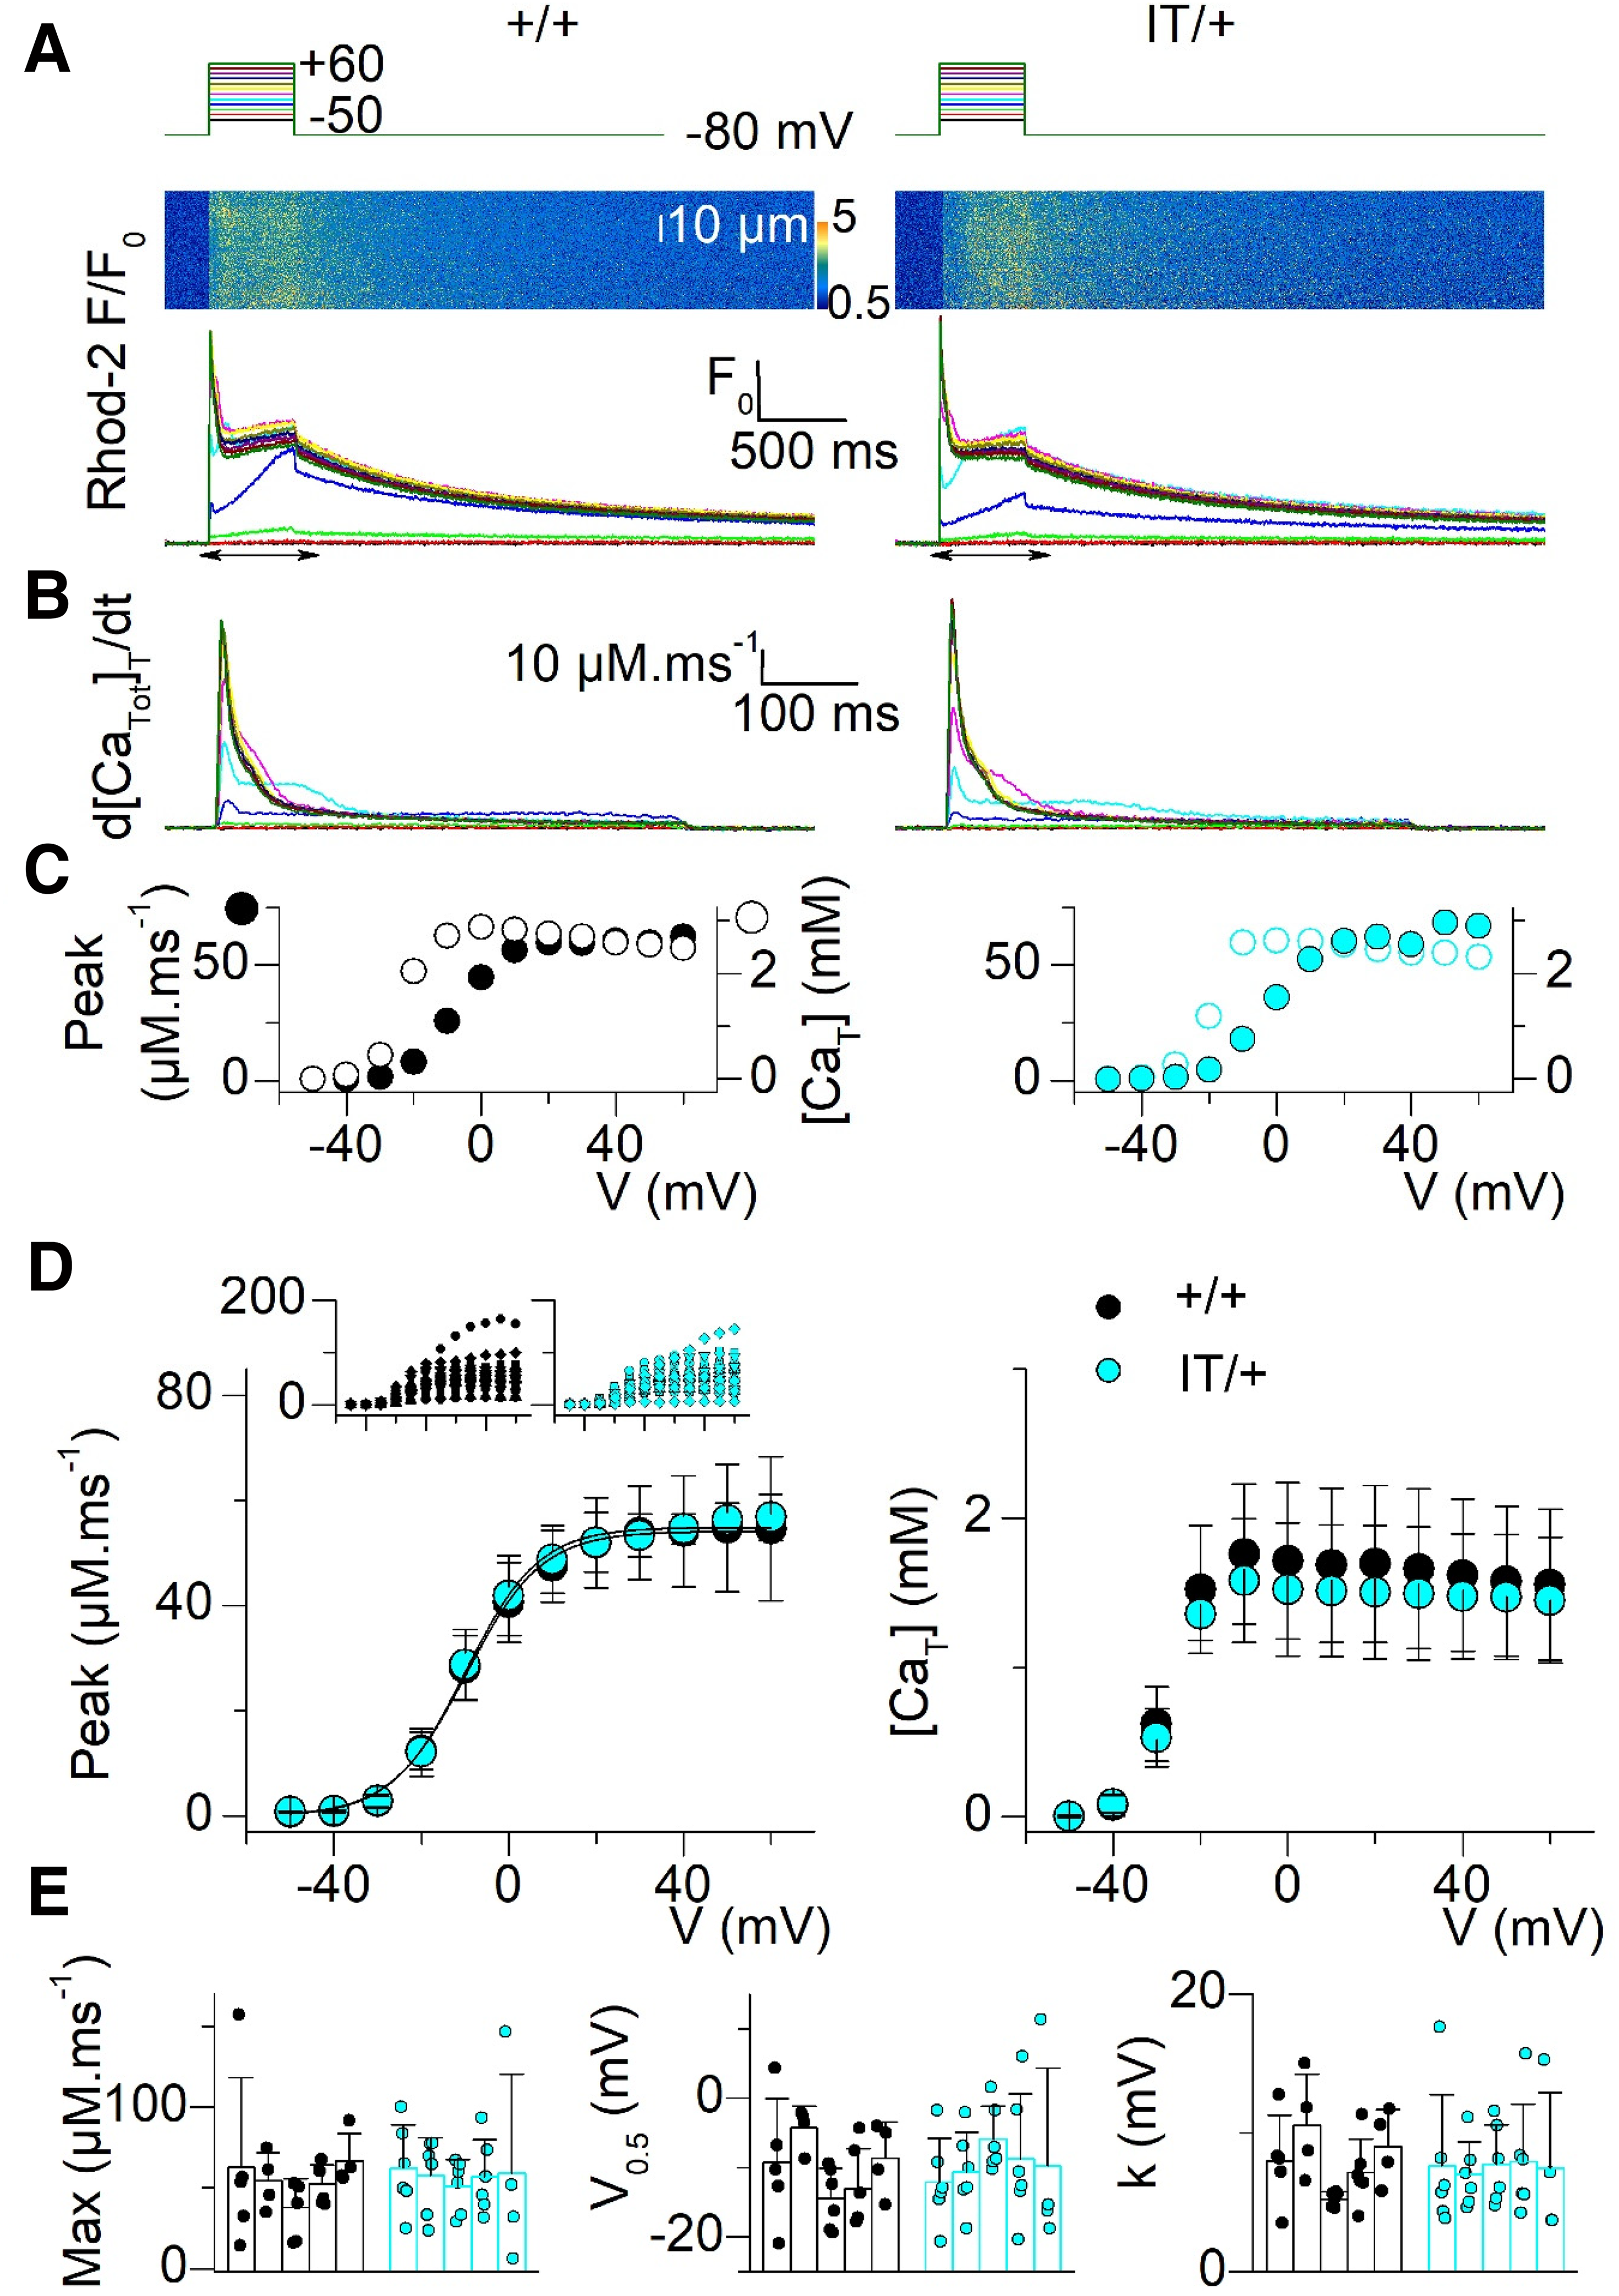
Voltage-activated SR Ca2+ release in muscle fibers from +/+ and IT/+ mice. (A) Representative rhod-2 F/F0 fluorescence transients elicited by the voltage-clamp pulse protocol shown on top, in a +/+ fiber (left) and in an IT/+ fiber (right). The line-scan image recorded while applying the pulse to −10 mV is shown above each series of F/F0 traces. (B) SR Ca2+ release flux traces calculated from the rhod-2 transients shown in A. (C) Voltage dependence of the peak Ca2+ release flux (filled symbols) and of the total amount of released Ca2+ (open symbols) from the +/+ and IT/+ release traces shown in b. (D) Voltage dependence of the mean (±SD) peak SR Ca2+ release flux (left) and total amount of released Ca2+ (right) in the two groups of fibers (datasets are from 27 fibers from 5 +/+ mice and from 28 fibers from 5 IT/+ mice). For both parameters, the average value from fibers from a same animal was calculated (number of fibers was 4–6 per mouse). The mean was calculated from these average values. Insets in the left panel show all individual values for peak SR Ca2+ release flux versus voltage in the +/+ and IT/+ fibers. An identical symbol was used for fibers from the same animal. (E) Individual values in each fiber (data points) and mean (± SD) values in each animal (bars) for maximum rate of SR Ca2+ release (left), voltage of mid-activation (middle) and slope factor (right) obtained from fitting a Boltzmann function to the dataset from each fiber.
Voltage-activated SR Ca2+ release in single fibers
The model was further explored using a combination of electrophysiology and confocal Ca2+ imaging in intact isolated muscle fibers. For this, we used an established method combining the use of the Ca2+-sensitive dye rhod-2 with a large concentration of EGTA in the voltage-clamp pipette. Under these conditions, EGTA becomes the predominant Ca2+ buffer in the muscle fibers, which ensures that rhod-2 remains far from saturation during voltage-activated SR Ca2+ release, while also enabling inhibition of contraction and simplifying the estimation of the SR Ca2+ release flux. Illustrative examples of voltage-clamp-activated intracellular Ca2+ transients detected with the dye rhod-2 in a +/+ fiber and in an IT/+ fiber, are presented in Figure 3(A). Transients were triggered by depolarizing pulses covering the full range of activation of Ca2+ release. In the fibers of both genotype, transients presented with a similar threshold of activation and with a similar time-course and amplitude over the entire voltage range. Figure 3(B) shows the SR Ca2+ release flux traces calculated from the rhod-2 transients, with corresponding values for peak Ca2+ release flux (filled circles) and total amount of released Ca2+ (relative to myoplasmic volume, open circles) plotted versus voltage in Figure 3(C). The similarity of the Ca2+ release properties in the +/+ fiber and in the IT/+ fiber was confirmed by statistical analysis of all collected data. The voltage-dependence of the mean (±SD) values for peak Ca2+ release flux and total amount of released Ca2+ in the two groups are shown in Figure 3(D). Values for peak SR Ca2+ release flux versus voltage were fitted with a Boltzmann function in each fiber. Individual values for the corresponding parameters (data points) and corresponding mean (±SD) values from each animal (bars) are presented in Figure 3(E), for the two groups. Statistical analysis showed no difference between +/+ and IT/+ parameters.
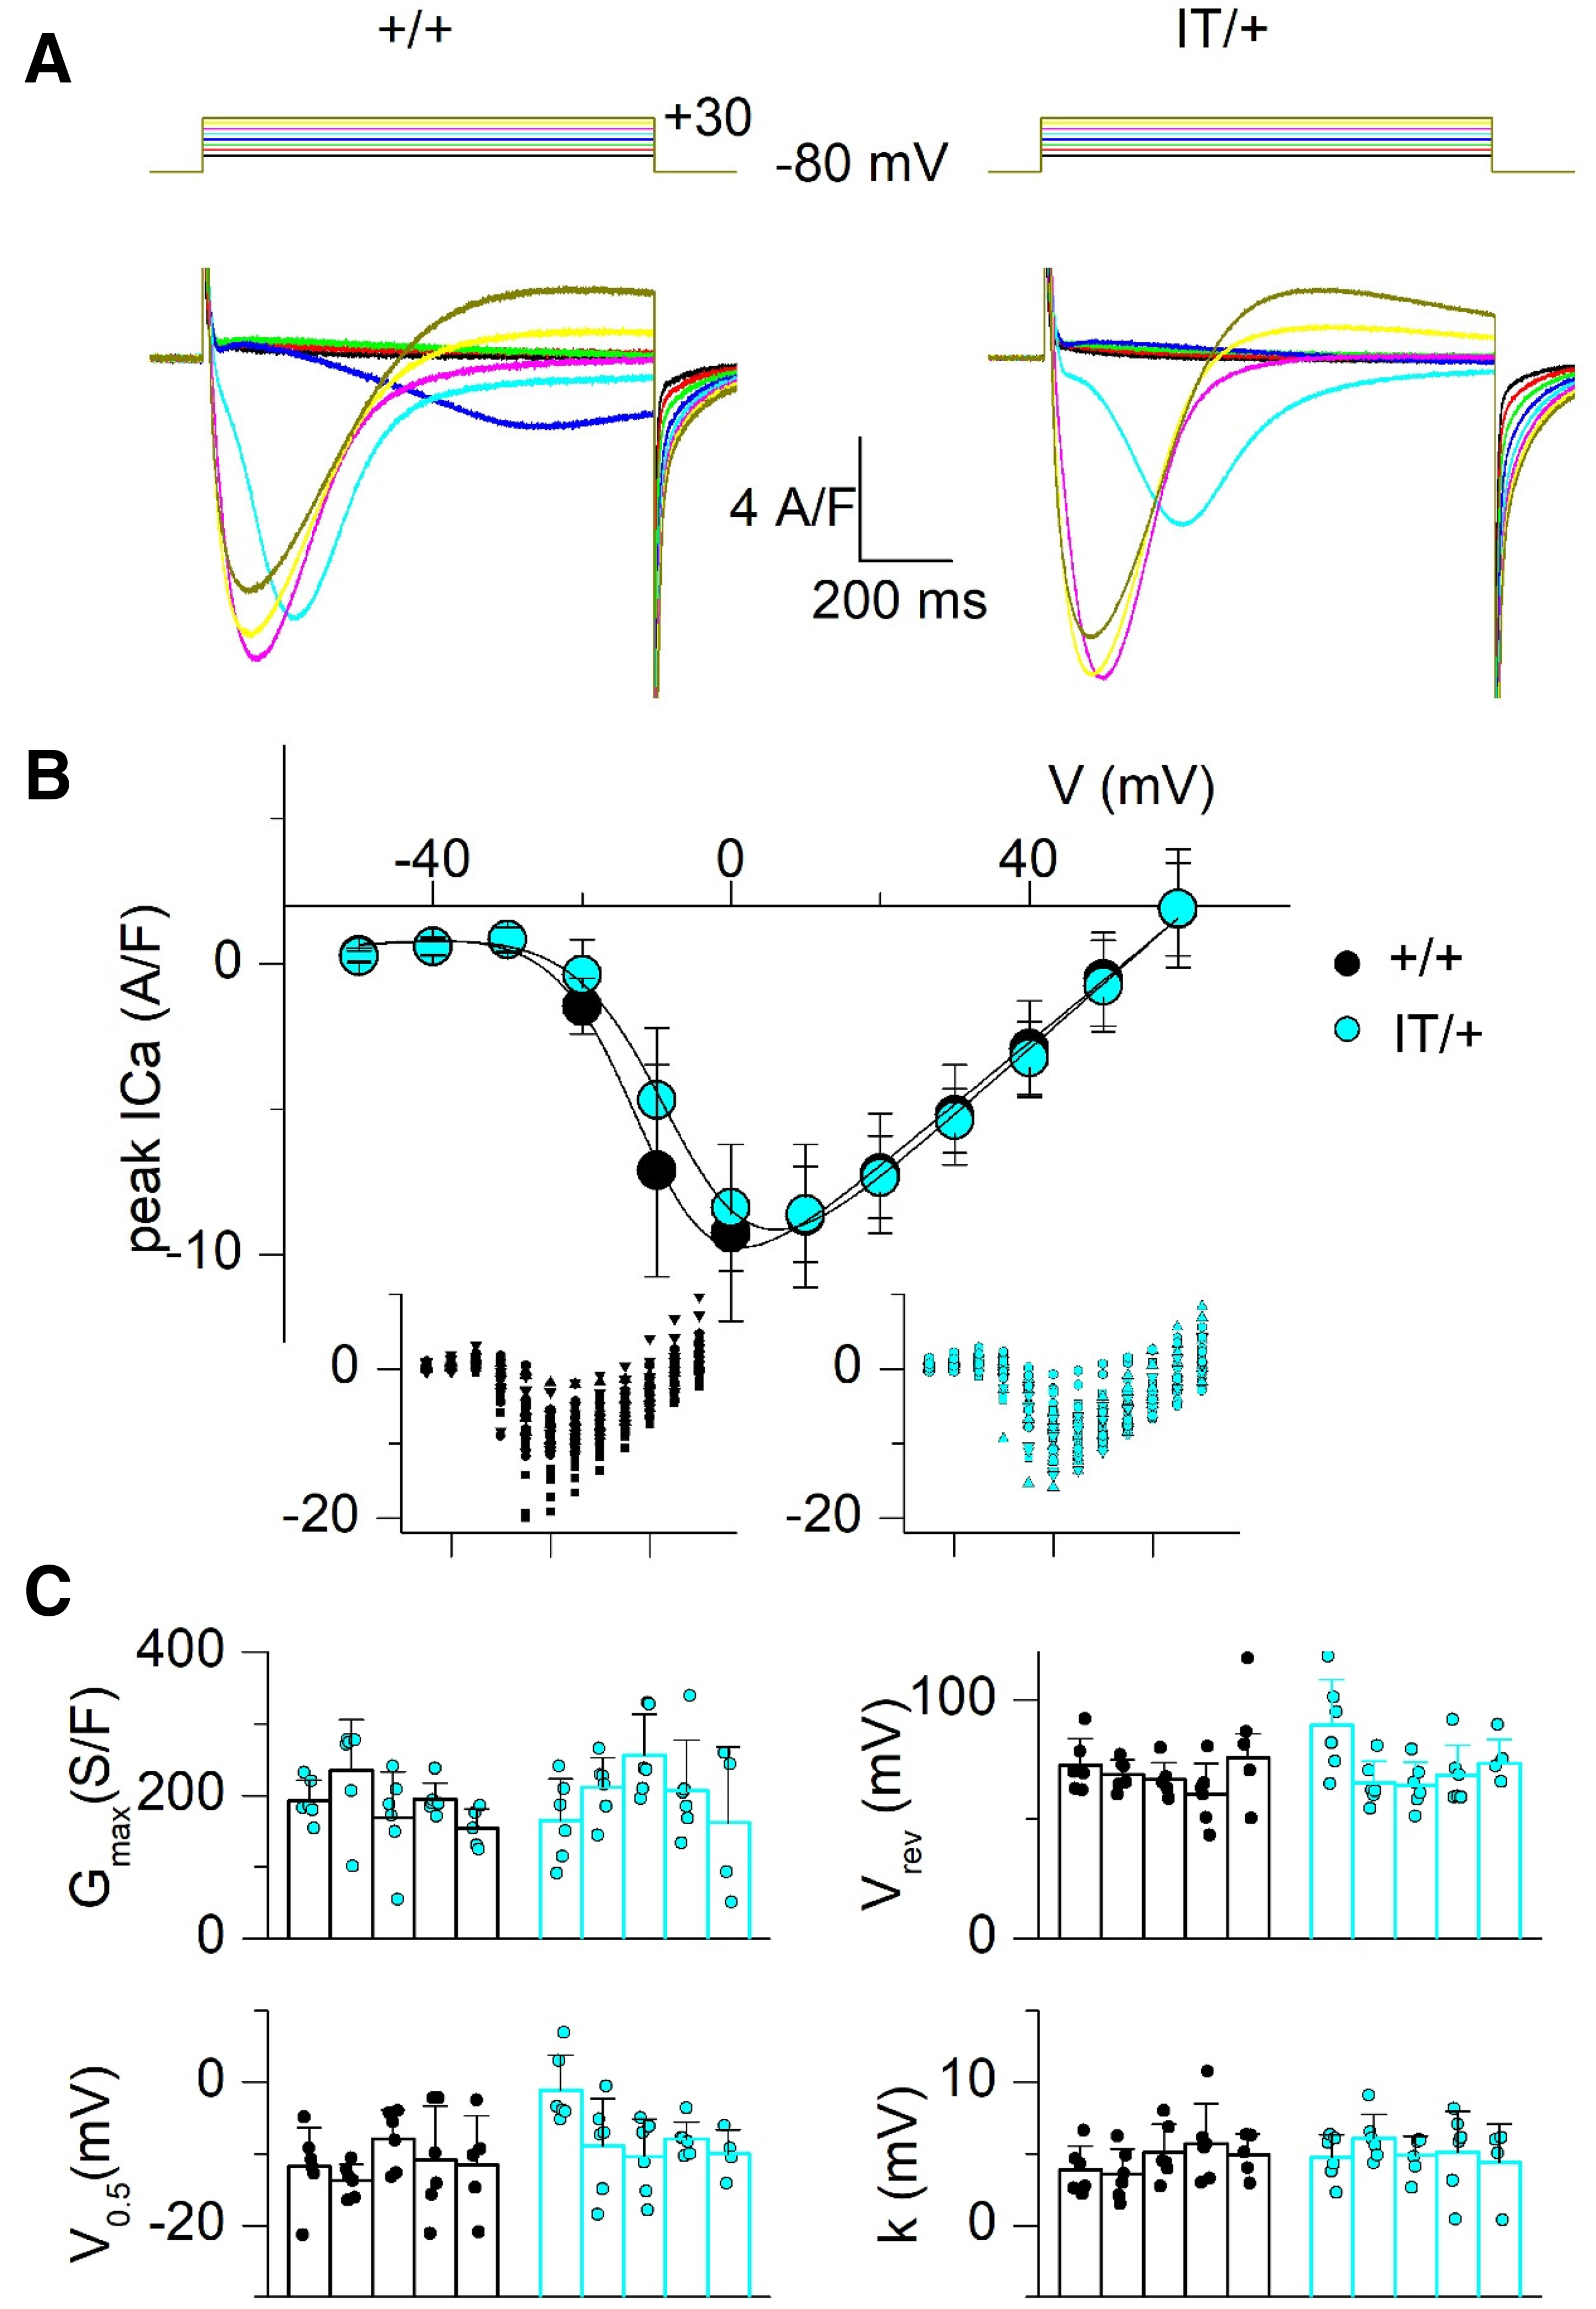
CaV1.1 Ca2+ current in muscle fibers from +/+ and IT/+ mice. (A) Representative Ca2+ current traces elicited by the voltage-clamp pulses shown on top, in a +/+ fiber (left) and in an IT/+ fiber (right). (B) Voltage dependence of the mean (±SD) peak Ca2+ current in the two groups of fibers (n = 5 mice in each group). For both parameters, the average value from fibers from a same animal was calculated (number of fibers was 4–6 per mouse). The mean was calculated from these average values. Insets show all individual values for peak Ca2+ current versus voltage in the +/+ and IT/+ fibers. An identical symbol was used for fibers from the same animal. (C) Individual values in each fiber (data points) and mean (± SD) values in each animal (bars) for the parameters fitted from the peak current versus voltage relationship in each fiber.
We also examined the function of CaV1.1 as Ca2+ channel and as voltage sensor of EC coupling. Ca2+ current records looked very similar in +/+ and IT/+ fibers as illustrated in Figure 4(A). The mean (±SD) values for peak current at the tested voltages are shown in Figure 4(B). In each fiber, the relationship was fitted as described in Methods and corresponding values for the parameters are reported in Figure 4(C). There was no statistically significant difference in any parameter between the two groups. Figure 5 shows the results from our charge movement measurements in +/+ and IT/+ fibers, following a similar overall format as in Figure 4. Again, there was no significant difference between the two groups in any of the parameters that described the Boltzmann distribution.
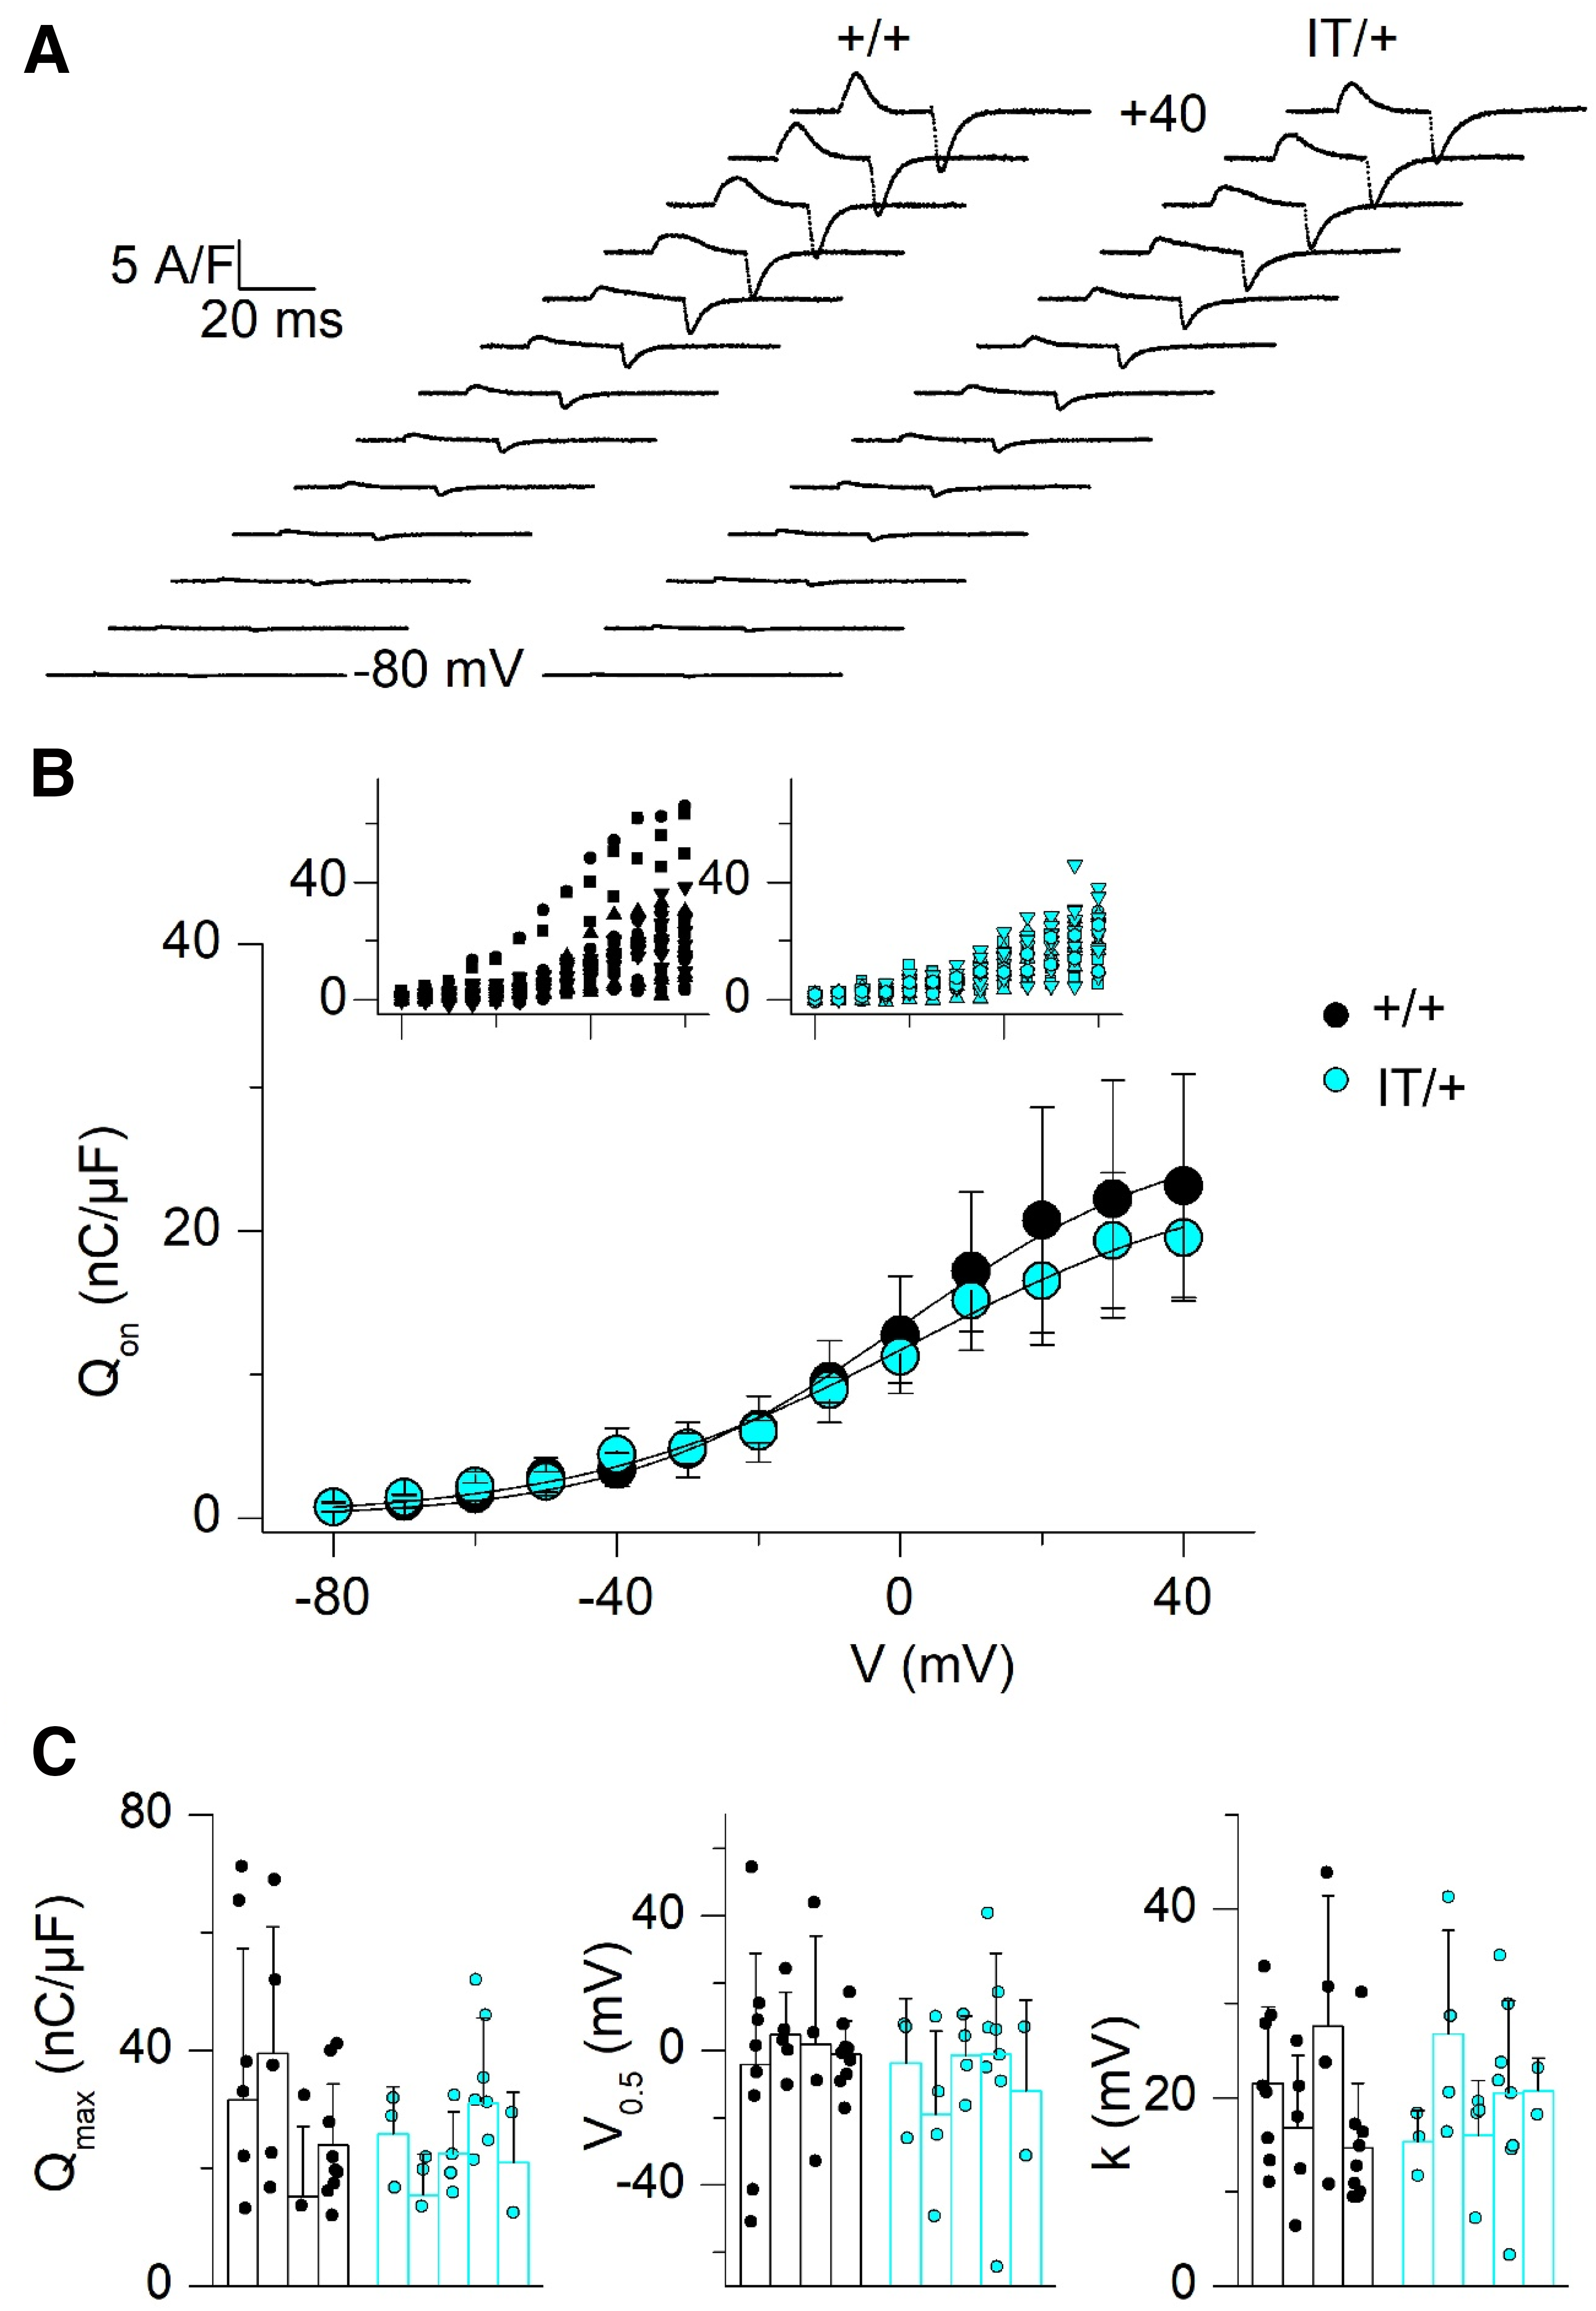
Intramembrane charge movement in muscle fibers from +/+ and IT/+ mice. (A) Representative intramembrane charge current traces elicited by 25 ms-long depolarizing pulses from −100 mV to values ranging between −80 and +40 mV (with a 10 mV increment), in a +/+ fiber (left) and in an IT/+ fiber (right). (B) Voltage dependence of the mean (±SD) amount of on charge in the two groups of fibers (n = 4 +/+ mice and n = 5 IT/+ mice). The average value from fibers from a same animal was calculated (number of fibers ranged between 2 and 9 per mouse) and the mean was calculated from these average values. Insets show all individual values for amount of on charge versus voltage in the +/+ and IT/+ fibers. An identical symbol was used for fibers from the same animal. (C) Individual values in each fiber (data points) and mean (± SD) values in each animal (bars) for the Boltzmann parameters fitted the dataset from each fiber.
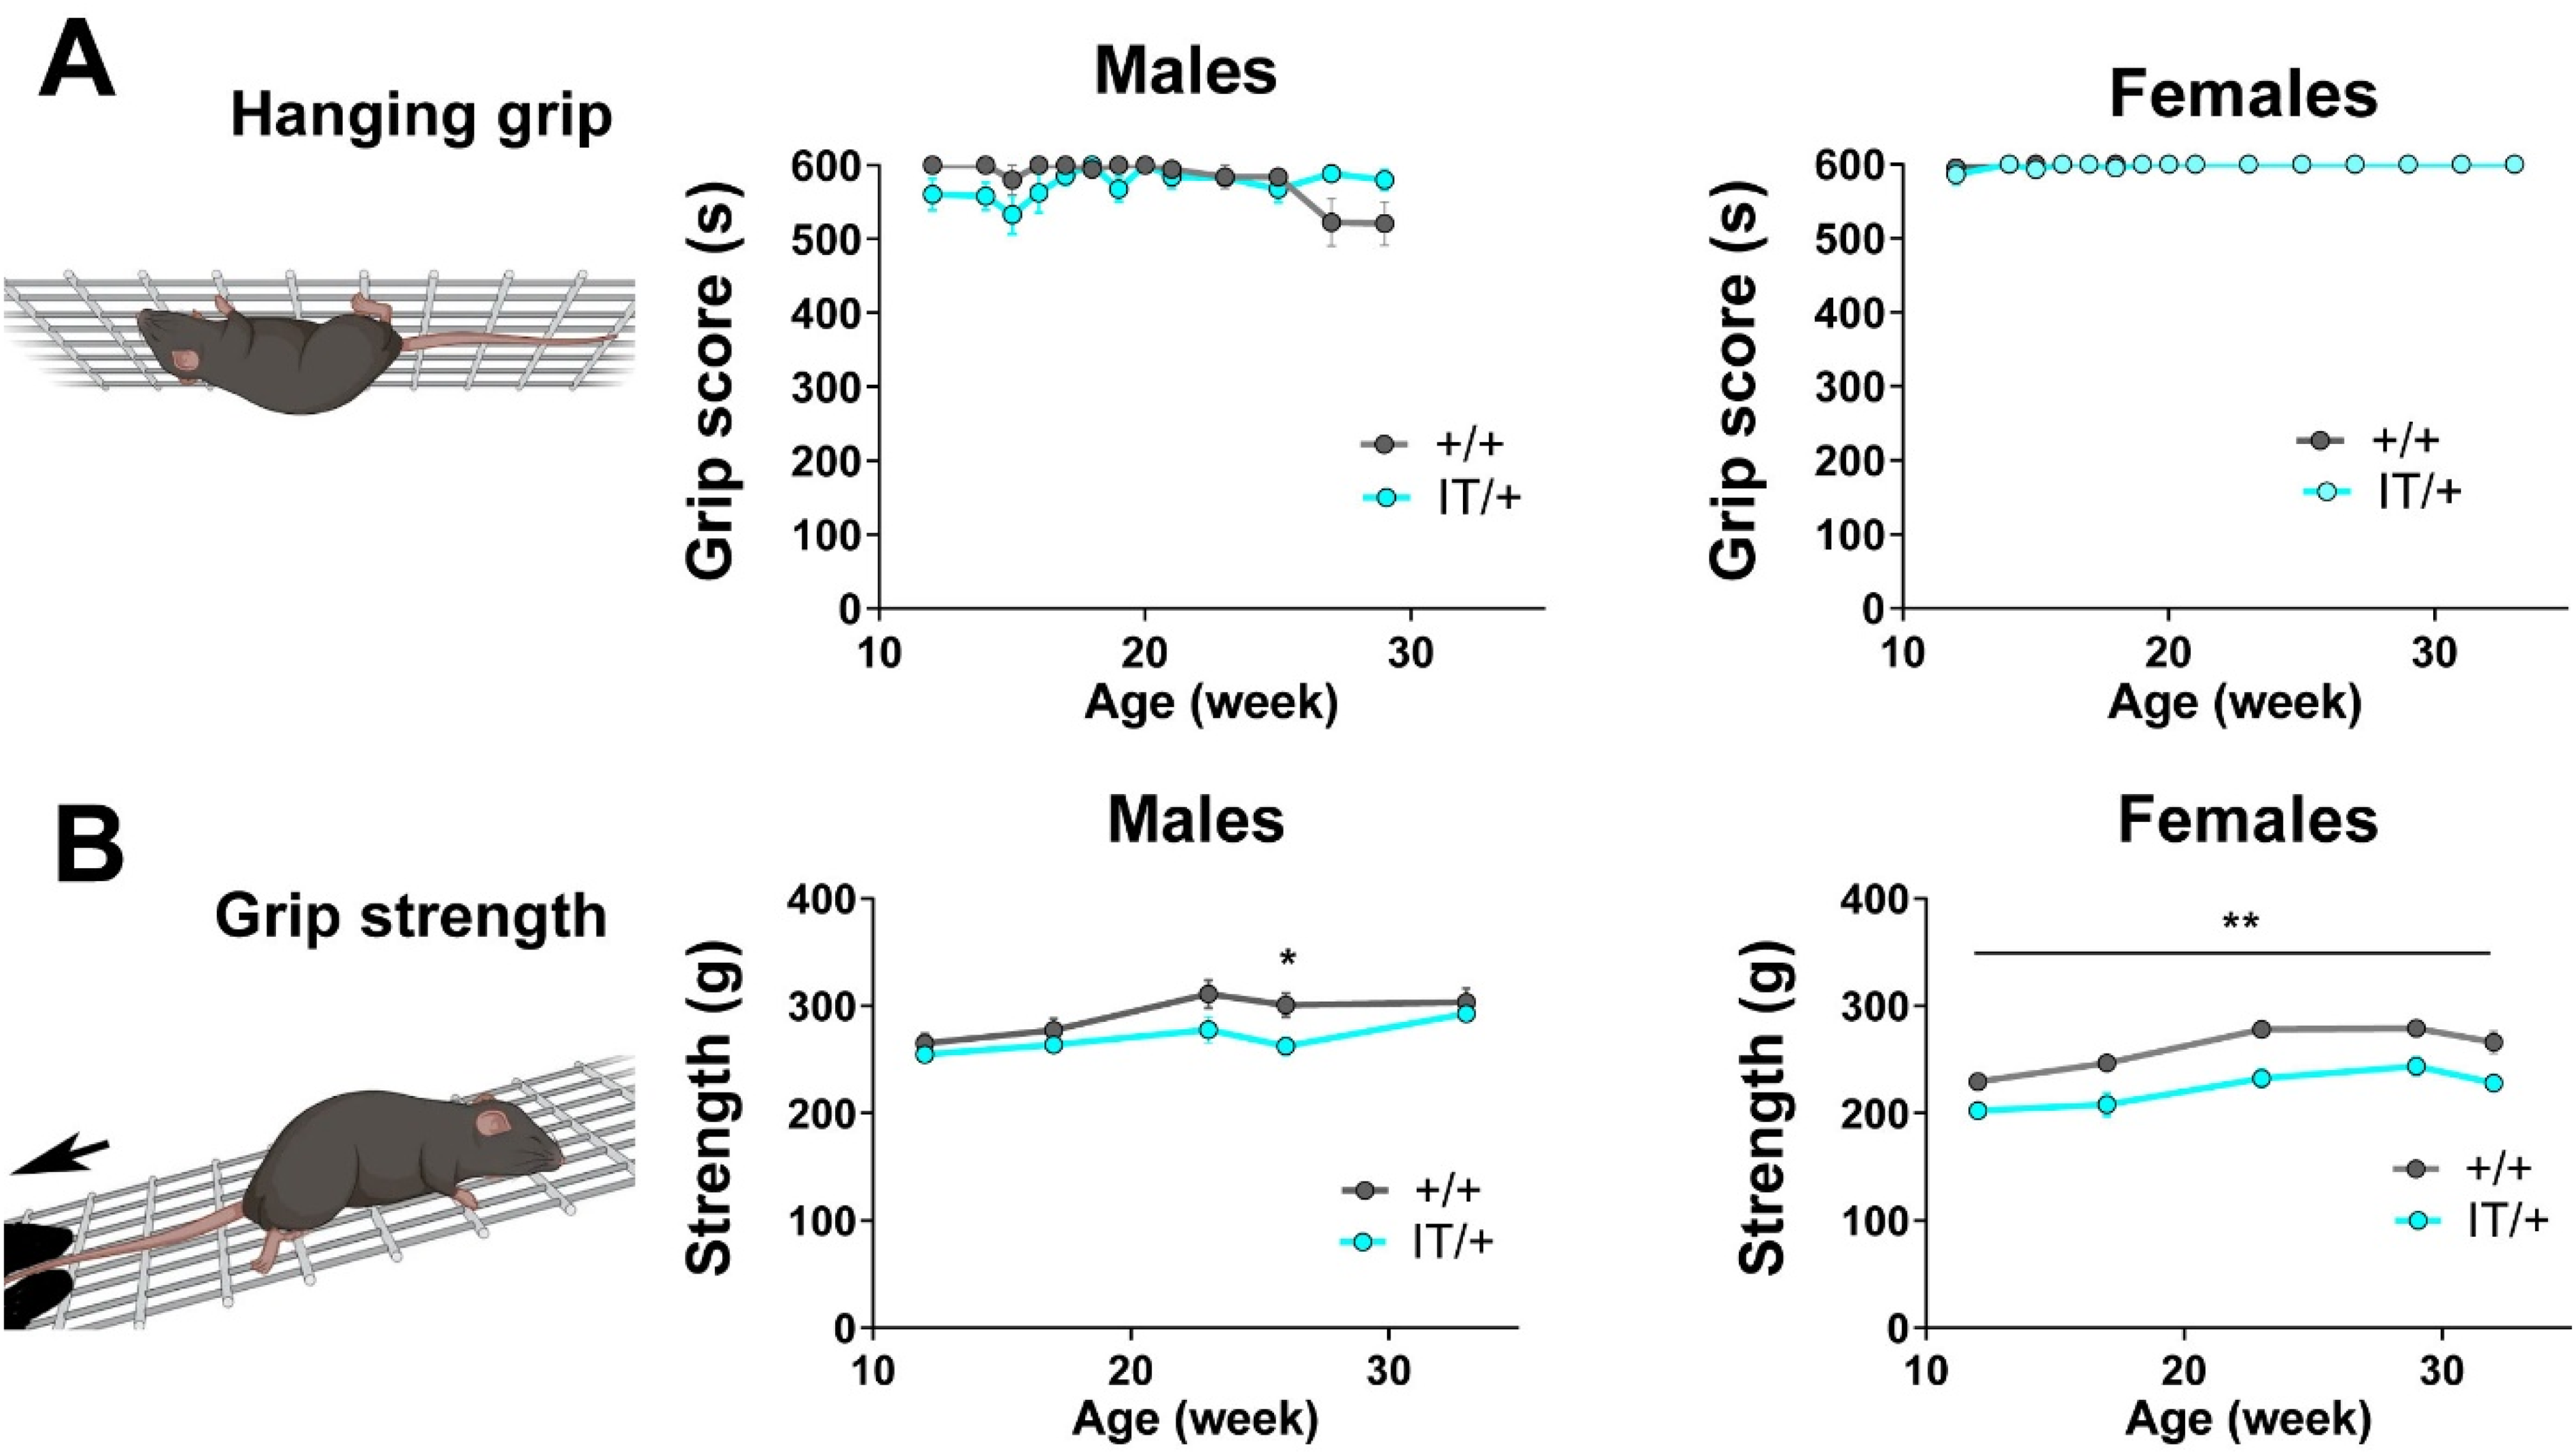
In vivo force measurement. Longitudinal follow up of muscle strength in vivo, performed on males (15 +/+ and 17 IT/+) and females (15 +/+ and 13 IT/+). (A) Hanging grip test was performed every week during 17 weeks. Time to fall was recorded, for a maximal time of 600 s. Statistical analysis: t-test on the mean at each time with Holm-Sidack correct for multiple comparison of IT/+ vs +/+. Non significant difference. (B) The grip strength of the front pads was measured every month during 5 months. Statistical analysis: Mann Whitney t test for each time, IT/+ vs +/+. Non significant difference for males at 12, 17, 24 and 31 weeks, at 27 weeks p = 0,0135. Significant difference for female at 12 weeks p = 0,0081, at 17 weeks p = 0,0012, at 24 weeks p = 0,0020, at 26 weeks p = 0,0066, at 30 weeks p = 0,0011; * p < 0.05, **p < 0.01.
These findings are inconsistent with another study on dissociated FDB fibers from IT/+ mice, exhibiting a significantly reduced maximum rate of SR Ca2+ release in response to electrical stimulation and exposure to 500 µM 4CmC, as compared to the +/+ littermates. 18
In vivo muscle strength in IT/+ mice
We next compared the in vivo muscle strength using both hanging grip test (every week or every other week, using the four pads) and grip strength measurement (every month, with the forelimbs) during 17 weeks over a 4 months period, on males (15 +/+ and 17 IT/+) and females (15 +/+ and 13 IT/+), between 3 months of age and 8 months of age (Figure 6). No difference was observed between +/+ and IT/+ in the male or in the female group with the hanging grip test (Figure 6(A)), and a small significant reduction in grip strength was observed in the females IT/+ compared to +/+ at all ages (Figure 6(B)). This modest reduction contrasts with the severe myopathic phenotype reported by Zvaritch et al. 19
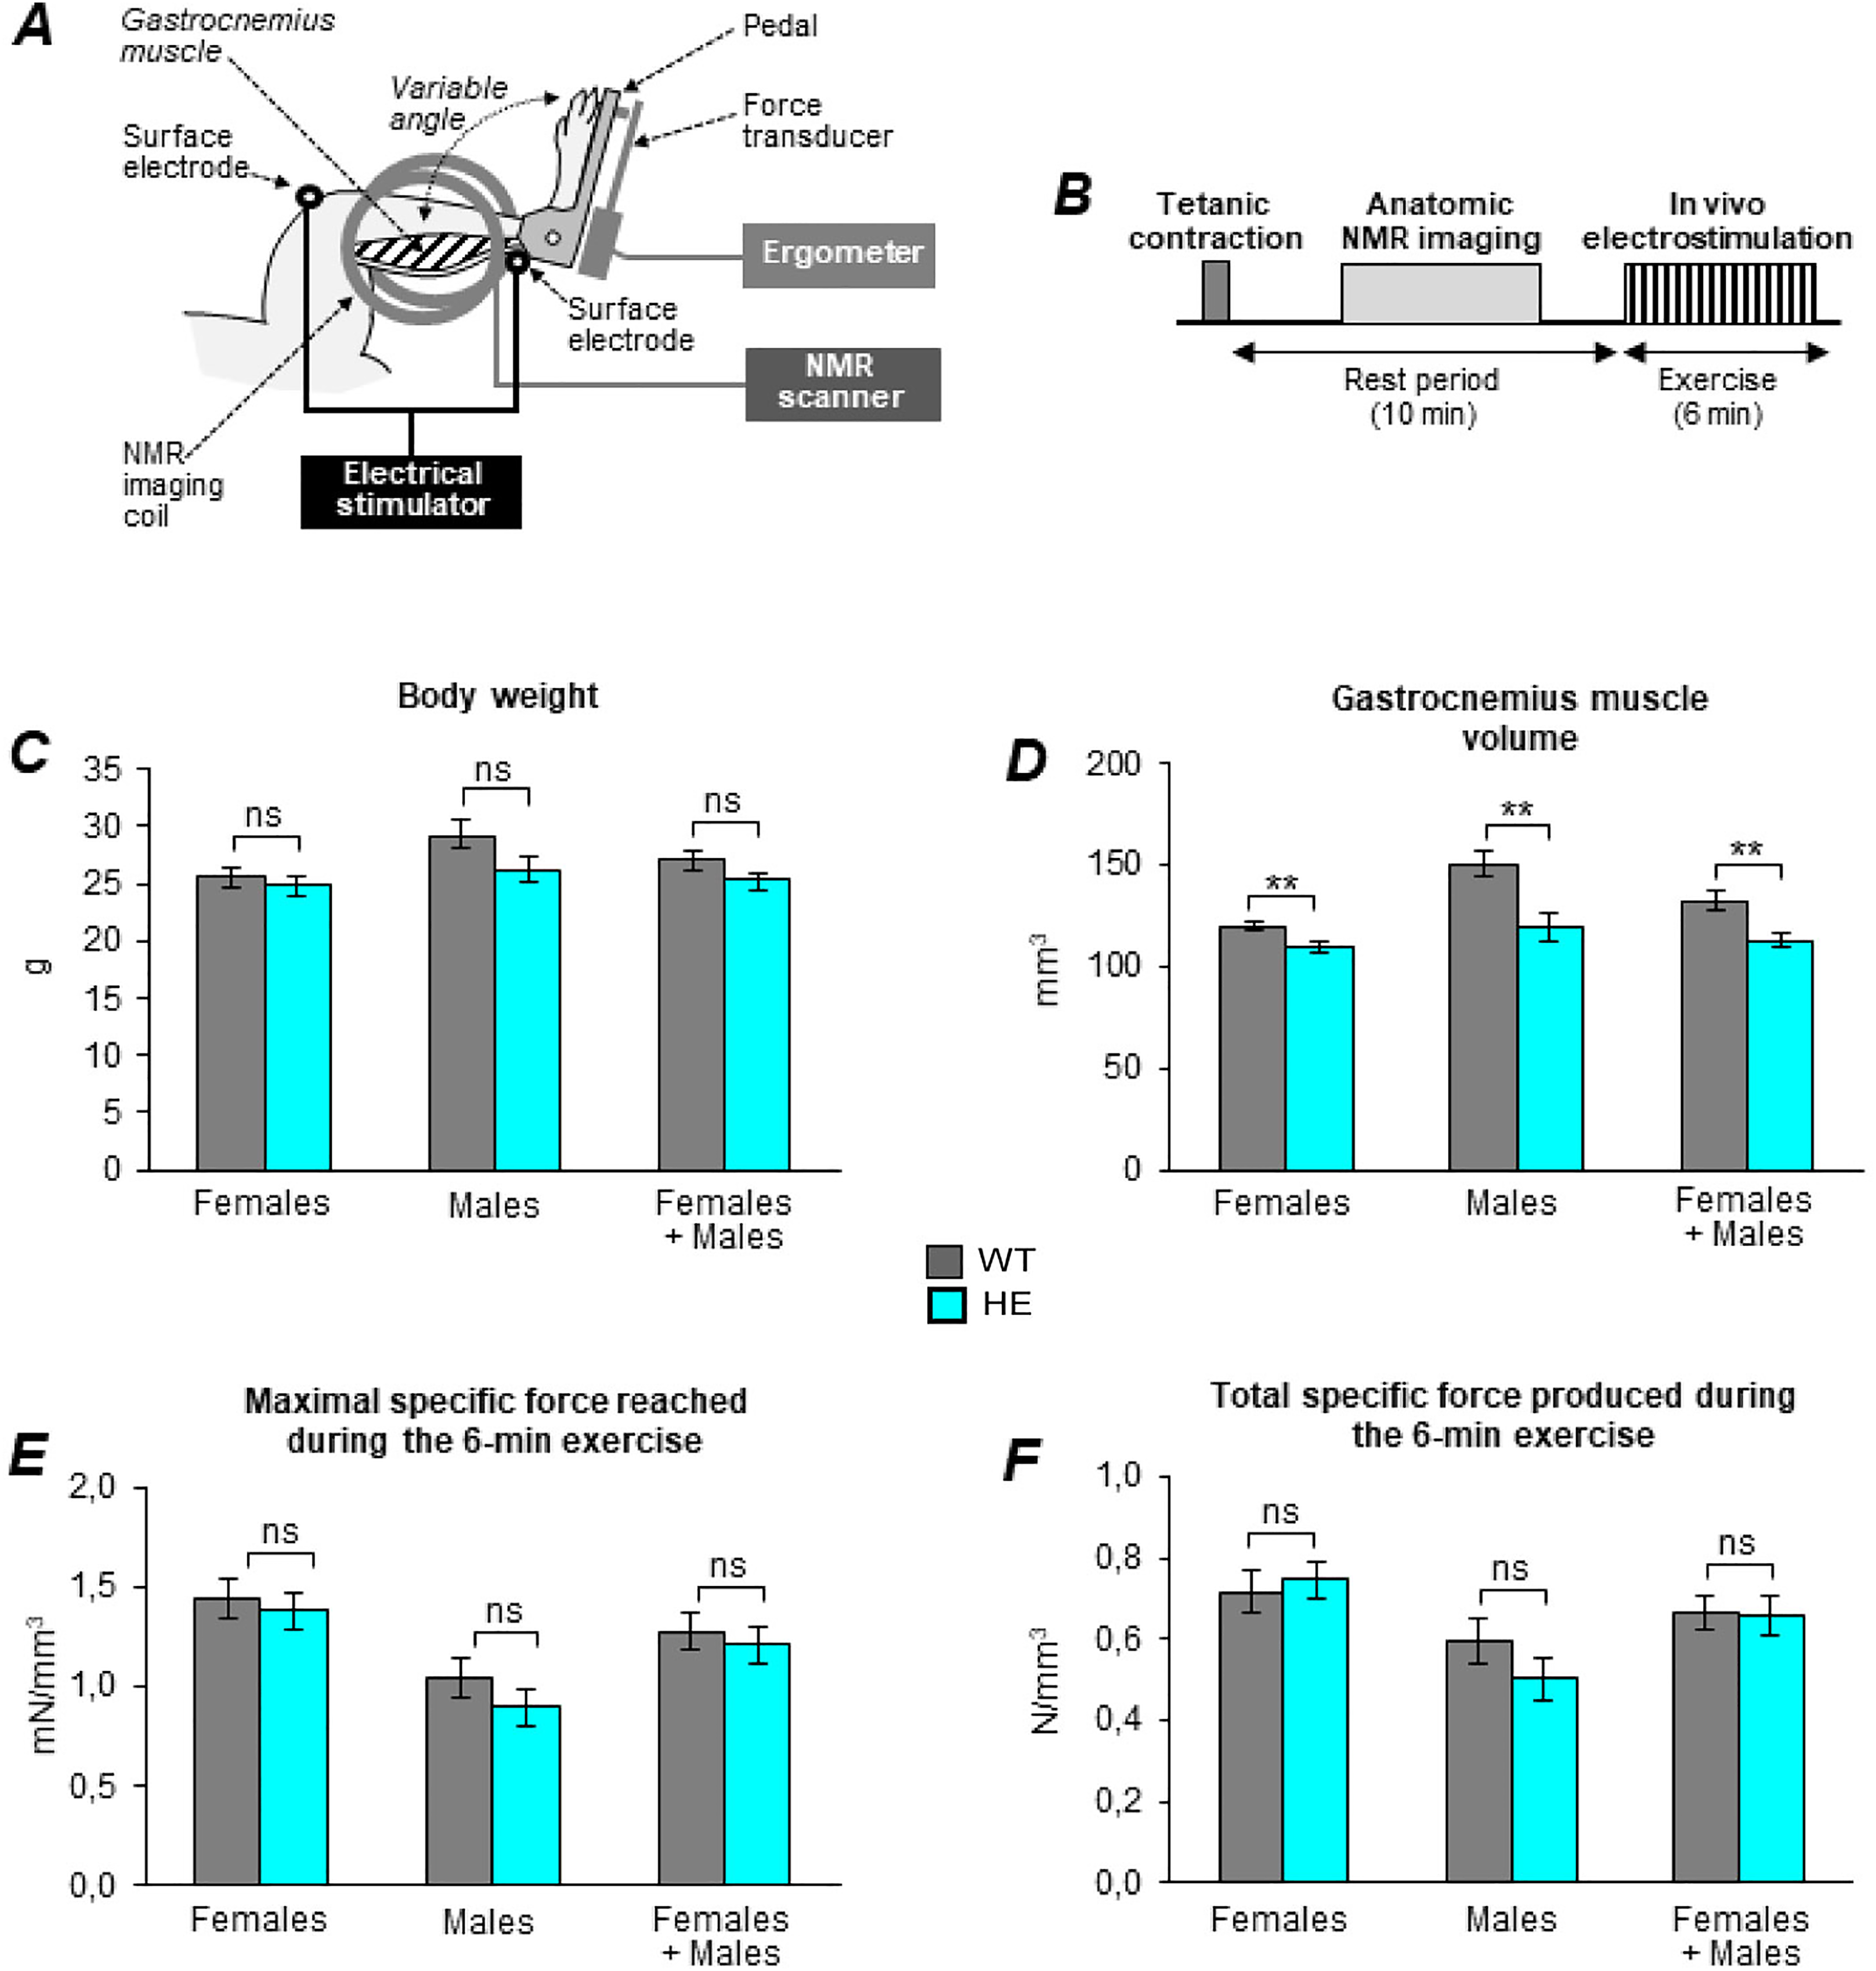
Noninvasive investigation of muscle function. Gastrocnemius muscle anatomy and mechanical performance were investigated noninvasively on +/+ and IT/+ males and females of 10–11 months of age (males 5 +/+ and 5 IT/+, females 7 +/+ and 9 IT/+). (A) Schematic representation of the setup. (B) Experimental protocol. (C) Body weight of females and males. Statistical analysis with unpaired two-tailed student's t-test IT/+ versus +/+: No significant difference between the two genotypes. (D) Gastrocnemius muscle volume measured from NMR images. Statistical analysis with unpaired two-tailed student's t-tests IT/+ versus +/+: females p = 0.007; males p = 0.006; both sexes p = 0.002. (E) Maximal specific force reached during the 6-min exercise. Statistical analysis with appropriate parametric (Student's t-test) or nonparametric (Mann–Whitney t test) unpaired two-tailed tests for IT/+ versus +/+: no significant difference was observed between both genotypes. (F) Total specific force produced during the 6-min exercise. Statistical analysis with appropriate parametric (Student's t-test) or nonparametric (Mann–Whitney t test) unpaired two-tailed tests for IT/+ versus +/+: No significant difference was observed between both genotypes. All data are shown as mean ± SEM.
Characterization of muscle function by electrostimulation coupled to functional NMR
A more direct characterization of muscle function was carried out to conclude on the presence or absence of muscle weakness in this mouse line. In order to study the intrinsic muscle strength, muscle function was studied noninvasively in 10–11 months males (5 +/+ and 5 IT/+) and females (7 +/+ and 9 IT/+) using electrostimulation coupled to force recording and NMR imaging (Figure 7(A) and (B)) on anesthetized animals, as described before.11,23 No difference in body weight was observed between the +/+ (WT) and the IT/+ animals in the male or female group (Figure 7(C)). A small reduction in gastrocnemius volume, determined by NMR imaging, was observed in IT/+ compared to +/+, both in males and females (Figure 7(D)). During the 6 min electrostimulation-driven fatiguing bout of exercise, no difference in the maximal specific force (Figure 7(E)) or the total specific force production (Figure 7(F)) was observed between +/+ and IT/+ males or females.
Spontaneous and stimulated muscle activity
To extend the evaluation of muscle performance to the whole-animal level, both spontaneous activity at rest and performance during a strenuous exercise were assessed. These tests were performed at respectively 8 and 9 months of age on the same group of males (15 +/+ and 16 IT/+) and females (15 +/+ and 13 IT/+) used for the grip and hanging grip tests. Spontaneous activity of the animals was recorded during 12 h at night with an infrared camera, and the distance travelled in their home cage estimated from movies recorded for each animal. This distance should be influenced by both muscle weakness/fatigue and by potential pain restraining the spontaneous mobility, as muscle pain has been frequently associated with some RYR1 mutation in human.32,33 No statistically significant difference was observed in the total distance or in the distance travelled per hour between +/+ and IT/+ animals, either in the male or in the female groups (Figure 8(A)). The ability of the animals to perform a strenuous exercise was further assessed using a running protocol on an uphill treadmill (Figure 8(B)). No significant difference was observed between +/+ and IT/+ animals, in the male and in the female groups, in the travelled distance and in the duration of the running exercise.
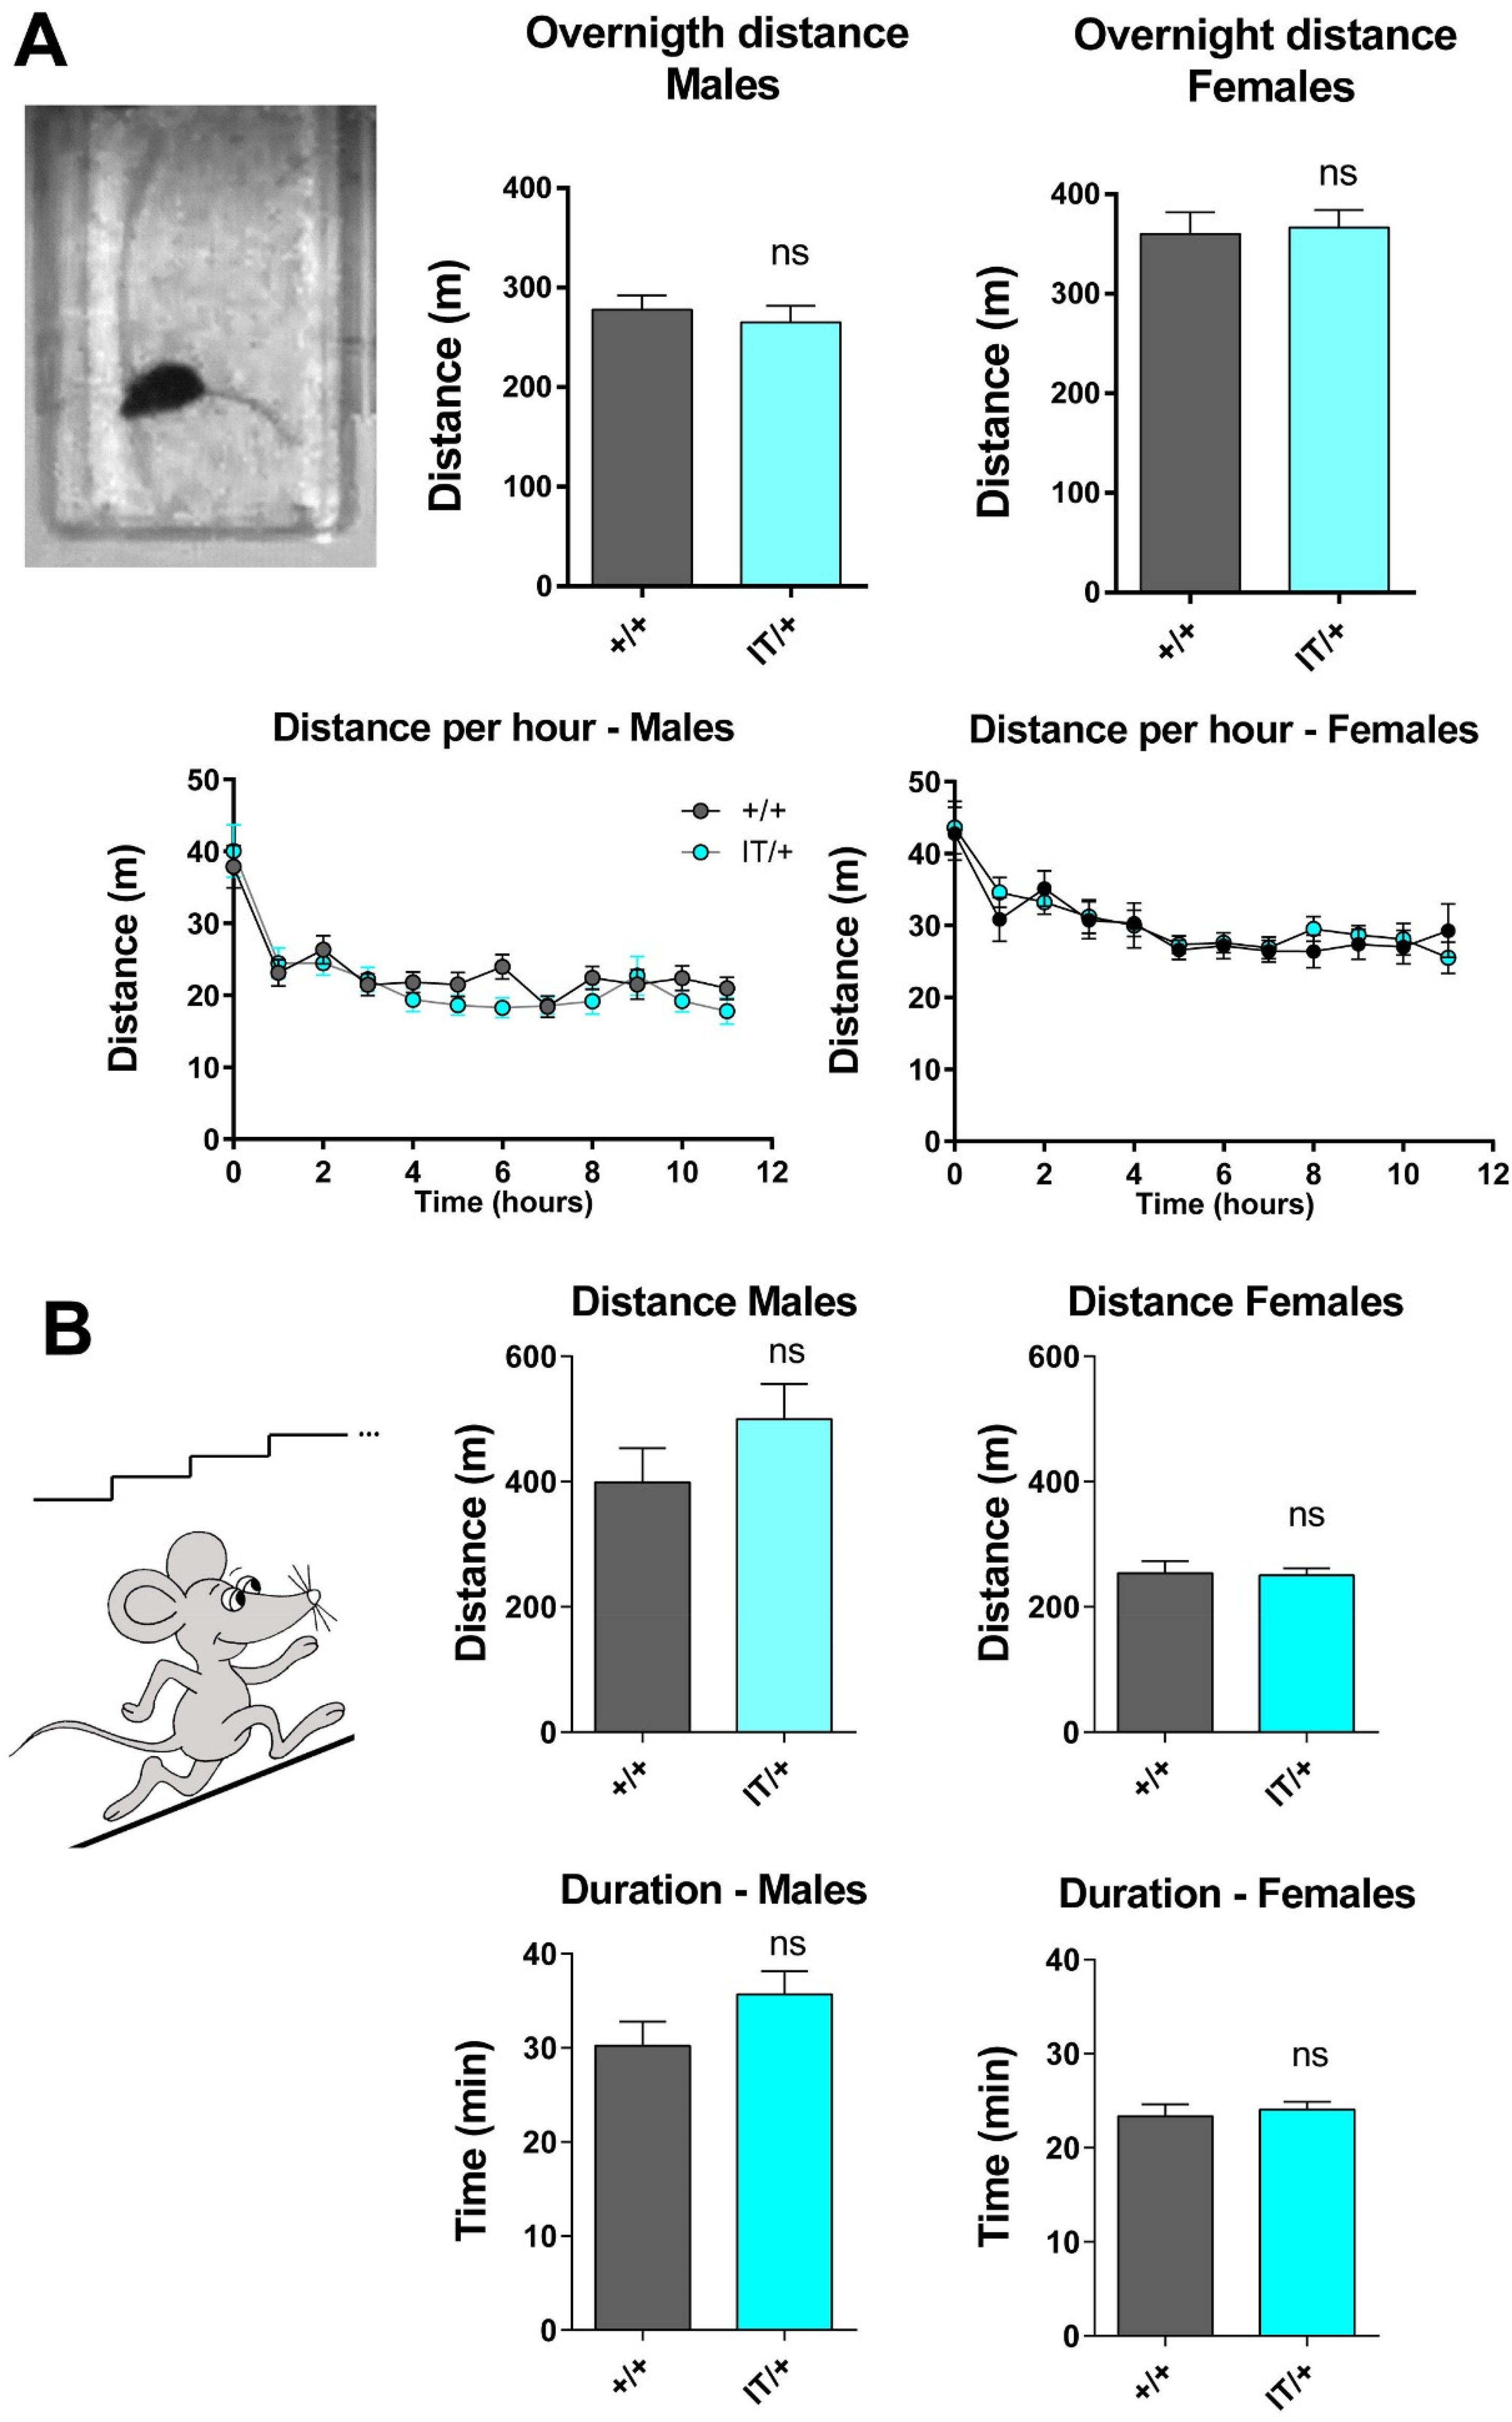
Spontaneous and stimulated exercise. (A) The spontaneous activity of the animals was evaluated from overnight recording of the movement of each mouse in its cage. The total distance and the distance travel each hour was calculated from the movie recorded for each animal. Eight months old males (15+/+ and 16 IT/+) and females (15 +/+ and 13 IT/+) were tested. Statistical analysis: Mann Whitney t test IT/+ vs +/+ in each group, male or female; ns: non significant difference. (B) The same animals were used for a strenuous uphill running test at 9 months of age. The total distance and the running time have been recorded for each animal. Statistical analysis: Mann Whitney; ns: non significant difference IT/+ vs +/+ in each group, male or female.
Discussion
We anticipated the RyR1-I4895T mouse to be a powerful model for preclinical studies. To this aim, we imported it from the Jackson Laboratory. The animals used in this study were littermate produced from the mating of heterozygotes and WT animals. We first performed the characterization of the animals at the molecular level. We confirmed that the mutation RyR1-I4895T was present at the DNA level and that the mutant allele was expressed at the same level in heterozygous animals as the WT allele. As described previously, we confirmed that homozygous animals with the mutation (IT/IT) were not viable.
We produced primary cultures from neonatal muscles and studied calcium release induced by direct 4-CmC RyR1 stimulation or by KCl-induced membrane depolarization. As described previously, we observed that direct stimulation of RyR1 by its agonist 4-CmC resulted in a reduction in calcium release most probably correlated to the amount of mutant RyR1, as heterozygous myotubes had a reduced calcium release compared to +/+, and calcium release was completely abolished in homozygous IT/IT myotubes. These experiments reflect the direct RyR1 dysfunction induced by the mutation, observed with a maximal stimulation of RyR1. In addition, the reduction in 4-CmC induced calcium release observed in IT/+ myotubes confirms the expression of the mutant allele, because if not expressed, the IT/+ myotubes would behave as heterozygous RyR1 KO myotubes (RyR1-/+) and would not present any alteration in 4-CmC induced calcium release. 34 But in contrast to previous results, membrane depolarization-induced calcium release was not different between +/+ and heterozygous IT/+ myotubes, and the small KCl-induced calcium release observed in homozygous IT/IT was probably due to extracellular Ca2+ influx via other channels (such as the dihydropyridine receptor) and not to intracellular Ca2+ release. This compensatory mechanism could be mouse specific or exacerbated in mouse and not present in human, which could explain the discrepancy between our results and the previous ones, especially when comparing mouse and human cells with the same mutation. The contribution of this compensatory influx may explain the lack of muscle weakness in IT/+ animals. The lack of difference in calcium release between IT/+ and +/+ observed in myotubes with this KCl stimulation is consistent with the absence of muscle weakness in IT/+ compared to +/+.
One unsolved question is why only the 4-CmC stimulation and not the KCl stimulation allowed us to evidence the dysfunction of the mutant RyR1. KCl application resulted in a submaximal RyR1 stimulation, not able to activate the entire pool of RyR1 channels as only half of the RyR1 tetramers are coupled to DHPR. 35 This could explain the discrepancy between 4-CmC- and KCl-stimulated calcium release, in the hypothesis that an IT monomer limits the capacity of RyR1 tetramers to couple with DHPRs so that only full WT tetramers engage in the coupling. Although this cannot be excluded, there is no data from the literature to substantiate this option, as the most widely admitted consequence of the mutation is a reduction of the channel conductance. 18 Another hypothesis would be to consider that the mode of activation of the RyR1 channel makes a difference with respect to the functional outcome of the mutation: agonist (like CmC) and DHPRs may be unequal in their capacity to open RyR1 channels containing IT monomers, with DHPRs being more efficient. The CmC binding site was localized in the C-terminal part of RyR1, at position 4020-4021 of RyR1. 36 One may speculate that the IT substitution at position 4895 changing the local structure somewhat limits the ability of CmC to bind and activate RyR1 channels containing IT monomers, or RyR1s containing a given ratio of IT/WT monomers. Along this line, it was shown that a RyR2 variant responsible for catecholaminergic polymorphic ventricular tachycardia was associated with loss of caffeine-triggered Ca2 + release. 37 A similar effect may occur for CmC activation of I4895T channels.
Electrophysiological analysis of isolated muscle fibers was performed, with evaluation of voltage-clamp-activated SR Ca2+ release to quantify the physiological function of RyR1 channels. This strategy was used by Loy et al. 18 who performed experiments on IT/+ fibers from 4–6-month-old mice under two conditions: i)- minimum disturbance of the intracellular medium by using a membrane-permeant Ca2+ dye and ii)- intracellular dialysis with a high-EGTA Ca2+ dye-containing solution, thus similar to the conditions we used here. In the two sets of experiments, the peak amplitude of the fluorescence transients was depressed in IT/+ fibers (by 22% and 36% in non-dialyzed and dialyzed conditions, respectively) and the peak of Ca2+ release flux calculated from the data collected in the presence of EGTA was decreased by ∼40% in the IT/+ fibers. This is seriously contrasting with the results we report here: we failed to detect any difference between +/+ and IT/+ fibers with respect to the peak amplitude of Ca2+ release flux and total amount of released Ca2+. We also found no change in the CaV1.1 Ca2+ channel activity (agreeing with Loy et al. 18 ) nor in its voltage-sensing properties. In our conditions, there is thus no sign of EC coupling alteration. The difference in the age of the mice between the two studies (4–6 months for Loy et al. versus ∼11 months in our case) may be speculated to play a role, assuming that the disease phenotype would alleviate with time. However, this would be in contrast with data from Boncompagni et al., 20 who reported a further reduction in the peak amplitude of electrically-evoked Ca2+ transients in fibers from 18-month as compared to 4–6-month-old animals. It would also be inconsistent with the fact that we found no indication of weakness in younger mice in the present study (Figure 6) and actually Ca2+ release measurements were performed in older animals because we were hoping that the phenotype would become more obvious with age. Therefore, in line with the similar membrane depolarization-induced Ca2+ release in +/+ and IT/+ cultured-myotubes, we overall observed no difference in electrically stimulated isolated muscle fibers from +/+ and IT/+ animals, neither on amplitude of membrane depolarization-induced calcium transient, nor on the voltage dependency of calcium release.
Muscle strength of the animals was further tested by different assays, evaluating muscle strength either at rest (hanging grip), or under spontaneous or stimulated exercise (grip strength, electrostimulation, running treadmill). No difference was observed between +/+ and IT/+ littermates, either males or females. Considering that muscle pain could be a consequence of RyR1 mutation, as reported by patients,32,33 the spontaneous activity of the animal was explored using openfield, and again no difference was observed between +/+ and IT/+ littermates (either males or females). Overall, more than 125 IT/+ animals were produced and housed for more than 6 months, without any visible difference in their gait compared to their +/+ littermate.
The alteration in the RyR1 calcium channel function was clearly observed at cellular level using direct RyR1 stimulation, but it had no consequence (or a very mild consequence with some tests) on muscle performance, either on isolated muscle or on whole animal physiology/behaviour. Therefore, all our results point to the same conclusion: absence of difference in depolarization-induced calcium release between +/+ and IT/+ in cultured myotubes, in isolated muscle fibers or in whole animals performing stimulated or spontaneous movement. Only the non-physiological strong 4-CmC stimulation allowed to visualize an undoubtable abnormal behaviour of the mutant channel, and to a lesser extent the grip strength measurement and the evaluation of gastrocnemius volume.
One important point is to identify possible explanations for the different phenotypes observed in the different models with this mutation. In human, the I4898T mutation was initially described associated with a severe and highly penetrant form of central core disease, 4 sometimes lethal, 15 and further identified as one of the most frequent mutation, with great heterogeneity in the severity between patients. The severity observed in human contrasts with the mild phenotype observed in the different mouse models further developed on different background (SV129 16 and C57Bl6 21 ) which, besides the first characterization,16,19 all converge toward a mild phenotype with occasional severely affected animals. The simplest explanation for the discrepancy between the mouse models would be a progressive down regulation of the mutant allele, leaving the WT allele in hemizygous situation, which has no effect at the heterozygous state and is lethal at homozygous state 34 as observed in heterozygous animals of the RYR1-knock out mouse line. Nevertheless, all our experiments argue against this hypothesis, as we have observed that the WT and the IT allele are expressed in equivalent amounts, and in cultured cells a clear modification of 4-CmC calcium release was observed in IT/+ myotubes, unlike RyR1-/+ myotubes. 34 Therefore, the only logical explanation for the discrepancy between the severe phenotype initially observed in the IT/+ mouse model, and the subsequent mild phenotype observed in the same model or similar model on another background, is the refinement in the animal housing and in the physiological testing of the animals. Along this line, the IT mutation on C57Bl6 background has been associated with body weight reduction on normal chow diet, but to increased body weight compared to control on high fat diet. 21 Body weight could contribute to muscle performance, and we have measured a small reduction in muscle volume in IT/+ animals. Some unknown elements in the genetic background could play an important role, both in mouse and in human, to explain the difference in the severity between individuals with the mutation, for example related to the metabolism or the vascularization, which would require an in-depth comparison of mildly and severely affected individuals.
With respect to our initial objective of therapeutic development with this mouse model, without any clear and reproducible readout of muscle weakness, we recommend to avoid using this animal model for preclinical screening of treatment for RyR1-related myopathy.
Supplemental Material
sj-docx-1-jnd-10.1177_22143602251339354 - Supplemental material for Limited pre-clinical relevance of the heterozygous RYR1-I4895T/+ mouse model due to its mild phenotype
Supplemental material, sj-docx-1-jnd-10.1177_22143602251339354 for Limited pre-clinical relevance of the heterozygous RYR1-I4895T/+ mouse model due to its mild phenotype by Margaux Melka, Ludivine Rotard, Caroline Benstaali, Julie Brocard, Benoit Giannesini, Fanny Jouve, Laurent Pelletier, Julien Fauré, John Rendu, Vincent Jacquemond and Isabelle Marty in Journal of Neuromuscular Diseases
Footnotes
Acknowledgments
The authors thank Dr R. Reynaud Dulaurier for his expert help with RT-qPCR.
Funding
The author(s) disclosed receipt of the following financial support for the research, authorship, and/or publication of this article: This work was supported by grants from Association Française contre les Myopathies (AFM-Telethon), from France Life Imaging (grant ANR-11-INBS-0006), and from Region Sud.
Data availability
The data supporting the findings of this study are available within the article and/or its supplementary material.
Declaration of conflicting interests
The authors declared no potential conflicts of interest with respect to the research, authorship, and/or publication of this article.
Supplemental material
Supplemental material for this article is available online.
Notes
References
Supplementary Material
Please find the following supplemental material available below.
For Open Access articles published under a Creative Commons License, all supplemental material carries the same license as the article it is associated with.
For non-Open Access articles published, all supplemental material carries a non-exclusive license, and permission requests for re-use of supplemental material or any part of supplemental material shall be sent directly to the copyright owner as specified in the copyright notice associated with the article.