
Abstract
Duchenne muscular dystrophy (DMD) is a rare X-linked genetic muscle disorder affecting primarily pediatric males and leading to limited life expectancy. This systematic review of 85 DMD trials and non-interventional studies (2010–2022) evaluated how magnetic resonance imaging biomarkers—particularly fat fraction and T2 relaxation time—are currently being used to quantitatively track disease progression and how their use compares to traditional mobility-based functional endpoints. Imaging biomarker studies lasted on average 4.50 years, approximately 11 months longer than those using only ambulatory functional endpoints. While 93% of biologic intervention trials (n = 28) included ambulatory functional endpoints, only 13.3% (n = 4) incorporated imaging biomarkers. Small molecule trials and natural history studies were the predominant contributors to imaging biomarker use, each comprising 30.4% of such studies. Small molecule trials used imaging biomarkers more frequently than biologic trials, likely because biologics often target dystrophin, an established surrogate biomarker, while small molecules lack regulatory-approved biomarkers. Notably, following the 2018 FDA guidance finalization, we observed a significant decrease in new trials using imaging biomarkers despite earlier regulatory encouragement. This analysis demonstrates that while imaging biomarkers are increasingly used in natural history studies, their integration into interventional trials remains limited. From XGBoost machine learning analysis, trial duration and start year were the strongest predictors of biomarker usage, with a decline observed following the 2018 FDA guidance. Despite their potential to objectively track disease progression, imaging biomarkers have not yet been widely adopted as primary endpoints in therapeutic trials, likely due to regulatory and logistical challenges. Future research should examine whether standardizing imaging protocols or integrating hybrid endpoint models could bridge the regulatory gap currently limiting biomarker adoption in therapeutic trials.
Keywords
Introduction
Duchenne muscular dystrophy (DMD) is a rare, X-linked recessive disease caused by a mutation in the dystrophin gene. This disease is mostly seen in pediatric males. Patients with DMD experience symptoms such as difficulty walking, poor balance, falling, respiratory difficulty, and cardiomyopathies. The prognosis for patients with DMD is poor, with loss of ambulation occurring around age 12 and average life expectancy in the late 20 s.1–5
Developing new DMD therapies through research presents several challenges due to the nature of this rare disease. Since DMD affects only 1 in 3500 male births worldwide and multiple therapeutic candidates must contend for this same patient group each year, recruitment for DMD trials is challenging. 6 This has brought into discussion many aspects of the trial process to find ways to make these rials more efficient, including the selection of endpoints. In line with the typical symptoms of DMD, the highest priority for researchers have been ambulation-related functional test outcomes because ambulatory compromise significantly impacts the quality of life and functional independence of patients. Maintaining ambulation has been shown to directly affect daily activities, social participation, and overall well-being. 7
In recent years, quantitative magnetic resonance imaging (MRI) and spectroscopy (MRS) biomarkers have been rising to prominence since their introduction in the early 2000s and 2010s. 8 These endpoints offer a compelling alternative or adjuvant to ambulatory functional endpoints and may enhance clinical trial efficiency; however, they are not inherently clinically applicable and as such have not been universally embraced. With both its proponents and detractors, imaging biomarkers for DMD have been a subject of curiosity over the past decade, yet since their inception, no resource yet exists to identify how these endpoints have been used in clinical trials so far.
Aim of systematic review and machine learning-driven trend analysis
This systematic review aimed to evaluate and identify the status of quantitative magnetic resonance imaging biomarker use versus ambulatory functional endpoints in DMD trials through a comprehensive overview. This includes examining how frequently these endpoints were used over time, and analyzing their usage based on intervention type and trial duration. To identify the patterns in DMD clinical trials regarding the utilization of ambulatory functional endpoints and imaging biomarkers, a supervised machine learning approach, Extreme Gradient Boosting (XGBoost), was employed to perform a 3-class classification to delineate the study trend based on the collected trial components, including intervention type, trial duration, and trial start date.
Functional tests and quantitative magnetic resonance imaging measures
In DMD clinical trials, ambulatory functional endpoints, such as 6-min walk distance (6MWD), NSAA score, time to stand, time to climb 4 stairs, and time to run/walk 10 meters, have been widely used to assess disease progression in individuals with DMD. Quantitative magnetic resonance imaging (MRI) and spectroscopy (MRS) biomarkers have been also collected. MRI transverse relaxation time constant (MRI-T2) measures the progressive replacement of skeletal muscle in the hips and legs by noncontractile tissue.1,9 Magnetic Resonance Spectroscopy (MRS) fat fraction measures the proportion of fat signal relative to total fat and water in skeletal muscle to assess disease-related fat replacement. 10 Both MRS-T2 and MRI fat fraction have been validated as measures that capture DMD progression and correlate strongly with mobility-related functional endpoints.11–14
Both ambulatory functional endpoints and imaging biomarkers have their pros and cons (Table 1). Ambulatory functional endpoints have been shown to be clinically meaningful in studying DMD. 15 The deterioration of functional capabilities in individuals with DMD is the predominant clinical manifestation seen and having ambulatory functional endpoints that can directly assess where a patient is at can give a snapshot of their disease progression. Functional tests and assessments have significant disadvantages, however, as they rely on participants’ current motivation and fatigue levels to complete these tests/assessments.1,2,8,16,17 Ambulatory functional endpoints also cannot be used in individuals with DMD who are non-ambulant due to disease progression,1,17 which precludes a meaningful portion of the DMD patient population from being evaluated in clinical trials.
Advantages and disadvantages of imaging biomarkers.
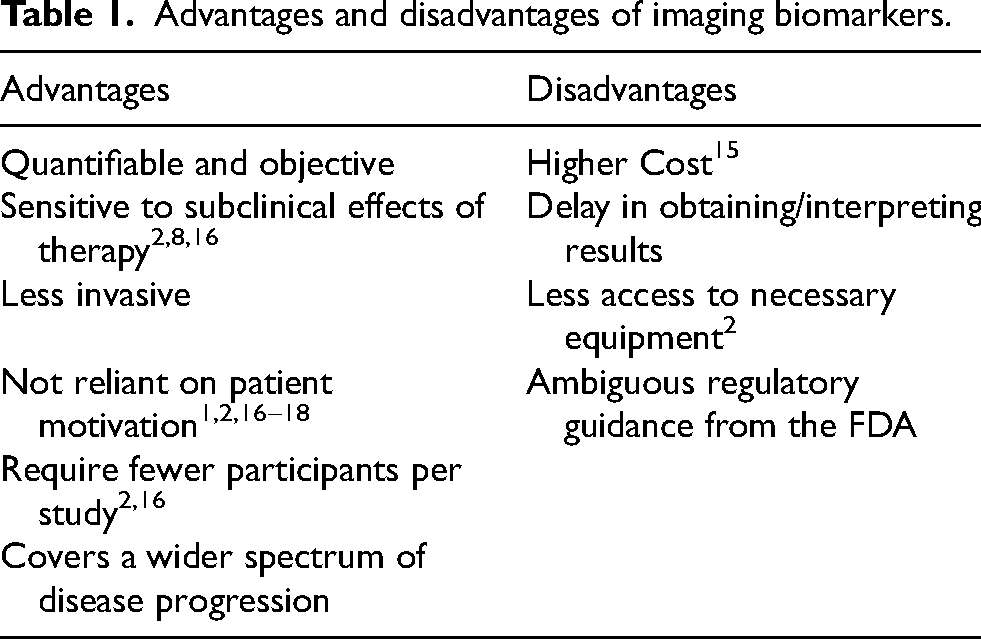
Studies that utilize imaging biomarkers, on the other hand, require fewer study subjects to find significant results compared to ambulatory functional endpoints.2,16 This is especially useful when dealing with a disease as rare as DMD. Researchers utilizing imaging biomarkers can also recruit ambulant and non-ambulant participants. As stated earlier, individuals with DMD have a very limited amount of time before they become non-ambulant, along with a short life expectancy. Imaging biomarkers may increase the use of this limited time since they can detect subclinical changes in a patient's muscle pathology before any obvious symptoms have manifested.2,16,18 The use of imaging biomarkers in clinical trials and studies has been limited so far, possibly due to the costs associated with administering the imaging tests and the extended amount of machine time per patient. 19 These imaging machines are also mostly limited to larger academic centers, further inhibiting widespread usage. 2
Spectrum of functional assessments in DMD
This analysis concentrated on comparing trends between ambulation-related functional endpoints—primarily the 6-Minute Walk Distance (6MWD), selected as the key inclusion criterion—and muscle-specific imaging biomarkers such as MRI T2 and fat fraction. The rationale for this focus was to directly compare a globally monitored, standardized functional test relevant to ambulation against imaging biomarkers that reflect underlying muscle pathology with potential impact on mobility.
While our search strategy focused on lower limb function via the 6MWD, we acknowledge the clinical significance of upper limb functional measures, particularly the Performance of Upper Limb (PUL) scale, in assessing disease progression across the full spectrum of DMD. The original PUL 1.2 scale was introduced in 2013 and saw gradual adoption throughout the mid-2010s.20–22 A refined version, PUL 2.0, emerged around 2020 and has since gained traction as a validated outcome measure, especially for non-ambulant patients.22,23 It has been incorporated as a primary endpoint in several recent clinical trials and is increasingly recognized in regulatory guidance as a meaningful measure of function beyond ambulation.
However, PUL was not included in our primary comparison for two reasons. First, our analysis specifically aimed to contrast trends between ambulation-related functional endpoints and imaging biomarkers throughout the 2010–2022 period. Second, because PUL 1.2 and 2.0 were introduced at different points during this timeframe, incorporating both versions would have introduced additional heterogeneity in endpoint classification. By centering our functional endpoint selection on the 6MWD—a consistently used, globally standardized measure across the full study period—we sought to provide a cleaner, more interpretable comparison of trends.
This approach improves the consistency of our comparisons but also represents a limitation. Our findings do not fully capture the usage trends of upper limb functional assessments like PUL, which are particularly relevant for non-ambulant populations and have seen increased application in recent years. Several ongoing trials are now incorporating both upper limb functional endpoints and imaging biomarkers, though published outcomes from these studies were not widely available at the time of our analysis. Future investigations should specifically evaluate how imaging biomarkers correlate with upper limb function and whether these relationships differ meaningfully from those observed with lower limb measures.
Terminology and definitions
For clarity in this analysis, we define key terms as follows:
Biomarker: A defined characteristic measured as an indicator of normal biological processes, pathogenic processes, or responses to an intervention. 24 In DMD, MRI/MRS measures including fat fraction and T2 relaxation time of lower body skeletal muscle serve as biomarkers of disease progression.
Clinical Endpoint: A characteristic or variable that measures how a patient feels, functions, or survives.24,25 In DMD, functional assessments like 6MWD directly measure patient function.
Surrogate Endpoint: A biomarker intended to substitute for a clinical endpoint that is reasonably likely to predict clinical benefits. 25 While MRI measures correlate with disease progression, they have not yet been qualified as surrogate endpoints for DMD by regulatory authorities.
Ambulatory Functional Endpoint: A clinical assessment that measures a patient's ability to perform movement-based tasks such as walking, standing, or climbing stairs. In DMD, commonly used ambulatory functional endpoints include the 6MWD, NSAA, and timed function tests, which directly reflect mobility status and disease progression. 15
FDA and policy-related
In 2015, the U.S. FDA issued two pivotal guidelines aimed at enhancing rare disease drug development efforts.26,27 The first, “Rare Diseases: Common Issues in Drug Development” (later renamed to “Rare Diseases: Considerations for the Development of Drugs and Biological Products”), addressed the overarching challenges associated with creating treatments for rare conditions. The second set of guidelines is a draft tailored specifically to DMD and related dystrophinopathies, directing the development of therapeutic products for these conditions. Central to both documents were the emphasis on the integration of biomarkers and surrogate endpoints in the drug development framework for DMD, signifying their critical role in this process.
The enactment of the twenty-first Century Cures Act in 2016 further underscored the importance of biomarkers in pharmaceutical research and development. This legislation mandated the FDA to establish clearer criteria for the qualification and utilization of biomarkers and surrogate endpoints across various diseases, including DMD. Aimed at expediting the delivery of medical innovations to patients, the Act encouraged sponsors to begin the development or refinement of evaluative tools at an early stage. This proactive approach is intended to ensure thorough testing and validation of these tools prior to their application as endpoints in clinical trials.
Current therapeutic options
Current therapeutic approaches for DMD can be categorized into three main groups: (1) symptomatic management therapies, (2) cardiac and respiratory support therapies, and (3) disease-modifying treatments targeting the underlying pathophysiology.
In the EPIDYS givinostat pivotal trial, MRI imaging biomarkers provided compelling supportive evidence of the drug's effect. While both treatment and placebo groups showed increases in vastus lateralis fat fraction over time, this increase was 30% lower in the treatment group—an outcome that paralleled improvements in ambulatory functional endpoints. 29
Methods
Data sources and search criteria
The data for this study were obtained from ClinicalTrials.gov on 12 May 2023, which is a comprehensive registry of clinical trials worldwide. ClinicalTrials.gov provides a valuable source of information on ongoing and completed clinical trials, including their objectives, design, and outcomes. It is maintained by the National Library of Medicine (NLM) and the National Institutes of Health (NIH) in the United States.
A systematic search was conducted on ClinicalTrials.gov to identify clinical trials related to DMD conducted between 2010 and 2022. To include all studies in the timeframe using imaging biomarker (T2 and fat fraction) and a key functional assessment (i.e., 6MWD), the following search query was used in the advanced search interface built into ClinicalTrials.gov:
Condition/Disease: “Duchenne Muscular Dystrophy”
Other terms: “T2 OR Fat Fraction OR 6MWT OR 6MWD OR 6 min walk test OR dystrophin expression”.
Data extraction and exclusion
Data extraction used a standardized export form directly from ClinicalTrials.gov. The following information was extracted from each included study: trial status, study design, intervention category (interventional or non-interventional), phase, primary intervention, primary endpoint(s), and secondary endpoint(s).
The search included observational studies, natural history studies, and experimental studies conducted on human participants. For the purposes of this research, natural history studies and observational studies were not stratified and were both classified as “non-interventional studies”. Trials that focused solely on Becker Muscular Dystrophy were excluded, as well as trials that investigated cardiac, pulmonary, or dystrophin imaging biomarkers without incorporating any ambulatory functional endpoints or MRI/MRS imaging biomarkers. Initially, the titles, abstracts, and primary outcomes listed on ClinicalTrials.gov of the identified studies were screened to determine their potential eligibility. Subsequently, the full texts of the potentially eligible studies were assessed for final inclusion based on the predefined inclusion and exclusion criteria (Figure 1). The final data set featuring the 85 trials used in our analysis is provided in Supplementary File 1.
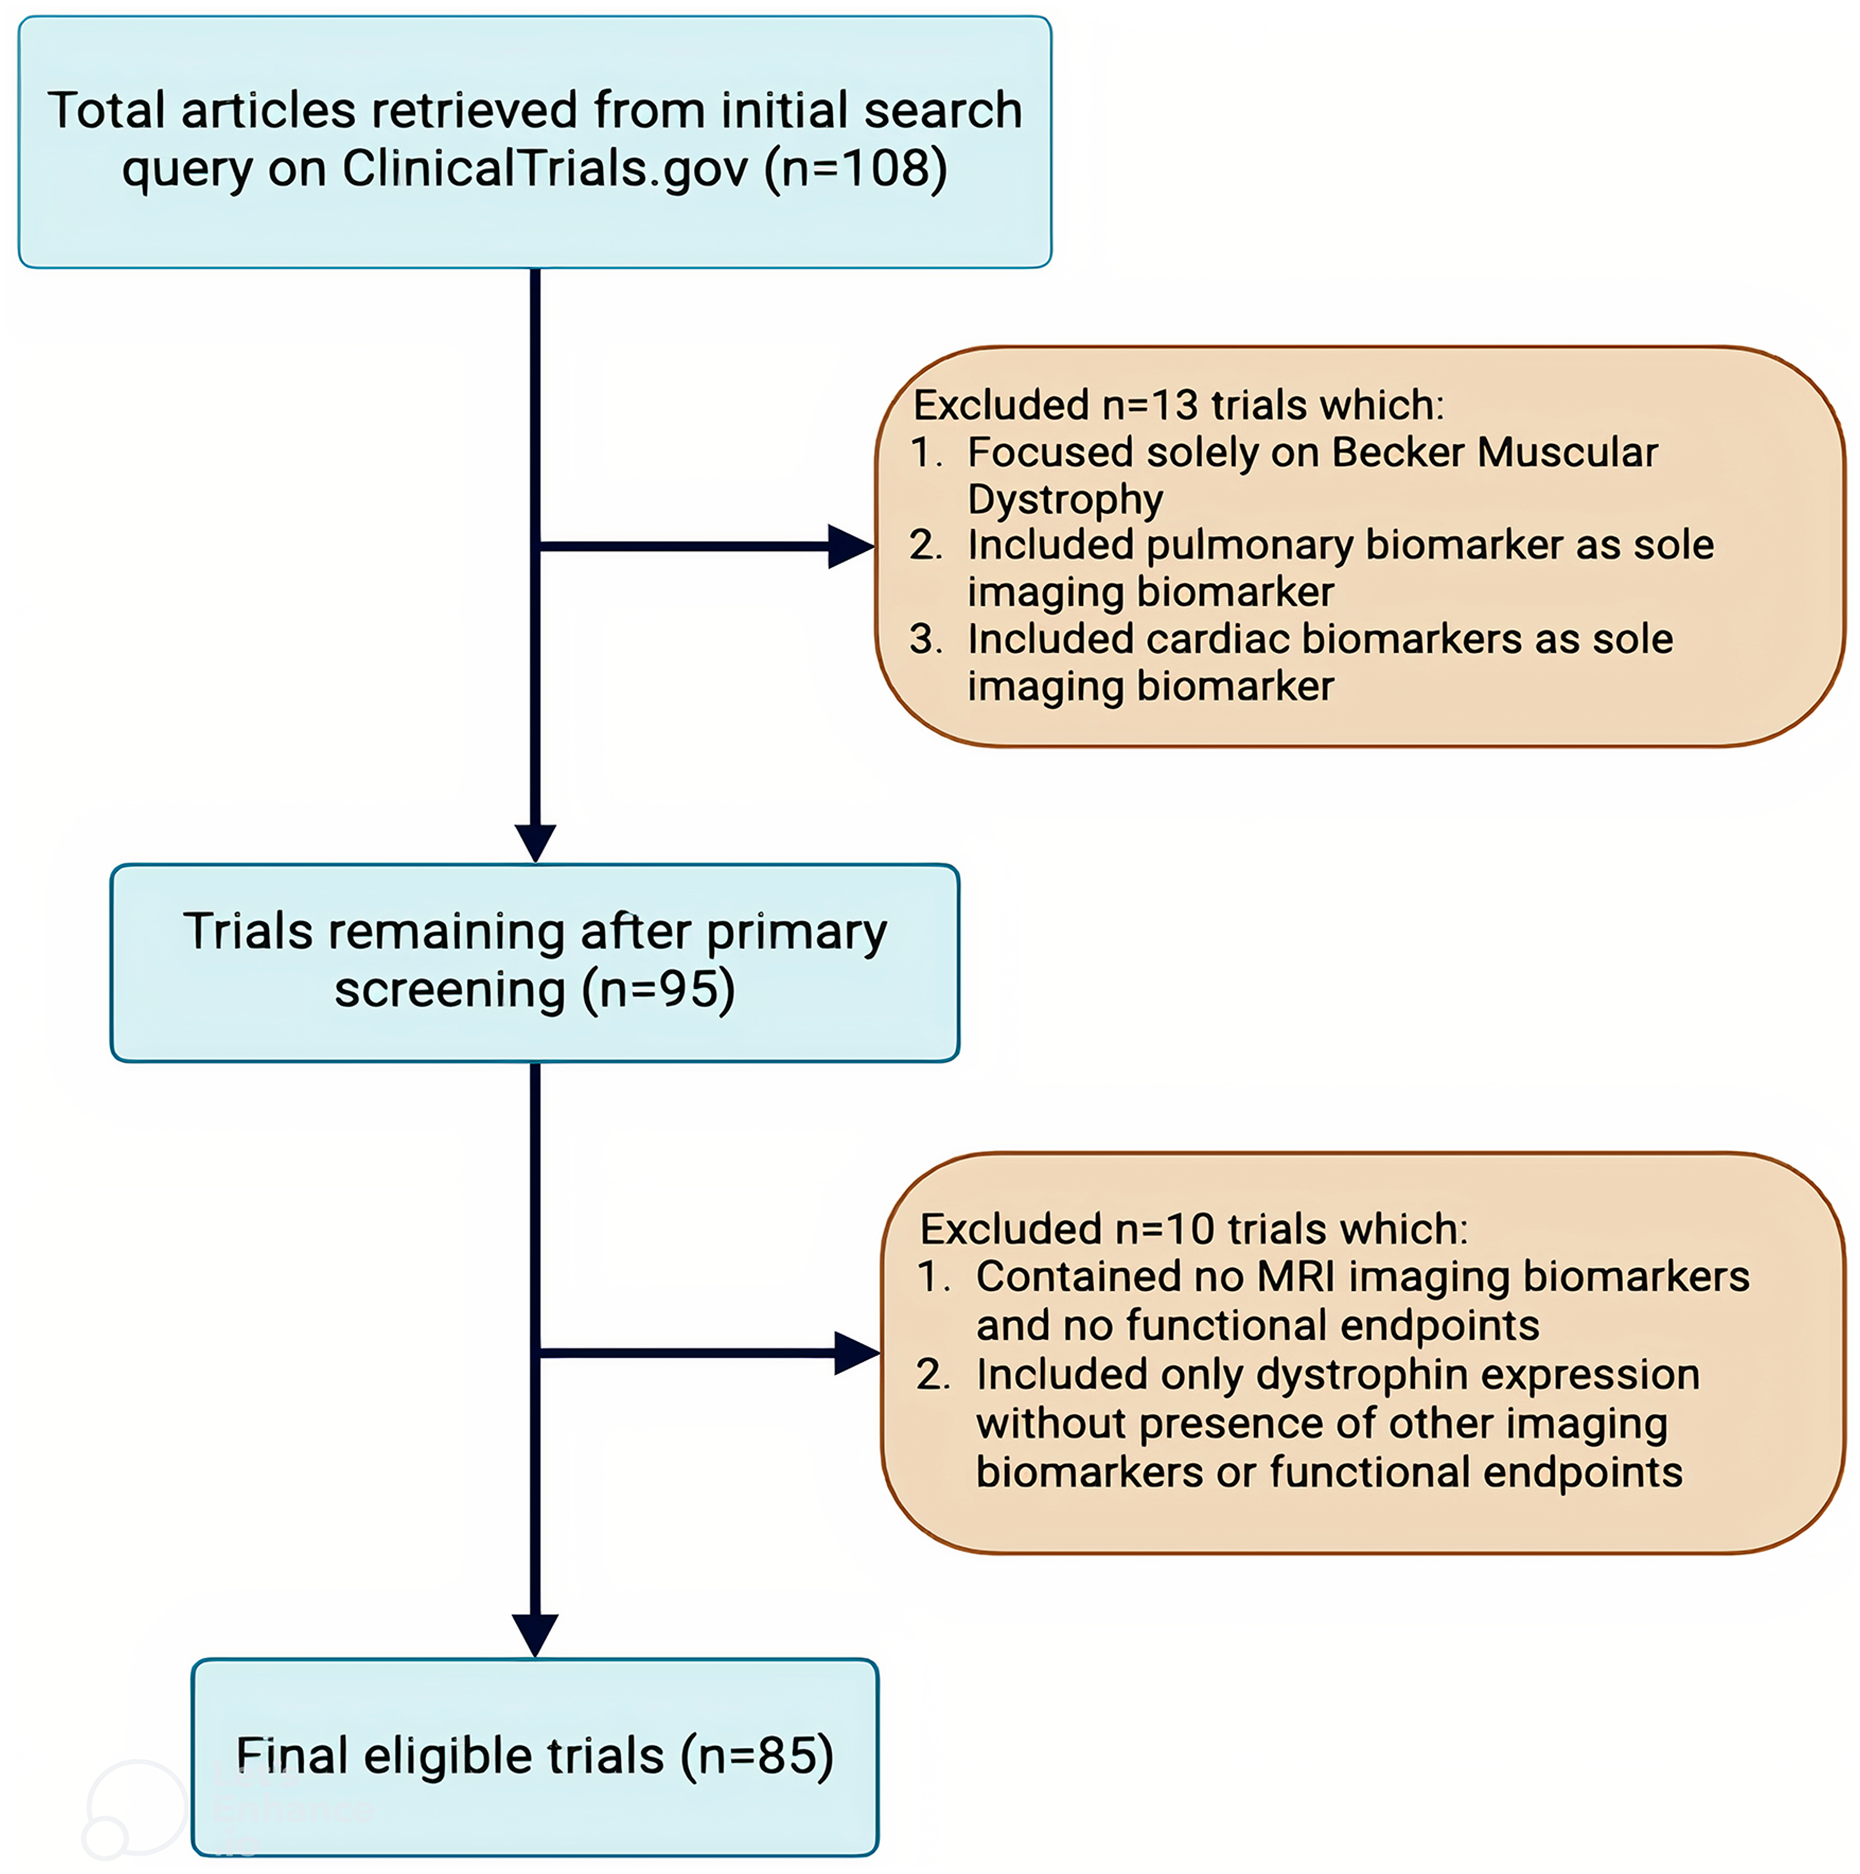
Data exclusion. Flowchart depicting the selection process for eligible trials retrieved from ClinicalTrials.gov. A total of 108 trials were initially identified, with 13 trials excluded based on criteria such as focus on Becker Muscular Dystrophy, use of pulmonary or cardiac biomarkers as sole imaging markers. After primary screening, 95 trials remained, and an additional 10 trials were excluded for lacking MRI biomarkers or ambulatory functional endpoints, or for including only dystrophin expression without other biomarkers or ambulatory functional endpoints. The final eligible trial count was 85.
We followed the PRISMA 2020 guidelines 30 throughout study selection, data extraction, and synthesis to ensure methodological transparency and rigor.
Rationale for inclusion and exclusion criteria
While there are many types of imaging biomarkers used in clinical trials, including pulmonary and cardiovascular MRI measures, the focus of this systematic review was on MRI and MRS measures (T2 and fat fraction) of skeletal muscle, which directly relate to ambulation and disease progression. Cardiac and pulmonary MRI biomarkers are important for assessing prognosis and quality of life, but T2 and fat fraction are muscle-specific measures that directly reflect ambulatory skeletal muscle pathology. Similarly, functional tests such as the 6-min walk test (6MWT) are primarily relevant while ambulation is preserved. Once patients become non-ambulant, these tests are no longer applicable. Therefore, for consistency and relevance across the full time window (2010–2022), T2 and fat fraction were selected as inclusion biomarkers, and 6MWD was selected as the representative functional endpoint for comparison.
Results and discussion
Intervention type
Between 2010 and 2022, 61.2% of studies (52 of 85) involved pharmacological interventions, while the remaining 38.8% (33 studies) were either non-interventional or used non-pharmacological approaches. Non-interventional studies demonstrated a consistent trend, punctuated by minor annual fluctuations, indicative of a sustained research interest in or requirement for observational methodologies. The mean duration of non-interventional studies utilizing imaging biomarkers was 4.72 years, in contrast to 2.18 years for those employing solely ambulatory functional endpoints. For interventional trials, this contrast was not as stark. Interventional trials that included imaging biomarkers had a mean duration of 3.64 years, compared to 3.82 years for those that did not.
Among the study types, non-pharmacologic (n = 5, 41.7%) and non-interventional studies (n = 7, 33.3%) had the highest proportional use of imaging biomarkers. In contrast, imaging was used less frequently in small molecule (n = 5, 22.7%) and biologic studies (n = 4, 13.3%). Use of ambulatory functional endpoints was greater than 90% in nearly all categories: biologic studies used them in 93.3% of cases (n = 28), small molecule studies in 90.9% (n = 20), non-interventional studies in 90.5% (n = 19), and non-pharmacologic studies in 66.6% (n = 8). These findings indicate that while ambulatory functional endpoints are consistently prioritized across study types, imaging biomarkers are more commonly incorporated in non-pharmacologic and non-interventional studies, likely reflecting the exploratory or mechanistic nature of those study designs and the absence of a regulatory-accepted surrogate endpoint. (Figure 2A).
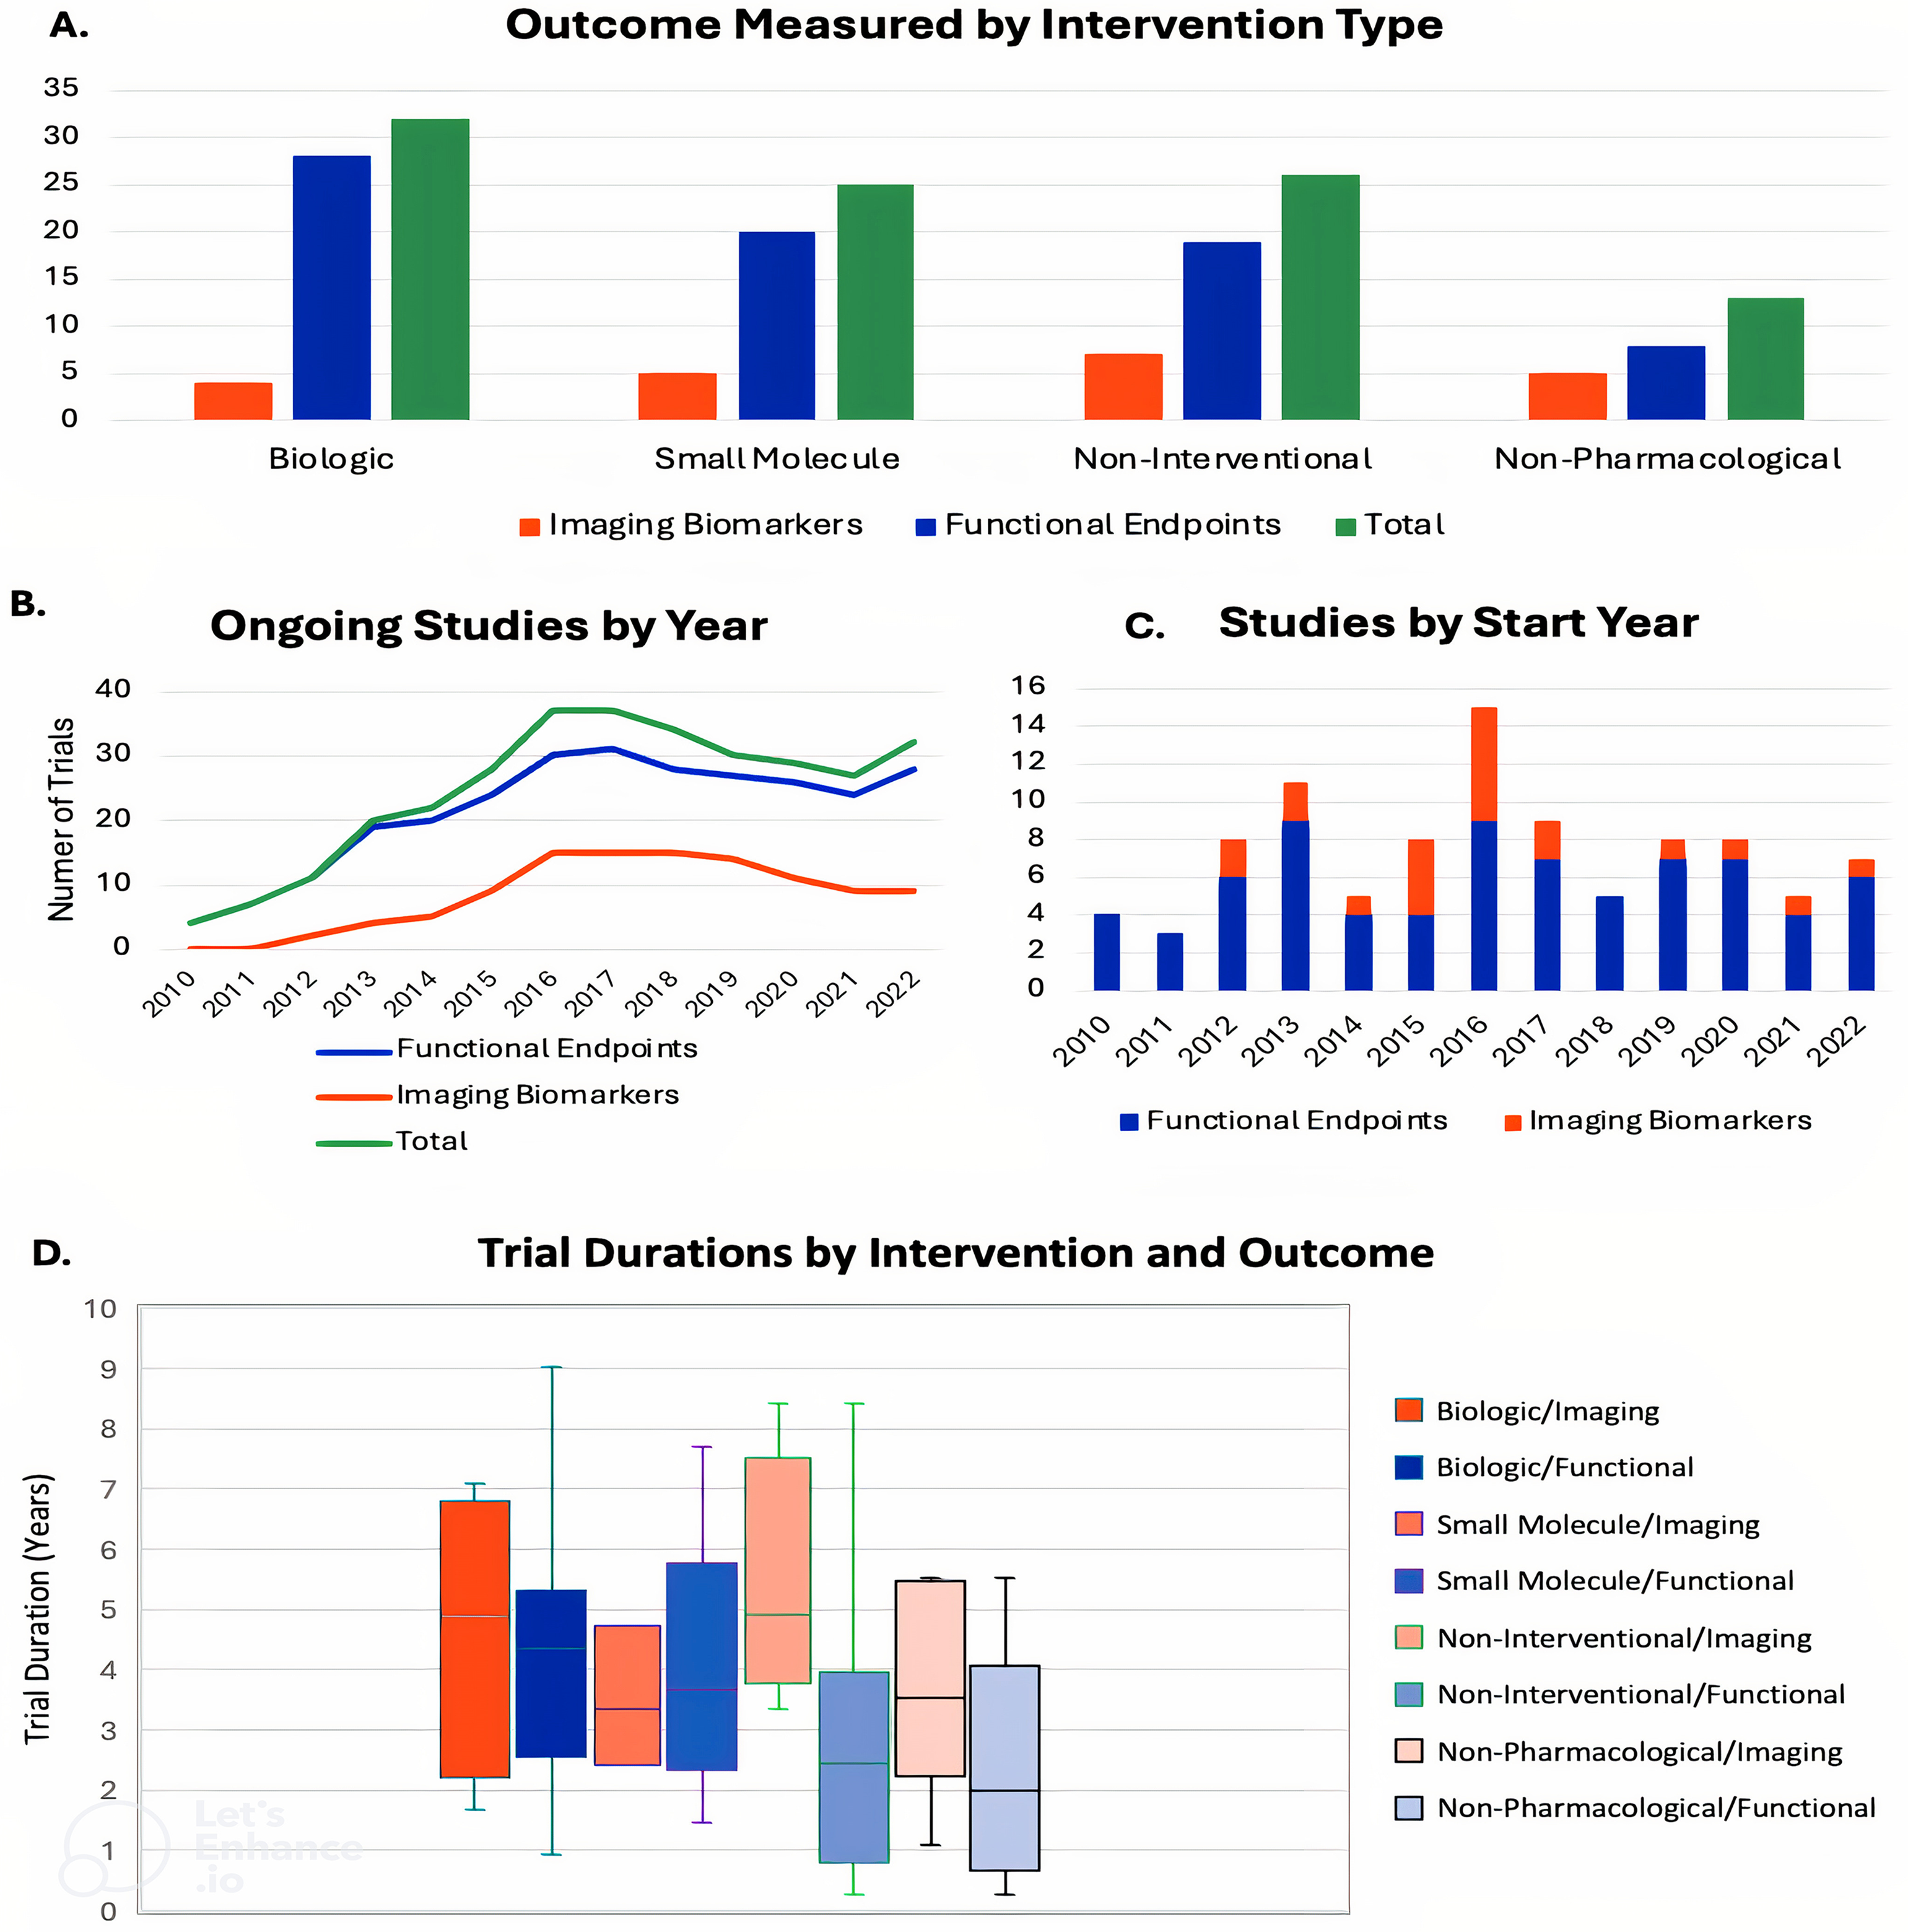
(A) Comparison of endpoint usage across intervention types. Trials were categorized into four groups: non-interventional trials and three types of interventional trials (small molecule drugs, biologic drugs, and non-pharmacological interventions). Imaging biomarkers were relatively low compared to ambulatory functional endpoints within each intervention group. Despite similar absolute numbers of trials using imaging biomarkers across all groups, they constituted a greater percentage in non-pharmacological and non-interventional studies due to fewer total trials in those categories. Some trials studied both imaging biomarkers and ambulatory functional endpoints, leading to the sum of green and blue bars exceeding the white bars on the x-axis. (B) Ongoing studies by year. For each year in our study period, the sum of all trials that had started on that year or before and ended on that year or after were counted here. The total counts each trial individually and does not duplicate data for trials including both imaging biomarkers and ambulatory functional endpoints. (C) Studies by start year. The non-stacked line graph displays higher amounts of trials using ambulatory functional endpoints each year, except for the year 2015, in which use of both measures was even. In 2016, both lines reached their local maxima, with imaging biomarkers declining in the following years to a total of 0 trials in 2018. Trials that included both measures were counted in both categories for their respective start year. (D) Trial durations stratified by intervention type and primary outcome measure. This box-and-whisker plot illustrates the distribution of trial durations, in years, across eight groups categorized by intervention type (Biologic, Small Molecule, Non-Interventional, or Non-Pharmacological) and inclusion or exclusion of imaging biomarkers. Each box represents the interquartile range (IQR), with the horizontal line denoting the median and the “X” marking the mean. Whiskers indicate the range within 1.5 times the IQR; outliers beyond this range are plotted individually. Trials involving biologic interventions paired with imaging outcomes exhibited the widest duration range. Among non-interventional trials, those using imaging outcomes had longer durations than those using functional endpoints, both in terms of median and overall distribution. This visualization highlights variation in trial length based on both therapeutic strategy and endpoint selection.
Trial start year
In February 2018, the FDA released the final guidance for DMD, marking a significant milestone for DMD treatment development. 31 As seen in Figure 2B and Figure 2C of our results, none of the DMD studies initiated in 2018 chose to study imaging biomarkers as a primary or secondary endpoint. This comes after the highest recorded number of imaging biomarker-focused studies initiated in 2016.
An important main difference between the verbiage from the 2015 draft guidance and the 2018 final guidance lies in the emphasis on the selection of biomarkers in clinical trials for dystrophinopathies. In the draft guidance, there is a suggestion that trials should include “as many biomarkers as feasible” to establish correlations with clinical endpoints, while the final guidance emphasizes the importance of including a “selection of relevant biomarkers."26,31 This shift in language could have influenced the conduct of clinical trials and the use of imaging biomarkers.
In 2016, when the draft guidance was released, there may have been a surge in DMD trials utilizing T2 and fat fraction as researchers sought to comply with the recommendation to include multiple biomarkers. This could explain the peak in DMD trials that utilized these emerging imaging biomarkers during that year. Additionally, our research witnessed a big increase in DMD studies that employed biomarkers to better understand DMD during the period.
By 2018, when the final guidance was issued, its emphasis on selecting relevant biomarkers rather than including as many as feasible may have prompted researchers to focus on fewer, more established measures, such as cardiovascular and pulmonary endpoints, or to forgo biomarker inclusion altogether. Another possible explanation is that, by this time, the field felt that enough natural history data had been collected, making further early-stage observational studies less necessary. These two factors are not mutually exclusive, and the available data do not distinguish between them, suggesting that both may have contributed to the drop-off in trials utilizing imaging biomarkers.
Trial durations
Figure 2D presents trial durations stratified by intervention types and primary outcome measures. Notably, non-interventional studies exhibit the most distinct separation in interquartile ranges between studies that included imaging biomarkers and those that did not, strongly indicating longer durations for the former. Across all intervention types except small molecules, median study durations were longer in studies incorporating imaging biomarkers. In contrast, small molecule trials showed relatively minimal visual differences in duration distributions based on outcome measure type. Studies incorporating imaging biomarkers had a mean duration of 4.5 years, compared to 3.6 years for those using only ambulatory functional endpoints. While our findings showed that studies utilizing imaging biomarkers were longer in duration than those using only ambulatory functional endpoints, imaging biomarkers can detect disease progression over shorter intervals and thus may allow for shorter trials requiring fewer participants, as previously found by multiple studies.2,18
The observation that trials incorporating imaging biomarkers were longer in duration requires careful interpretation. Rather than suggesting that longer trials prospectively chose to include imaging measures, this finding may instead reflect that non-interventional studies—which often run longer than interventional trials and include a mixture of natural history studies with traditional observational studies—are more likely to include imaging biomarkers for methodological validation and exploration. When analyzed separately, interventional trials showed less disparity in duration between those with and without imaging measures (mean difference: 1.44 months), while non-interventional studies with imaging components averaged 37.68 months longer than those without.
Machine learning-based study interpretation
XGBoost is an ensemble decision tree model trained with parallel multiple trees. It was used in this study for 3-class classification of among (i) use of an imaging biomarker or (ii) use of an ambulatory functional endpoint (iii) use of both based on the collected information. Several components were collected in each study. Besides the class (i.e., the labeled targets), the other collected components, such as intervention type, study start year, completion year, trial status, trial duration, and study design, were utilized as the input training data. Since observational and natural history studies do not fall under the traditional phase 1–3 framework, the data were organized their phase as simply “Non-interventional”. If a single identifier comprised three elements in certain components, the identifier was split into three data points to clarify the training input data. Following this data formatting, the resulting data was a total of 107 data pairs. The data components consisted of both continuous and categorical data types, requiring classification before being fed into XGBoost. The model classified the 3-class (i.e., imaging biomarkers, functional endpoint, and both) using 10 depths and 32 leaves of a tree as parameters. Ten total decision trees were generated, and the representative decision tree is shown in Figure 3A.
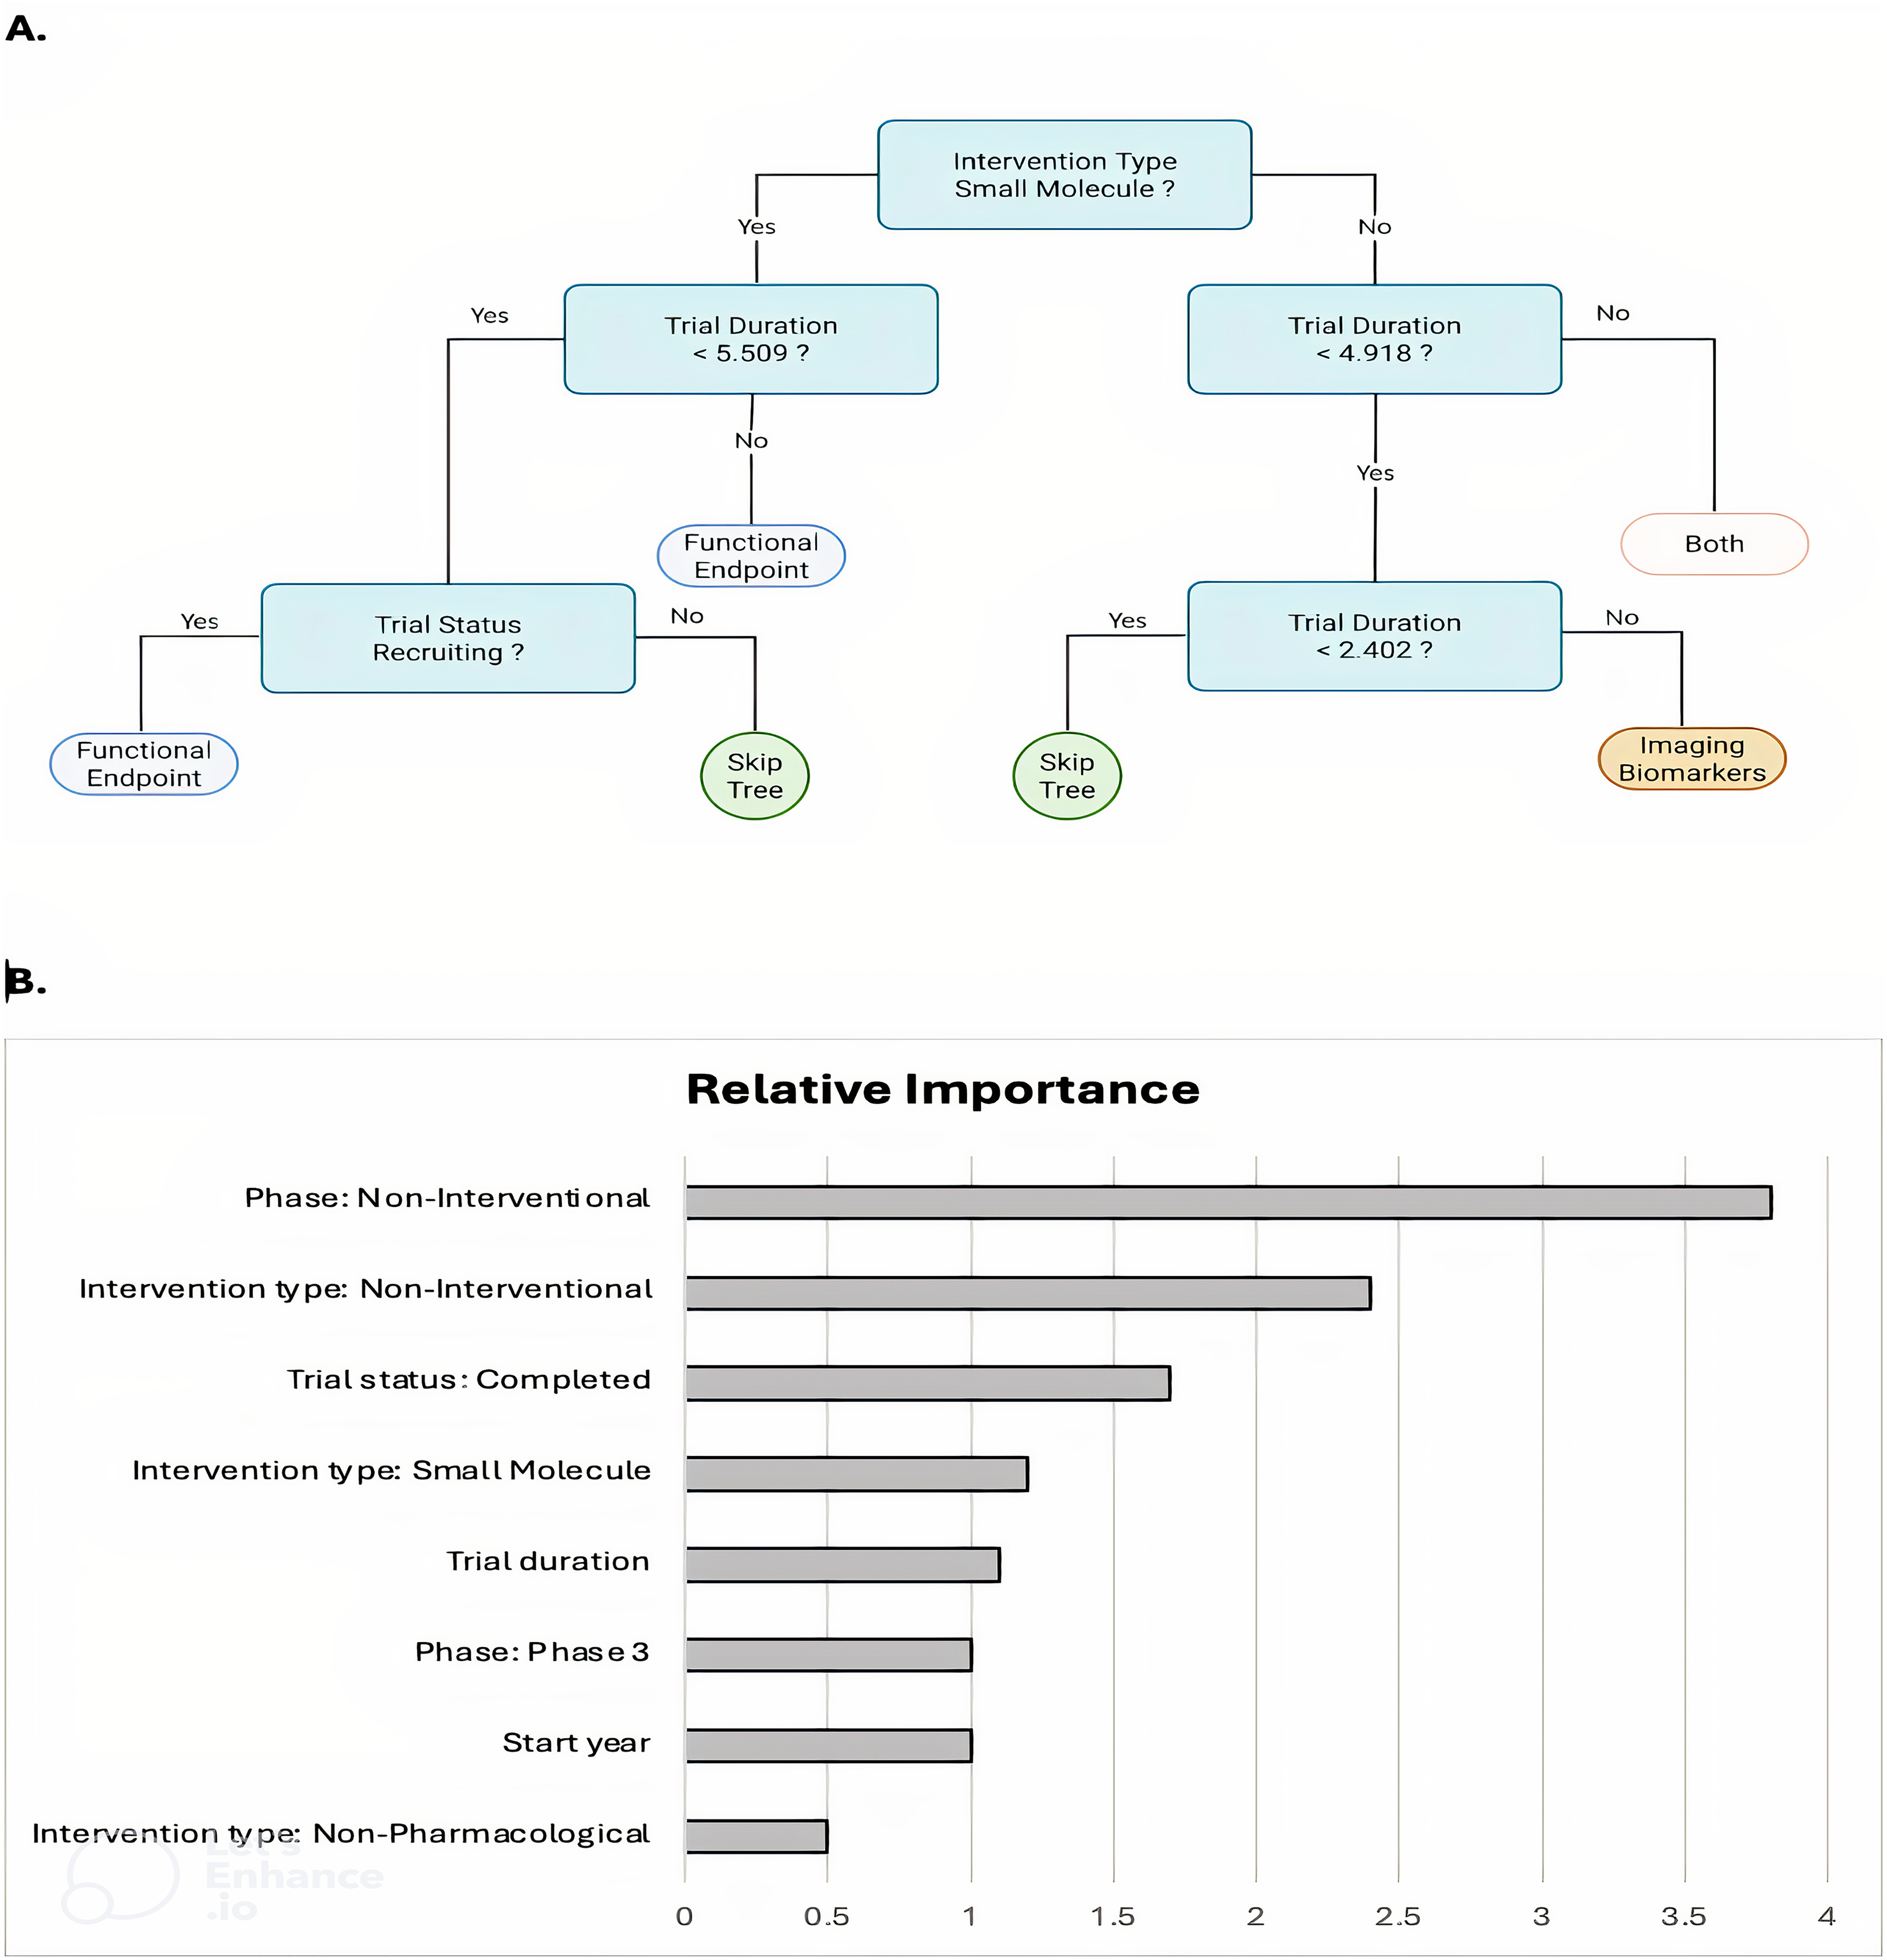
A representative decision tree and important features. Decision trees were trained using XGBoost to classify previous clinical trial characteristics —a set including intervention type, start year, phase, trial status, trial duration, and study design— were organized into one of three outcome categories: functional endpoints, imaging biomarkers, or both. By predicting the outcome category based on six input components, this approach aids in guiding the design of future clinical trials. (A) Representative decision tree. Each tree learns decision rules, identifying thresholds for numerical components and splitting criteria for categorical variables. The final prediction is made by aggregating the outputs of all trees, weighted according to their trained importance. (B) Feature importance of clinical trial components derived from trained decision tree.. The relative importance of six clinical trial characteristics was assessed using F-scores, which reflect each feature's contribution to the predictive performance of the model. The three most influential variables were trials classified as “Non-interventional” in the Phase category, “Non-Pharmacological” in Intervention Type, and “Non-interventional” in Study Design.
The ranking of clinical trial components’ importance generated by the decision trees from trained XGBoost was visualized in Figure 3B. The XGBoost ranked all the clinical trial components that were deemed most important in creating its decision trees, and the top three features were “Phase: Non-interventional”, “Intervention Type: Non-pharmacological”, and “Intervention Type: Non-interventional”.
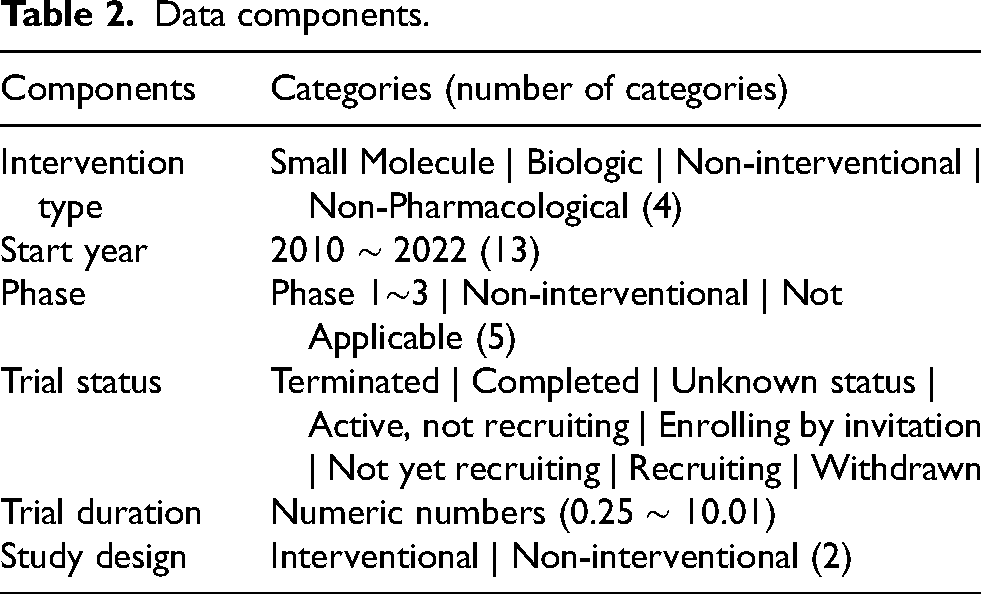
The model can be further utilized to predict the class —use of an imaging biomarker, use of an ambulatory functional endpoint, and both — by having user-defined input data by passing through all the trained decision trees and obtaining scores from each decision tree. The model then generates the final classification results based on these scores. Using the script provided in Supplementary File 2, the developed XGBoost model can validate predictions based on input data comprising the six components listed in Table 2.
Data components.
Limitations
This study faced notable limitations, including our choice to exclude dystrophin expression from our results. Studies should be done on dystrophin expression as it stands apart from T2 and fat fraction in its method of collection, and could potentially have differing trends that MRI and MRS. The XGBoost was chosen to create decision trees based on a 3-class finding of including ambulatory functional endpoints, imaging biomarkers, and a combination of both, which itself is a limitation. The performance of the prediction model was well, but the imbalance and scarcity of data within each class (62 ambulatory functional endpoints, 10 imaging biomarkers, and 13 cases with both) made it challenging to adequately validate the model during training, which is an inevitable outcome of studying rare diseases such as DMD.
Conclusion
The scope of our research was to examine the evolving landscape of imaging biomarker use in DMD clinical trials. Through a systematic review, statistical analysis, and machine learning-assisted trend analysis, we identified patterns in the adoption of MRI-based biomarkers and their relationship with trial characteristics. Our findings suggest that non-interventional trials, non-pharmacological interventions, and fully completed trials were more likely to use imaging biomarkers, whereas interventional pharmacological trials still favor functional endpoints such as the 6MWD.
Although the FDA encourages the use of imaging biomarkers in trial design, these biomarkers have not yet been accepted as primary endpoints in pivotal studies. This regulatory context has likely influenced trial strategies, particularly given the stricter evidentiary requirements for biomarker validation. While our decision to focus on ambulation-related endpoints improves consistency across the 2010–2022 study window, it may underrepresent the growing role of newer functional measures such as the PUL scale. Future work should further explore how imaging biomarkers complement upper limb functional assessments and how their combined use might improve endpoint strategies in advanced-stage DMD trials.
Supplemental Material
sj-docx-1-jnd-10.1177_22143602251360664 - Supplemental material for Use of imaging biomarkers and ambulatory functional endpoints in Duchenne muscular dystrophy clinical trials: Systematic review and machine learning-driven trend analysis
Supplemental material, sj-docx-1-jnd-10.1177_22143602251360664 for Use of imaging biomarkers and ambulatory functional endpoints in Duchenne muscular dystrophy clinical trials: Systematic review and machine learning-driven trend analysis by Matthew Todd, Sanghoon Kang, Shunwen Wu, Devanand Adhin, Deok Yong Yoon, Rebecca Willcocks and Sarah Kim in Journal of Neuromuscular Diseases
Supplemental Material
sj-csv-2-jnd-10.1177_22143602251360664 - Supplemental material for Use of imaging biomarkers and ambulatory functional endpoints in Duchenne muscular dystrophy clinical trials: Systematic review and machine learning-driven trend analysis
Supplemental material, sj-csv-2-jnd-10.1177_22143602251360664 for Use of imaging biomarkers and ambulatory functional endpoints in Duchenne muscular dystrophy clinical trials: Systematic review and machine learning-driven trend analysis by Matthew Todd, Sanghoon Kang, Shunwen Wu, Devanand Adhin, Deok Yong Yoon, Rebecca Willcocks and Sarah Kim in Journal of Neuromuscular Diseases
Footnotes
Author contributions
Matthew Todd, Sanghoon Kang, Shunwen Wu, Devanand Adhin, Rebecca Willcocks, and Sarah Kim wrote manuscript. Matthew Todd, Sanghoon Kang, Shunwen Wu, Deok Yong Yoon, Rebecca Willcocks, and Sarah Kim designed research. Matthew Todd, Sanghoon Kang, Shunwen Wu, and Devanand Adhin performed research. Matthew Todd, Sanghoon Kang, Shunwen Wu, Devanand Adhin, Rebecca Willcocks, and Sarah Kim analyzed data.
Funding
The author(s) disclosed receipt of the following financial support for the research, authorship, and/or publication of this article: This work was supported by the National Institutes of Health National Center for Advancing Translational Sciences (NIH NCATS R21TR004006) and UF College of Public Health and Health Professions (PHHP) Research Innovation Fund. The content is solely the responsibility of the authors and does not necessarily represent the official views of the NIH and UF PHHP.
Declaration of conflicting interests
The author(s) declared no potential conflicts of interest with respect to the research, authorship, and/or publication of this article.
Data availability statement
Supplemental material
Supplemental material for this article is available online.
References
Supplementary Material
Please find the following supplemental material available below.
For Open Access articles published under a Creative Commons License, all supplemental material carries the same license as the article it is associated with.
For non-Open Access articles published, all supplemental material carries a non-exclusive license, and permission requests for re-use of supplemental material or any part of supplemental material shall be sent directly to the copyright owner as specified in the copyright notice associated with the article.