
Abstract
Background:
Electrical impedance myography (EIM) has been proposed as an efficient, non-invasive biomarker of muscle composition in facioscapulohumeral muscular dystrophy (FSHD).
Objective:
We investigate whether EIM parameters are associated with muscle structure measured by magnetic resonance imaging (MRI), muscle histology, and transcriptomic analysis as well as strength at the individual leg muscle level.
Methods:
We performed a multi-center cross-sectional study enrolling 33 patients with FSHD. EIM measurements were recorded from bilateral vastus lateralis, tibialis anterior (TA), and medial gastrocnemius muscles and compared to quantitative muscle volume measures by MRI as well as knee extension and ankle dorsiflexion strength by quantitative muscle testing. EIM measurements of the bilateral TA were further compared to histology and transcriptomic analysis (RNAseq) of muscle and fat content.
Results:
EIM phase at multiple frequencies was positively associated to the amount of muscle measured by MRI (ρ = 0.48 to 0.70, p
Conclusions:
This study supports the hypothesis that the amount and quality of muscle tissue as assessed by EIM is associated with the amount and quality of muscle tissues as assessed by MRI and muscle biopsy, with all measures ultimately being strongly associated with muscle strength. These data provide further convergent validity for the use of EIM as a potential non-invasive biomarker to assess muscle health in FSHD.
Keywords
Introduction
Facioscapulohumeral muscular dystrophy (FSHD) is a slowly progressive muscle disease. Genetic and molecular biology studies of FSHD support the hypothesis that the transcription factor DUX4 is aberrantly and stochastically activated in skeletal muscle, turning on a downstream toxic program that results in muscle necrosis and fibrofatty replacement.1–4 There is typically considerable variability in the degree of weakness and progression of individual muscles, and thus technologies that can evaluate muscle at a single-muscle level may be especially useful for monitoring disease progression and the effect of therapy. One technology that appears especially promising in this regard is electrical impedance myography (EIM) since it is non-invasive and can be easily applied in the clinic setting where multiple individual muscles can be measured in quick succession (e.g., approximately 10 min to measure six lower extremity muscles).
EIM has been used as a measure of muscle quality in multiple diseases.5–10 The EIM device applies a low-intensity alternating electrical current over a range of frequencies (1 kilohertz [kHz]-10 Megahertz) to the underlying muscle through the outer two electrodes (of a four-electrode set) and measures the resulting voltage across the inner two electrodes. The frequency-dependent resistance and reactance values of the underlying tissue are then calculated. Fat conducts current poorly (higher resistance) while lean muscle conducts current more easily because it contains more free water (lower resistance). Reactance captures cell membrane integrity, with generally higher reactance values supporting healthier tissue and lower reactance values more injured or diseased tissue. Another parameter calculated is the phase (θ, in degrees), that is the arctan of the ratio of the reactance over the resistance (X/R). Healthy muscles have greater reactance and, therefore, larger phase. With muscle degeneration, fatty infiltration increases resistance, decreases reactance, and results cumulatively in decreased phase. 11
EIM has been used in FSHD to measure muscle health. Two prior cross-sectional studies examined lower extremity muscles: The first study found EIM measurement of combined leg muscles was correlated to FSHD disease severity, composite lower extremity manual muscle testing, and functional outcome measures (such as 6-min walk test and ascend four steps). 9 One individual leg muscle, the right vastus lateralis, was studied, demonstrating that EIM has a moderate correlation to the strength measured by quantitative muscle testing (QMT). 9 The second study focused on association of EIM and magnetic resonance imaging (MRI) and found that EIM measurement of six lower extremity muscles combined (bilateral vastus lateralis [VL], tibialis anterior [TA], and medial gastrocnemius [MG]) were strongly correlated with a semi-quantitative scale of MRI fat content of central slices of the muscles. 7 These two studies mainly assessed EIM and strength as a combined measurement of several leg muscles.
Separately, the Seattle Wellstone Center previously reported on a cohort of 34 patients with FSHD who underwent lower extremity MRI, strength testing, and bilateral TA muscle biopsies. 12 We utilized AI segmentation of the leg muscle MRIs—allowing us to quantify more accurately the amount of fat versus muscle tissue in each individual muscle. 13 As part of data collection in that study, we had also included EIM measurement but did not analyze or report on those results. Nevertheless, having done so we are now able to evaluate the association between EIM and various muscle parameters at the individual muscle level—specifically muscle volume measured by MRI but also strength and histopathology/molecular changes. This is important because multiple molecular therapies are aiming to inhibit the molecular changes underlying the disease and additional tools that show associations between the molecular composition of the muscle and the state of the muscle structure will be helpful in clinical trials. In this study, we tested the hypothesis that the amount and quality of muscle tissue as assessed by EIM is associated with the amount and quality of muscle tissues as assessed by MRI and muscle biopsy, with all ultimately being strongly associated with muscle strength.
Materials and methods
We performed a prospective cross-sectional study of EIM, muscle MRI, and muscle biopsies as part of our ongoing Seattle Paul D. Wellstone Muscular Dystrophy Cooperative Research Center at the University of Rochester, University of Kansas Medical Center (KUMC), and University of Washington.
Ethical statement
This study was approved by the Central Institutional Review Board (IRB) at KUMC (IRB Number: STUDY00143349) on January 2nd, 2019. All participants provided written informed consent prior to enrollment in the study. This research was conducted ethically in accordance with the World Medical Association Declaration of Helsinki.
Participants
Our cohort included 34 ambulatory participants with genetically confirmed FSHD1 and/or FSHD2.12,13 The study had at least two planned visits: (1) a baseline assessment consisting of an MRI of lower extremities, quantitative muscle testing, and TA muscle biopsies completed within a month timeframe; (2) a subsequent follow-up visit planned for approximately one year later. Due to challenges relating to the COVID pandemic and IRB amendment approval timing adding on EIM to the protocol, four subjects (32-022, 13-001, 13-002, 13-003) only had EIM measurements at their one-year follow-up visit along with MRI and QMT and those visit data were included in the analysis. This allowed for a final EIM/QMT/MRI cross-sectional cohort of 33 patients.
EIM
EIM recordings of the bilateral VL, TA, and MG muscles were obtained using the mView device (Myolex, Inc., Brookline, Massachusetts) with a handheld 3-sensor electrode (20–00045). The device was placed over the bulk of the muscle. Three recordings of each muscle were performed, and the two closest values were averaged. Resistance, reactance, and phase were recorded for 41 frequencies ranging from 1 kHz to 10 MHz. In addition, phase ratios were calculated for 50/211 kHz and 100/300 kHz, as previously described. 14
Quantitative Muscle Testing (QMT)
QMT was performed using a fixed myometry testing system, with a force transducer attached by an inelastic strap to a metal frame. Participants were positioned on an adjustable plinth and were asked to pull or push against various straps for knee extension and foot dorsiflexion. 15 Strength was reported as raw maximum force in kilograms and percent predicted (adjusted for age, sex, height). 16
Muscle MRI
All MRI examinations were performed on 3T Siemens PRISMA scanners running software E11C, as described in Wong et al. 12 Sequences were acquired using flexible array coils with the following parameters: 3-plane localizers and two-point Dixon images (TE = 1.35/2.58 ms; TR = 4.12 ms, 3 mm slices). The scans varied slightly in lower-body coverage (all muscles from the pelvis to the ankle) depending on the acquisition method.
Muscle MRI quantitative analysis
MRI scans were preprocessed (registration, inhomogeneity correction, signal-normalization) as per our prior published methods 17 to produce continuous, axial T1 Dixon water and fat phase 3D images that were analyzed by our described AI methods. 13 Individual muscle measures of contractile volume (mL), corrected volume—contractile volume normalized by length of muscle captured and patient size (ml(cmkg)/cm), and fat fraction (%) were extracted for analyses. Subcutaneous fat width was measured on all the imaging slices containing the muscles and the average across all slices was calculated.
Bilateral tibialis anterior muscle histopathology/molecular markers
Subjects underwent bilateral needle TA muscle biopsies around the mid-portion of the TA with a modified Bergstrom needle. Biopsies were performed after the EIM and MRI measurements. Molecular markers of those muscle samples were measured by RNASeq transcriptomic analysis as previously reported. 12 In brief, RNA was extracted from fresh frozen biopsy samples and sequenced by single-end 100 nucleotide Illumina sequences. Multiple subsets of the transcriptomics were curated to assess molecular markers of fibrosis, fat, and muscle of the biopsied sample: extracellular matrix genes (PRG4, RUNX1, CCL19, PLA2G2A, CCL18, CDKN1A), fat (FASN, LEP, SCD), and skeletal muscle (ACTA1, TNNT3, MYH1); in addition, we assessed genes that were induced by DUX4; each of which was characterized by a score of cumulated scaled transcripts per million (TPM). Six muscle biopsy samples on each side were not of high enough quality to be analyzed.
Histopathological grading of the muscle was performed (RT) as previously described: A qualitative pathologic severity score 0–3 describing endomysial fibrosis and muscle fiber necrosis/regeneration/inflammation. A total 12-point pathology score also included variability in fiber size and the percent of fibers with centrally located nuclei. 18
EIM data preprocessing
We analyzed only the wide-longitudinal electrode configuration of the EIM device as it provides a current that penetrates the muscle most deeply. We first filtered out extreme outlier data points with phase values exceeding 25° at 20 kHz and negative reactance values above 30 kHz; as these likely represent electrode-tissue contact artifacts. Secondly, we removed values exceeding three standard deviations above or below the mean across all frequency measures for a given measurement. Thirdly, we removed data that was unexplained noise across the frequency spectrum. This ultimately resulted in very little data removed from the analysis: in sum, data from the bilateral TAs of one patient, the right vastus lateralis of two patients, and the left vastus lateralis of 3 patients were excluded.
Statistical analyses
Descriptive summaries, scatterplots and/or heat maps were used to examine EIM at different frequencies and strength, MRI muscle fat fractions, and TA muscle histopathology/molecular markers. Right and left muscles were analyzed as independent samples.
Spearman correlation analysis was employed to quantify the relationships between EIM and the different measurements. This non-parametric method was chosen for its ability to capture monotonic relationships without assuming linearity. Significant correlations (p < 0.05) indicate associations between EIM parameters, MRI muscle fat fractions, and TA muscle histopathology/molecular markers. Comparisons at the different frequencies were not adjusted for multiple comparisons due to the fact that 1) our study was exploratory and 2) the measurements across the whole frequency range are related to each other and cannot be strictly viewed as independent comparisons.
Results
Study cohort
The EIM/QMT/MRI cohort included 33 adult, ambulatory, minimally-to-moderately affected patients with FSHD, 16 female and 17 male, with median age 48 (interquartile range, IQR [36, 59]), and a median Clinical Severity Score of 5 (IQR [3, 6]). The patient demographics, disease severity, and lower extremity strength measures are presented in Supplemental Table 1.
EIM phase is correlated with the amount of muscle measured by MRI
Heatmaps of Spearman correlation coefficients comparing the MRI measurements of MRI contractile volume, corrected volume (normalized to length of muscle present), fat fraction percentage to phase and reactance at the whole spectrum of the frequencies were generated. EIM phase was found to be moderately correlated at almost all the single frequencies analyzed as well as the 50/211 kHz and 100/300 kHz ratios (Figure 1). Looking specifically at the 50 kHz phase of the individual muscles, there are moderate correlations in a linear fashion to their corresponding MRI parameters (Spearman ρ ∼ 0.53–0.73, Figure 2).
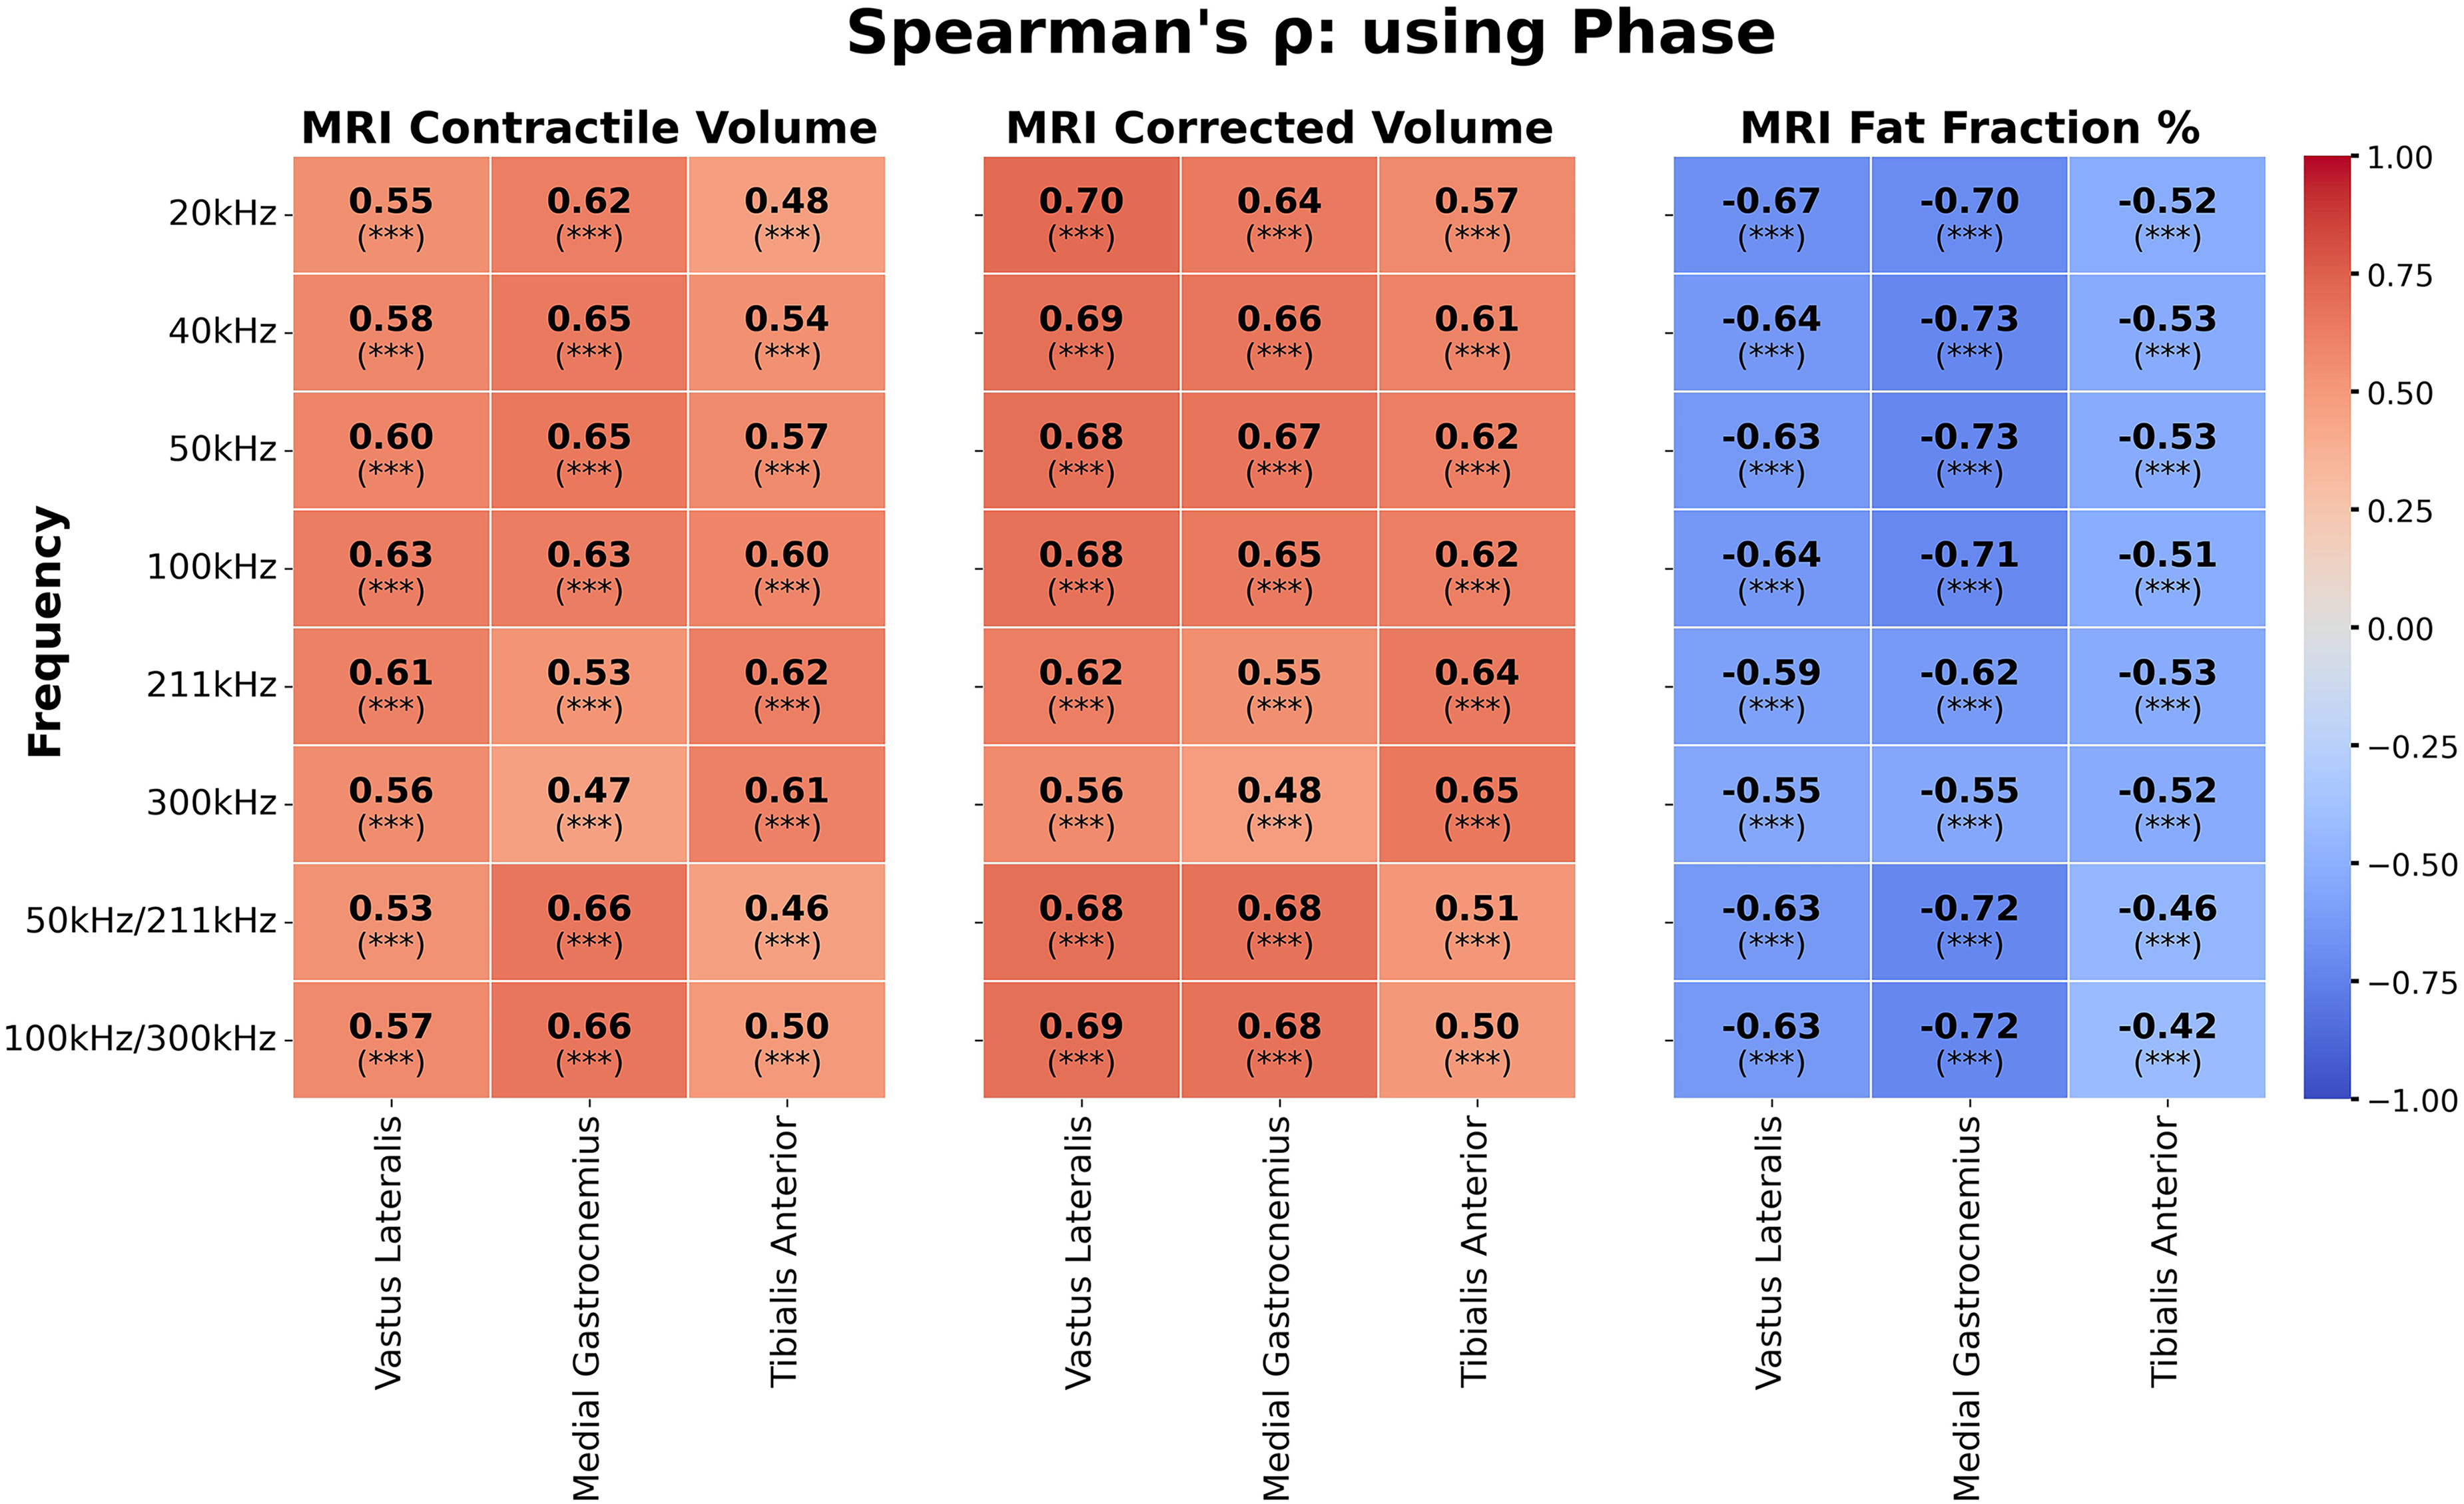
Heatmap presenting the Spearman correlation coefficient and p-values for 20 kHz, 40 kHz, 50 kHz, 100 kHz, 211 kHz, 300 kHz and the ratios of 50 kHz/211 kHz, 100 kHz/300 kHz for MRI metrics (contractile volume (mL), corrected volume—contractile volume normalized by length of muscle captured and patient size (ml(cm·kg)/cm), and fat fraction percent) using the phase. The right and left muscles were treated independently. The heatmap range set to the range of [−1, 1] with
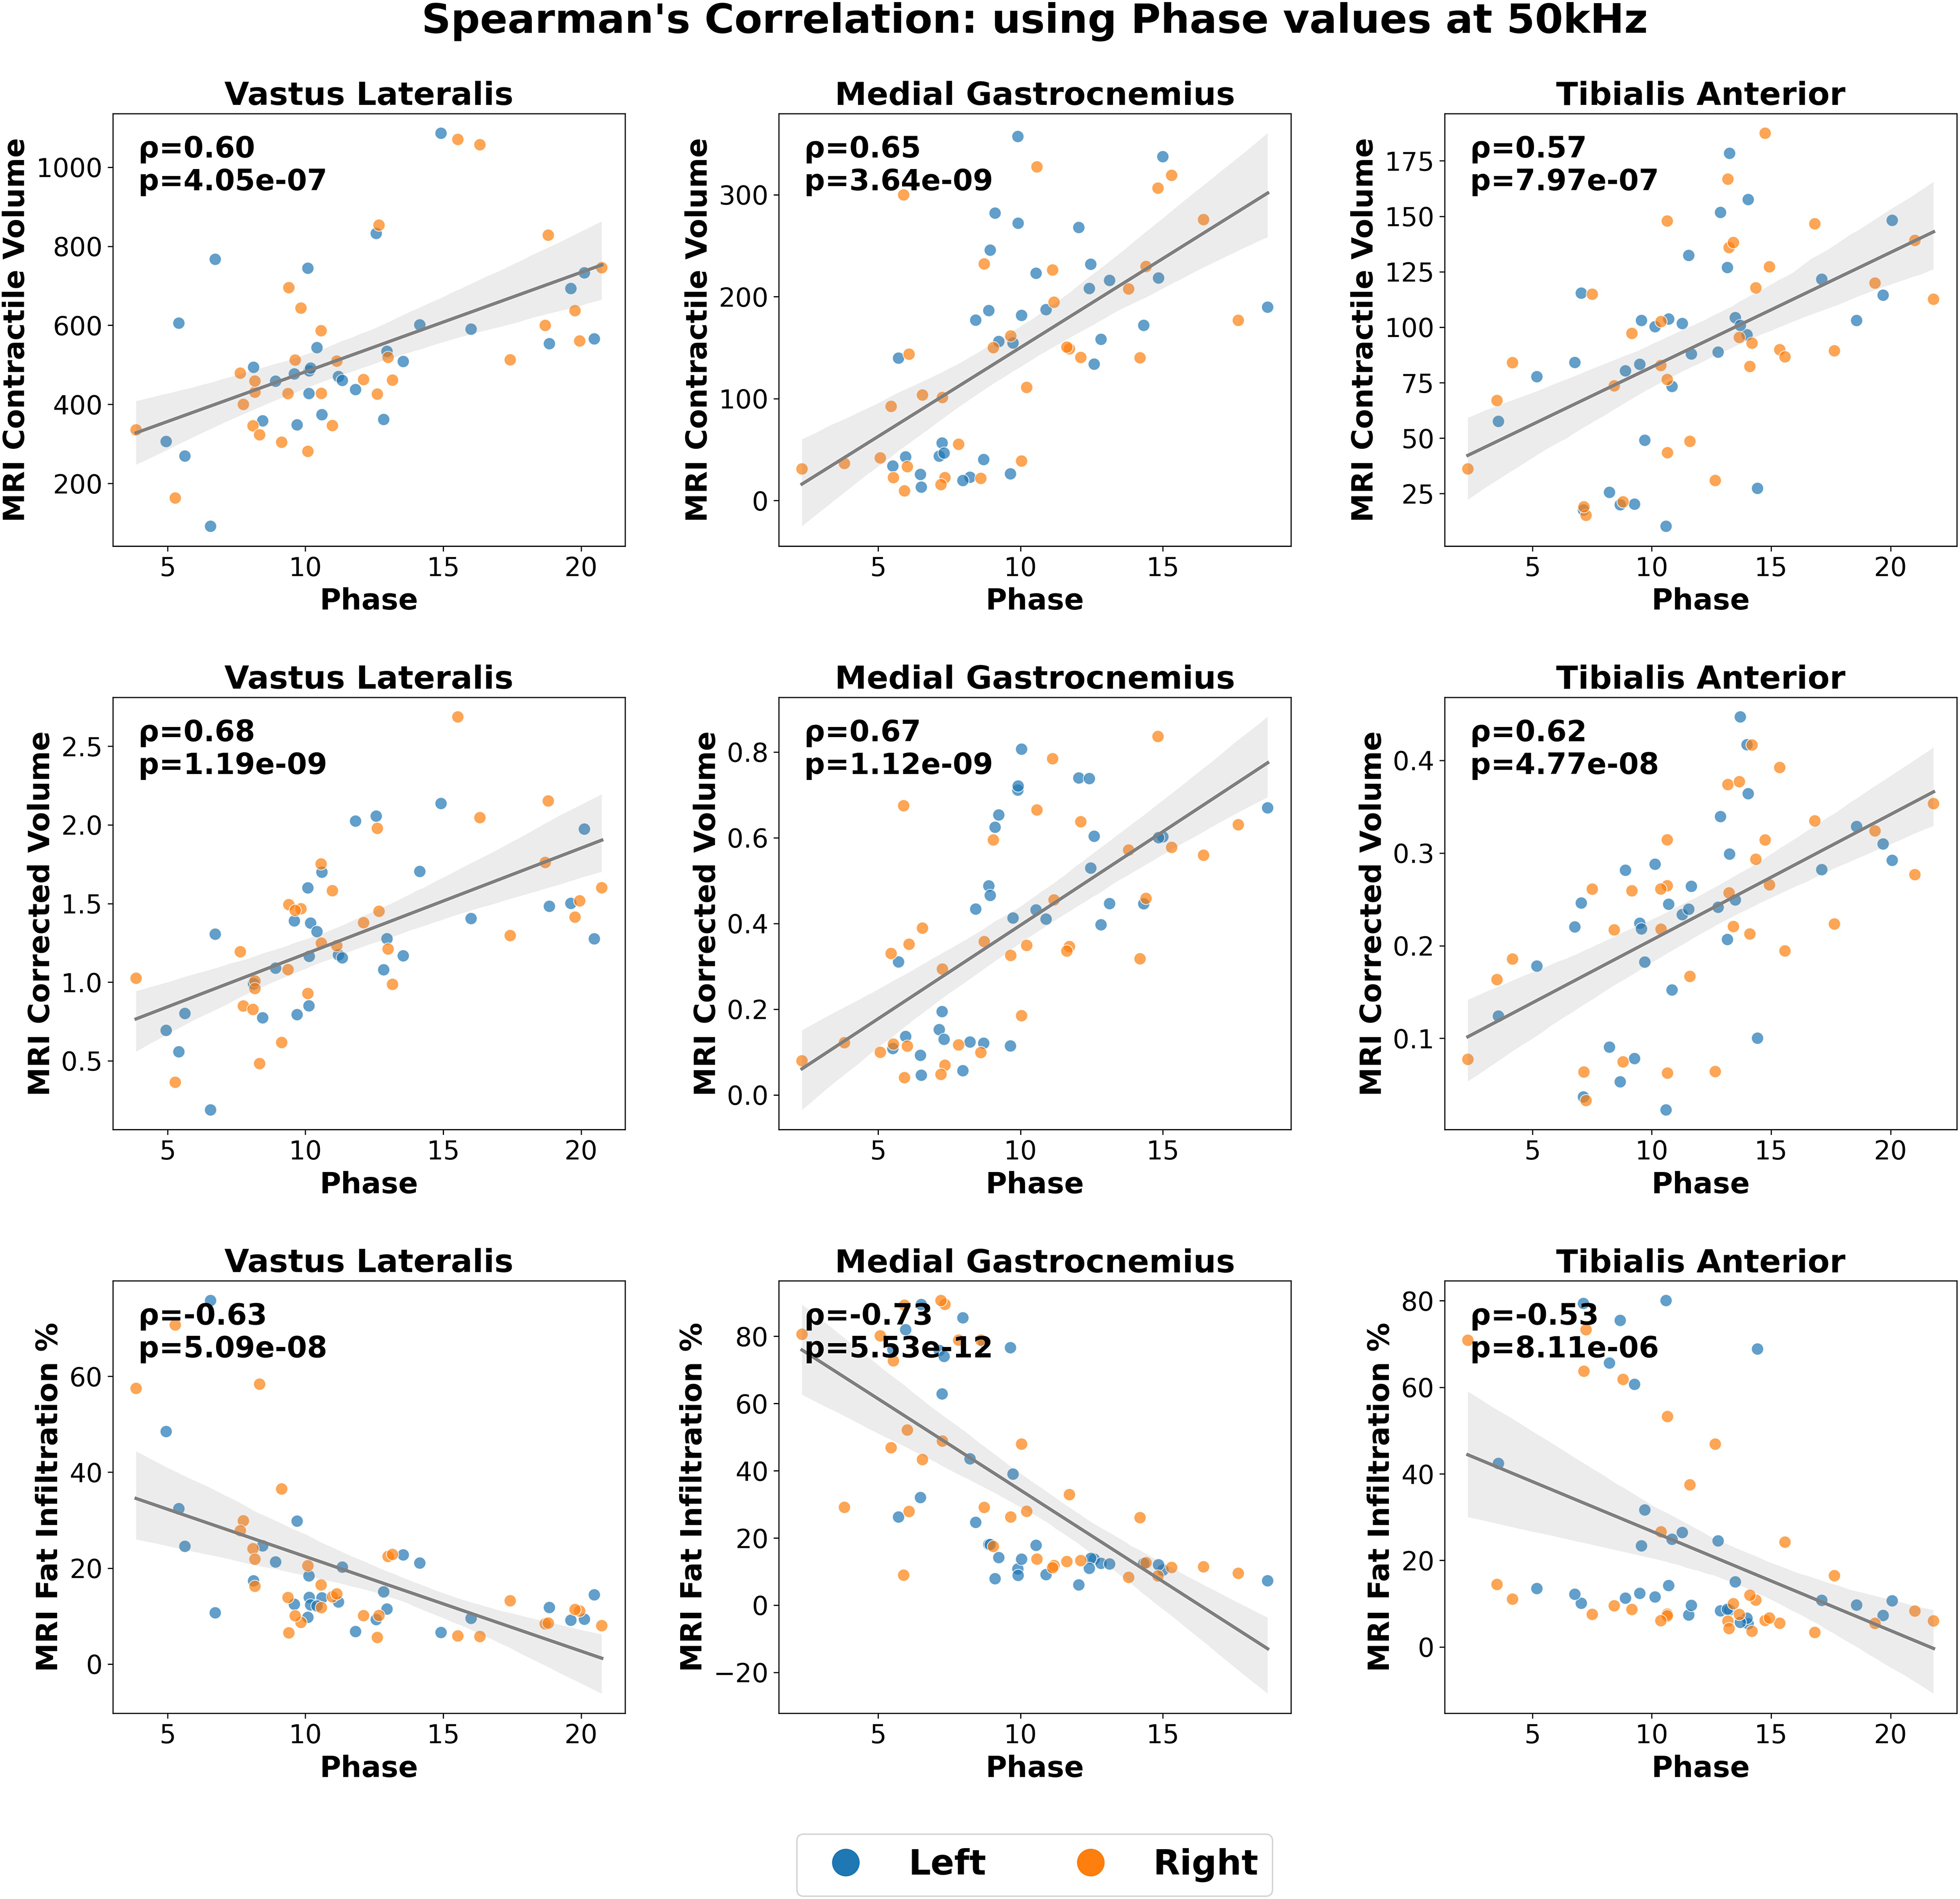
Scatter plot of different MRI metrics (contractile volume, corrected volume, fat fraction percent) versus 50 kHz phase EIM. Orange for right, blue for left side muscle. EIM: Electrical impedance myography; MRI: magnetic resonance imaging.
EIM reactance values were similarly frequency dependent as previously described, with moderate correlation to VL and TA MRI fat fraction percentage at the 50 kHz frequency, but slightly less so at higher frequencies, though the 50 kHz/211 kHz and 100/300 kHz ratios continued to show stronger associations.
EIM resistance measurement is correlated with subcutaneous fat width on MRI
Subcutaneous fat width was calculated for the three muscles bilaterally. A strong correlation between EIM resistance and subcutaneous fat width was found at all frequencies—Spearman
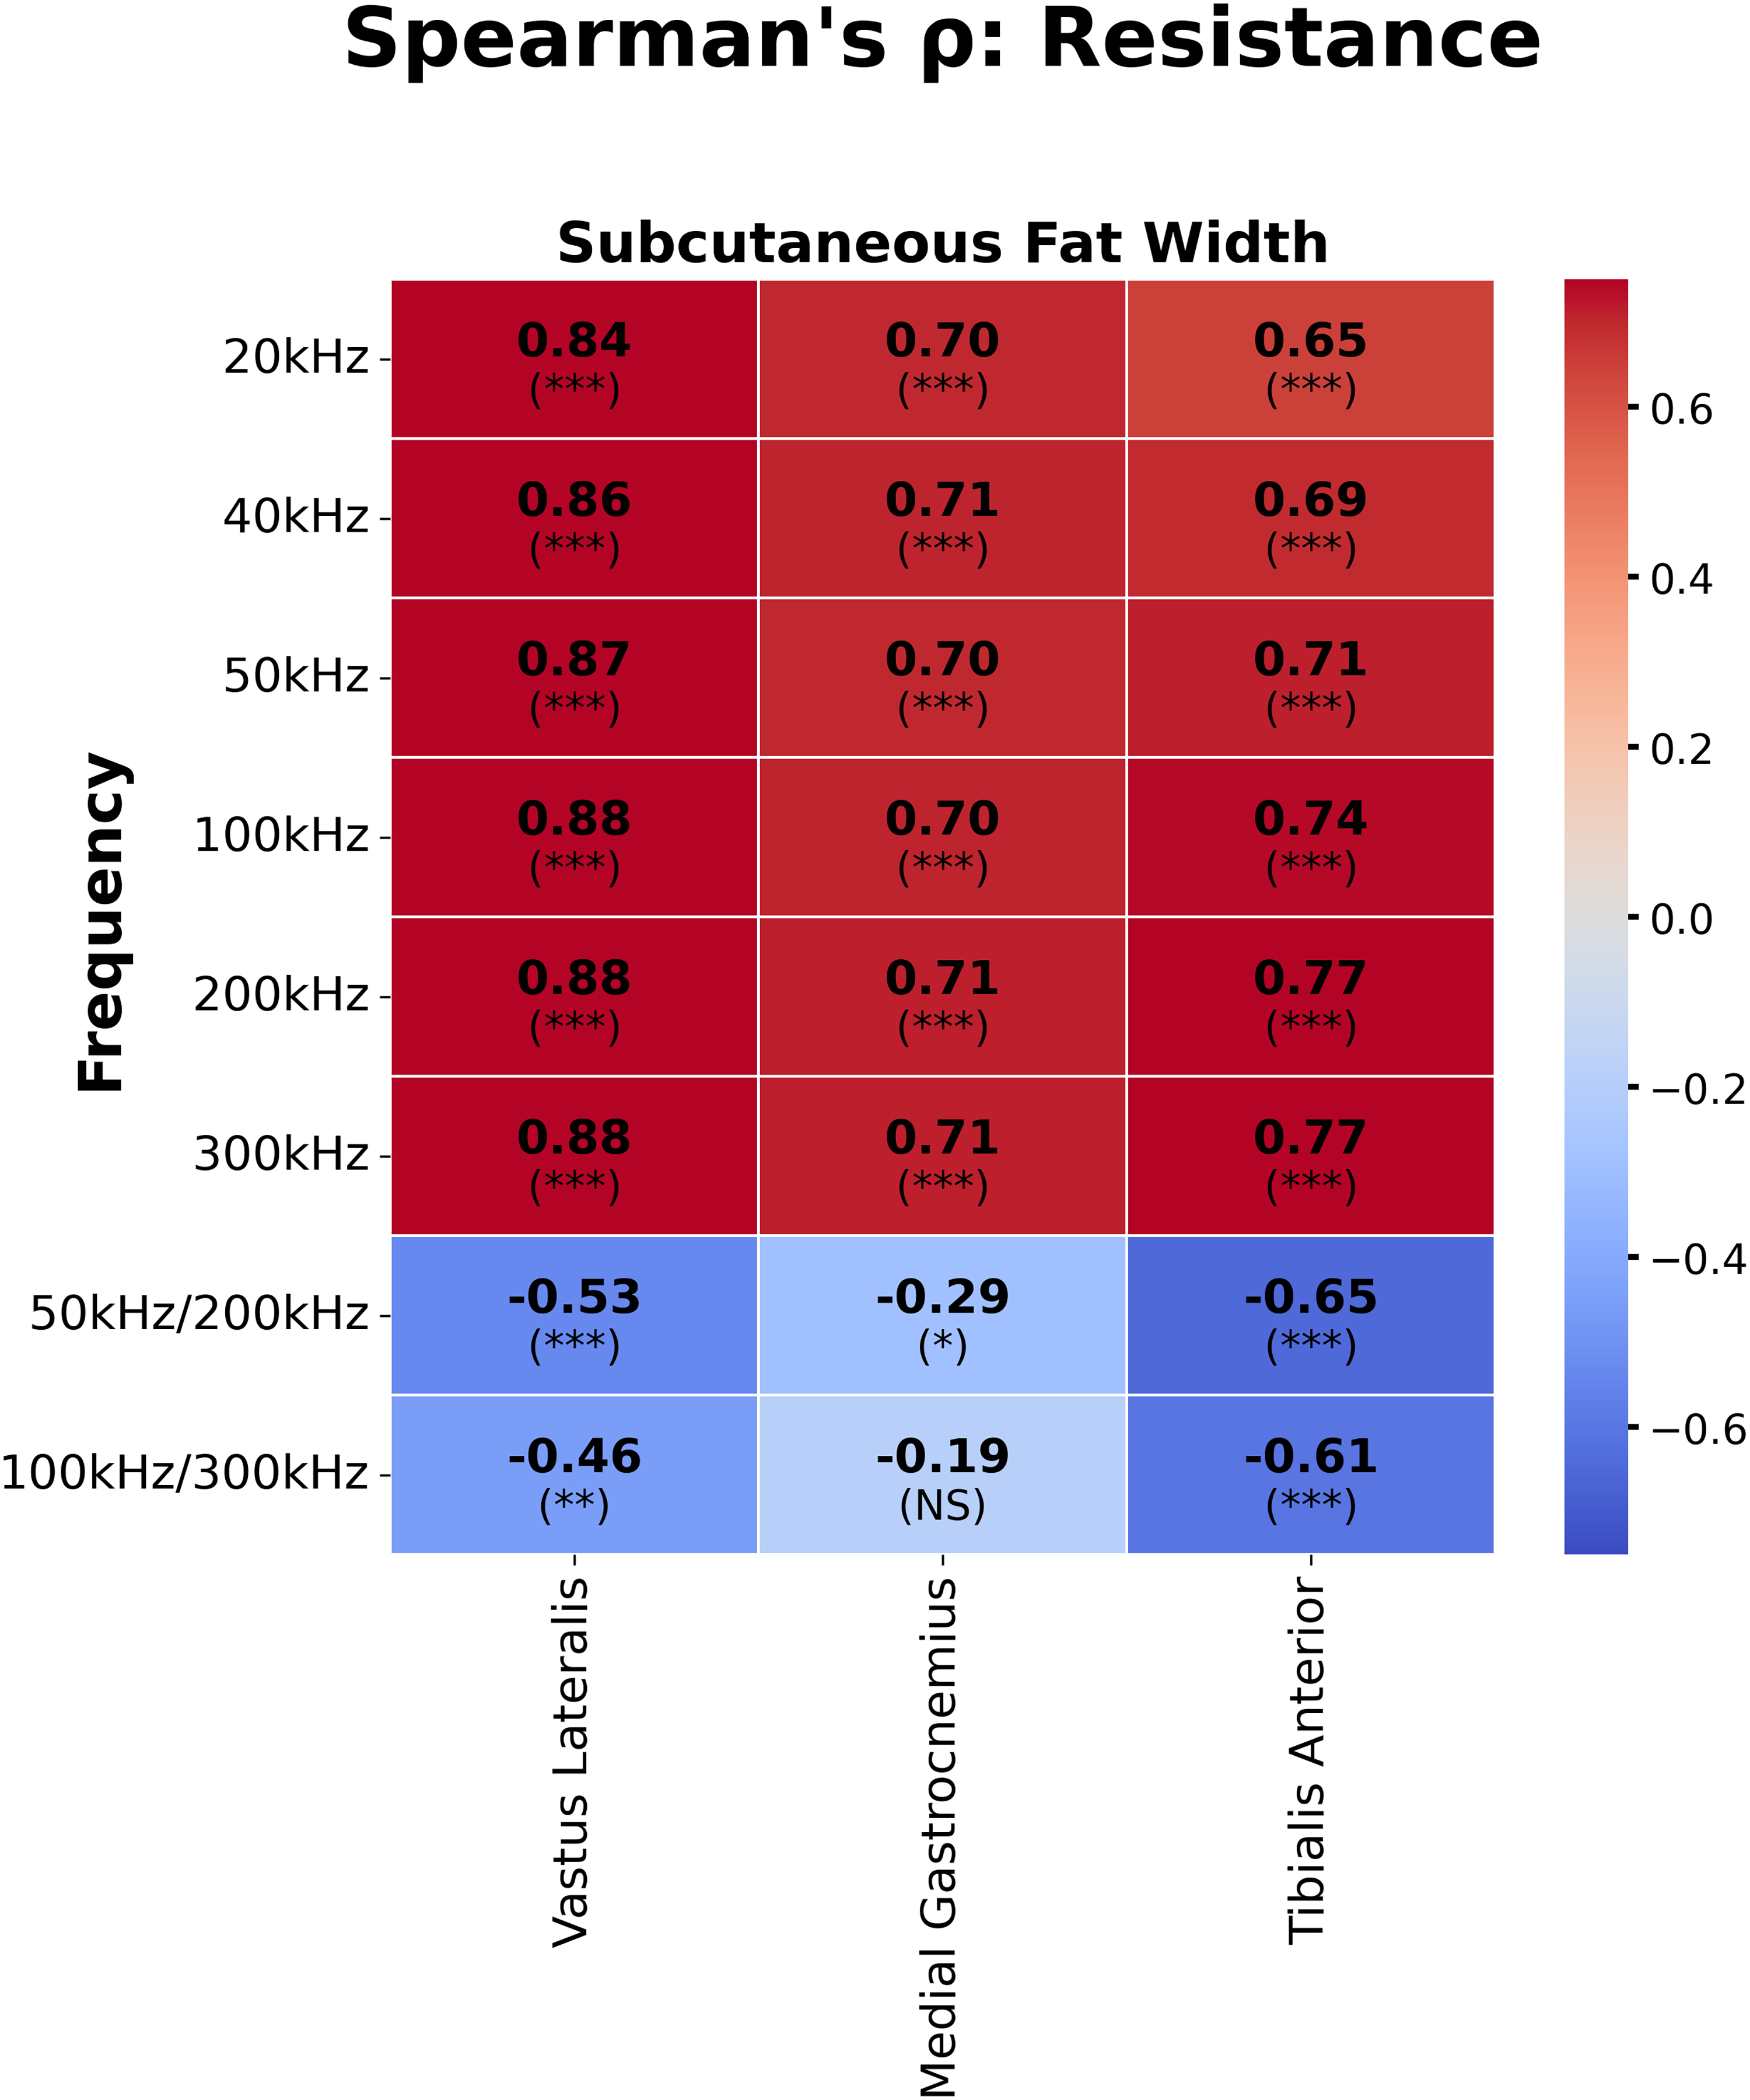
Heatmap presenting the Spearman correlation coefficient and p-values for 20 kHz, 40 kHz, 50 kHz, 100 kHz, 211 kHz, 300 kHz and the ratios of 50 kHz/211 kHz, 100 kHz/300 kHz for subcutaneous fat width using resistance. The heatmap range set to the range of [−1, 1] with
EIM phase values are correlated to muscle strength
VL and TA EIM parameter phase are correlated with strength measured by QMT of knee extension and foot dorsiflexion in 30 participants (Figure 4). When the raw measurement and percent predicted strength normalizing to sex and age were compared to the phase of the EIM, moderate correlations were found throughout the spectrum of the frequencies and at the 50/211 and 100/300 kHz ratios (Figure 4). Reactance and resistance were not consistently associated with strength (Supplemental Figure 1).
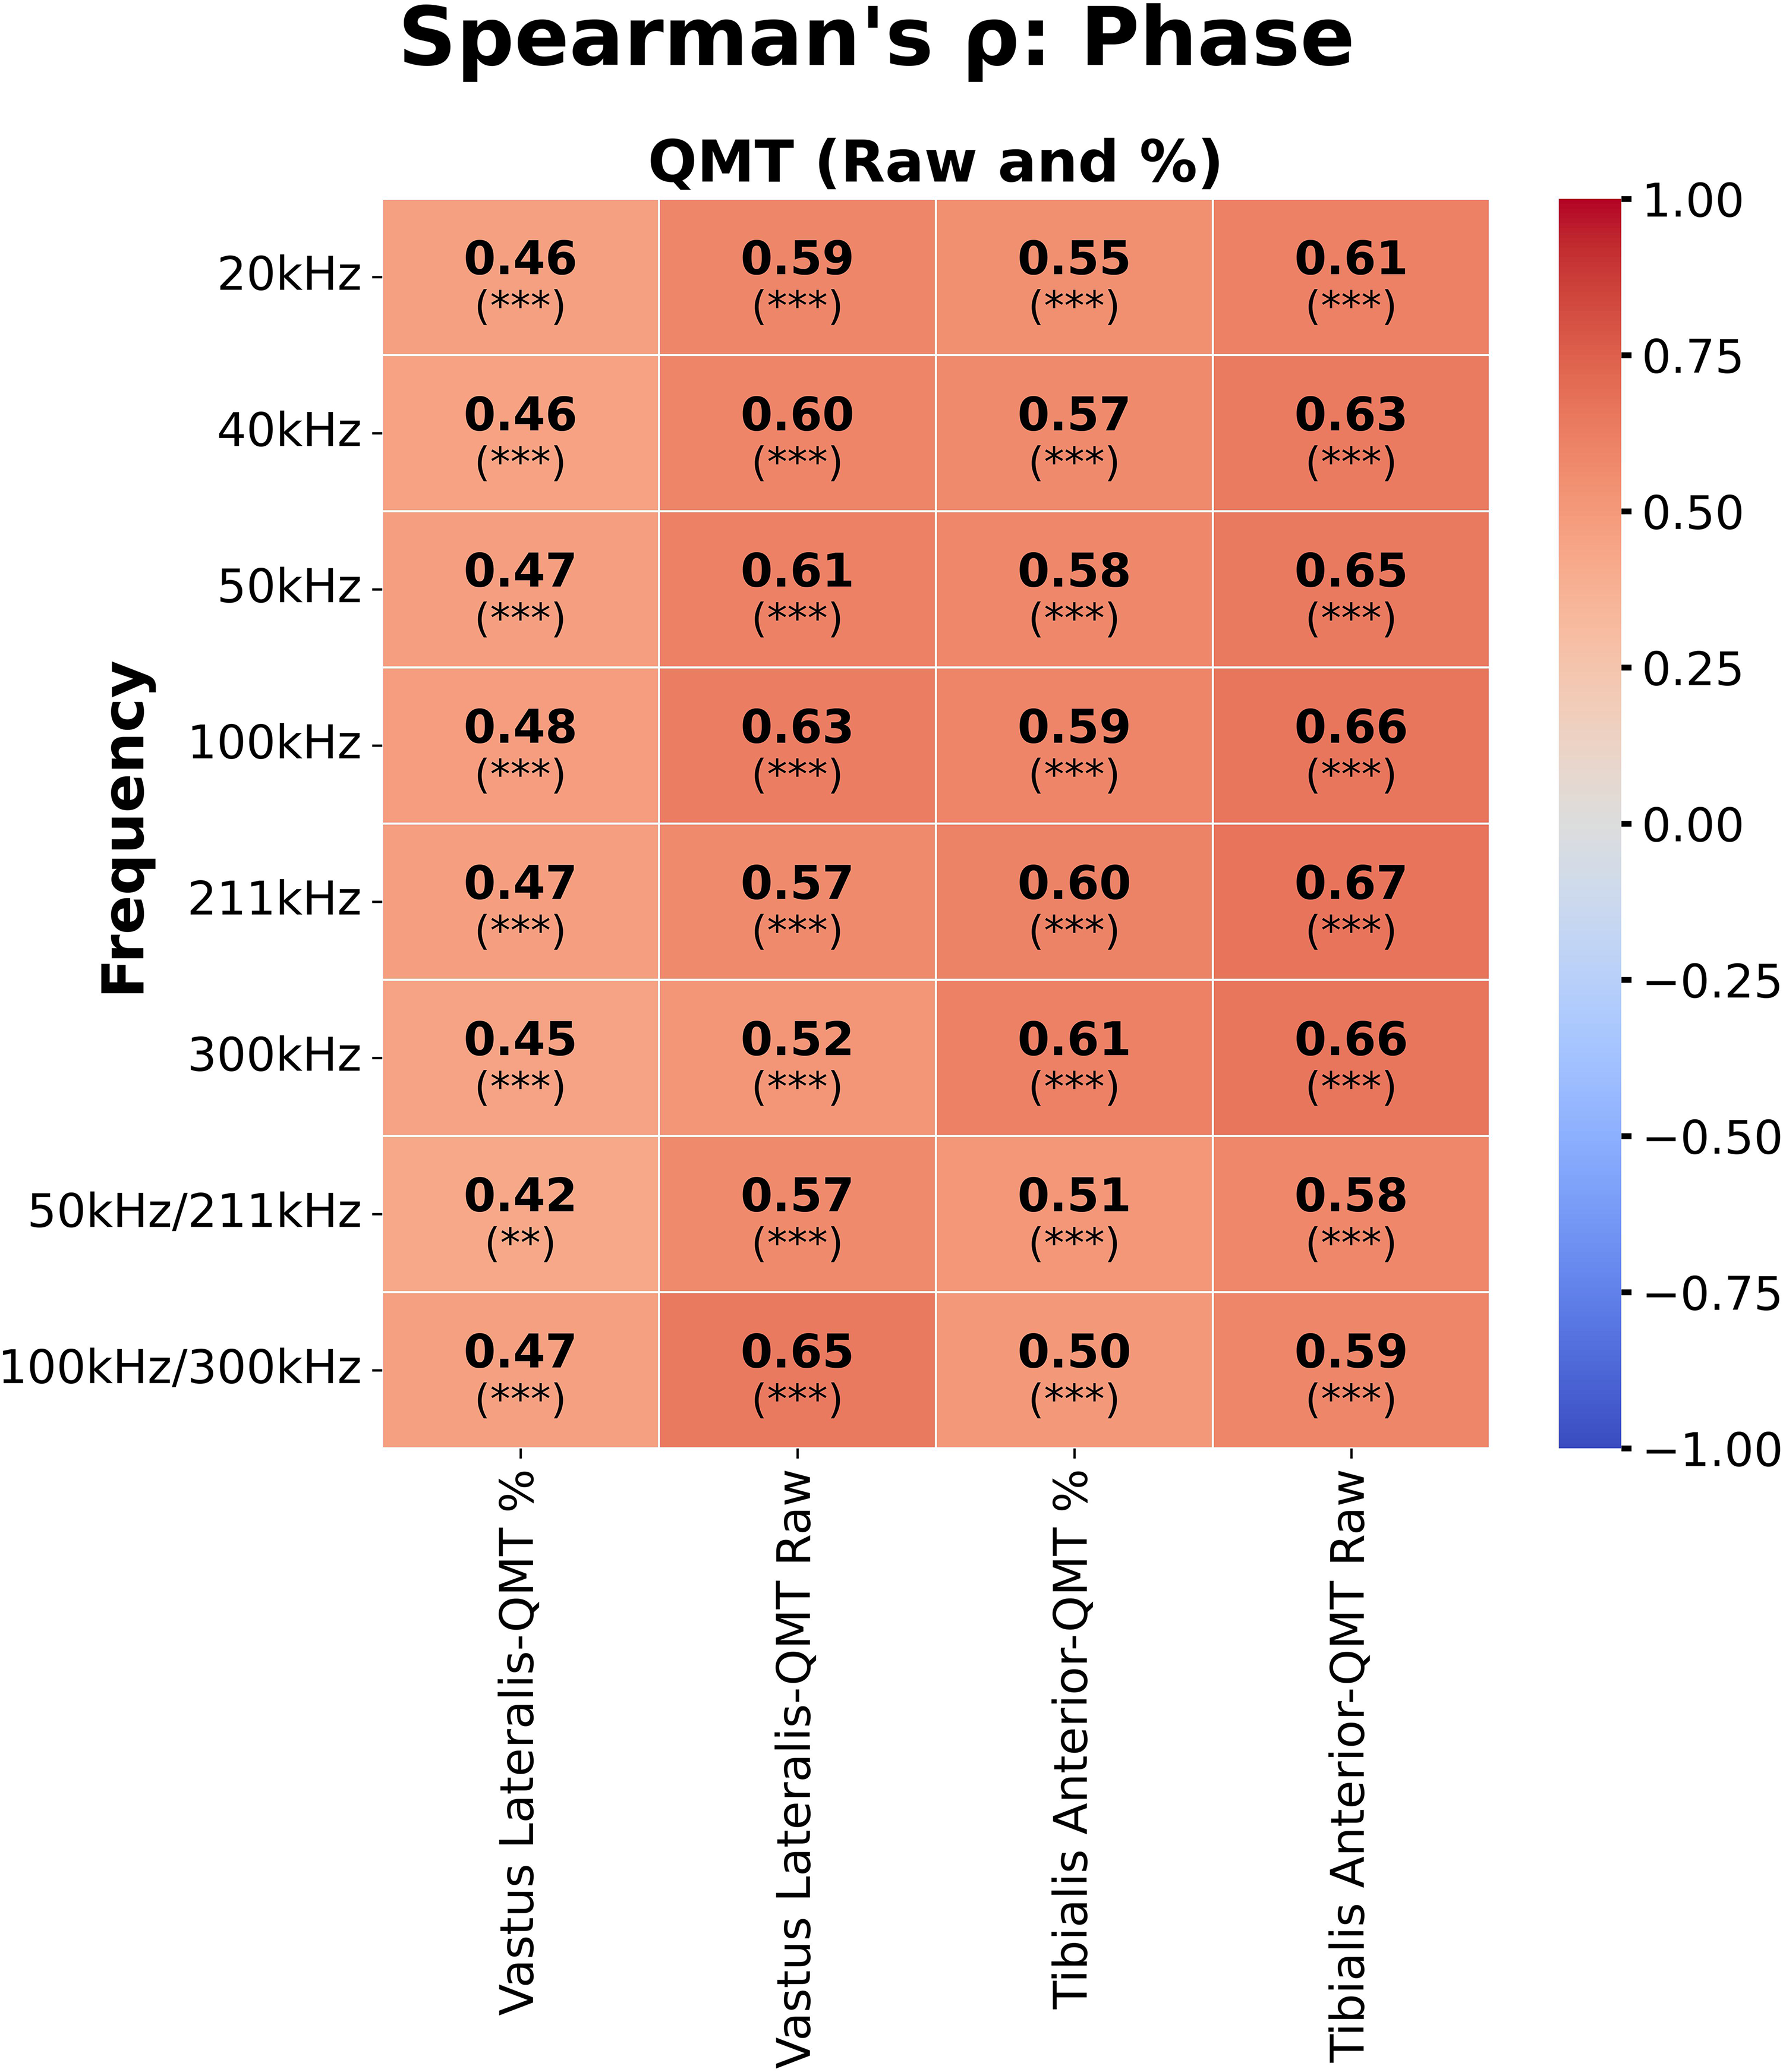
Heatmap presenting the Spearman correlation coefficient and p-values for 20 kHz, 40 kHz, 50 kHz, 100 kHz, 211 kHz, 300 kHz and the ratios of 50 kHz/211 kHz, 100 kHz/300 kHz for QMT metrics (raw and percentile) using phase measurements. The heatmap range set to the range of [−1, 1] with
EIM phase measurement is correlated with muscle structure at the microscopic level of the TA
A subset of patients had bilateral TA biopsies in proximity to the EIM measurements (Supplemental Table 2). EIM was performed prior to the biopsies; the area of the biopsies tended to be in the area of the largest width of the muscle which is also where the EIM was performed. This allowed for the evaluation of the muscle structure through histopathological evaluation (n = 26 on the right and n = 28 on the left) and transcriptomic markers by RNAseq (n = 27 on each side). The semi-quantitative evaluation of fibrosis on histopathology showed a mild negative correlation with the phase (
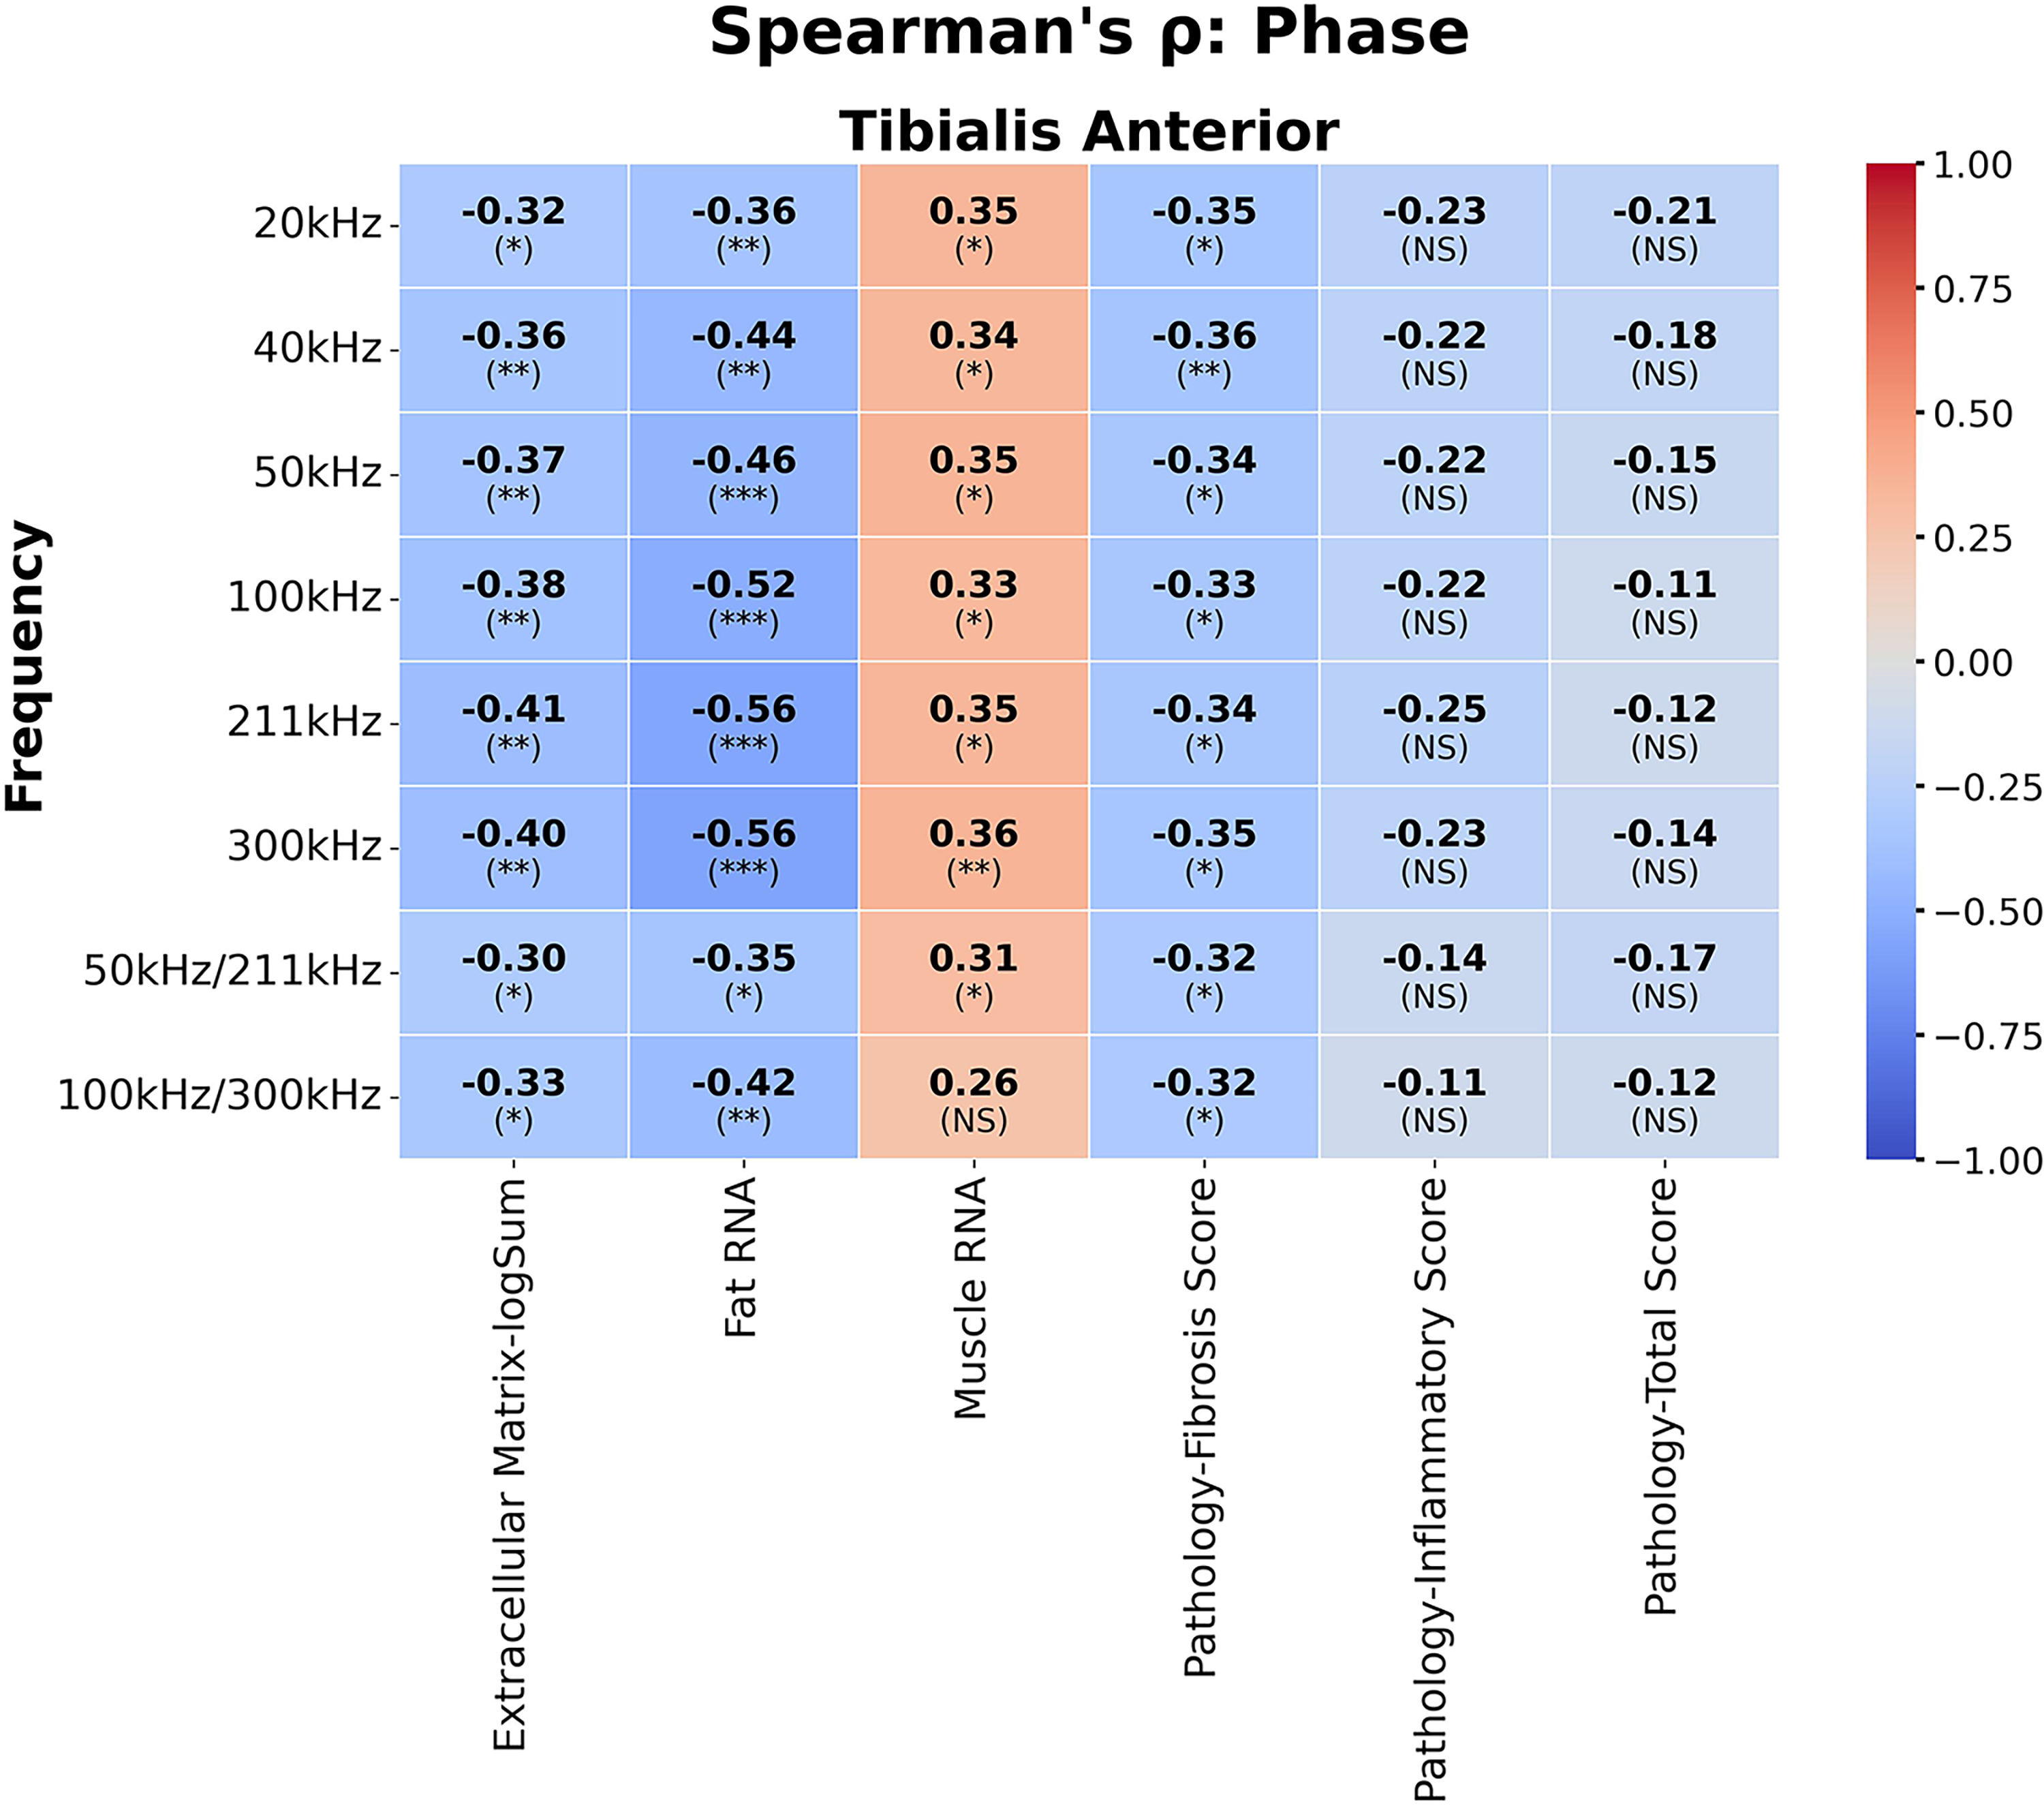
Heatmap presenting the spearman correlation coefficient and p-values for 20 kHz, 40 kHz, 50 kHz, 100 kHz, 211 kHz, 300 kHz and the ratios of 50 kHz/211 kHz, 100 kHz/300 kHz for histopathological and transcriptomic analysis using phase values of the TA. The heatmap range set to the range of [−1, 1] with
Transcriptomic/RNAseq data from the muscle samples allowed for exploratory correlations with EIM parameters. The count of extracellular matrix and fat cell RNAs was negatively associated with phase (
Discussion
This paper expands on the knowledge of the changes seen with EIM in association with muscle pathology in FSHD. EIM, specifically the phase parameter, is associated with the amount and quality of muscle tissue present as measured by strength, MRI, muscle histopathology, and transcriptomic analysis.
We were able to assess the association of EIM parameters with standard measures of muscle health in a more substantial way than previously accomplished. Much of this is possible due to the now readily available tools for processing and analyzing large data sets (MRI and EIM). Artificial intelligence aided delineation of muscle boundaries expanded our ability to measure the amount of muscle versus fat in the muscles we performed EIM on; while in the past a technician would need to painstakingly outline the muscle boundaries across all the MRI slices of specifically designated muscles. Furthermore, this method allowed us to capture a more accurate measure of muscle volume along its longitudinal axis, whereas past studies only measured central areas of the muscle. This is an important advantage because muscle fat infiltration is not uniform in FSHD. 19 Lastly, advanced processing tools facilitate the assessment of various EIM parameters across the full spectrum of frequencies, allowing us to visualize the broader relationship between the EIM parameters with more traditional measurements of muscle health. Ultimately, these tools allow for expansion of similar findings in an earlier smaller FSHD separate cohort, but do so at the individual muscle level. 7 As part of the EIM protocol, EIM was measured at designated places along the length of the muscle, but not always at the central part of the muscle; they are different for the three muscles measured. To be consistent and to provide the best representation of what was measured on EIM, we compared the EIM measurement to the MRI muscle volume of the whole muscle.
In this study, we found the phase to best represent muscle health. The phase is a normalized impedance metric that is the ratio of the resistance and reactance, and is a summation of the capacitive and resistive properties of the tissue. Using the phase parameter helps reduce the effect of alterations due to differences in limb size (e.g., length or volume).
Similarly, our analysis of the strength data by QMT was performed on individual muscles rather than a summation of the whole leg, as reported in the prior FSHD study 7 and a congenital muscular dystrophy study of ambulatory patients. 20
Another new possible contribution our study offers is the association of the histopathological/molecular data with EIM parameters in a single muscle (TA). Greater (healthy) muscle content, as measured by muscle-specific RNAs in the biopsy, was associated with higher phase values. Conversely, increased fat replacement (as measured by fat-specific RNAs), and fibrosis (as measured by fibrosis-specific RNAs and semi-quantitative histopathological grading), were associated with lower phase values. The correlation values for these biopsy-based measurements were weaker, most likely due to the biopsy representing only a small sample of the muscle, which may not reflect the muscle/fat/fibrotic content of the larger area of the muscle measured by EIM. Further validation with more muscle biopsy samples and other measures of muscle health will be needed to determine the utility of using muscle, extracellular cellular matrix, fat total RNA counts in the muscle biopsy sample as measures of muscle health. However, these represent the first direct human muscle-EIM correlations as all previous molecular and histological assessments have only been done in mouse models. 21
The concerns with EIM studies are that each single test results in a large data set including the three parameters (resistance, reactance, and phase), across 41 frequencies from three electrode configurations—for a total of 369 values on a single muscle. This could make the interpretation subject the vagaries of multiple comparisons; however, there was (1) consistency in the correlations across many frequencies; and (2) consistency with prior studies and their defined EIM parameters. In the future, applying machine learning or other approaches to capture the entire multifrequency spectrum behavior could make better use of this large data set. 22
Another limitation of the current study is that the specific electrode arrays used in this study are no longer being produced by the manufacturer (Myolex, Inc). However, all new electrode arrays are incorporating the same basic design of two nested sets of longitudinal electrodes with identical electrode lengths, thicknesses, and inter-electrode distances. The major changes in design have been with the materials being used in the sensors, switching these earlier metallic-carbon coated electrodes (used here) with saline-infused foam or gel electrodes. These earlier versions of the sensors that we used in this study had electrode-skin contact issues, causing artifact, mainly at lower frequencies. Hence, data obtained with newer versions of the array should be comparable to the data presented here but potentially more accurate.
FSHD is not a symmetric muscle disease, and, therefore, we analyzed each muscle in each patient as an independent sample. However, this could lead to overestimation of the ability of EIM to measure muscle composition on a per-muscle/per-patient level.
Knee extension strength is the summation of the rest of the thigh muscles than simply the vastus lateralis and it may be that adding the EIM parameters of the vastus medialis will improve the EIM-strength correlation. A final point related to the vastus lateralis is that the MRIs at the three different sites were not uniform in where to start capturing the top of leg muscles and therefore differing lengths of the vastus lateralis were measured; in potential future studies, whole-body MRIs will cover the whole leg and be able to give us a more complete comparison of the muscle amount of the whole vastus lateralis to the EIM measurements. However, the correlations in our study were strong and are unlikely to alter study conclusions.
In summary, we found that in a human muscle disease, EIM measurements were associated with muscle strength, MRI measurement of muscle volume at the macroscopic level, and muscle histopathological description and RNA content at the microscopic level. Our study gives more specificity on the individual muscle level and provides insight to the molecular and pathological composition of what EIM is measuring. Our study suggests that EIM could be an useful method to assess muscle content and health in FSHD as it can be performed even on patients who cannot tolerate or are ineligible for MRI studies; moreover, it can be used easily in clinic or clinical research center, making it simultaneously convenient and economical. The next step will be to see if EIM the parameters changes longitudinally in the time scale of a clinical trial and the Resolve Natural History Study will provide that information. 23
Supplemental Material
sj-jpg-1-jnd-10.1177_22143602251369246 - Supplemental material for Electrical impedance myography captures features of muscle structure measured by MRI and transcriptomic analysis in facioscapulohumeral muscular dystrophy
Supplemental material, sj-jpg-1-jnd-10.1177_22143602251369246 for Electrical impedance myography captures features of muscle structure measured by MRI and transcriptomic analysis in facioscapulohumeral muscular dystrophy by Leo H Wang, Buket Sonbas Cobb, Lara Riem, Olivia DuCharme, Dennis WW Shaw, Michaela Walker, Katy Eichinger, Leann Lewis, Rabi Tawil, Johanna I Hamel, Karlien Mul, Silvia S Blemker, Stephen J Tapscott, Seth D Friedman, Seward B Rutkove and Jeffrey M Statland in Journal of Neuromuscular Diseases
Supplemental Material
sj-xlsx-2-jnd-10.1177_22143602251369246 - Supplemental material for Electrical impedance myography captures features of muscle structure measured by MRI and transcriptomic analysis in facioscapulohumeral muscular dystrophy
Supplemental material, sj-xlsx-2-jnd-10.1177_22143602251369246 for Electrical impedance myography captures features of muscle structure measured by MRI and transcriptomic analysis in facioscapulohumeral muscular dystrophy by Leo H Wang, Buket Sonbas Cobb, Lara Riem, Olivia DuCharme, Dennis WW Shaw, Michaela Walker, Katy Eichinger, Leann Lewis, Rabi Tawil, Johanna I Hamel, Karlien Mul, Silvia S Blemker, Stephen J Tapscott, Seth D Friedman, Seward B Rutkove and Jeffrey M Statland in Journal of Neuromuscular Diseases
Supplemental Material
sj-xlsx-3-jnd-10.1177_22143602251369246 - Supplemental material for Electrical impedance myography captures features of muscle structure measured by MRI and transcriptomic analysis in facioscapulohumeral muscular dystrophy
Supplemental material, sj-xlsx-3-jnd-10.1177_22143602251369246 for Electrical impedance myography captures features of muscle structure measured by MRI and transcriptomic analysis in facioscapulohumeral muscular dystrophy by Leo H Wang, Buket Sonbas Cobb, Lara Riem, Olivia DuCharme, Dennis WW Shaw, Michaela Walker, Katy Eichinger, Leann Lewis, Rabi Tawil, Johanna I Hamel, Karlien Mul, Silvia S Blemker, Stephen J Tapscott, Seth D Friedman, Seward B Rutkove and Jeffrey M Statland in Journal of Neuromuscular Diseases
Supplemental Material
sj-csv-4-jnd-10.1177_22143602251369246 - Supplemental material for Electrical impedance myography captures features of muscle structure measured by MRI and transcriptomic analysis in facioscapulohumeral muscular dystrophy
Supplemental material, sj-csv-4-jnd-10.1177_22143602251369246 for Electrical impedance myography captures features of muscle structure measured by MRI and transcriptomic analysis in facioscapulohumeral muscular dystrophy by Leo H Wang, Buket Sonbas Cobb, Lara Riem, Olivia DuCharme, Dennis WW Shaw, Michaela Walker, Katy Eichinger, Leann Lewis, Rabi Tawil, Johanna I Hamel, Karlien Mul, Silvia S Blemker, Stephen J Tapscott, Seth D Friedman, Seward B Rutkove and Jeffrey M Statland in Journal of Neuromuscular Diseases
Footnotes
Acknowledgment
We would like to thank the participants for their contributions to our study, as well as the clinical research coordinators and physical therapy evaluators, without whom we would not be able to do our study. Special thanks to TUBITAK (2219-International Postdoctoral Research Fellowship Program for Turkish Citizens) for providing scholarship for postdoctoral studies of Buket Sonbas Cobb.
Funding
The authors disclosed receipt of the following financial support for the research, authorship, and/or publication of this article: This work was supported by the National Institute of Arthritis and Musculoskeletal and Skin Diseases (grant number 2P50AR065139-05) and Friends of FSH Research.
Declaration of conflicting interests
LHW reports consultancy/advisory board for Fulcrum Therapeutics, Argenx, and data safety monitoring board for Scholar Rock. KE has served on advisory boards or has received consulting fees from Biogen, Acceleron, PTC, Ionis Pharmaceuticals, Fulcrum Therapeutics, Dyne Therapeutics, Avidity Biosciences and Roche. RNT reports consultancy with Fulcrum Therapeutics, Arrowhead, Dyne Therapeutics, Acceleron, MT Pharma, miRecule, and Roche Pharma. JS receives grant funding from NINDS, MDA, FSHD Society, Friends of FSH Research, CDC, and FSHD Canada; and has served as consultant for Arrowhead, ML Bio, MT Pharma, Epic Bio, Armatus; served on a Scientific Advisory board for Dyne Therapeutics, Avidity, Fulcrum Therapeutics, Roche, Vertex, Vita Therapeutics; and received options from Dyne. SDF consults with Avidity, Fulcrum, EPIC Bio, Dyne, Kate Therapeutics, and receives grant funding from Friends of FSH Research. JH serves as a member of the clinical advisory board for Vertex Pharmaceuticals, Dyne Therapeutics and serves as principal investigator for Pepgen. KM has served as a paid consultant to Avidity Biosciences and Dyne Therapeutics. All other authors not mentioned report no disclosures.
Data availability
The data supporting the findings of this study are available within the article and/or its supplementary material.
Supplemental material
Supplemental material for this article is available online.
References
Supplementary Material
Please find the following supplemental material available below.
For Open Access articles published under a Creative Commons License, all supplemental material carries the same license as the article it is associated with.
For non-Open Access articles published, all supplemental material carries a non-exclusive license, and permission requests for re-use of supplemental material or any part of supplemental material shall be sent directly to the copyright owner as specified in the copyright notice associated with the article.