
Abstract
With advancements in soccer analytics, considerable attention has been devoted to developing sophisticated measures for quality scoring opportunities - such as expected goals and expected threat. Far less effort, however, has gone toward adjusting these and other performance metrics for game context, including factors like score and red card differential. It is well known that certain match scenarios prompt systematic tactical adjustments - for example, teams often defend more conservatively when leading or playing shorthanded. In this study, we employ generalized additive mixed-effects models (GAMMs) on minute-by-minute match event data from Europe’s five major leagues to quantify how such contextual variables influence offensive production metrics like shots on target and expected goals. This approach allows us to estimate global effects of contextual variables on offensive production, while also allowing for league-specific distinctions to be captured via random effects. We then use these estimates to adjust observed team statistics, projecting each team’s performance onto a standardized baseline scenario - a tied home game played at even manpower. We believe the resulting adjusted measures to better isolate underlying team quality by removing distortions arising from transient tactical responses to game state, thereby providing improved inputs for downstream analytical and predictive tasks.
Introduction
Soccer performance metrics are often interpreted without accounting for the tactical context in which they are generated. For example, teams leading in score may deliberately concede possession and prioritize defensive organization, while teams trailing may increase attacking pressure and accept greater defensive risk. Such strategic adjustments are widely recognized in the sports science, acknowledging that match situation influences team behavior and statistical output (Bradley et al., 2014; Lago-Ballesteros et al., 2012; Lago-Peñas, 2012). As a result, raw totals of shots, expected goals (xG), or other offensive statistics can reflect not only underlying team strength but also the strategic responses induced by the evolving game state.
In our earlier work (Skripnikov et al., 2025) we developed an adjustment framework to account for such contextual factors when interpreting shot attempts and corner kicks. By projecting observed offensive outputs onto a standardized baseline game state, we demonstrated that contextual adjustments yield statistics that align more closely with intuitive indicators of team quality such as league standings, while also improving forecasting performance when used as predictive features. These findings suggest that unadjusted match statistics may systematically misrepresent team performance when tactical responses to score differential or manpower imbalances are not taken into account.
In this study, we extend that approach to two widely used performance metrics: expected goals (xG) and shots on target. xG, in particular, has become a central tool in soccer analytics (Cefis and Carpita, 2025; FBref, 2024; Hudl StatsBomb, n.d.), providing a probabilistic measure of shot quality that incorporates features such as shot location (e.g., distance to goal and angle), body part (e.g., right or left foot, header), shot situation (e.g., open play, penalty, free kick), pre-shot dynamics (e.g., pass type), and the positioning of defenders and the goalkeeper. More broadly, expected-value frameworks have become common across sports analytics, including expected goals models in hockey (Macdonald, 2012), expected possession value models in rugby (Kempton et al., 2016), and expected points frameworks in American football (Yurko et al., 2019). Within soccer, recent research has further expanded the context-sensitive evaluation of on-ball actions, including the introduction of the expected threat (xT) framework to assign value to individual passes (Hassani et al., 2025; Power et al., 2017; Singh, 2018), as well as extensions of the expected goals framework that assign a scoring probability to any match situation (often referred to as “dangerousity”), rather than only to instances in which a shot is taken (Link et al., 2016).
Despite these advances, relatively little work has focused on adjusting aggregate performance metrics for the contextual factors that shape tactical behavior during a match. While modern analytics increasingly models the value of individual actions conditional on context, statistics such as total xG or shots on target are still frequently interpreted without explicitly accounting for the score differential, red cards, or time remaining that may strongly influence how teams approach the game. As a result, these widely used metrics may partially reflect strategic game management rather than underlying offensive ability.
To address this issue, we estimate the effects of key contextual variables - including score differential, manpower differential, time remaining, and win probability differential - on minute-by-minute offensive production using generalized additive mixed-effects models (GAMMs). The models are fitted to match event data from Europe’s five major leagues and allow both global effects and league-specific deviations to be estimated through random effects. Using these estimates, we construct adjusted statistics by projecting observed team performance onto a standardized baseline scenario: a tied home game played at even manpower.
These adjustments have several practical applications. First, they provide analysts and researchers with performance metrics that more closely reflect underlying team quality rather than tactical responses to temporary match conditions. Second, they improve predictive modeling by producing features that are less confounded by game-state effects. Third, they offer practitioners - including coaches, performance analysts, and commentators - tools for interpreting match statistics more accurately, particularly in situations where a team that is protecting a lead may appear statistically outplayed despite executing its tactical strategy effectively.
This paper differs from our earlier work in several key respects. First, data availability was more limited, with xG and shots on target obtainable from fbref.com (FBref, 2024) only beginning in the 2017
It is important to note that, although the xG model described in Hudl StatsBomb (n.d.) may implicitly capture some aspects of tactical behavior - such as player positioning, which can reflect whether a team is adopting a more defensive approach - it does not explicitly account for score differential or red card differential. These factors represent pivotal aspects of game context that might incentivize, or even force, a team into playing a certain way, as opposed to naturally pursuing a certain tactical approach. Moreover, even when compared to advanced xG models that do incorporate score and red card differential directly into the expected goal probability calculation (e.g., Cefis and Carpita, 2025), our adjustment approach still offers a distinct perspective. Such advanced xG models primarily aim to improve the accuracy of shot-level scoring probabilities by enriching the feature set used to estimate xG. In contrast, we treat xG as an input metric and focus on adjusting its aggregated values for game context. This distinction is intentional. Our objective is not to modify the underlying estimate of shot quality, but rather to account for systematic changes in team behavior - such as increased attacking intensity when trailing or more conservative play when leading - that affect the volume and circumstances under which shots are generated. An advantage of this framework is that it is largely model-agnostic and can be applied to xG values produced by any underlying model. At the same time, it preserves a clear conceptual separation between shot quality estimation and the tactical factors that influence offensive production during a match.
Methods
Data collection
We compiled minute-by-minute data from 2017
To reduce instability at distributional extremes, which tended to result from low sample size of available data at those extremes, we winsorized the key covariates as follows: score differentials of
Modeling framework
We modeled minute-level outputs (xG or shots on target) using generalized additive mixed models (GAMMs) (Wood, 2017), which flexibly capture nonlinear relationships between outcomes and contextual covariates, while also allowing for seamless interpretation, statistical inference, and accommodation of random effects. Candidate distributions included Gaussian, Tweedie (to handle excess zeros in xG), and Poisson-family models for comparison. In particular, for modeling continuous variable xG, we considered Gaussian with identity and log links, and Tweedie with log link. To model the count variable of shots on target, we considered Poisson-family models such as regular Poisson, Negative Biomial and Zero-Inflated Poisson.
The unified model encompassing all five leagues under consideration was specified as follows (on the example of Tweedie with log link for xG). Let
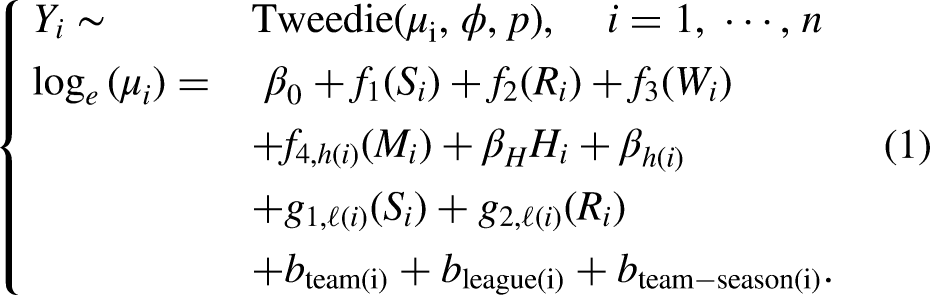
Here,
To model the number of shots on target, we utilize a fully identical systematic component (log-link, with the same linear function of predictors), only changing the distributional assumption on the response variable. For example, for Negative Binomial it would be:
This shared specification of the systematic component from (1) simultaneously estimates global effects (averaging across leagues) and league-specific adjustments, with the global estimates emphasized for subsequent use due to their greater stability. Model parameters were estimated using penalized likelihood methods as implemented in the
For computational efficiency with large datasets, models were fitted using the
Model selection
When selecting the most appropriate model, we leveraged DHARMa (Hartig and Hartig, 2017) for goodness-of-fit testing. It provided quantile-quantile and residuals-vs-fitted plots, along with a handful of diagnostic tests (Kolmogorov Smirnov uniformity test, outlier test, overdispersion and zero-inflation tests, residual quartile tests). Due to xG being continuous and exhibiting high prevalence of zero values at the minute level, we considered Gaussian and Tweedie response models. For shots on target, we stuck with the Poisson-family approaches much like in our previous work (Skripnikov et al., 2025). We carried out concurvity checks for the main covariates under consideration, identifying no notable concerns (see supplementary materials for more detail). Lastly, in supplementary materials we also provide leave-one-season-out (LOSO) cross-validation results, with the main idea borrowed from Yurko et al. (2019), to test the out-of-sample performance of the models under consideration, thereby confirming that there is no overfitting.
Adjustment procedure
The adjustment procedure follows the principle of projecting observed outcomes onto a standardized baseline game state: a tied home game played at even strength (hence, both the score and red card differentials are equal to 0). Let

No adjustment is applied for win probability differential or game minute, as these reflect inherent team strength and match timing rather than tactical asymmetries. Instead, they are included in the model simply to control for confounding.
Forecasting performance testing
To assess whether our adjustments improve predictive accuracy, we evaluated their performance in forecasting score differentials using a multiple linear regression model. The forecasting model included just two predictors - the home and away teams’ statistic values (e.g., xG per game) - with the home team’s final score differential as the response. For each season, we trained the model on the first 50% of games (
Results and discussion
Model selection
After fitting models separately for each of the six seasons, we evaluated model adequacy using residual diagnostics (tests for uniformity, outlier, overdispersion, zero-inflation, and residual quartiles). Because each fit combined all five leagues and involved approximately 350,000 observations per season, most formal tests detected statistically significant deviations even when practical deviations were small. We therefore focused primarily on the magnitude of the test statistics and the consistency of diagnostic outcomes across seasons, unless certain models actually yielded large p-values even despite the large sample size.
For the minute-by-minute xG models, Gaussian, Log-Normal, and Tweedie specifications all showed statistically significant uniformity and residual deviations in every season (satisfying assumptions in 0/6 seasons). However, the magnitude of the deviations differed substantially across models. The Tweedie model showed much smaller departures from uniformity, with an average deviation statistic of approximately 0.05 compared with roughly 0.30 for the Gaussian and Log-Normal alternatives, and similarly smaller deviations in residual quartile diagnostics. Overall, the Tweedie specification consistently provided the closest approximation to the observed residual distribution across seasons.
For the shots-on-target models (Poisson, Negative Binomial, and Zero-Inflated Poisson), uniformity and outlier tests were also statistically significant in all seasons (satisfying assumptions in 0/6 seasons), but the associated test statistics in each model were small (close to
Taken together, these diagnostics indicate that the Tweedie distribution provides the most appropriate specification for modeling minute-by-minute xG, while the Negative Binomial distribution provides the best fit for shots on target. The fitted Tweedie model yielded an estimated variance power parameter of
Additional diagnostic plots and detailed results for each test are provided in the supplementary materials.
Nature of estimated effects
On Figure 1 we introduce the nature of effects that score and red card differential have on xG and shots on target, respectively. Those effect displays were generated as predictions of per-minute rates from the log-link Tweedie (xG) and Negative Binomial (shots on target) GAMM.

Top row: Nature of effects of score difference (left) and red card difference (right) on the expected goals, estimated via Tweedie Generalized Additive Mixed-Effects Model. Bottom row: Nature of effects of score difference (left) and red card difference (right) on the shots on target, estimated via Negative Binomial Generalized Additive Mixed-Effects Model. Covering the time period between 2017/18 and 2022/23 seasons, each curve represents one of five major European soccer leagues, along with the global effect (averaged over those five leagues). The y-axis is on the scale of linear predictor (log-response). The extreme predictor values (
Judging by the global effect, one can witness a mostly monotonic negative trend for both the score and red card differentials, which aligns with the intuition. When teams trail in score, they tend to play more offensively, naturally resulting in accumulating higher xG values and more shots on target. Conversely, teams leading in score start prioritizing defense in an effort to protect the lead, hence sacrificing some of the offensive production.
As for the red card differential effect, it is a rather predictable decrease in volume and quality of scoring opportunities for teams playing with fewer men, i.e. more red cards. Playing shorthanded virtually always forces a team into a more defensive playing style simply due to lack of manpower.
One can also witness slight deviations of each respective league from the global effect. For example, English Premier League and German Bundesliga seem to showcase the lowest impact of score differential on offensive outputs, with flatter curves compared to other leagues. Italian Serie A, on the other hand, exhibits the largest drop-off in xG and shots on target as a team goes from trailing to leading in score. The random effects capturing these league-specific deviations were found to be statistically significant at the 0.05 level.
Statistical adjustment
Tables 1 and 2 provide the multiplicative coefficients used for statistical adjustment to project team outputs onto a shared scenario of a tied game played at home at even strength. These coefficients were derived from the estimates of fixed global effects from 1 for the respective variable, i.e.,
Multiplicative coefficients for expected goals and shots on target generated during respective score differentials to project those on the scenario of a tied game with equal number of men, along with 95% confidence intervals. Based on fixed global estimates of score differential effect.

Multiplicative coefficients for expected goals and shots on target generated during respective red card differentials to project those on the scenario of a tied game with equal number of men, along with 95% confidence intervals. Based on fixed global estimates of red card differential effect.

Shots and scoring opportunities generated in conducive game circumstances, such as trailing in score or having a man advantage, get penalized via multiplication by a coefficient lower than 1. Conversely, teams that keep producing shots and expected goals despite already leading in score or playing shorthanded, get rewarded via multiplication by coefficients higher than 1. For example, xG and shots on target generated when in the lead are up-weighted by 6
Tables 3 and 4 list the matches where our adjustment procedure produced the most extreme increases and decreases in expected goals (xG) and shots on target within each respective league over the six seasons under consideration. For each match, we also report when the relevant chances occurred, split by whether the team was ahead or behind on the scoreboard, and whether they had more or fewer players on the field. This context helps explain why the adjustments move in the direction they do.
Individual games across 2018

Individual games across 2018

The upward adjustments (top half of each table) are concentrated in games where teams managed to create chances despite playing under conditions that normally depress attacking output-most often while already holding a lead or while down in men. Because our framework projects all events onto a baseline state of an even scoreline with equal manpower, numbers accumulated during these circumstances get scaled upward.
A clear illustration comes from Bayern Munich’s 2020/21 match against Stuttgart in the German Bundesliga. Their raw xG total of 2.4 was boosted to 4.7 (
Similar stories played out for most other matches with a team experiencing a strong positive shift in both Tables 3 and 4, except for Toulouse vs Nice and Villareal vs Celta in Table 3. Those two matches showcase how playing at a heavy man disadvantage (i.e., down at least 2 men) can result in a notable adjustment even despite the teams trailing most of the game. Toulouse generated 2.3 of their 2.6 expected goals while trailing by one or more goals, but 2.2 of those also came when they were down one or two men, resulting in an upwards adjustment from 2.6 to 5.8 (
The downward shifts (bottom halves of the tables) generally involve sides that accumulated their chances in highly favorable circumstances-trailing on the scoreboard while enjoying a numerical advantage due to opponent’s red cards. Because those contexts tend to inflate raw attacking statistics, our adjustment procedure discounts them when projecting back to the neutral baseline.
Bordeaux’s 2021/22 home loss to Montpellier is the starkest example. Their recorded 3.5 xG collapsed to just 1.6 (
Most other examples of the strongest negative shifts fit the same mold, except for a few matches in Table 3. In particular, Manchester United, RB Leipzig and Atalanta all generated a good chunk of their xG’s when actually leading in score, but an even larger portion of their xG’s came with a one-man advantage (or, in case of Manchester United, even a two-man advantage at times). So, even despite the scoring context not being conducive to producing xG’s - which tends to result in an upward projection by our adjustment mechanism - the man advantage still outweighs it, leading to a strong downward projection overall. That reaffirms the higher magnitude of the impact that red card differential has on the offensive production as opposed to the scoring differential, as could be seen back on Figure 1.
Two themes emerge across the adjustments. First, the biggest positive corrections favor teams that sustained pressure while facing constraints-often when leading by multiple goals with fewer players. Second, the largest downward corrections fall on teams that relied heavily on favorable contexts to amass their statistics, such as long stretches with an extra player while already behind. It’s important to note that our results highlighted absolute shifts rather than percentage changes, so they naturally emphasize games with relatively high raw totals (e.g.,
Forecasting performance comparison
Figure 2 presents the results of the paired

Paired
Conclusions and future work
This study developed and validated a framework for adjusting soccer performance metrics to account for tactical context, using generalized additive mixed models (GAMMs) applied to minute-level match data from Europe’s top five leagues. By explicitly modeling how score differential, red cards, and home advantage influence offensive production, we derived multiplicative adjustment factors that project observed statistics onto a standardized baseline game state-tied score, even strength, and home venue. This yields more comparable estimates of team quality and attacking efficiency, disentangled from temporary tactical behaviors or match-specific circumstances.
Our findings demonstrate that contextual adjustments meaningfully alter both the interpretation and predictive value of key statistics. Expected goals and shots on target both exhibit strong nonlinear responses to game state: output rises sharply when teams trail or gain a manpower advantage, and declines when leading or playing shorthanded. Applying our adjustments systematically reduced this tactical bias, improving the stability and forecasting accuracy of performance-based models across seasons and leagues. In short, accounting for situational context not only aligns better with intuitive assessments of team strength but also enhances predictive utility in downstream applications such as match outcome modeling or performance benchmarking.
At a conceptual level, this work contributes to the growing body of evidence that game-state awareness is essential in sports analytics. Much like pace- or possession-adjusted statistics in basketball or hockey, context-corrected xG and shot metrics provide a fairer basis for comparison and deeper insight into true team capability. It can help practitioners - coaches, analysts, talent evaluators, and commentators - as well as informed fans, interpret match statistics in a more contextualized manner.
Future research could extend this framework in several promising directions. First, incorporating richer in-game covariates - such as formation shifts, substitutions, or pressing intensity - may yield even finer-grained contextual adjustments. Second, player-level extensions could uncover how individual shot creation or finishing tendencies evolve under tactical pressure. Third, integrating these adjusted metrics into live win-probability or match simulation models could improve real-time forecasting and decision support. Finally, beyond soccer, the same methodological template can be adapted to other continuous-flow sports (e.g., hockey, rugby, or basketball) where strategic adaptation to game state plays a central role.
Supplemental Material
sj-pdf-1-san-10.1177_22150218261454824 - Supplemental material for Adjusting expected goals (xG) and shots on target for game context in soccer
Supplemental material, sj-pdf-1-san-10.1177_22150218261454824 for Adjusting expected goals (xG) and shots on target for game context in soccer by Andrey Skripnikov, Ahmet Cemek and David Gillman in Journal of Sports Analytics
Supplemental Material
sj-docx-2-san-10.1177_22150218261454824 - Supplemental material for Adjusting expected goals (xG) and shots on target for game context in soccer
Supplemental material, sj-docx-2-san-10.1177_22150218261454824 for Adjusting expected goals (xG) and shots on target for game context in soccer by Andrey Skripnikov, Ahmet Cemek and David Gillman in Journal of Sports Analytics
Supplemental Material
sj-zip-3-san-10.1177_22150218261454824 - Supplemental material for Adjusting expected goals (xG) and shots on target for game context in soccer
Supplemental material, sj-zip-3-san-10.1177_22150218261454824 for Adjusting expected goals (xG) and shots on target for game context in soccer by Andrey Skripnikov, Ahmet Cemek and David Gillman in Journal of Sports Analytics
Footnotes
Acknowledgments
The authors are grateful to New College of Florida for providing research start-up and summer development funding. The authors used ChatGPT to edit the text for clarity, grammar and syntax, but made sure to subsequently review the text themselves and confirm the actual meaning was preserved.
Funding
The authors received no financial support for the research, authorship, and/or publication of this article.
Declaration of interest statement
The authors declared no potential conflicts of interest with respect to the research, authorship, and publication of this article.
Supplemental material
Supplemental material for this article is available online.
References
Supplementary Material
Please find the following supplemental material available below.
For Open Access articles published under a Creative Commons License, all supplemental material carries the same license as the article it is associated with.
For non-Open Access articles published, all supplemental material carries a non-exclusive license, and permission requests for re-use of supplemental material or any part of supplemental material shall be sent directly to the copyright owner as specified in the copyright notice associated with the article.