
Abstract
In Major League Baseball, every ballpark is unique, with its own geometry and climate. Some ballparks may be more conducive to home runs than others. Quantifications of home run friendliness abound, but are often based on limited data and typically do not include uncertainty assessment. Further, personnel effects from individual players are rarely considered. We fit generalized linear models, taking as the observational unit the combination of game and handedness-matchup of the batter and pitcher, usually leading to four home run totals per game. The Poisson model provides a good fit for counts observed in the 2010-2024 season and generalizes well out-of-sample. We model personnel effects by constructing “elsewhere” measures of individual batter and pitcher home run tendency using data from parks other than the one in which the response is observed. All pairwise comparisons of ballparks are made, with multiplicity adjustment, using means adjusted to teams of average batters facing average pitchers in average handedness frequencies. Estimated standard errors for these means and differences are reported. We find that adjusted home run frequencies are substantially different from observed frequencies, leading to considerably different ballpark rankings than those based on unitless park factors appearing in baseball media.
Keywords
Introduction
Motivation
One of the enjoyable aspects of Major League Baseball (MLB) is that every ballpark is different, each with its own dimensions and playing conditions. It may be easier for left-handed batters (LHBs) to hit home runs (HRs) in some ballparks and easier for right-handed batters (RHBs) in others. The small probability that a plate appearance (PA) results in a HR depends on many factors whose effects can be studied using the wealth of data now available to analysts.
Despite widespread interest in quantifying differences among ballparks, commonly used measures of “park factors” often fail to account for key sources of variation. A prominent example is the ESPN Home Run Park Factor, which is computed as a ratio comparing home runs hit and allowed in a team’s home ballpark to those in other ballparks. While this construction attempts to control for team effects, it does not account for differences in batter and pitcher quality, variation in handedness matchups, or the frequencies with which those matchups occur. As a result, commonly reported park factors may confound the intrinsic properties of a ballpark with the characteristics of the players who appear in it. Moreover, because these measures are typically based on only a few seasons of data, they can fluctuate considerably from year to year. Since they are not embedded in a probabilistic framework, there is no formal way to quantify sampling variability, making it difficult to distinguish signal from noise.
These limitations are consequential. Measures of ballpark effects are used, implicitly or explicitly, in player evaluation, roster construction, contract negotiations, and arbitration They also play a prominent role in fantasy sports, a multi-billion dollar industry, as well as in sports betting and related predictive settings, where assessments of park “friendliness” are frequently cited but often based on limited data and informal methodology. In such settings, it is important that estimates of ballpark effects be interpretable, statistically principled, and accompanied by measures of uncertainty.
In this paper, we propose a framework for quantifying home run friendliness of MLB ballparks that addresses these limitations. We define park effects through an interpretable estimand, the expected number of home runs hit in a game under league-average personnel and matchup frequencies. Our approach adjusts for individual batter and pitcher abilities using “elsewhere” performance measures constructed from data outside the ballpark of interest, explicitly models batter-pitcher handedness matchups and allows their effects to vary across ballparks, embeds estimation within a probabilistic framework that enables uncertainty quantification for all parameters and derived quantities, and demonstrates strong out-of-sample performance through cross-validation. In contrast to commonly reported park factors, which are typically unitless, our model yields estimates in meaningful units, expected home runs per game, along with associated measures of uncertainty. Because the model is formulated within a Poisson framework, it also provides an estimate of the full distribution of home run counts, allowing for a more complete characterization of variability. The resulting estimates provide a principled basis for comparing ballparks on a common scale.
While recent advances in baseball analytics have emphasized high-resolution data, such as Statcast measurements of batted ball characteristics (MLB Advanced Media, L.P., 2026), these approaches primarily address the mechanics of individual events at the pitch or batted-ball level. The goal of the present work is different. We focus on producing stable, interpretable, and uncertainty-quantified estimates of ballpark effects at the game level. These perspectives are complementary, and a rigorous macro-level characterization of park effects remains essential for many practical applications.
Our approach also addresses a limitation noted by Albert et al. (2024), who observe that many existing park factor methodologies “essentially ignore the players involved in each event.” By incorporating measures of individual batter and pitcher performance and accounting for matchup frequencies, we aim to isolate ballpark effects from personnel effects in a way that has received limited attention in the literature.
After a literature review, Section “Methods” outlines the methods, including the statistical model and construction of covariates. Section “Data analysis” presents the data analysis and statistical inference, including matchup-specific estimates, marginal ballpark means, and measures of uncertainty. A cross-validation study is conducted to assess out-of-sample performance. Section “Discussion” discusses the practical implications of the findings, as well as limitations and possible extensions. Section “Conclusion” provides a summary and suggestions for further research.
Literature review
A measure of HR friendliness popularized by the ESPN network, known as the home run park factor (HRPF), can be computed for each ballpark by comparing HRs hit and allowed at home by the team that plays their home games at the ballpark with HRs hit and allowed by that same team at other parks:
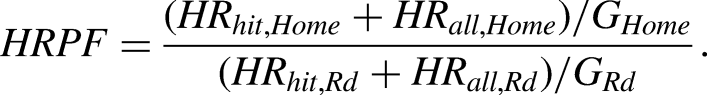
Acharya et al. (2008) show that when this measure is used to assess runs scored across ballparks, it is biased due to scheduling imbalance. Separate models are developed for the American and National Leagues that include factor effects for park. The model also includes factor effects for offensive and defensive team, though it does not model contributions of individual players nor their handedness. Many managers make use of the “platoon” to take advantage of matchups, so that lineups vary substantially from one game to the next. In a detailed investigation of handedness effects on HRs and many other offensive measures, Chance and Maymin (2023) analyze a century’s worth of data and break matchups down further by considering batter throwing hand to obtain eight matchup combinations. Neither linear models with factor effects for teams and parks, nor the HRPF take variable lineups or handedness combination into account.
When modeling the chance of a base hit in a PA, Alceo and Henriques (2020) compare 48 models, including generalized linear models, random forest and neural networks. The HRPF is selected as an explanatory variable in many of these. In a study of air density effects on distance travelled by batted balls (Bahill et al., 2009), the following factors are identified, in decreasing order of variance explained: altitude, temperature, barometric pressure and humidity. A comparison of home ballpark advantage across the 2019 and 2020 (Covid) seasons, to investigate the possible effect of fan absence (Losak and Sabel, 2021), found no difference.
Albert et al. (2024) develop one approach to estimate park effects using games as the observational unit and another based on batted balls. The authors demonstrate how these park factors can be used to adjust estimates of HR frequencies for individual players to what they would hit in a neutral ballpark. Many articles addressing park effects appear in the Sabermetrics literature. Fox (2007) studies atmospherics, with several important findings. Pitches decelerate more in evening games, with observed correlation between temperature and deceleration of
Click (2005) studies variation in park effect estimators over time. Nesbit and King-Adzima (2012) study the role of park factors on attendance in baseball, and do not find an effect. Perry (2005) estimates park effects separately for LHBs and RHBs and discusses lineup variation and pitcher handedness. Rybarczyk (2007) simulates batted ball data and uses trajectories to estimate park factors specific to five outfield sections: left, left-center, center, right-center and right field. The following factors are identified as likely to have an effect on HR frequency: atmospherics, roster, roster changes, ball characteristics (dry > humid), unbalanced schedule, interleague play, and weather. Highlighting the considerable variability from one year to the next, Rybarczyk (2007) notes that the HRPF for Chase Field in Arizona rose from 48 in 2002 to 116 in 2003.
Methods
Data
We analyze data from MLB seasons 2010
The unit of observation is the combination of game and matchup. The total number of observations analyzed here is N = 133,220, involving 2,631,525 PAs from 34,729 games. If there were four matchups observed for each of 81 games in each of 30 parks over these 15 seasons, there would be
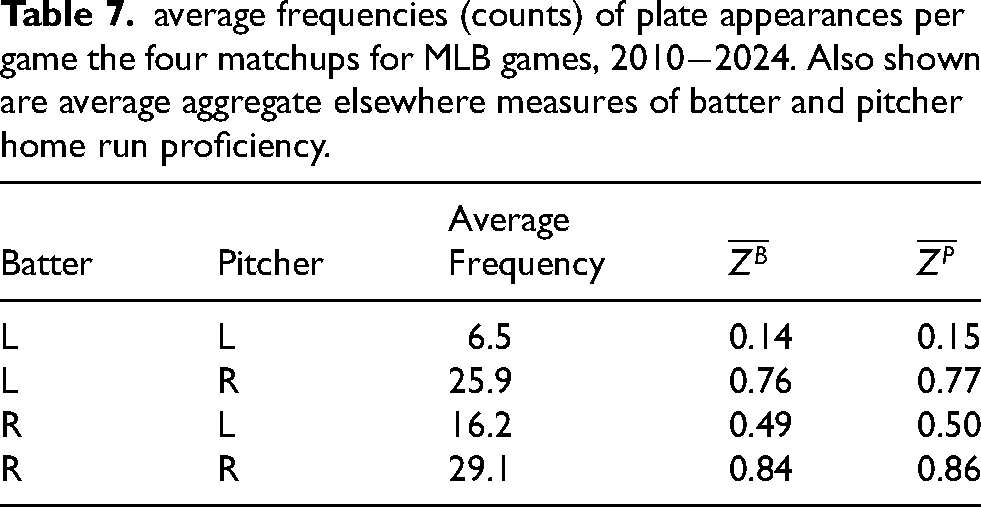
Matchup frequencies of batter and pitcher handedness.

Model
We adopt a generalized linear mixed effects model based on the Poisson distribution with a canonical log link function. The total number of combinations of game and matchup for which HR counts are observed is 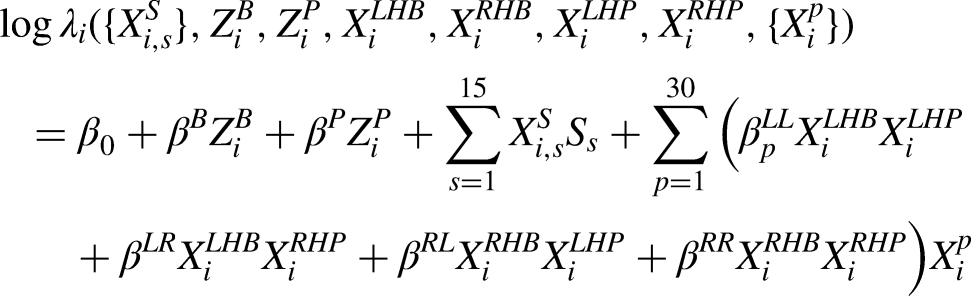
In summary, the factors affecting HR intensity in the regression model are categorized below, followed by some discussion:
matchup: combination of batter and pitcher handedness, ballpark-by-matchup interaction, aggregated measures of batter and pitcher HR propensity and PA frequency (two “personnel covariates”), season (using random effects).
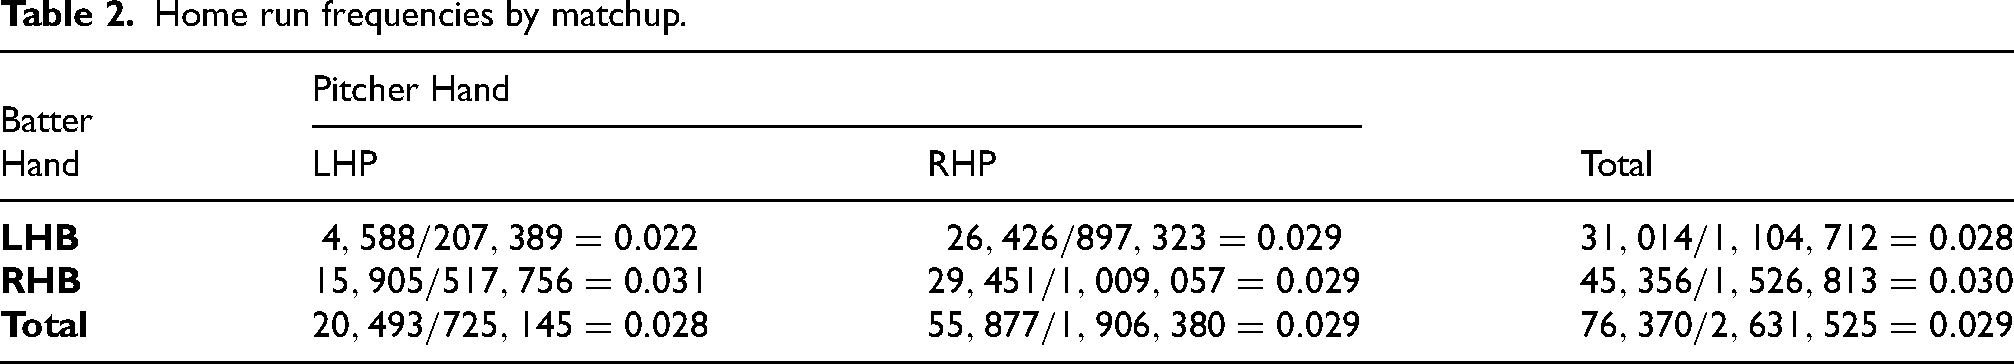
It is well-known in baseball that the batter-pitcher handedness combinations that are generally most conducive to offense are those where the handedness of the batter and pitcher do not agree. Table 2 shows the relative frequencies of HRs. To account for these matchup effects on the rates at which home runs are hit, and to allow them to vary across ballparks, we include ballpark-by-matchup interactions. The parameters of primary interest in this investigation are the 120 ballpark parameters for the four matchups,
Home run frequencies by matchup.
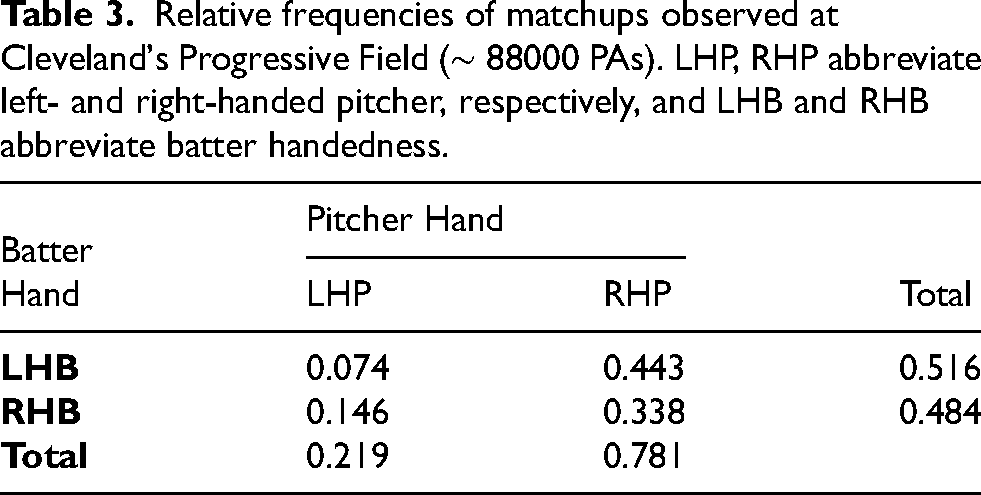
Given the evidence that HR intensity varies across matchups, it is important to note that the distribution of PAs across matchups itself varies considerably across ballparks. Consider Progressive Field, home to the Cleveland Guardians. While league-wide relative frequency of PAs by left-handed batters is
Relative frequencies of matchups observed at Cleveland's Progressive Field (
Beyond matchup frequency, we also seek to control for variability due to quality of personnel having plate appearances at the various ballparks. Certain high-revenue teams, like the Los Angeles Dodgers and New York Yankees, dedicate more resources to signing free agent batters than others. In 2023, the team hitting the most HRs hit more than twice as many as the team hitting the fewest. Further, there can be considerable game-to-game variation in lineups for a given team. With respect to allowing HRs, pitchers appearing in ballparks can also vary from team to team, game to game and within a game. Controlling for these personnel effects offers the potential to explain variability in HR hitting. For each observational unit (combination of game and matchup), we construct “personnel covariates” that quantify the HR hitting ability of batters and HR allowing tendency of pitchers for all PAs for a particular matchup in a game.
As we show in Section “Elsewhere measures of batter and pitcher quality”, the value taken by the batter covariate used to model the expected outcome in a single game will aggregate over all batters with PAs in that game, taking larger values for better batters but also for more PAs of a given handedness matchup. The covariate then contains information about both batter ability and also about matchup frequency. We use the term covariate since this is not under any kind of control. We will construct measures of HR-friendliness for a ballpark by estimating the mean number of HRs in a game played there at average values of this covariate. There are two such covariates for each game-matchup observation, one that aggregates batters and one that aggregates pitchers. The partial slopes for these covariates,
In an attempt to normalize home-run hitting across ballparks, MLB has been experimenting with several approaches, not limited to keeping baseballs in humidors prior to games. For whatever reason, HR intensities vary over time. Over the 15-year period of observation considered here, the lowest HR intensity occurred in 2014, where the average over 2428 games was
Elsewhere measures of batter and pitcher quality
As observed by Acharya et al. (2008), the problem of identifying who the productive batters are is itself made difficult by ballpark biases. Furthermore, the data used to assess player quality are the same data we seek to use to assess the HR friendliness of the ballparks. To get around this, we propose “elsewhere” measures of hitter quality. For a particular PA, we construct a measure of quality for the batter,
As an illustration, consider an example from the 2021 home opener for the Colorado Rockies at Coors Field, facing the Los Angeles Dodgers who had their ace LHP Clayton Kershaw starting the game. For the first plate appearance in that game by the Rockies shortstop Trevor Story, a RHB, we observe that in the career 562 PAs by Story against LHPs away from Coors Field he has hit 25 HRs. Our “elsewhere” measure for that PA is then
When a data frame is suitably formatted to fit the model with statistical software it might have one row for each game-matchup, a column with the response, the number of HRs hit for that game-matchup, and columns for season, personnel variables, ballpark, and the indicators for batter- and pitcher-handedness. The annotated data in Table 4 gives an illustrated example of the eight observations from the first two games played in Coors Field in 2021.
Data frame for eight observations from the first two games at Coors Field in 2021.
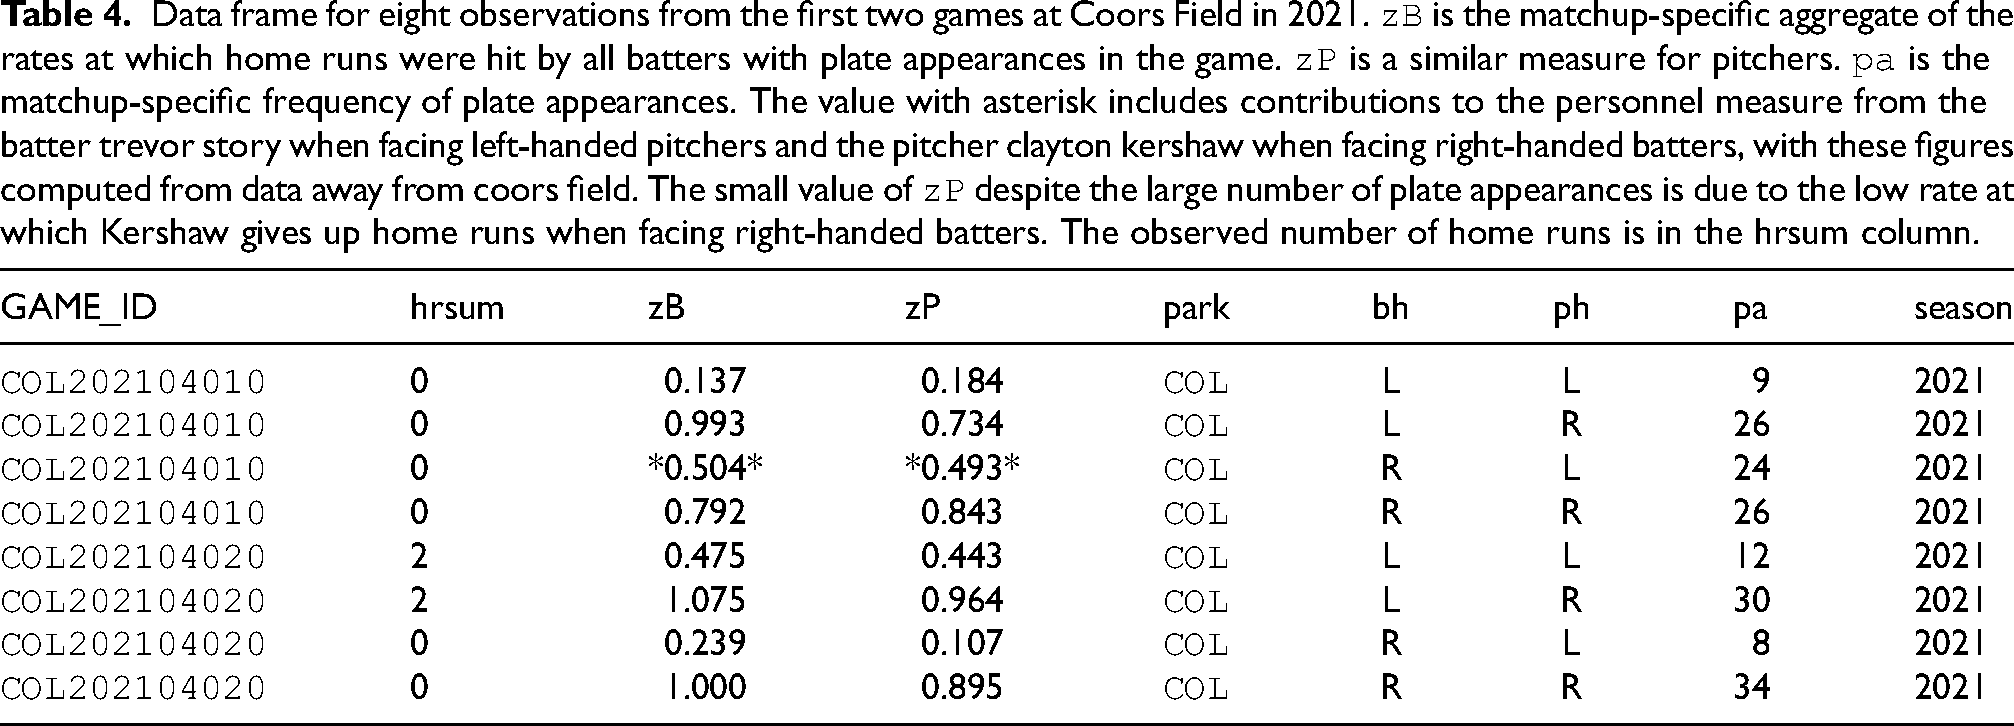
Recall that for each matchup, these observations are aggregates over all PAs in the game. The asterisks in Table 4 emphasize that these
Fitting and checking the model
Maximum likelihood estimates (MLEs) for parameters are obtained using a Laplace approximation to the marginal log Poisson likelihood using the GLIMMIX procedure in SAS (SAS Institute Inc., 2018). Let the vector of all fixed effects parameters be denoted
The fitted values from the model are estimated HR expectancies for the game-matchup combinations,
Frequencies of home run counts in the

There are
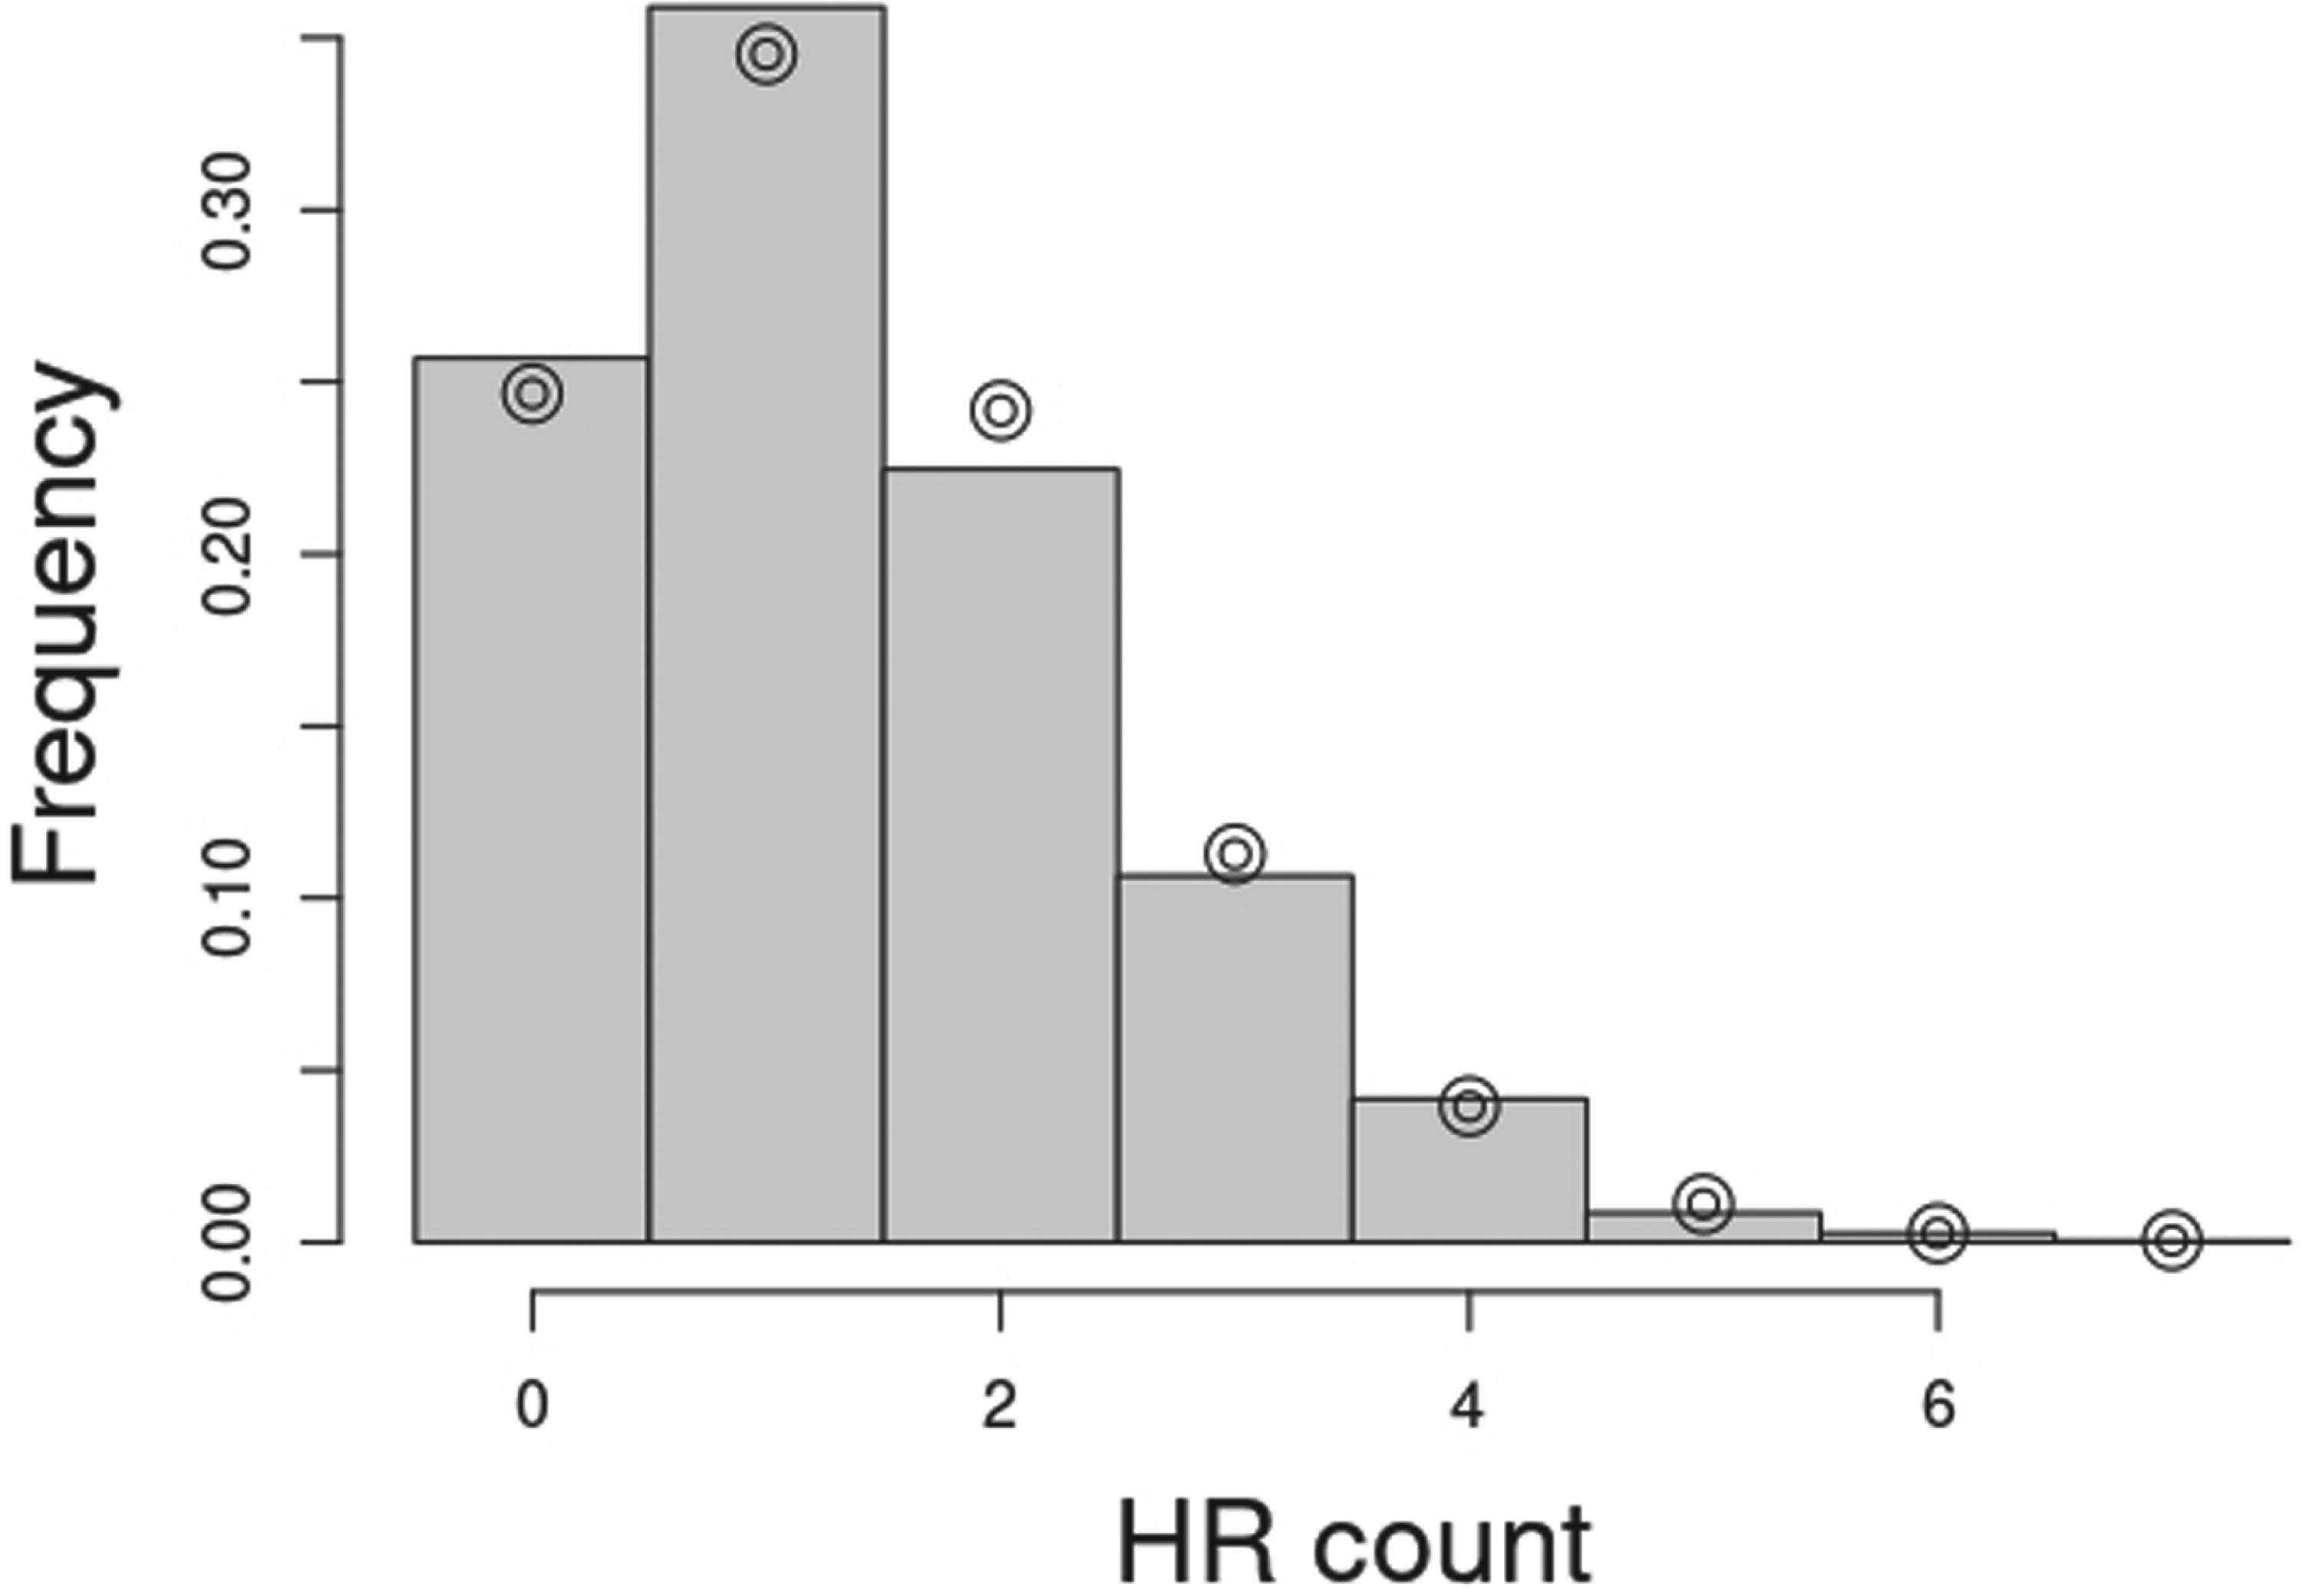
Probability histogram for empirical frequencies of home run totals for 3410 game-matchups with rounded estimated expectancy
Ballpark parameter estimates and their standard errors (last row). The reference cell is for games involving right-handed batters and pitchers in the ballpark in Washington D.C. (

We extend the examination to game-matchups with other estimated HR expectancies using Poissonness plots (Hoaglin, 1980). If the probability mass function is multiplied by
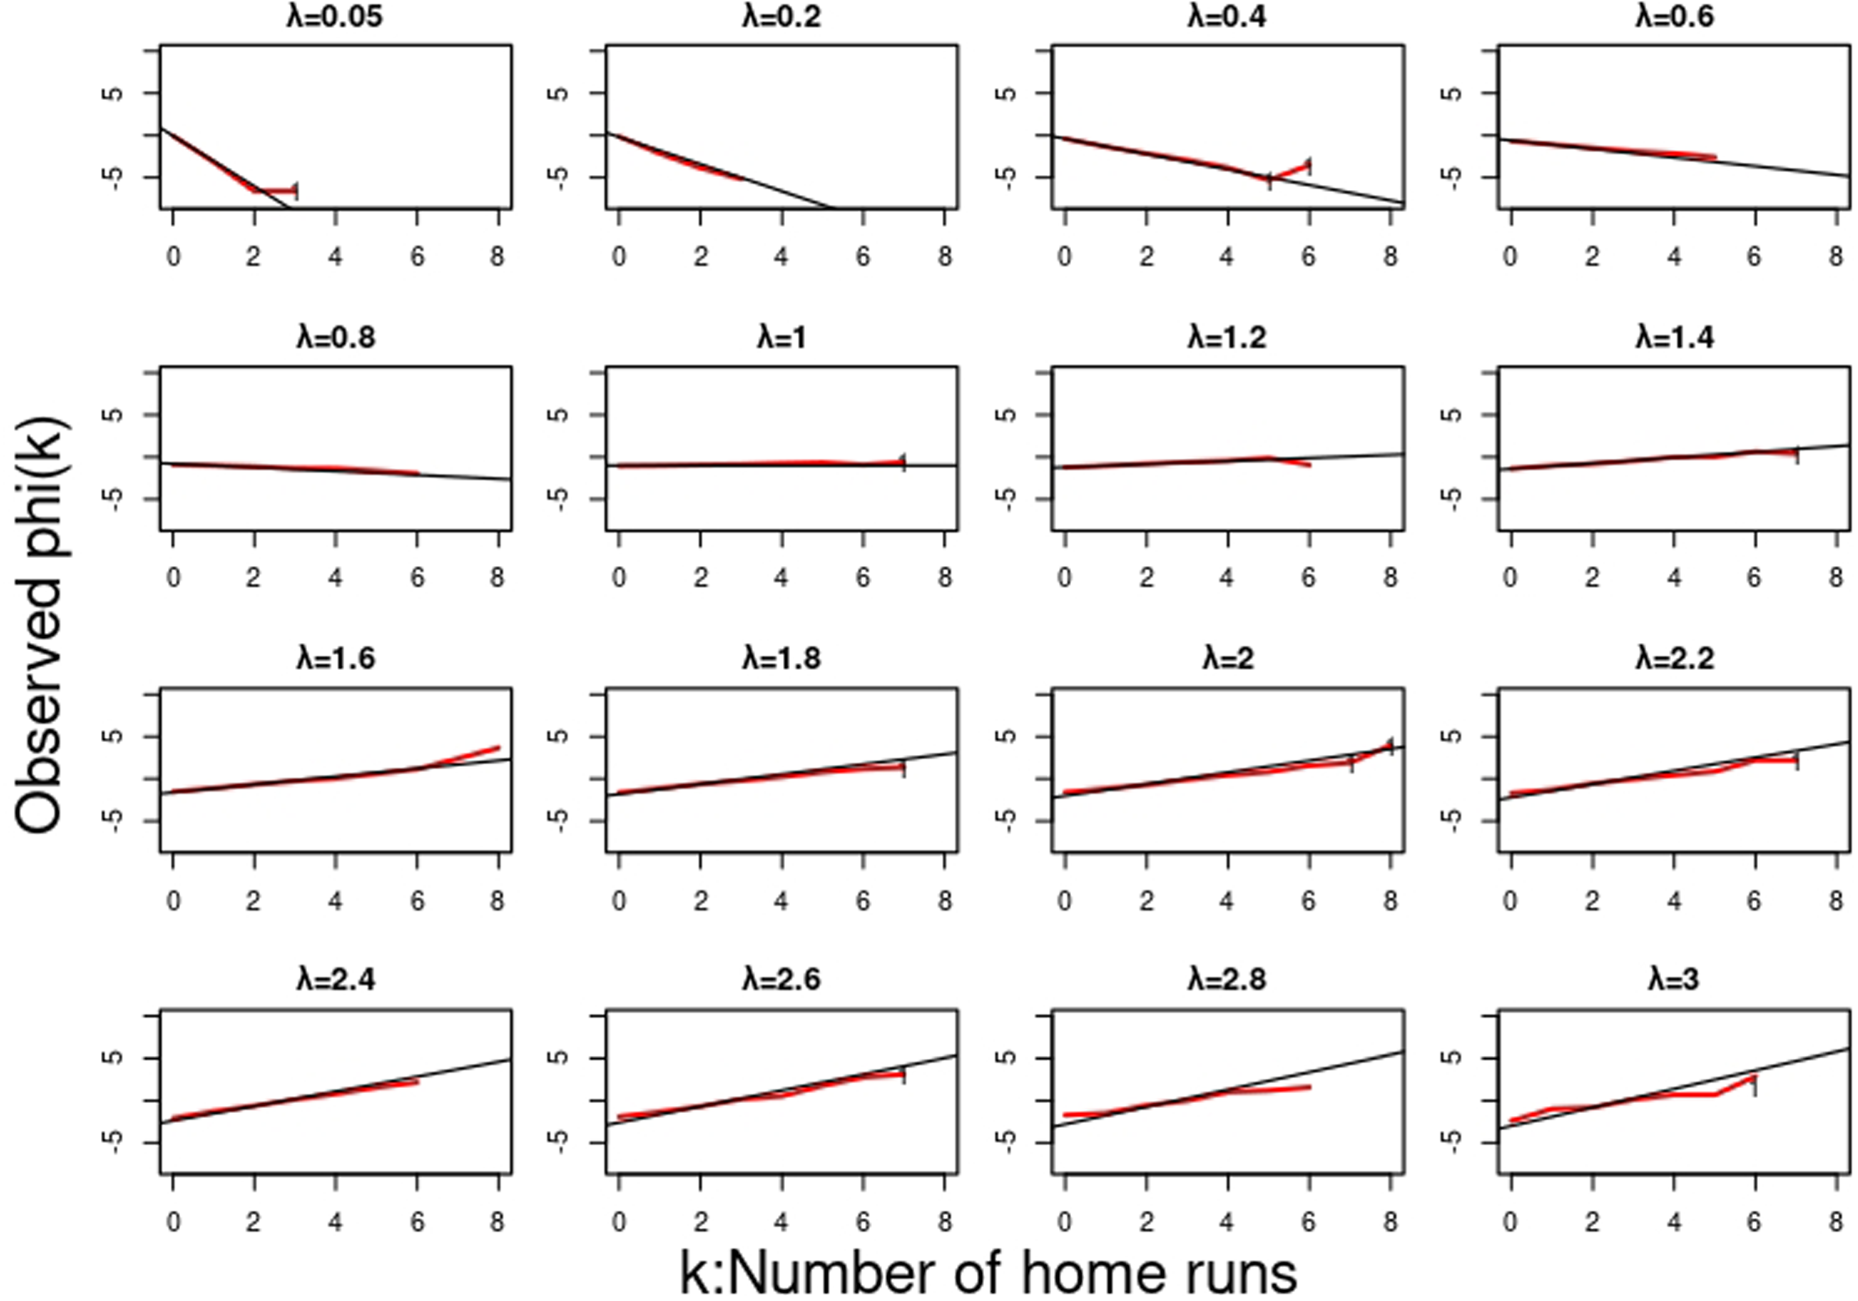
Poissonness plots of
Data analysis
The estimated partial slopes for the elsewhere aggregates of batters and pitchers exhibit relative importance on HR intensity that is similar to an analysis (Albert et al., 2024) based on 2023 data that uses logistic regression for HR probabilities in individual PAs with random effects for batter and pitcher. Both analyses suggest that the magnitude of the effect of who the hitters are is greater than the effect of who the pitchers are. The square root of the ratio of estimated variance components,
Upon substitution of the estimated intercept (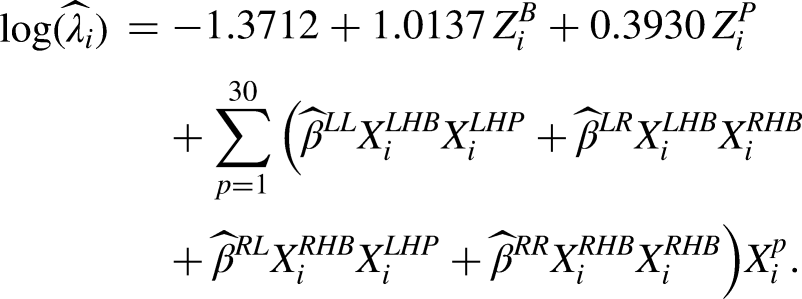
Adjusted park means can be constructed by evaluating the inverse link of the fitted model, for a given matchup, at average values for the
average frequencies (counts) of plate appearances per game the four matchups for MLB games, 2010
Empirical (

Empirical (
Empirical (
Empirical (
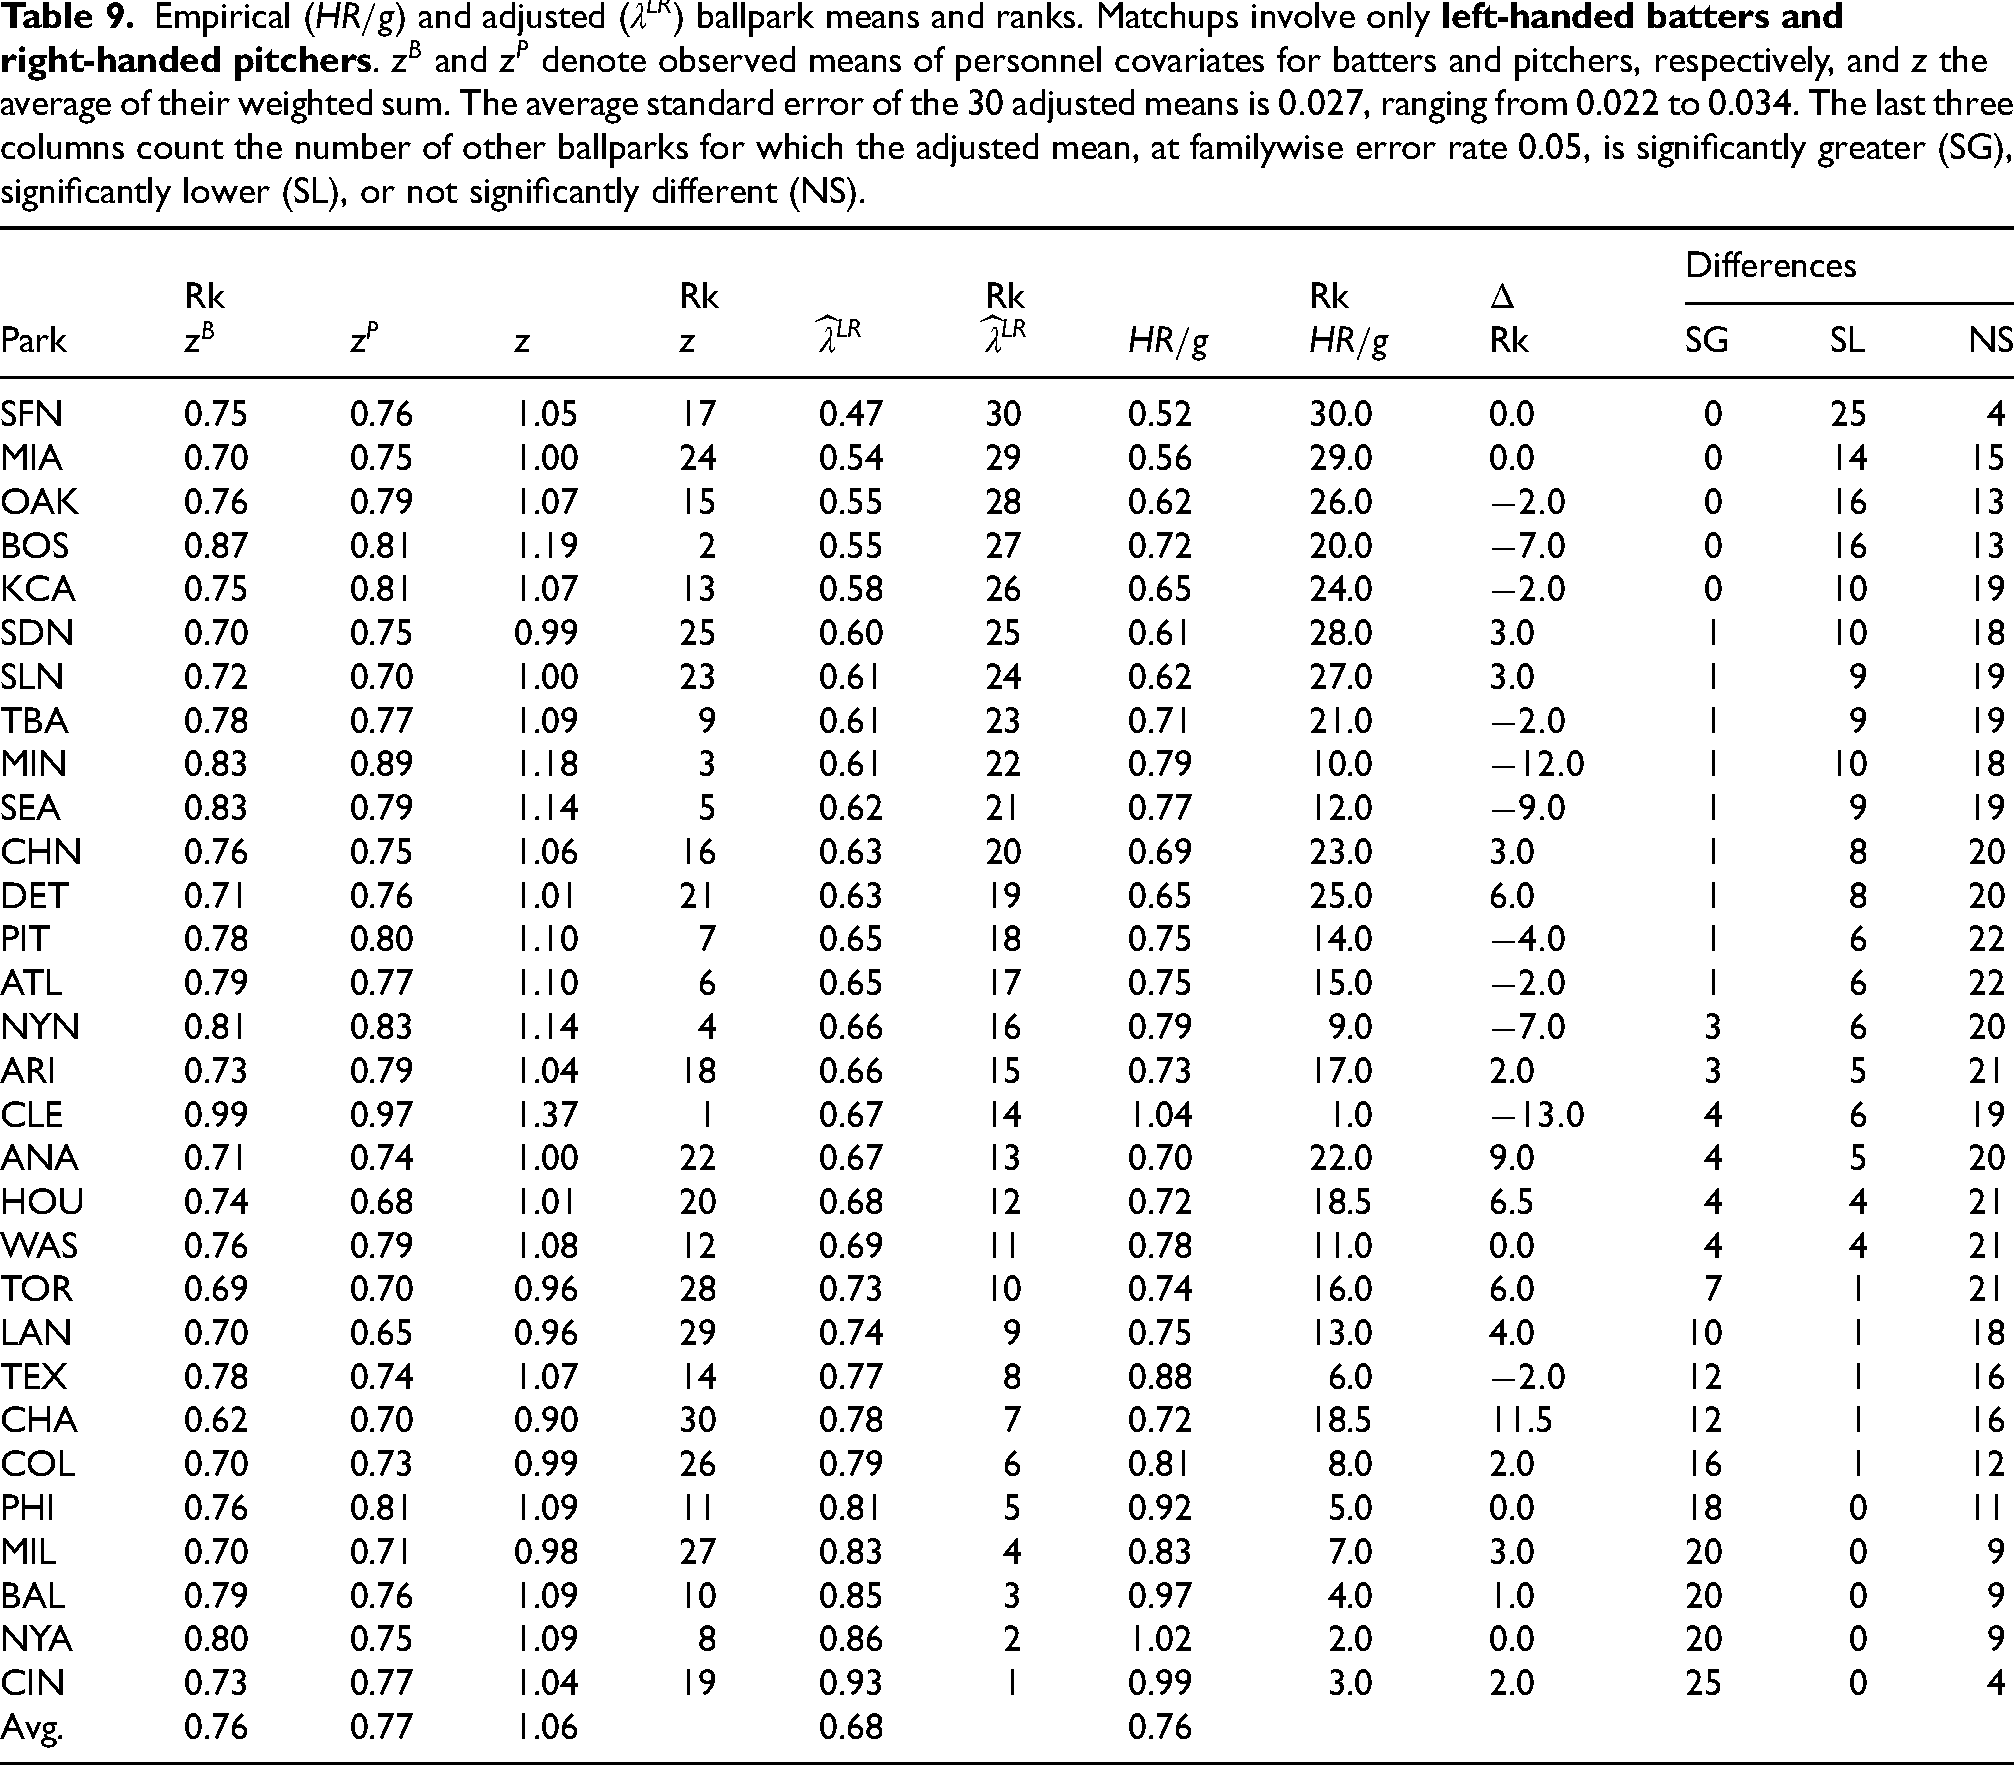
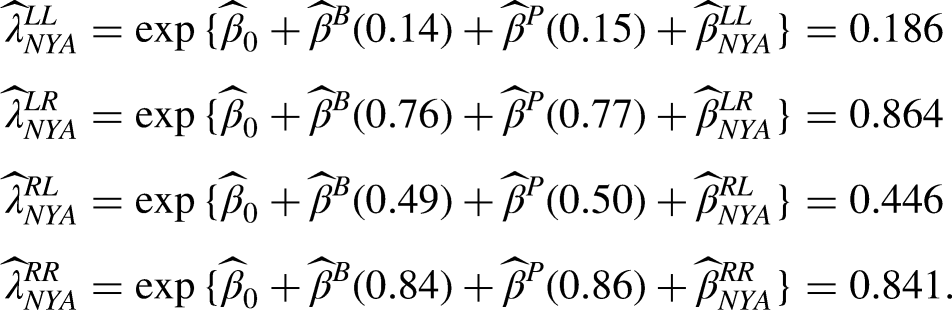
Consider the mean number of HRs hit per game among PAs involving LHBs and RHPs in Yankee Stadium. This matchup could take advantage of the short porch in right field. The empirical average among all such matchups over the 2010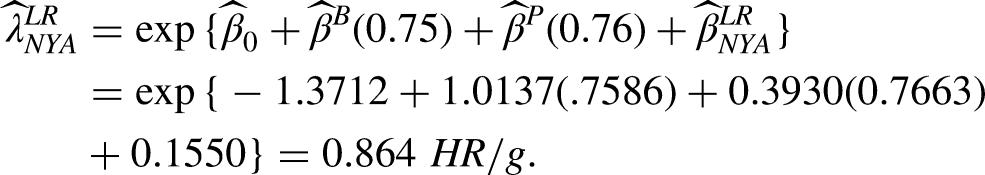
If Yankee Stadium is conducive to HRs for LR matchups, after controlling for personnel effects, then this adjusted mean should rank high compared to other ballparks for LR matchups. Inspection of Table 9 shows that indeed, it ranks second in HR friendliness, being outranked only by the Great American Ballpark in Cincinnati.
If Yankee Stadium has, over this period of observation from 2010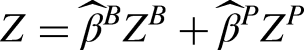
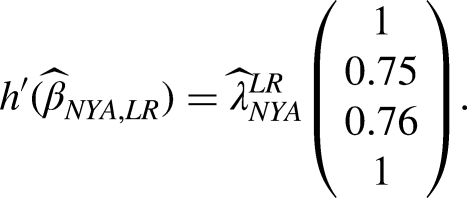
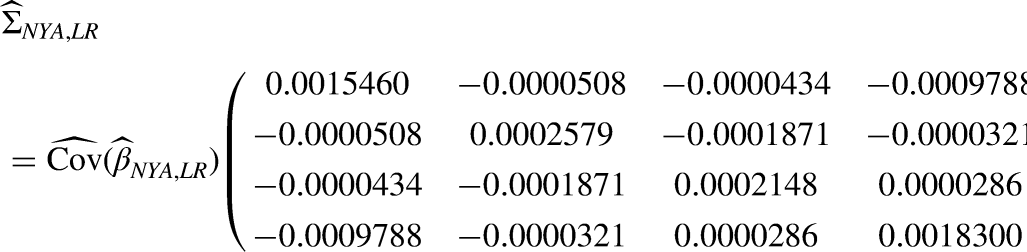
To report a standard error associated with an adjusted mean, we can consider the large-sample joint distribution of all parameter estimators on which it is based. For the Yankee example, if we define 

Pairwise comparisons within matchup
With 30 ballparks, there are 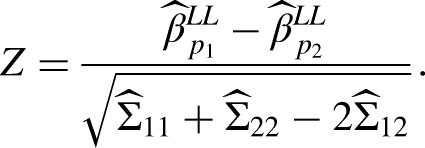
To conduct all 435 pairwise comparisons among the 30 ballparks, for a given matchup, the Bonferroni-Holm (Westfall et al., 2011) sequential procedure is used. In this sequentially rejective procedure, the unadjusted, ordered p-values
Analysis of adjusted means
In the following discussion of the effects of adjustment, we focus on those ballparks for which the difference between matchup-specific rank and empirical rank are noteworthy. All changes due to adjustment can be analyzed by inspection of Tables 8 to 11. Additionally, the statistical significance of within-matchup comparisons of adjusted ballpark means is discussed.
Adjusted means for left-handed batters and left-handed pitchers
For LL matchups (see Table 8), where sample sizes and HR frequencies are the smallest, the analysis is less interesting than for other matchups.
The standard errors for the 30 LL ballpark means averaged 0.012, ranging from 0.010 to 0.014. Inspection of the last three columns for Globe Field indicates that the adjusted mean may be declared significantly greater than that for 15 other parks at the top of Table 8 that are unfriendly to HRs. These declarations are made with strong control of the FWE at
Adjusted ballpark means for left-handed batters and right-handed pitchers
For LR matchups (see Table 9), the magnitude of the adjustment is much more pronounced. The ballparks in Cleveland, Minnesota and the south side of Chicago (code CHA) all see double-digit adjustments to their ranks. Progressive Field in Cleveland hosted the highest ranking batters and pitchers, leading to
The adjusted mean for Oracle Park (code SFN) is significantly lower than all but 4 other ballparks, emphasizing that it is one of baseball’s toughest places for HRs in LR matchups. The Great American Ballpark (code CIN) is significantly greater than all but 5 other ballparks. Every ballpark may be declared significantly different from at least 7 other ballparks, with control of
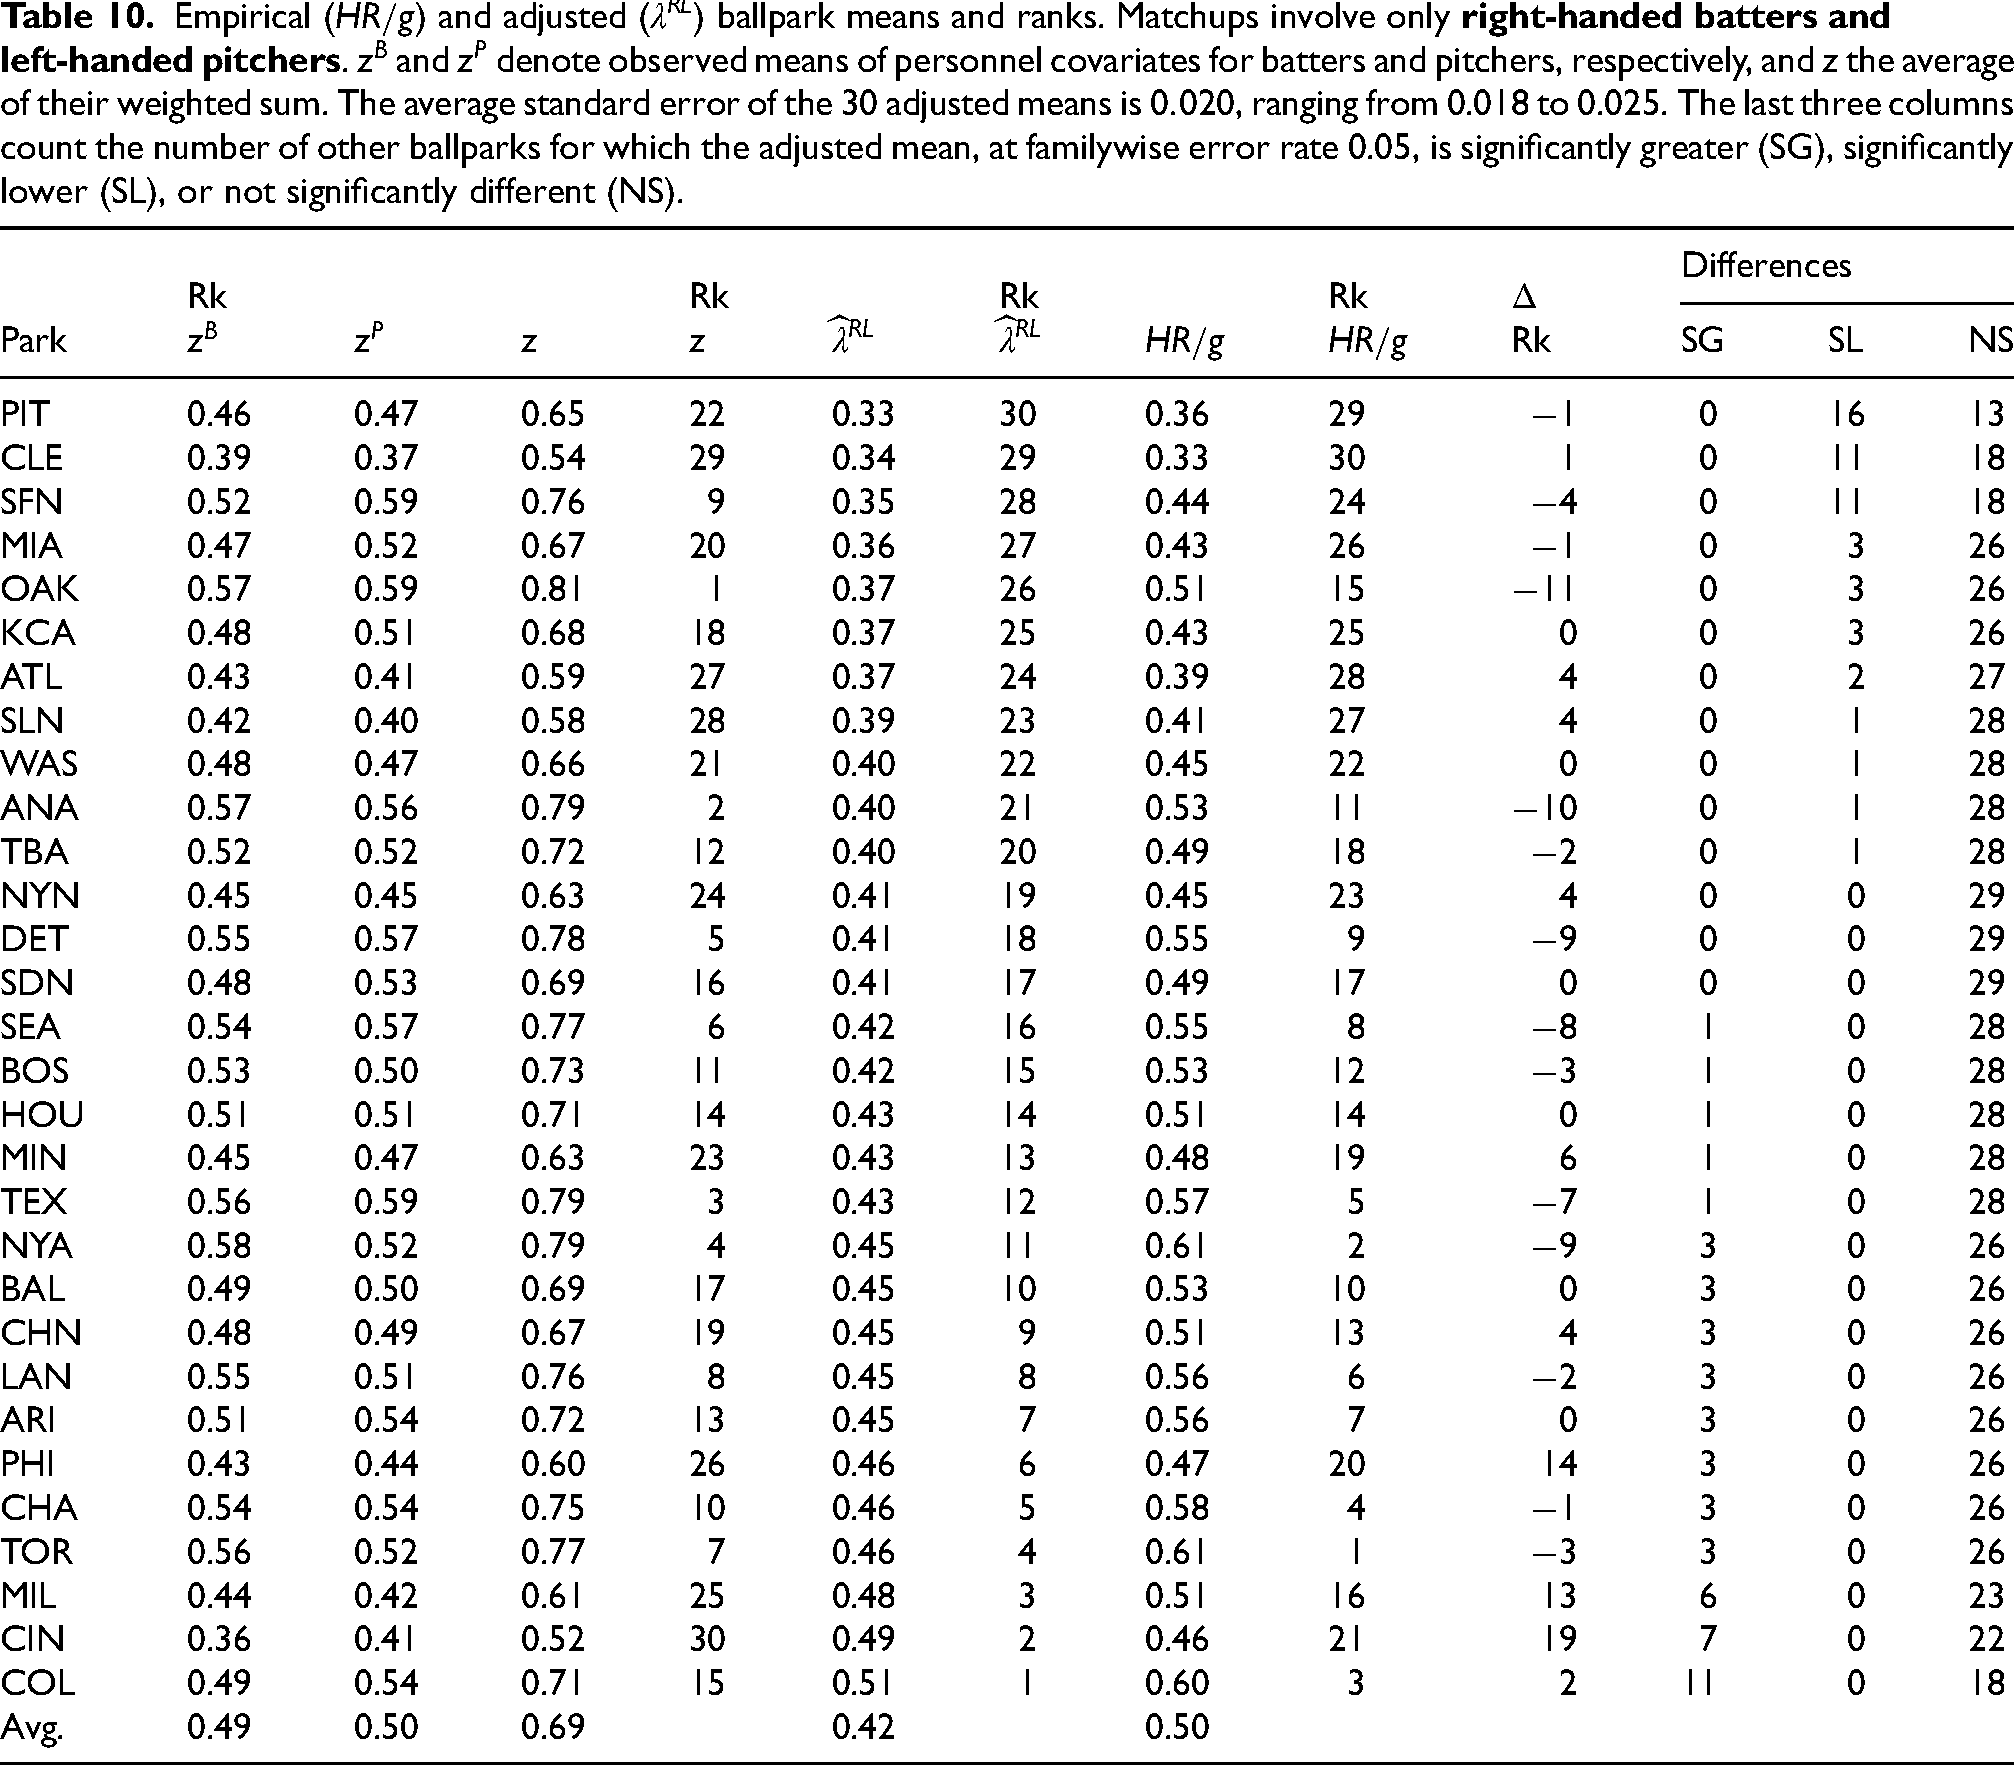
Adjusted ballpark means for right-handed batters and left-handed pitchers
For RL matchups (see Table 10), the ballparks in Oakland, Anaheim, Philadelphia, Milwaukee and Cincinnati all see double-digit adjustments in rankings. Oakland and Anaheim are adjusted way down, as the RL personnel with PAs in those parks are high HR producers, especially pitchers, with respective measures of
For RL matchups, the adjusted mean in PNC Park in Pittsburgh is significantly lower than that in 13 other ballparks. The adjusted mean in Coors Field in Colorado is significantly greater than that in 11 other parks. There are three ballparks in the middle of the ranks whose adjusted mean does not differ significantly from that of any other ballpark.
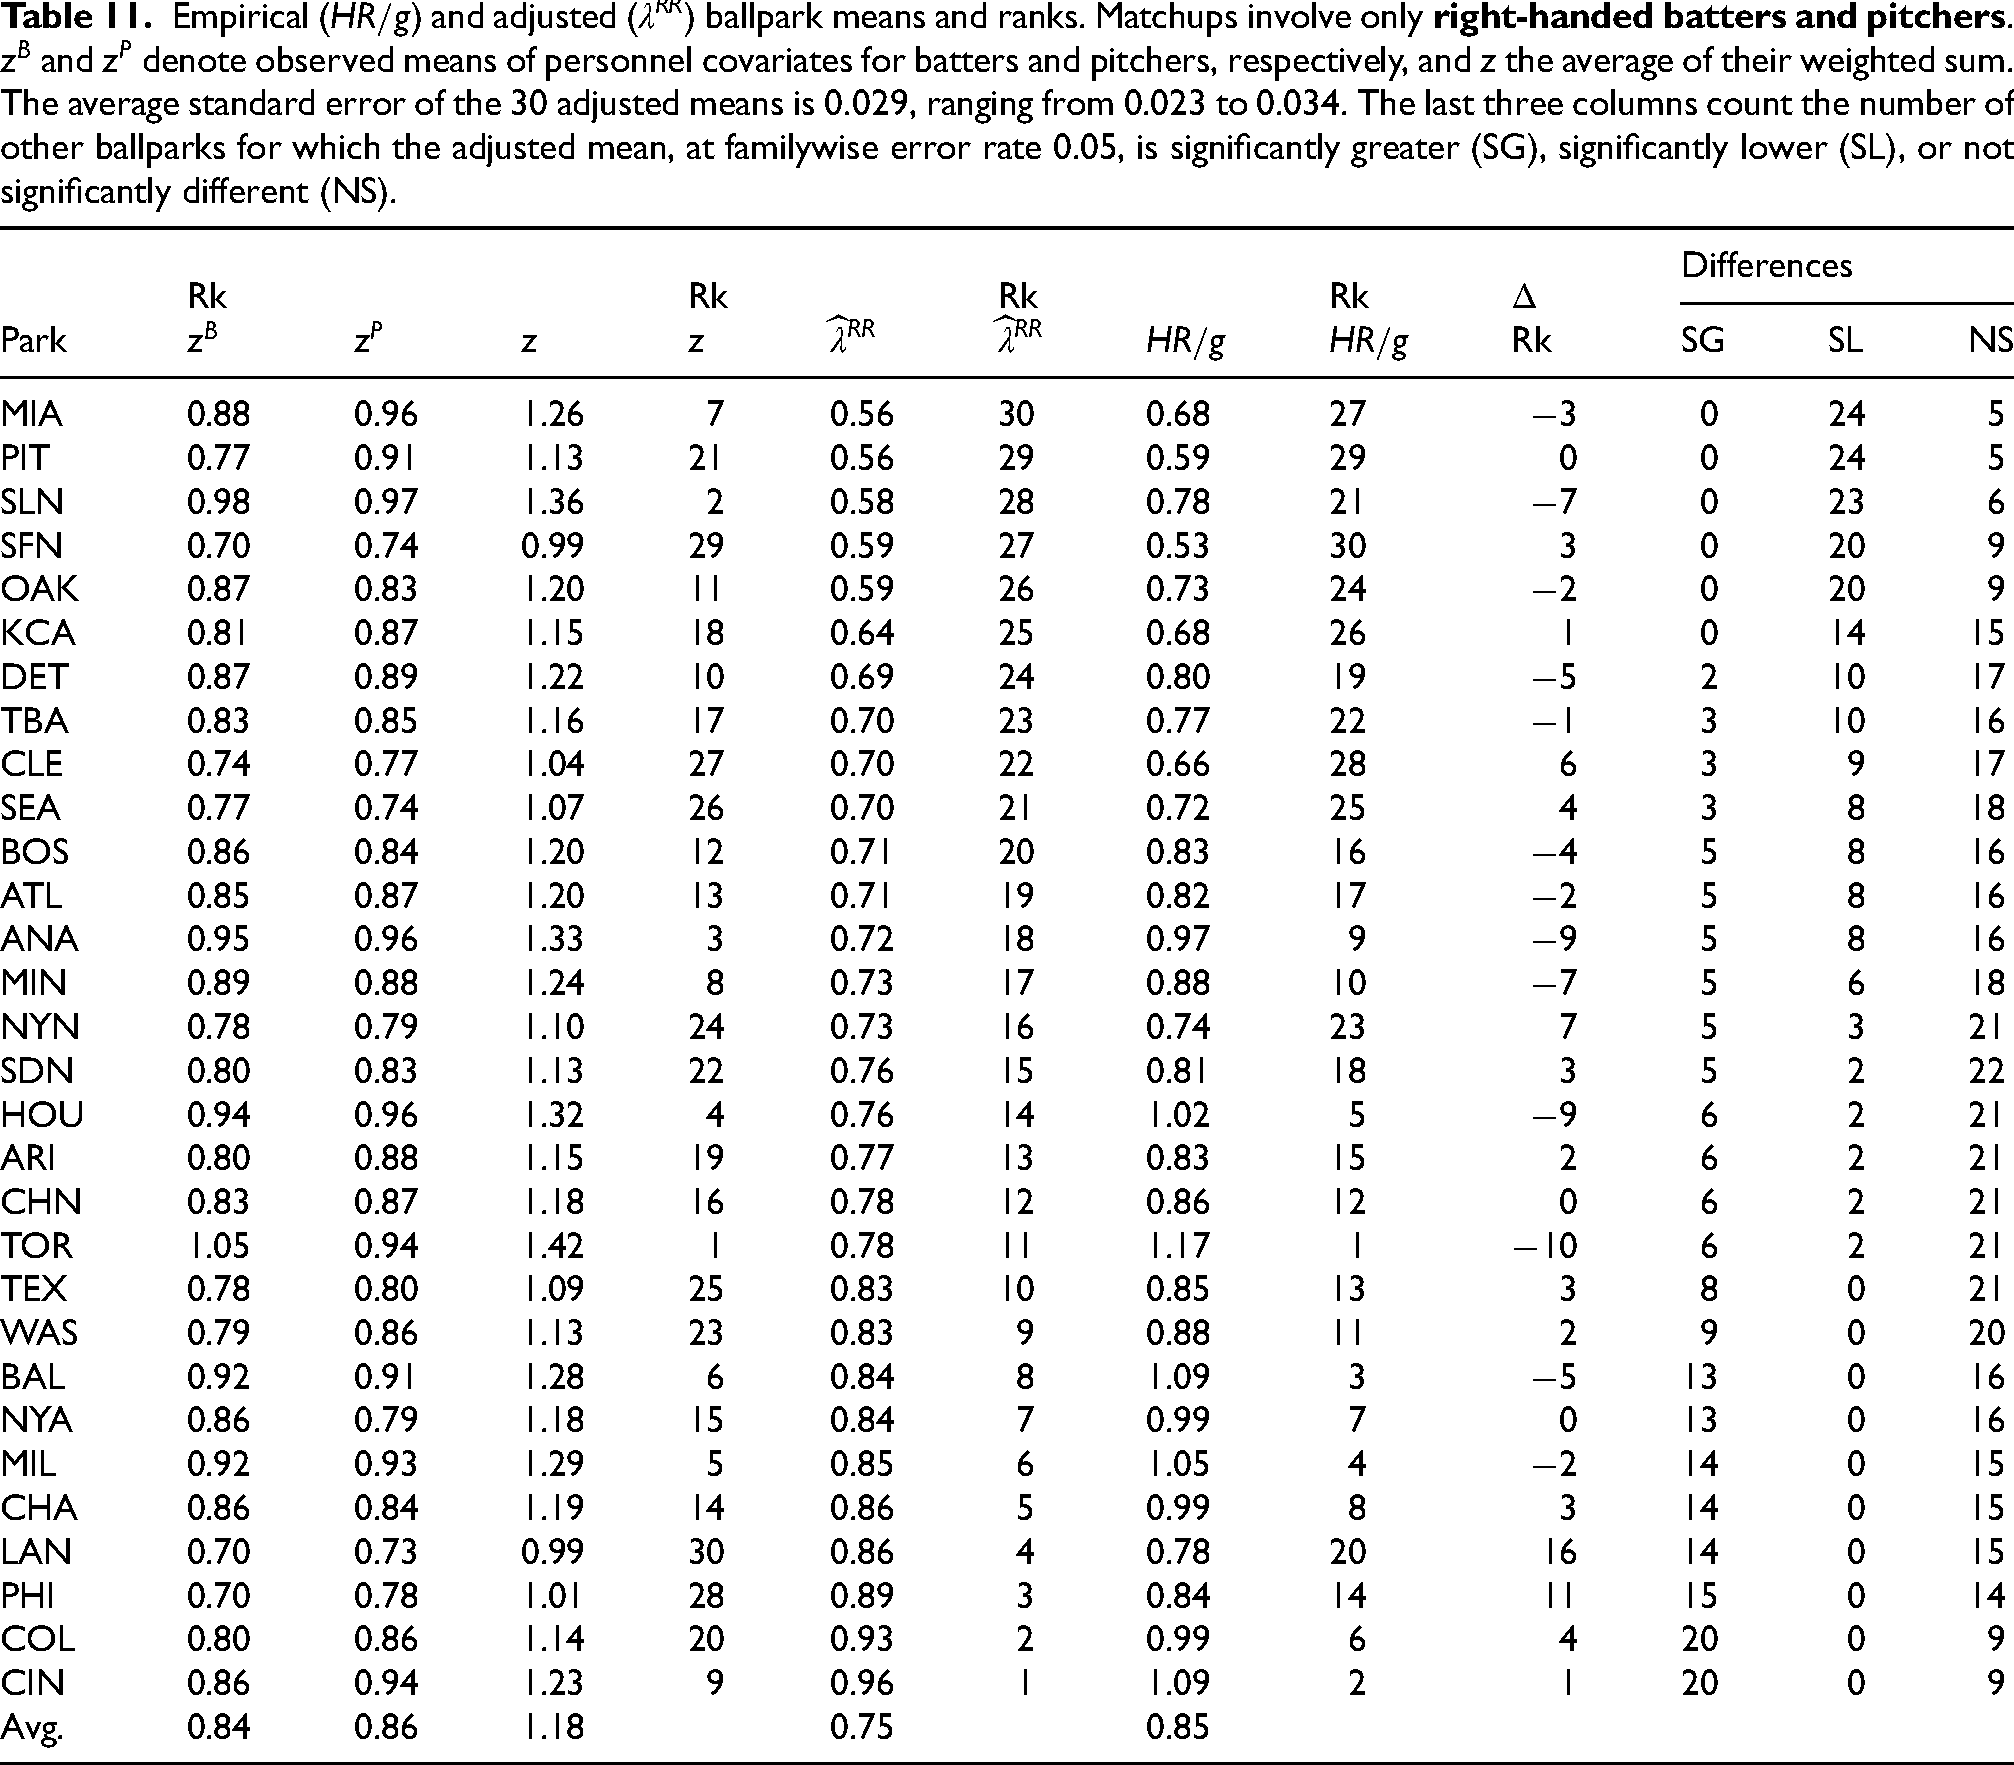
Adjusted ballpark means for right-handed batters and right-handed pitchers
For RR matchups (see Table 11), the Rogers Centre in Toronto is adjusted from tops in the league based on unadjusted
As for differences in RR matchups, the adjusted mean for loanDepot Park in Miami is significantly lower than all but 5 other ballparks, while that for the Great American Ballpark in Cincinnati is significantly greater than that for all but 9 other parks. Every ballpark has an adjusted mean that can be declared significantly different from at least one other ballpark.
Marginal adjusted ballpark means
While it is clear that ballpark HR frequencies depend strongly on handedness, there may still be interest in an overall assessment of HR friendliness that averages over matchups. One such measure is the marginal adjusted mean, or the simple sum of adjusted means, on the inverse link scale. If the adjusted mean for park 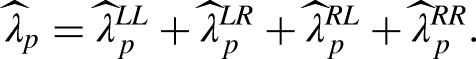

Marginal adjusted ballpark means. Table ordered according to marginal adjusted mean home runs, denoted by
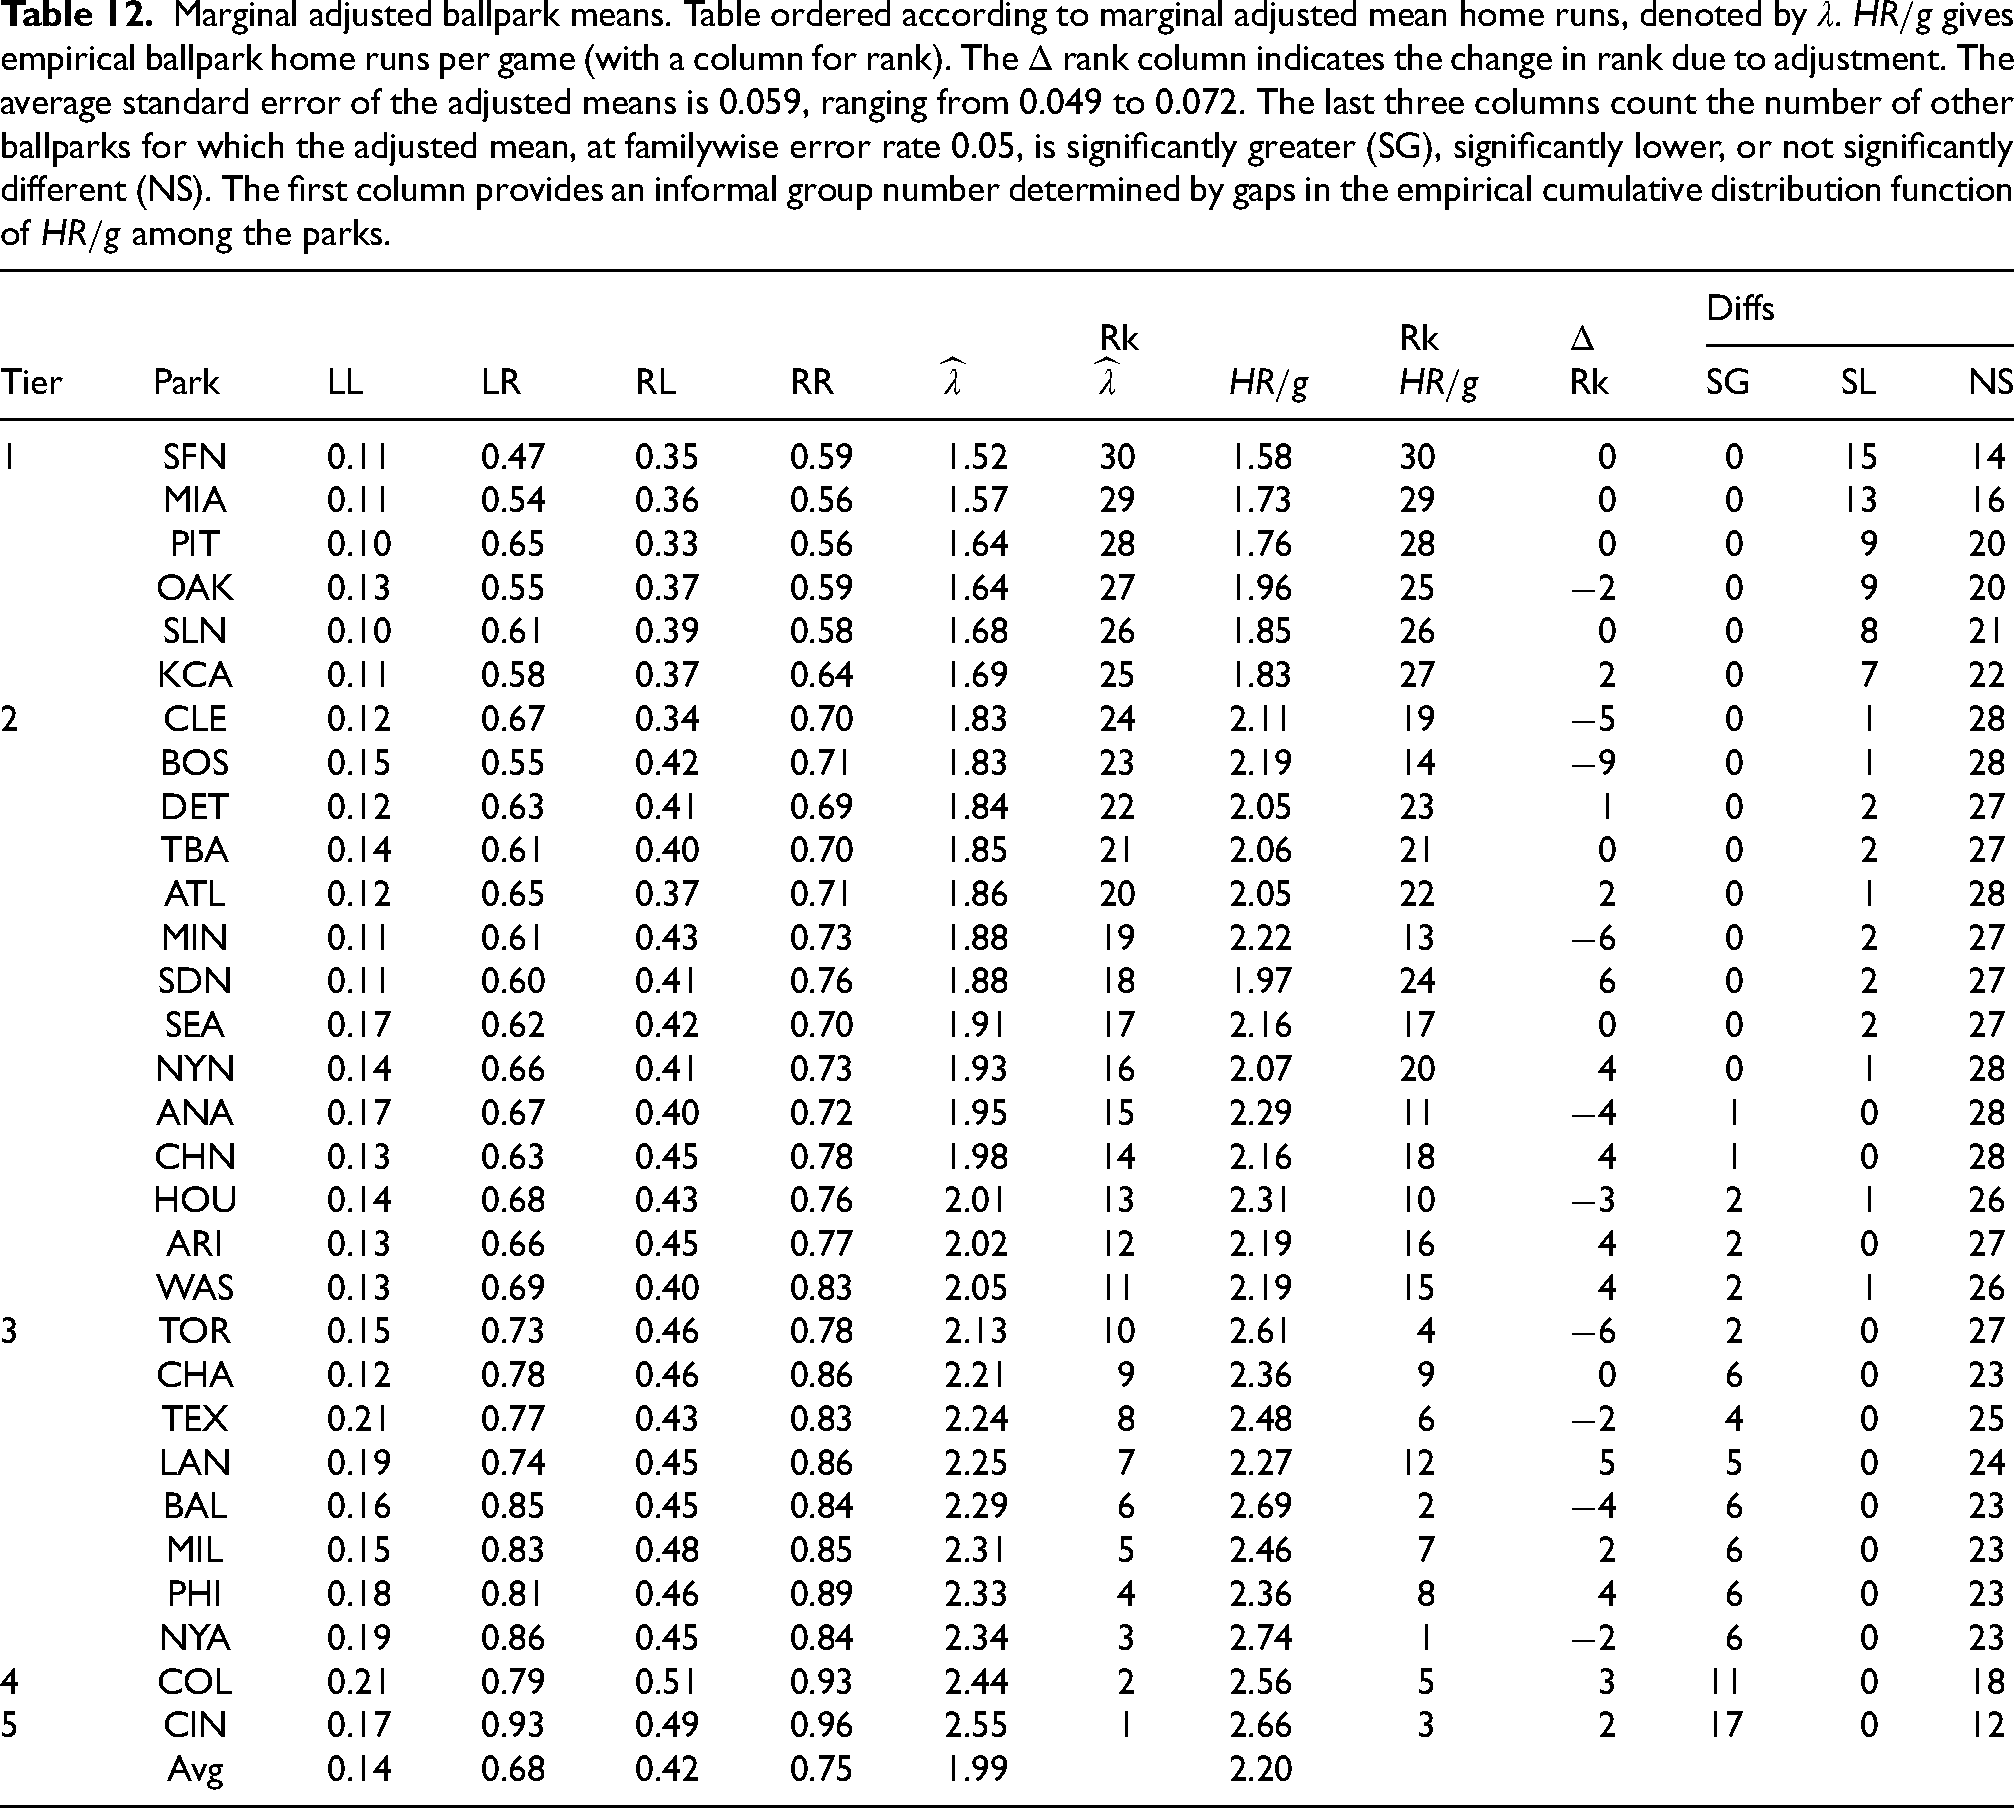
The average of the standard errors for the 30 ballparks was 0.059, ranging from 0.049 to 0.072. The empirical cumulative distribution function (ECDF) of the marginal adjusted means in the column titled
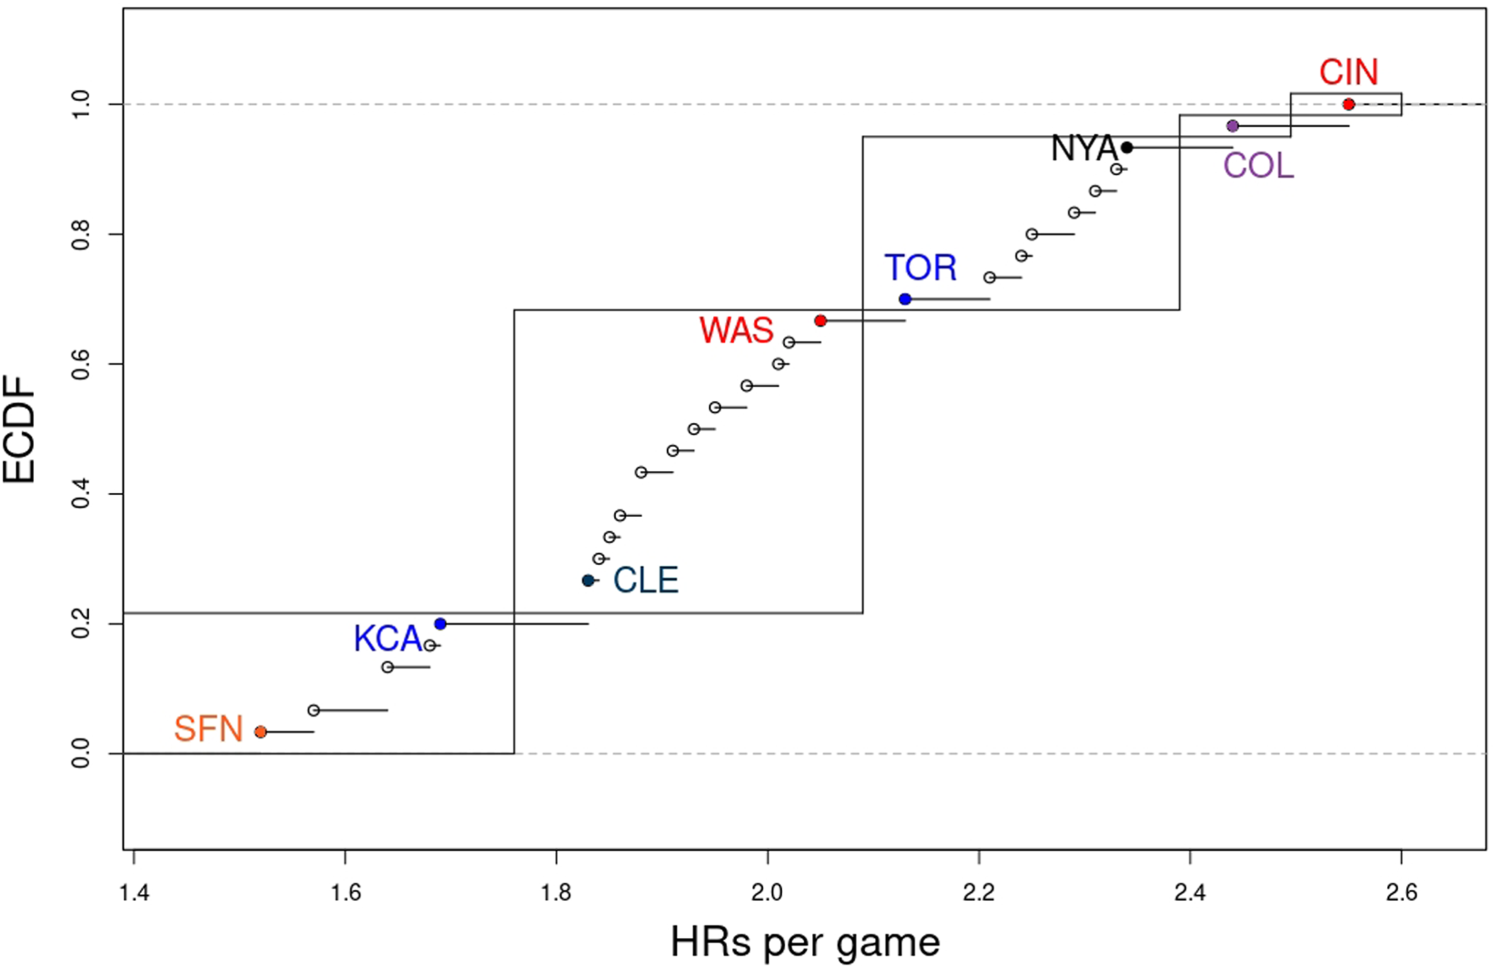
Empirical Cumulative Distribution Function of Adjusted Overall Park Means. Boxes enclose five tiers of ballparks.
More formal inferences may be drawn using a test statistic that takes a similar form to those discussed in Section “Pairwise comparisons within matchup”, albeit with more parameters involved. Inspection of the derivation for the marginal mean for Yankee Stadium shows that there are 7 parameter estimates involved. For pairwise comparisons of marginal means, the personnel components do not cancel so that a total of 11 parameter estimates are involved, along with the
Variance explained
To quantify the amount of variability in the observed number of HRs hit per game, the model is compared with several generalized linear mixed models containing subsets of the explanatory variables included in the full model. In these models, the response analyzed is the difference between observed home runs and the amount predicted by the generalized linear mixed model,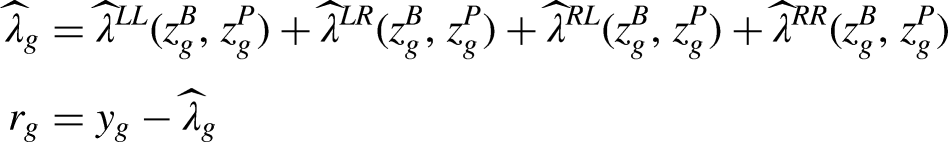
Candidate models to obtain the predictions
Residual variance,
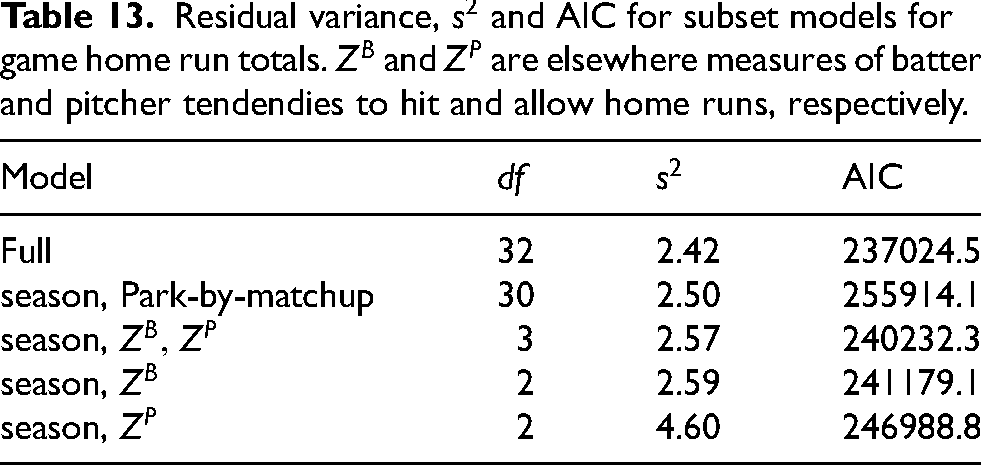
Inspection of the reduction in
Generalizability
With a large number of parameters to be estimated for the
Discussion
This work reframes the estimation of ballpark effects as a problem of isolating intrinsic ballpark characteristics from confounding due to player personnel and matchup composition. By defining park effects through the expected number of home runs in a game under league-average personnel and matchup frequencies, the proposed approach provides a principled basis for comparing ballparks on a common scale. The resulting rankings differ substantially from those based on observed home run frequencies alone, highlighting the extent to which commonly reported measures may reflect who plays in a ballpark, rather than properties of the ballpark itself.
These differences have practical consequences. Measures of ballpark effects are used, implicitly or explicitly, in arbitration, contract negotiations, and roster construction, where teams commit substantial financial resources to players who play half their games in a given ballpark. Rankings based on short-term summaries, including those reported by media outlets and MLB Advanced Media, are often based on only a few seasons of data and typically do not explicitly account for pitcher handedness or variation in matchup frequencies. As a result, they may fluctuate considerably from year to year and may provide a misleading characterization of a ballpark’s effect on home run production. Similar considerations arise in fantasy sports and related predictive settings, where evaluations of park effects are frequently based on limited data. For example, commentary in the fantasy baseball literature suggests that evaluations of ballparks may be revised more readily based on a single season of data than evaluations of individual players (White, 2026). The framework developed here provides an alternative that is interpretable, statistically grounded, and accompanied by measures of uncertainty.
A central feature of the proposed methodology is the incorporation of personnel effects through “elsewhere” measures of batter and pitcher performance. By constructing these measures using data from ballparks other than the one in which the response is observed, the model separates estimation of player ability from estimation of ballpark effects. This approach, which directly incorporates individual batter and pitcher contributions into a model for home run counts, has received limited attention in the literature (Albert et al., 2024). While the use of career-based aggregates reduces variance and mitigates the influence of the current ballpark, it may introduce bias through the omission of temporal effects such as aging. Because of selection effects, most plate appearances involve players with sufficiently long careers, for whom performance typically follows a concave age trajectory. Possible refinements include constructing elsewhere measures on a season-by-season basis, excluding plate appearances in a player’s home ballpark, or iterating between estimation of player ability and ballpark effects until convergence.
Recent advances in baseball analytics have emphasized high-resolution measurements, such as exit velocity and launch angle derived from Statcast data. These variables provide insight into the mechanics of individual batted balls and can be used to develop models at the pitch or batted-ball level. The focus of the present work is different. We consider a macro-level problem, namely the estimation of stable and interpretable ballpark effects at the level of games, where the goal is to compare environments rather than to model individual events. These approaches are complementary. While pitch-level data may provide additional explanatory power for specific outcomes, the effective sample sizes for derived quantities, such as home runs per fly ball, are often substantially smaller than those based on plate appearances, and the role of such variables in improving predictive performance remains an active area of research. For example, Judge (2018) finds limited gains from incorporating certain Statcast-derived measures into models of pitching performance. Developing methods that effectively integrate micro-level measurements with macro-level inference on ballpark effects remains an important direction for future work.
An important implication of the present framework is that any performance metric described as “adjusted for park effects” inherits the uncertainty associated with the underlying park estimates. In practice, many metrics reported in baseball media are described as adjusted for park effects, but the uncertainty in the park adjustment itself is rarely quantified. If park effects are estimated with error, then so are any downstream adjustments on which they are based. Given the use of these metrics in roster construction and high-stakes decision making, it is important that estimates of ballpark effects be both interpretable and accompanied by measures of uncertainty. By placing estimation within a probabilistic framework, the approach developed here allows for such uncertainty to be quantified and propagated.
Several limitations of the current analysis suggest directions for further research. The model does not incorporate weather-related variables, such as temperature, humidity, or wind, which are known to influence home run production and could further explain variability across ballparks. Ballparks themselves may change over time, as documented by Clem (2026), through modifications to fence heights or dimensions, and these changes are not explicitly modeled here. In addition, because the analysis is conducted at the level of game-matchup aggregates, it does not directly yield adjusted measures of individual batter or pitcher performance. Developing such estimates would be a natural extension using methods similar to those studied here.
Conclusion
Because ballpark effects are commonly assessed using measures that do not account for personnel composition, matchup frequencies, or sampling variability, there is a need for methods that isolate intrinsic ballpark characteristics in a statistically principled way. The approach developed here addresses this problem by defining park effects through the expected number of home runs in a game under league-average personnel and matchup conditions, while incorporating handedness, player ability, and uncertainty quantification within a unified framework.
This framework is the first to address this problem using statistics for individual batters and pitchers while also providing standard errors for the resulting marginal means. The model takes the number of HRs hit in a game to behave like a Poisson random variable, conditionally on matchup handedness, ballpark, season and personnel covariates. Poissonness plots (Hoaglin, 1980) suggest that the model provides a reasonable fit to data collected over the 2010–2024 period. A cross-validation study indicates that the fitted model generalizes well to new out-of-sample data.
Inspection of HR frequencies indicates ballpark effects of considerable magnitude. In the case of LL matchups, both empirical and adjusted mean HR frequencies for Globe Field in Texas are more than twice as large as those for PNC Park in Pittsburgh. For a given ballpark, the relative ranking can be quite different for one matchup than it is for another. In some cases, the ranks of means adjusted for personnel are dramatically different than ranks based only on empirical means that do not control for personnel differences. RL matchups at the Great American Ballpark in Cincinnati or Citizen’s Bank Park in Philadelphia are two examples. The methodology reveals parks that exhibit asymmetric HR frequencies. Yankee Stadium in New York is an example, with adjusted means for LHBs against LHPs and RHPs ranked 4th and 2nd respectively, while the corresponding ranks for RHBs are 11th and 7th, a finding that is consistent with the ballpark’s reputation based on the “short porch” in right field. Similar advantages in adjusted means for RHBs are observed for Wrigley Field in Chicago and Petco Park in San Diego.
The construction of these adjusted means may be viewed as an analysis of covariance, with personnel measures for batter and pitcher tendencies included as covariates. By evaluating the fitted model at average values of these covariates, ballparks can be compared on an even footing, with differences in personnel and matchup composition accounted for. The resulting estimates provide an interpretable and statistically grounded alternative to commonly reported park factors, and allow for formal inference through uncertainty quantification and multiplicity-adjusted comparisons.
The adjusted means offer an important additional inference beyond simple univariate summaries like the HRPF. The units, HRs in a game, are meaningful. Further, with the Poisson assumption, these adjusted means also serve as estimates for the population variance, facilitating quantification of the entire distribution of HRs for a game-matchup combination.
An interesting next step would be to adjust estimates of the abilities of individual batters to hit and pitchers to prevent HRs that take handedness and quality of the opponents, ballpark and division into account. This could improve the assessment of how players might perform with a change of scenery. It could be used to assist decisions about whom to acquire and whom to release. Another interesting aspect to ballpark effects is whether and how they change over time, beyond other apparent league-wide trends in scoring and HRs.
Footnotes
Declaration of interest statement
The authors declared no potential conflicts of interest with respect to the research, authorship, and publication of this article.
Funding
The author(s) received no financial support for the research, authorship, and/or publication of this article.