



Abstract
Enhanced productivity remains a crucial agenda for firms to attain cost and competitive advantages in the market. Hence, the main purpose of this study is to investigate the effects of efficiency wage (EW) on the productivity of microfinance institutions (MFIs) with respect to their dual objectives, namely, outreach (depth and breadth) and financial sustainability. Unbalanced panel data of 179 Indian MFIs were collected over the period 2010–2018 from the Microfinance Information Exchange (MIX) market platform (now obtainable from the World Bank catalogue). Under a static model setting (fixed effects model), the observed relationship between EW and MFI’s productivity is mixed. On the one hand, EW exhibits a strong and statistically significant positive relationship with the breadth of outreach, even after considering various control variables and alternative proxies of EW. On the other hand, EW shows no positive influence on the MFIs’ depth of outreach; rather, it results in a mission drift of MFIs, with the poorest of the poor being neglected (weak and insignificant for proxy of EW). Concerning the financial sustainability of MFIs, EW exhibits a positive and statistically significant effect, except for the profitability dimension when an alternative proxy of EW is used. A two-step system generalized method of moments (GMM) performed to limit endogeneity problems also validates most of our findings. The outcomes of this study could help MFIs’ managers in designing appropriate financial packages to enhance MFIs’ productivity and subsequently attain the dual objective of outreach and sustainability.
Keywords
Introduction
The main purpose of microfinance is to provide financial services to the financially excluded and the poor. However, microfinance institutions (MFIs) are faced with the challenge of financial sustainability due to limited or lack of donations from their stakeholders, who are now been replaced by market-based investors (Hoque et al., 2011). This has forced many MFIs to overlook their social mission in a bid to boost their financial gains by serving the relatively wealthier clients—a condition termed as mission drift (Armendáriz & Szafarz, 2011; Mia & Lee, 2017). This shift in priority is evidenced by the presence of a trade-off between financial sustainability and outreach (depth) objectives of MFIs (Awaworyi Churchill, 2018). 1 Unfortunately, there is no conclusive mechanism through which MFIs can simultaneously achieve financial and outreach goals. In view of this, we investigate whether efficiency wage (EW), that is, paying more than the market average wage, could solve the microfinance mission drift
Several pioneering models have examined the nexus between EW and firms’ performance. For example, Shapiro and Stiglitz (1984) developed a ‘shirking’ model in which firms are willing to pay their employees more than the average market-clearing wage to discourage them from shirking. Given the cost and deficiency associated with monitoring shirkers, payment of higher wages constitutes a better alternative to motivate workers to keep their job while putting in their best effort (Mankiw, 2019). Moreover, by paying wages higher than the market average, firms can also attract and retain relatively skilled workers from the pool of diverse heterogeneous workers in the labour market (Stiglitz, 1976). As highlighted by Peach and Stanley (2009), higher wages are regarded as a ‘gift exchange’ between firms and their labour force based on the argument of Solow (1979) and Akerlof (1982) that it increases employees’ loyalty and ultimately firms’ productivity. Furthermore, Mankiw (2019) argued that better-paid workers tend to enjoy a highly nutritious diet, which translates into better health and higher productivity compared to their underpaid counterparts. In addition, workers’ turnover problems can also be mitigated via the introduction of EW. Since recruiting and training new employees is costly, firms can actually improve their worker retention rates, lower their overall production costs and eventually lift their productivity by paying higher wages (Mankiw, 2019).
Hence, the main objective of this study is to empirically investigate the EW hypothesis on various dimensions of MFIs’ productivity. We argue that if EW increases productivity, then it will enhance both the outreach and the financial sustainability dimensions of MFIs, thereby preventing mission drift. Our study contributes to the existing literature in several ways. First, it is one of the earliest studies that attempts to understand the EW-productivity nexus in the microfinance industry utilizing recent and large panel data (unbalanced) of a single country (i.e., India). Besides, our sample of MFIs is relatively larger compared to those used for other single-country studies (in different research contexts and dimensions, such as Bangladesh, Indonesia, Vietnam and Sri Lanka; Fithria et al., 2021; Lebovics et al., 2015; Mia et al., 2019; Wijesiri et al., 2015). Focusing on one individual country is important because national heterogeneities that often dominate cross-country studies are removed.
Second, in line with the twin objectives of MFIs, we assess the effect of EW on the outreach (breadth and depth) and financial sustainability goals of MFIs independently. On the one hand, paying wages above the market average may represent an additional financial burden to the firm. On the other hand, it can reduce the overall operating expenses, as higher labour productivity will require less input (i.e., labour) to attain the given set of output, thus increasing the overall firm’s profitability (Mankiw, 2019). Third, our findings could provide insightful evidence to policymakers and practitioners to draft appropriate policies to mitigate the mission drift of MFIs. Fourth, this study emphasizes the assessment of EW-productivity relationship in the context of MFIs, which is less examined compared to the formal labour market; more importantly, we test the EW hypothesis on the outreach of MFIs—an aspect often ignored in the credit intermediation sector, except in microfinance.
Literature Review
Summary of the Indian Microfinance Industry
The Indian microfinance sector has made significant progress in reaching out to the financially excluded, and studies have shown that microfinance does have a beneficial impact on the poor’s well-being (Amarnani & Amarnani, 2015). However, the lack of access of a considerable chunk of the Indian population to the traditional banking system still leaves a lot of prospects for the MFIs to expand their financial services (Chauhan, 2021). In India, there are two prominent microfinance models, namely, the ‘self-help group (SHG)-Bank linkage programme (SBLP)’ and the ‘MFI’ model. The quality of the asset portfolio under the MFI model has been outstanding, thanks to the efficient operation of MFIs. Depending on their legal status, MFIs in India can be typified as non-banking finance institutions-MFI (NBFC-MFI), mutually aided cooperative societies (MACS), Section-25 companies, Society/Trust and co-operatives (other than MACS). Recently, some large-size MFIs, namely, Ujjivan, Jayalakshmi, Equitas, Suryoday, Evangelical Social Action Forum (ESAF) and Utkarsh, have been converted into small finance banks (SFBs).
The trend in the number of active borrowers and deposits in the Indian microfinance sector is reported in Figure 1. Interestingly, the sector observed a rapid increase in its borrowers’ portfolio up to 2011, after a sudden drop. This drop can be attributed to the Andhra Pradesh crisis from 2010 to 2011, which resulted in the widespread defamation of microfinance activities and the consequent enactment of some regulatory interventions to curtail microfinance operations. Nevertheless, the sector rebounded after 2012. It is worth noting that the number of depositors relative to the number of borrowers is unimpressive in the Indian microfinance sector. This may be explained by the prohibition of conventional MFIs from collecting deposits. Therefore, only few depositors rely on MFIs (particularly the NBFCs) to mobilize their meagre savings.

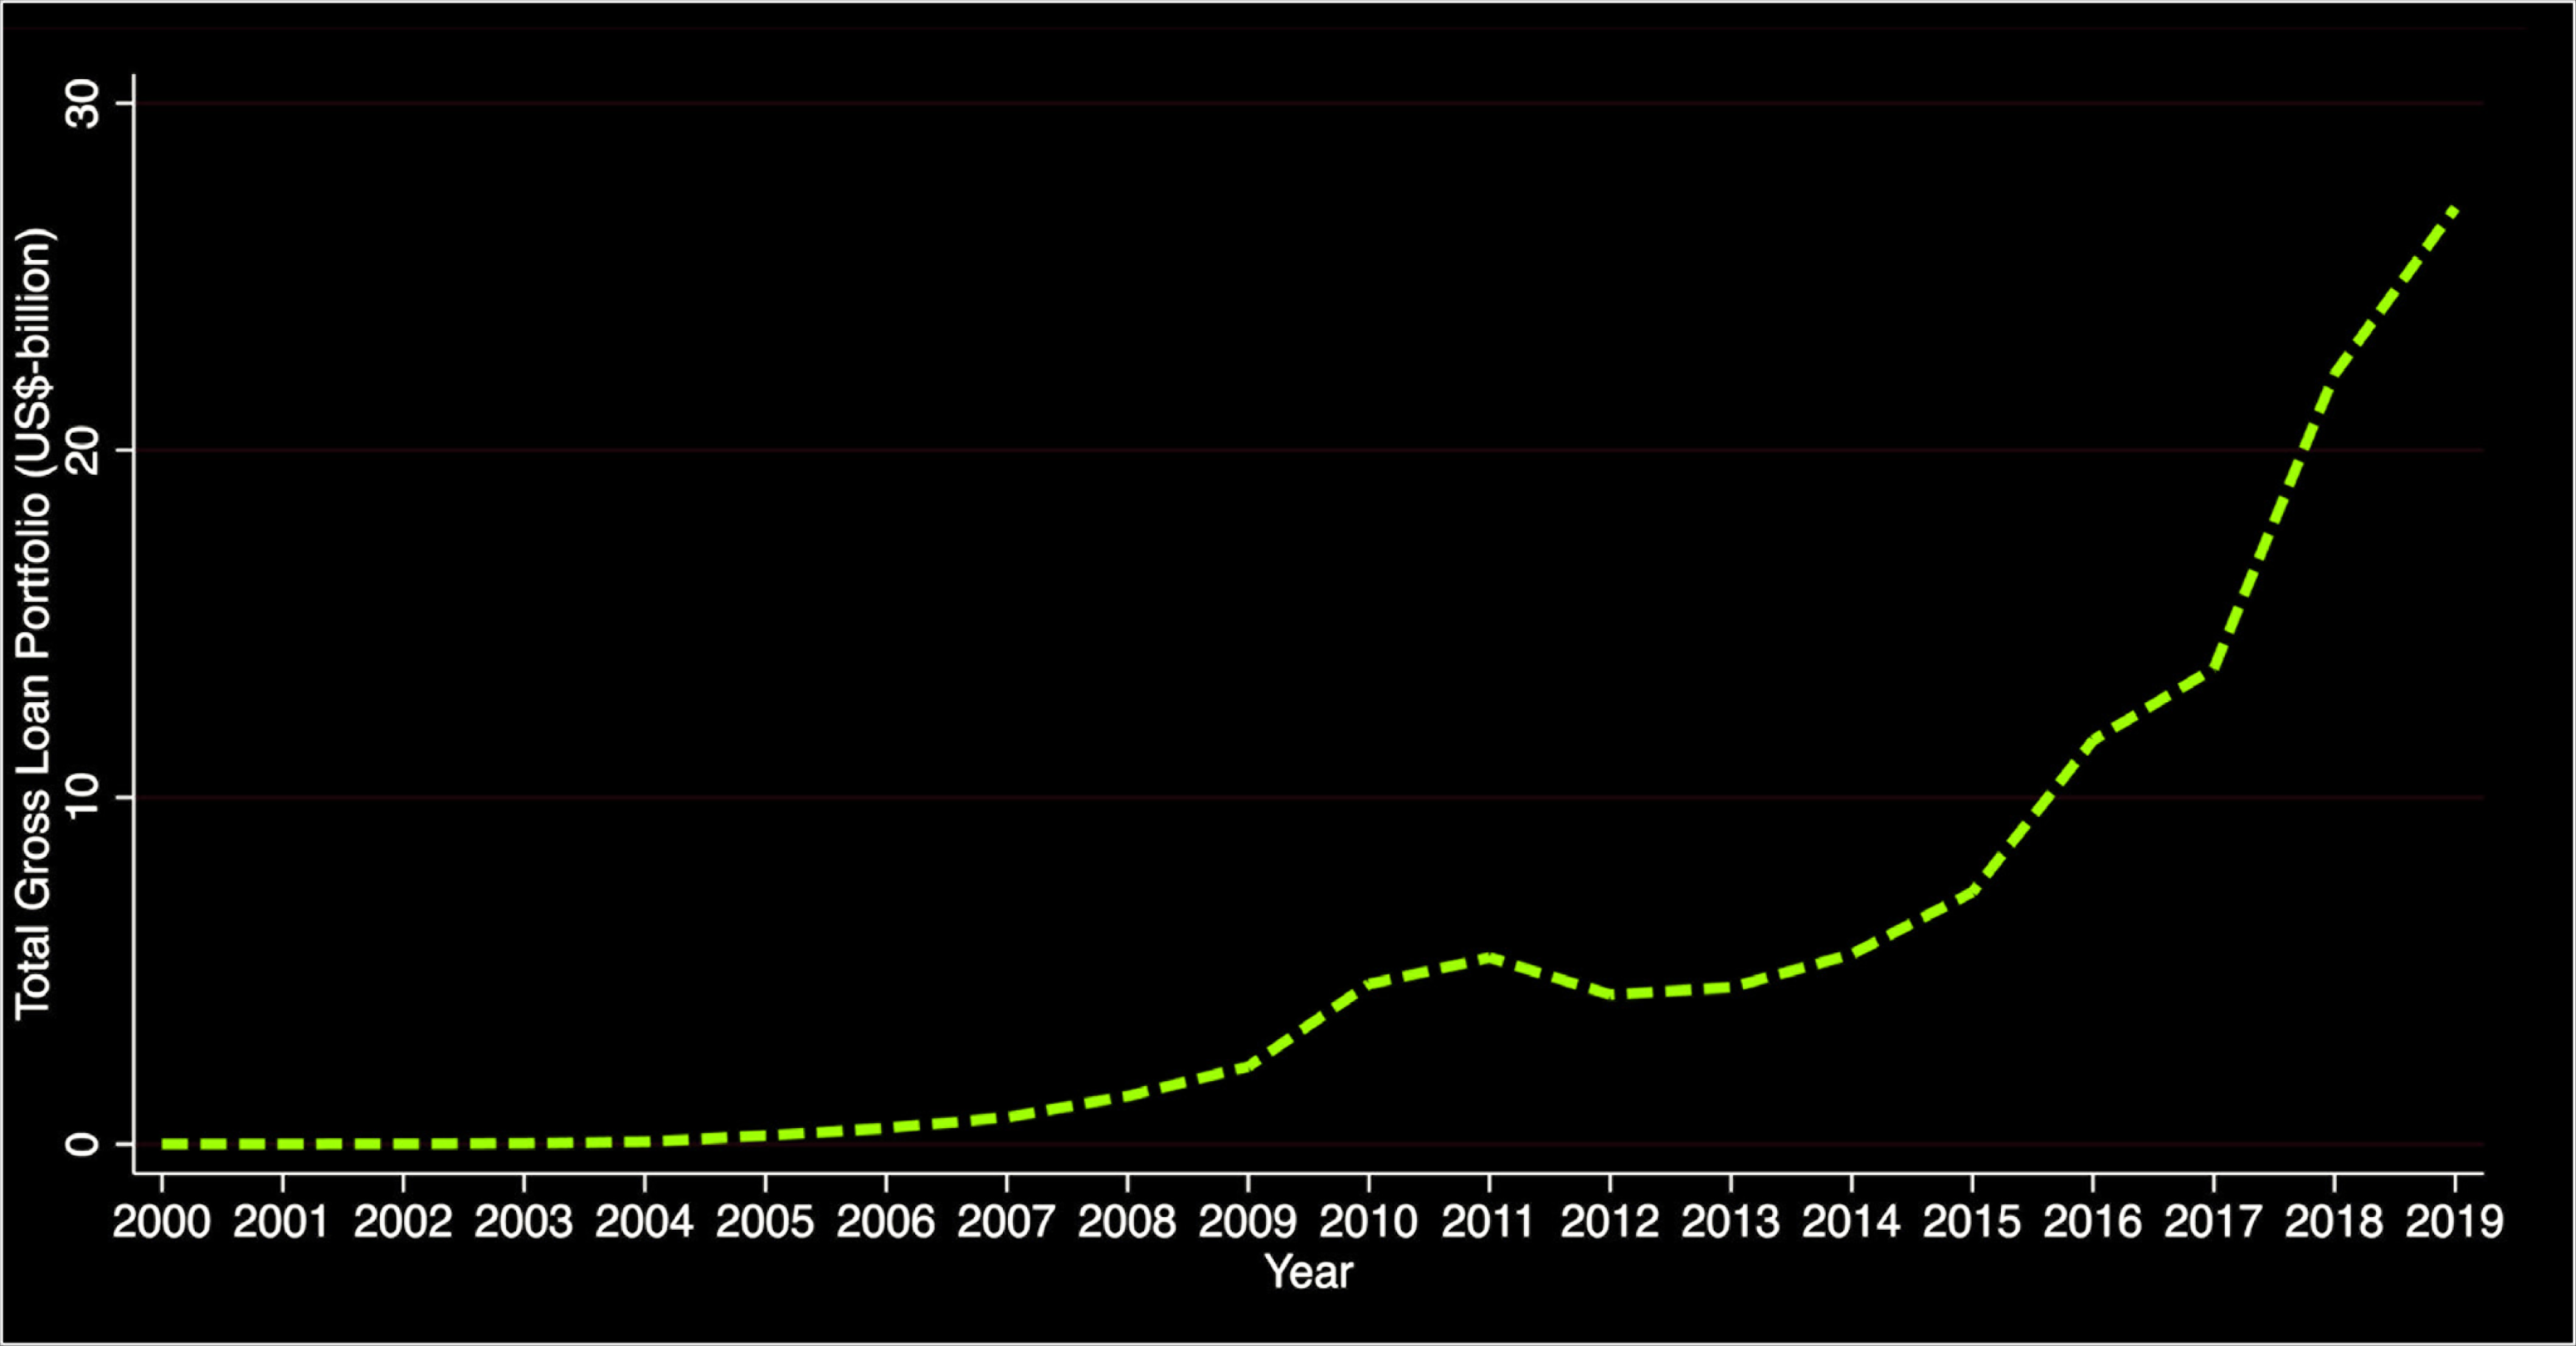
Figure 2 shows the trend of the average gross loan portfolio in the Indian microfinance sector. Considering its around US$ 30 billion gross loan portfolio market, the microfinance sector in India can be considered one of the largest in the world. As per 2019 data, banks through SHG hold the largest portfolio in microcredit, boasting a total loan outstanding of USD 10.69 billion or 40.9% of the total Indian microcredit (FC Bureau, 2019). This is succeeded by NBFC-MFIs (USD 7.89 billion or 30.2%), SFBs (USD 4.44 billion or 17 %), NBFCs (10.8 %) and other MFIs (1.1%; The Pioneer, 2019). These estimates are mostly consistent with the overall gross loan portfolio reported in Figure 2. An interesting finding from Figures 1 and 2 is that, despite the drop in the number of active borrowers in 2019, the gross loan portfolio still has an upward trend. This indicates that the MFIs are not reaching out to new clients; rather, existing clients are served with bigger loan sizes, particularly in the year 2019.
Efficiency Wage and Productivity: A Brief
The term EW refers to the payment of wages more than the market average. When the wage is low, few highly skilled workers will be willing to take the job. On the contrary, workers’ effort will be enhanced when higher wage is offered (Solow, 1979). The basic premise of the EW theory is that wages are not entirely driven by market forces, and that higher wages may improve employees’ well-being. Therefore, EW hypothesis proposes that wage rate positively affects labour productivity.
Solow (1979) was the first to utilize the wage-productivity link to explain wage stickiness, arguing that it is compatible with the profit maximization strategy of the employer. Akerlof & Yellen (1986) provided a clear and consistent explanation for why companies would find it unprofitable to lower wages in the face of involuntary unemployment. According to these models, labour productivity is determined by the firm’s real pay, and wage cuts that hurt productivity may lead to higher labour expenses. Furthermore, Bewley and Bewley’s (2009) survey suggests that workers’ morale depends on the wage fairness within the firm since they are mostly unaware of the average wage paid outside the firm.
Romer (2001) suggested that workers’ efforts are determined by not only the real wage rate but also the unemployment rate. An increase in unemployment can be the outcome of an adverse shock, resulting in the need for extra effort from the employed workers to cushion the economic downturn. Ross and Zenou (2008) developed an urban EW model in which employees who devote comparatively more time to commuting were found to have incentives to shirk at work. Following Ross and Zenou’s (2008) theoretical model, Giménez-Nadal et al. (2020) tested the urban EW model in France and Spain, and they observed that a positive correlation exists between commuting and monthly earnings.
Zhang and Liu (2013) used the EW hypothesis to examine the changing pattern and influencing factors of the wage-labour productivity correlation in China’s manufacturing sector. While there is a significant positive correlation between wages and labour productivity in manufacturing enterprises, they discovered that it has become looser and weaker over time. Furthermore, Kim and Jang (2019) revealed that increasing the US federal minimum wage results in a sharp increase in firm’s productivity of the restaurant industry for up to two years. Rizov et al. (2016) found that the introduction of the UK’s national minimum wage positively affected the average productivity of the low-paying sector. Thus, there is sufficient evidence in the literature to believe that EW can result in higher labour productivity. Figure 3 shows a general cycle of EW and its potential role in mitigating the problem of mission drift by enhancing both the financial and the outreach productivities of MFIs.
Understanding mission drift requires having prior knowledge on dual missions of MFIs, namely, financial sustainability and social outreach. For example, financial sustainability is determined by the extent to which MFIs are efficient in using resources and turning them into credit and related services (Piot-Lepetit & Nzongang, 2014). This implies that the institution needs to generate sufficient income to at least repay the opportunity cost incurred for all inputs and assets (Chaves & Gonzalez-Vega, 1996). A major issue worthy of note in regard to the MFIs’ quest for financial independence is the existence of a trade-off between their financial sustainability and social outreach goals—a mission drift. In this regard, MFIs neglect their outreach objective for the sake of attaining their financial sustainability goal (Mia & Lee, 2017). Several studies suggested that a trade-off exists between outreach and financial sustainability of MFIs (Awaworyi Churchill, 2018). Awaworyi Churchill (2018) divided outreach performance into depth and breadth and discovered that there is a trade-off between sustainability and the outreach depth (i.e., reaching out to the poorest of the poor), contrary to the observed complementarity between sustainability and the outreach breadth (coverage of wider clients). Moreover, Zainuddin et al. (2020) re-examined the relationship between the outreach and the sustainability of MFIs by including the national culture dimension, and they found that the depth of outreach and financial sustainability of MFIs are still negatively related, although the relationship is moderated by national culture. However, some studies have advocated the inexistence of a trade-off between the outreach and the financial sustainability of MFIs; in other words, focusing on financial sustainability does not necessarily affect the depth and breadth of outreach, indicating that outreach and financial sustainability could be achieved simultaneously (Nurmakhanova et al., 2015). This is further supported by Kulkarni’s (2018) non-observance of a trade-off between the efficiency and the outreach performance of MFIs in India.

Considering all these facts, we would like to examine how EW can be an important instrument to enhance both the financial and the social outreach goals of MFIs through enhancing labour productivity.
Methodology
Labour Productivity—A Contextual Fact
This paper deals with EW, an important component of incentive schemes for MFIs to achieve better labour productivity. Emphasizing the labour factor is of paramount importance to microfinance, especially for several institutional and policy reasons, and ultimately for the overall societal well-being. First, incentive schemes have a signalling role, as they generally represent an indicator of good governance in firms (Labie & Mersland, 2011). In microfinance, they are even more important, as good governance as well as the productivity and efficiency of the MFIs are key factors driving the decision of donors and investors in general (Balkenhol & Hudon, 2011; Biancini et. al, 2017). Second, we have chosen to address the issue of employees’ EWs due to increasing competition in the microfinance sector during the last two decades. Indeed, rising competition in the sector encourages MFIs to efficiently exploit their productive resources and operate at full capacity (Armendariz & Morduch, 2005; McIntosh & Wydick, 2005).
Third, we concentrated on the labour input because, compared to other credit providers and other sectors, in particular, the operation of MFIs is highly labour-intensive, especially in developing countries where microfinance is still largely dependent on the traditional and non-automated procedures. The selection of India as a field of analysis further strengthened our single-country study, which already benefits from the absence of national heterogeneities that often dominate cross-country studies.
Modelling Efficiency Wage and Productivity of MFIs.
Since very little of the literature has investigated the impact of EW on the productivity of the microfinance industry, we have relied on the existing contributions from other sectors (e.g., Dosi et al., 2020). Based on the intuition of EW and productivity hypothesis, we considered the following econometric model:

where i represents an MFI, t, the time period (year), Y, the productivity (labour) of MFIs, EWit is the efficiency wage;, Xit, a vector of control variables and εit a zero-mean error term.
We have given special attention to the selection of dependent variables. Since microfinance had dual objectives, we have focused on two types of productivity measures, namely, outreach and financial sustainability. For each of the productivity dimensions, we have used two different yet conceptually related variables, similar to the approach of Barnett and Salomon (2012). According to them, there are several benefits to using such an approach. For example, using two variables to capture one dimension of productivity will mitigate some deficiencies inherent in selecting one over another. Nonetheless, since the proxy variables will reflect different aspects of the productivity performance of MFIs, the variations in the outcome can be utilized for a better explanation.
As such, we have selected outreach and financial sustainability variables based on the classical approach of Yaron (1994). Outreach is typically divided into two aspects: breadth and depth (Schreiner, 2002). In defining these two dimensions, Schreiner (2002) noted that ‘the breadth of outreach is the number of clients’ (2002, p. 595), while ‘the depth of outreach is the value that society attaches to the net gain of a given client’ (2002, p. 594). On the one hand, the literature normally considers the number of active borrowers and loans served to indicate the breadth of MFIs’ outreach (Hartarska et al., 2013; Wijesiri et al., 2017). Consequently, we measured labour productivity in terms of outreach using the number of borrowers per staff (LNBPS) and loans per staff (LNLPS). Higher values in any of these indicators indicate a greater breadth of outreach. On the other hand, we have considered two variables for the depth of outreach, namely, average loan size per borrower (ALSPB) and multiplicative inverse of average loan size per borrower (1/ALSPB). Generally, loan size is considered one of the crucial proxies to capture the economic well-being of a client (Hisako, 2009; Paxton, 2003; Quayes, 2012). For example, loan demand usually increases with an increase in the well-being of clients; hence, the higher the loan size the lower the depth of outreach.
Subsequently, financial revenues and profits were considered to capture the financial productivity dimensions, as it is necessary for MFIs to continuously provide banking financial supports to the masses (Gutierrez-Nieto et al., 2007). Hence, average revenues per staff member (AVGREV) and average profit (AVGPROFIT) per staff member were taken as productivity measures, which is related to financial sustainability. 2 For ease of interpretation and better model fitness, the breadth of outreach and financial productivity variables were transformed into natural logarithm.
For the main independent variable, we defined EW as the amount of personnel expenses over per capita gross national income (GNI) of an MFI minus the industry average of the same variable. A ‘0’ value of EW implies that an MFI is paying the wage at the market rate. The positive and negative values of EW mean that an MFI is paying wages above and below the market average, respectively. We opted for the normalization of average salary by GNI per capita, which provides a better estimation of EW, as it considers the effects of the economic cycle over the years.
Control variables include the size of the MFIs (total asset), board size (board), operational self-sufficiency (OSS) and write-off ratios (WORs). Concerning the effect of size, Im and Sun (2015) argued that bigger MFIs exhibit better access to financial resources, which enable them to fulfil their social purpose conveniently and effectively. Similarly, Wijesiri et al. (2017) observed that larger MFIs are better at serving the poor and achieve greater financial efficiency owing to their advantage of scale economies. However, Kar (2012) had initially hypothesized that the effect of size of MFIs can be both positive and negative, and further highlighted that technology, investment opportunities and diversifications differ between the sizes of MFIs. Furthermore, big-sized MFIs may use more technology in operation than their smaller counterparts, which may help MFIs improve their organizational efficiency and productivity (Singh & Padhi, 2015).
The effect of board size on MFIs’ dual performance can be mixed. For example, a larger board size may create inefficiency in the MFI governance protocol. Lower outreach productivity with a larger board size can be attributed to the prevalence of the free-riding behaviour and development of conflicts of interest as well as a slower and longer decision-making process (Adams & Ferreira, 2009; Harris & Raviv, 2008). In contrast, a larger board size ensures more oversight, transparency and accountability, resulting in a positive impact on the performance of MFIs (Shettima & Dzolkarnaini, 2018). The effect of the OSS of MFIs is expected to be positive on both the outreach and the financial productivity of MFIs. To illustrate, a financially better-off MFI can effectively serve the poor and achieve the intended financial objective (Mia & Ben Soltane, 2016).
Since increasing more loan portfolio is likely to result in a higher WOR (Hoque et al., 2011), MFIs may take a precautionary measure to limit their loans to more clients, thereby generating a negative effect on the outreach productivity. In India, a similar impact has been witnessed where several financial institutions have increased their microfinance activity in recent years, resulting in significant repayment issues and massive amounts of non-performing assets (Aluni & Ray, 2015). Therefore, these financial institutions had to limit their funding to finance many SHGs, which resulted lower outreach of MFIs. Moreover, a higher WOR also indicates poor loan portfolio quality of MFIs, thereby resulting in a lower revenue generation. Hence, a negative effect of the WOR on the overall financial and outreach productivity of MFIs cannot be ruled out. To ensure that our findings are unaffected by the extreme outliers, all variables were winsorized (5% and 95% levels) except for OSS, which is coded as a dummy. Definitions of all variables used in this study are presented in Table 1.
Definitions of Variables.

Data and its Sources.
The data of this study was extracted from the newly released World Bank database (initially under the MIX Market platform), and India was chosen due to its largest available informational set among all the reported countries. The importance of verifying the relationship of interest on a single country is one of the most crucial and innovative elements of this work. The specific characteristics of individual countries, their institutions, internal shocks and changes in their regulations appear to absorb most of the effects estimated in cross-country studies. India is a country whose huge size renders the assessment of extensive databases possible without encountering the problem of the country effects, which normally interfere with parameter identification in cross-country studies.
Microfinance Information Exchange (MIX) is the world’s largest platform for MFIs’ data and has been used extensively in the existing literature owing to its wide coverage, credibility and authenticity (Abdullah & Quayes, 2016). The study covers the period 2010–2018 to capture a large number of MFIs in the sample. The period was also motivated by the availability of the board-level variable, which is largely inexistent before 2010. After cleaning the data, we obtained an unbalanced panel of 179 MFIs, which is the maximum number available for a single country during the chosen period. However, some MFIs were excluded from the regression analysis due to missing data. 3
Results and Discussion
Descriptive Statistics.
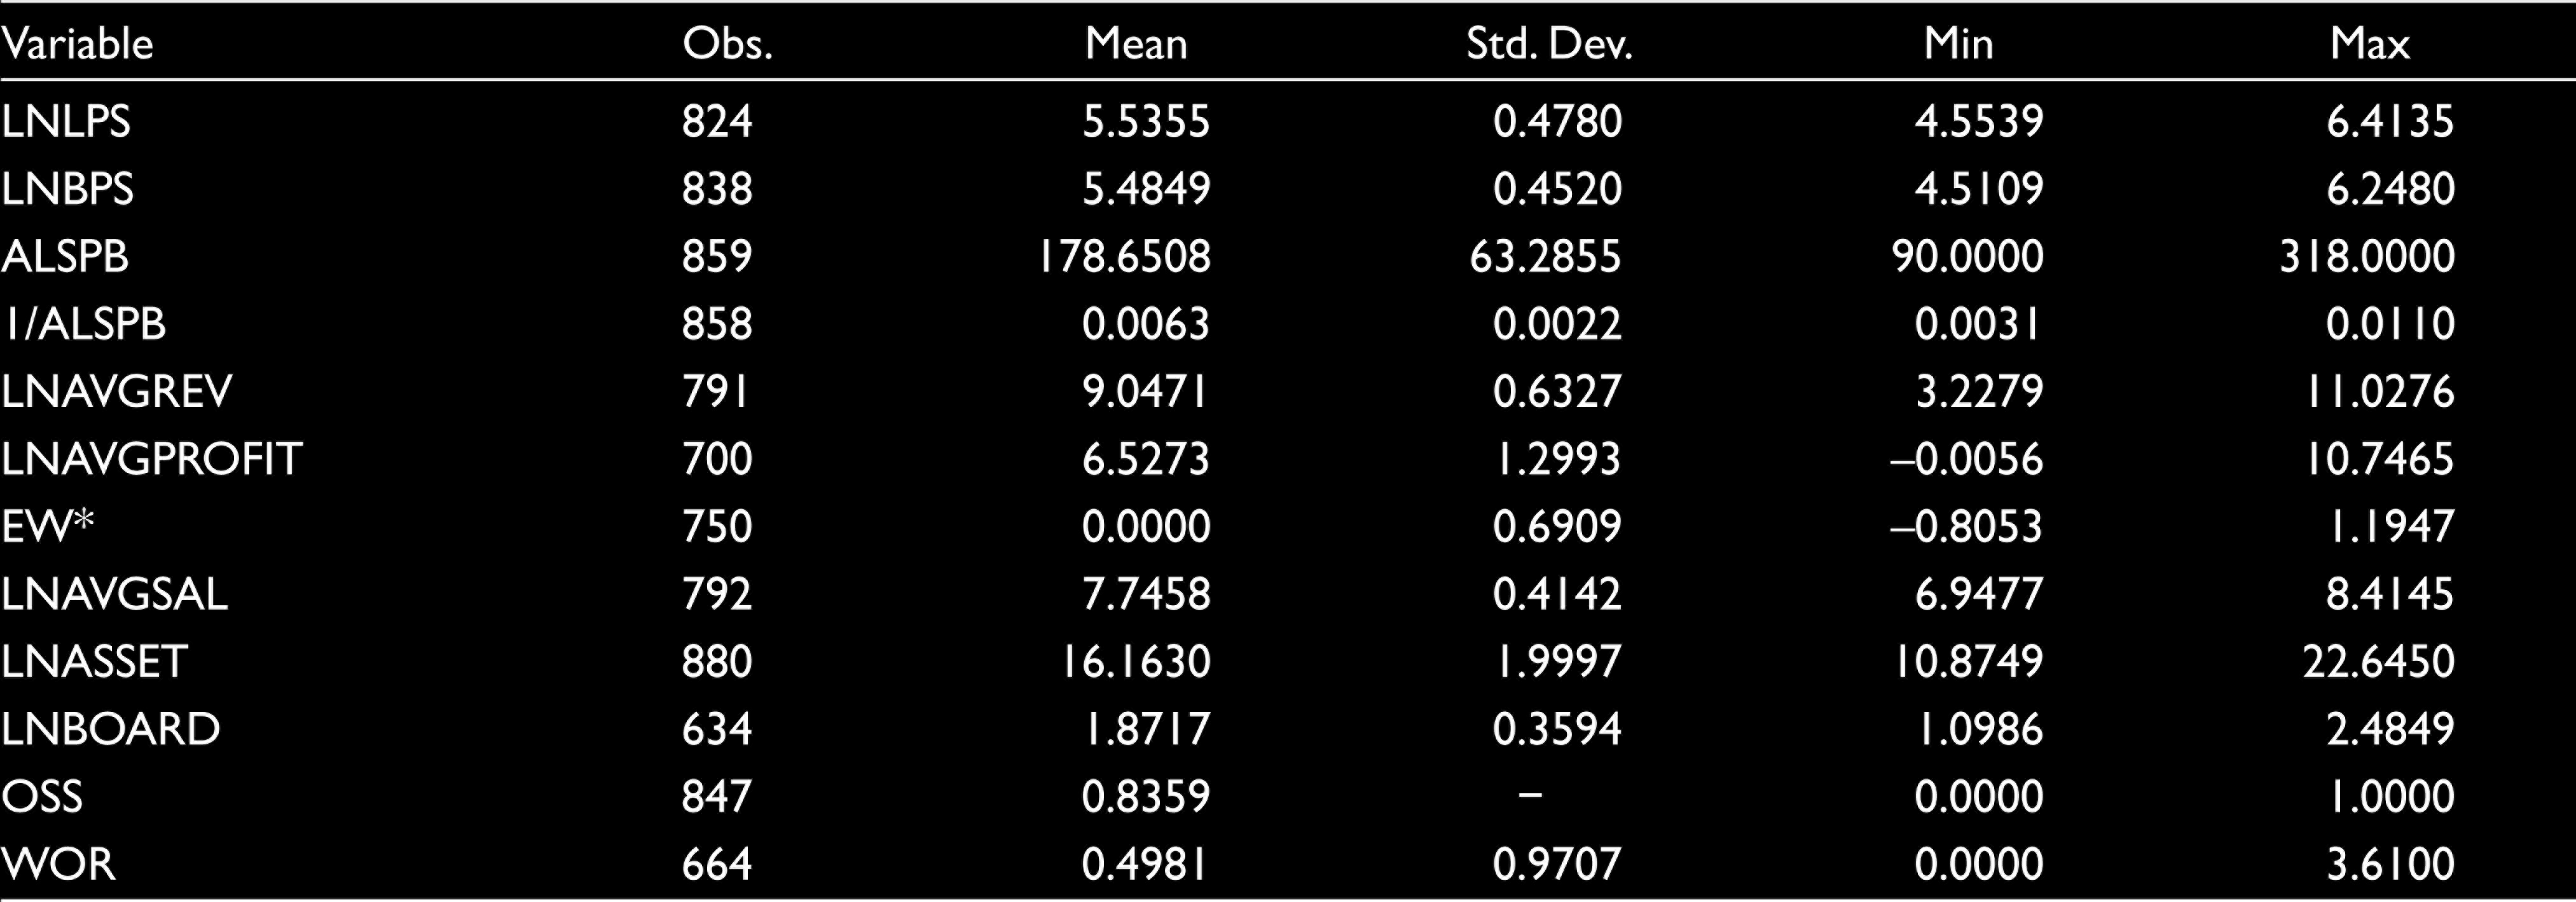
Based on the full sample, we have winsorized all the variables at 5% and 95% levels, and the descriptive statistics are reported in Table 2. The findings revealed that some firms paid wages lower than the industry average, as indicated in the negative minimum value of EW. Nevertheless, the mean value of EW was positive but very marginal, with a maximum value of 1.1947. Moreover, around 83% of the MFIs in our sample were found to be operationally self-sufficient, while the remaining were not (Table 2).
Descriptive Statistics (Full Sample, All Years).
Apart from descriptive statistics, the trend of average personnel expenses over per capita GNI (AVGSAL/GNI) in Figure 4 revealed that the average salary in the microfinance industry in India was (approximately two times) more than the per capita GNI throughout the period of interest (value greater than 1).

To ensure that the estimations were unaffected by multicollinearity, VIF and pairwise correlations were tested and revealed that their values are well below the conventional threshold limits (Table 3).
Variance Inflation Factors (VIF) and Pairwise Correlation.

Initially, we followed a step-wise regression approach (Bendel & Afifi, 1977). To control for time-invariant local effects such as legal status, location, regulation, etc. on the labour productivity of MFIs, we have used a fixed-effect model (FEM) to estimate Equation (1). However, we also estimated a Random Effects Model (REM), and the results are reported in Appendix A. 4 A simple comparison between the FEM and REM results revealed that the findings of EW remain qualitatively the same in both models, albeit with a slight change in other control variables. In addition, we have also used year/time effects in each of the models to control for the (assumably technological) changes that occur over the years. However, the coefficient values of year/time have been excluded from the tables for brevity.
Efficiency Wage and Outreach Productivity: Baseline Model
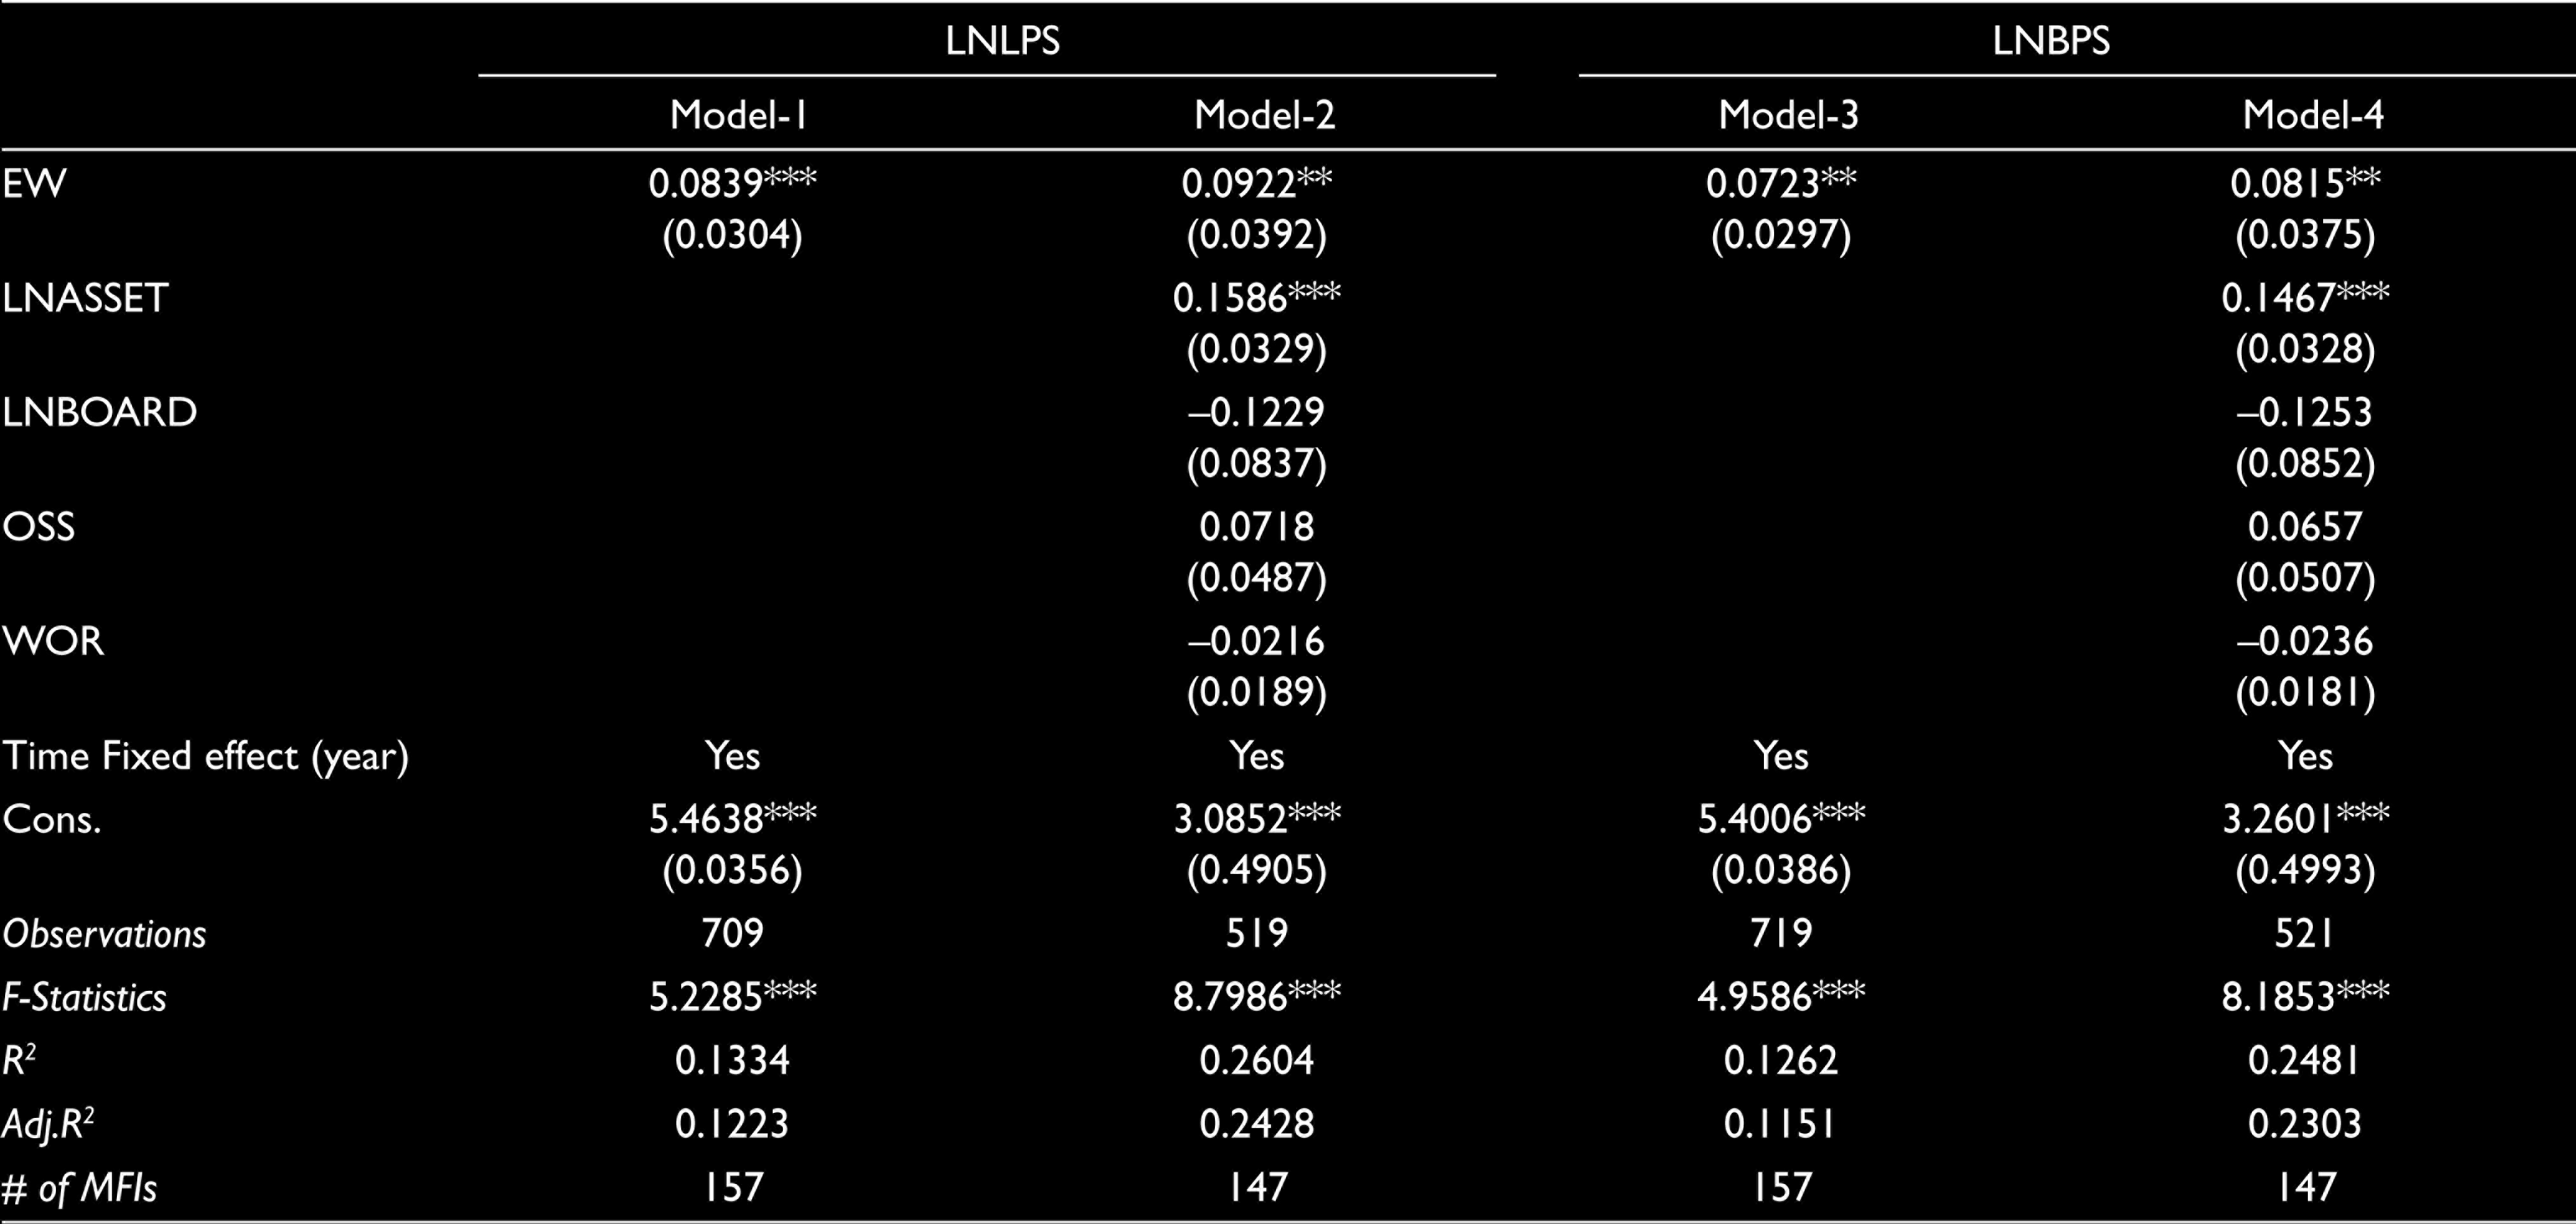
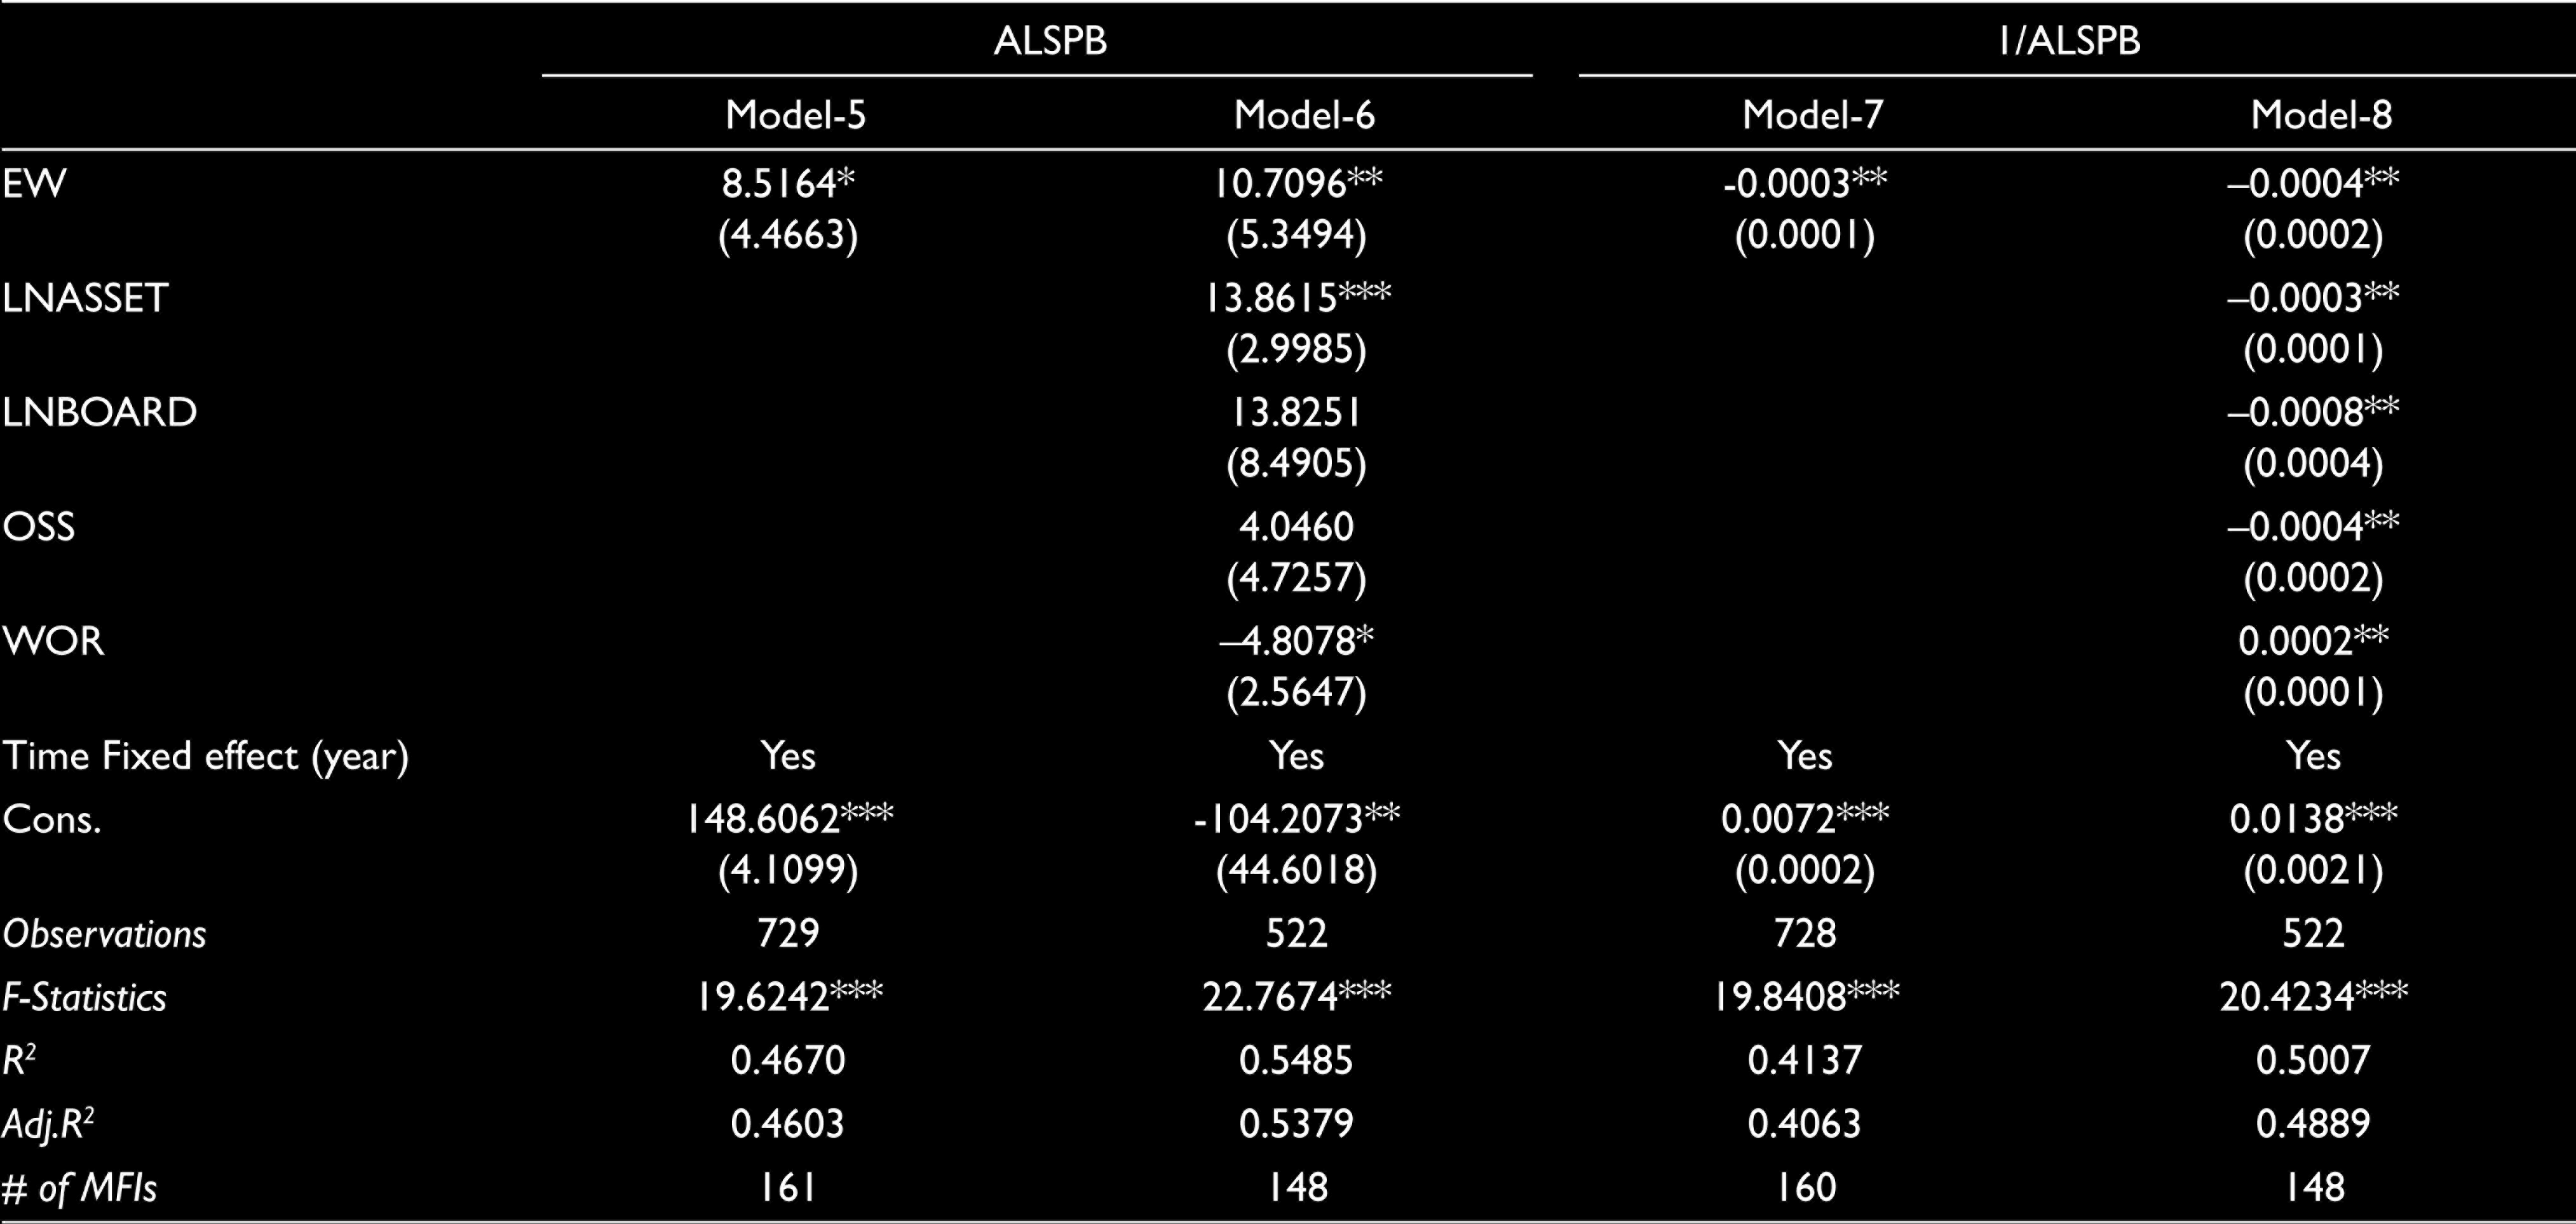
The base estimated results are reported in Tables 4, 5 and 6 for the breadth of outreach, depth of outreach, and financial sustainability of MFIs, respectively. 5 Overall, the goodness of fit is relatively acceptable, as all of the estimated models were significant at 1–10% levels (in terms of F-statistics) with and without control variables. It is noteworthy that the explanatory power of the models (in terms of R 2 ) ranges between 17% and 55% depending on the models and objectives of MFIs, which is modest and quite acceptable compared to many other studies in the field. In general, the depth of outreach productivity has a relatively better explanatory power compared to the other two dimensions of productivity (Tables 4–6). In the next section, the results of the various dimensions of productivity are discussed.
The Effect of Efficiency Wage on the Breadth of Outreach Productivity of MFIs (Fixed Effects Model).
The Effect of Efficiency Wage on the Depth of Outreach Productivity of MFIs (Fixed Effects Model).
The Effect of Efficiency Wage on the Financial Sustainability Productivity of MFIs (Fixed Effects Model).
The Breadth of Outreach Productivity
Based on the argument of the EW-productivity hypothesis, our results statistically confirm that providing higher wages (above the market level) increases the labour productivity of MFIs, particularly in terms of the breadth of outreach (Table 4). Since the coefficients of EW are positive and statistically significant, we quantified that a 1 unit increase in EW results in a 7%-9% increase in the outreach (breadth) productivity measures on the extensive margin (Models 1– 4). The results remain robust even after introducing several control variables. This outcome can be attributed to the existence of a minimal conflict between MFIs (principal) and employees (agents), coupled with competition-related arguments. Generally, the social objectives of MFIs are to serve the financially excluded and alleviate poverty, and their employees can remain inclined to these objectives, provided they are paid good salaries and effectively trained on the social orientation of MFIs (Tchakoute-Tchuigoua & Soumaré, 2019), thus aligning the mission of the MFI with the genuine efficiency-wage approach.
In interpreting the breadth of outreach outcome, the evolution undergone by the microfinance sector in recent decades must be considered. Indeed, competition in this sector has increased significantly, which may not only induce the MFIs to increase their breadth of outreach but also exacerbate the principal-agent problems in their loan disbursements. In principle, competition encourages the retention of employees (e.g., loan officers) who have accumulated significant experience and also possess private information of their clientele (Aubert et al., 2009). Recruiting new loan officers is a lengthy and costly process, as time and resources are required to recruit new officers who will have to gather information about the existing as well as prospective customers. Moreover, exhaustive training is needed to acquaint the new recruits with the social orientation of MFIs and the overall microfinance mechanism. Retention of loan officers with a good acumen of microfinance as well as its clientele information requires offering them better wages (Aubert et al., 2009), especially if several better opportunities await them in the job market due to high competition in the industry. Thus, better wages can motivate staff members to put their best efforts towards improving the breadth of outreach of the MFIs, which is evident in this study. Furthermore, higher wages bring about a sense of career growth among the employees and make them feel valued within the organization (Holtmann & Grammling, 2005).
Depth of Outreach Productivity
The results of the depth of outreach productivity based on the ALSPB and multiplicative inverse of the same variable (1/ALSPB) are reported in Table 5. Our findings revealed that EW can lead to a lower depth of outreach, as the sign of EW is positive and negative for ALSPB and 1/ALSPB, respectively. The findings are statistically significant at 5% and 10% levels (Table 5). This outcome reflects the mission drift of MFIs and can be explained in several ways. For example, in a bid to attain the intended promotion based on the amount of loan portfolio and loan recovery rate (often considered as parameters for employees’ performance), the employees—or more specifically the loan officers—may ignore the relatively poor clients and focus more on distributing loans to the wealthier ones. Hence, our findings partly support the widely held argument that the employees of MFI will focus on the non-poor or near-poor population, as this group has relatively higher income and better repayment capacity, subsequently leading to mission drift. Despite having a different theme, the results of our study are quite consistent with that of Ranjani and Kumar (2018), which revealed the presence of mission drift in the Indian microfinance industry.
Financial Sustainability Productivity
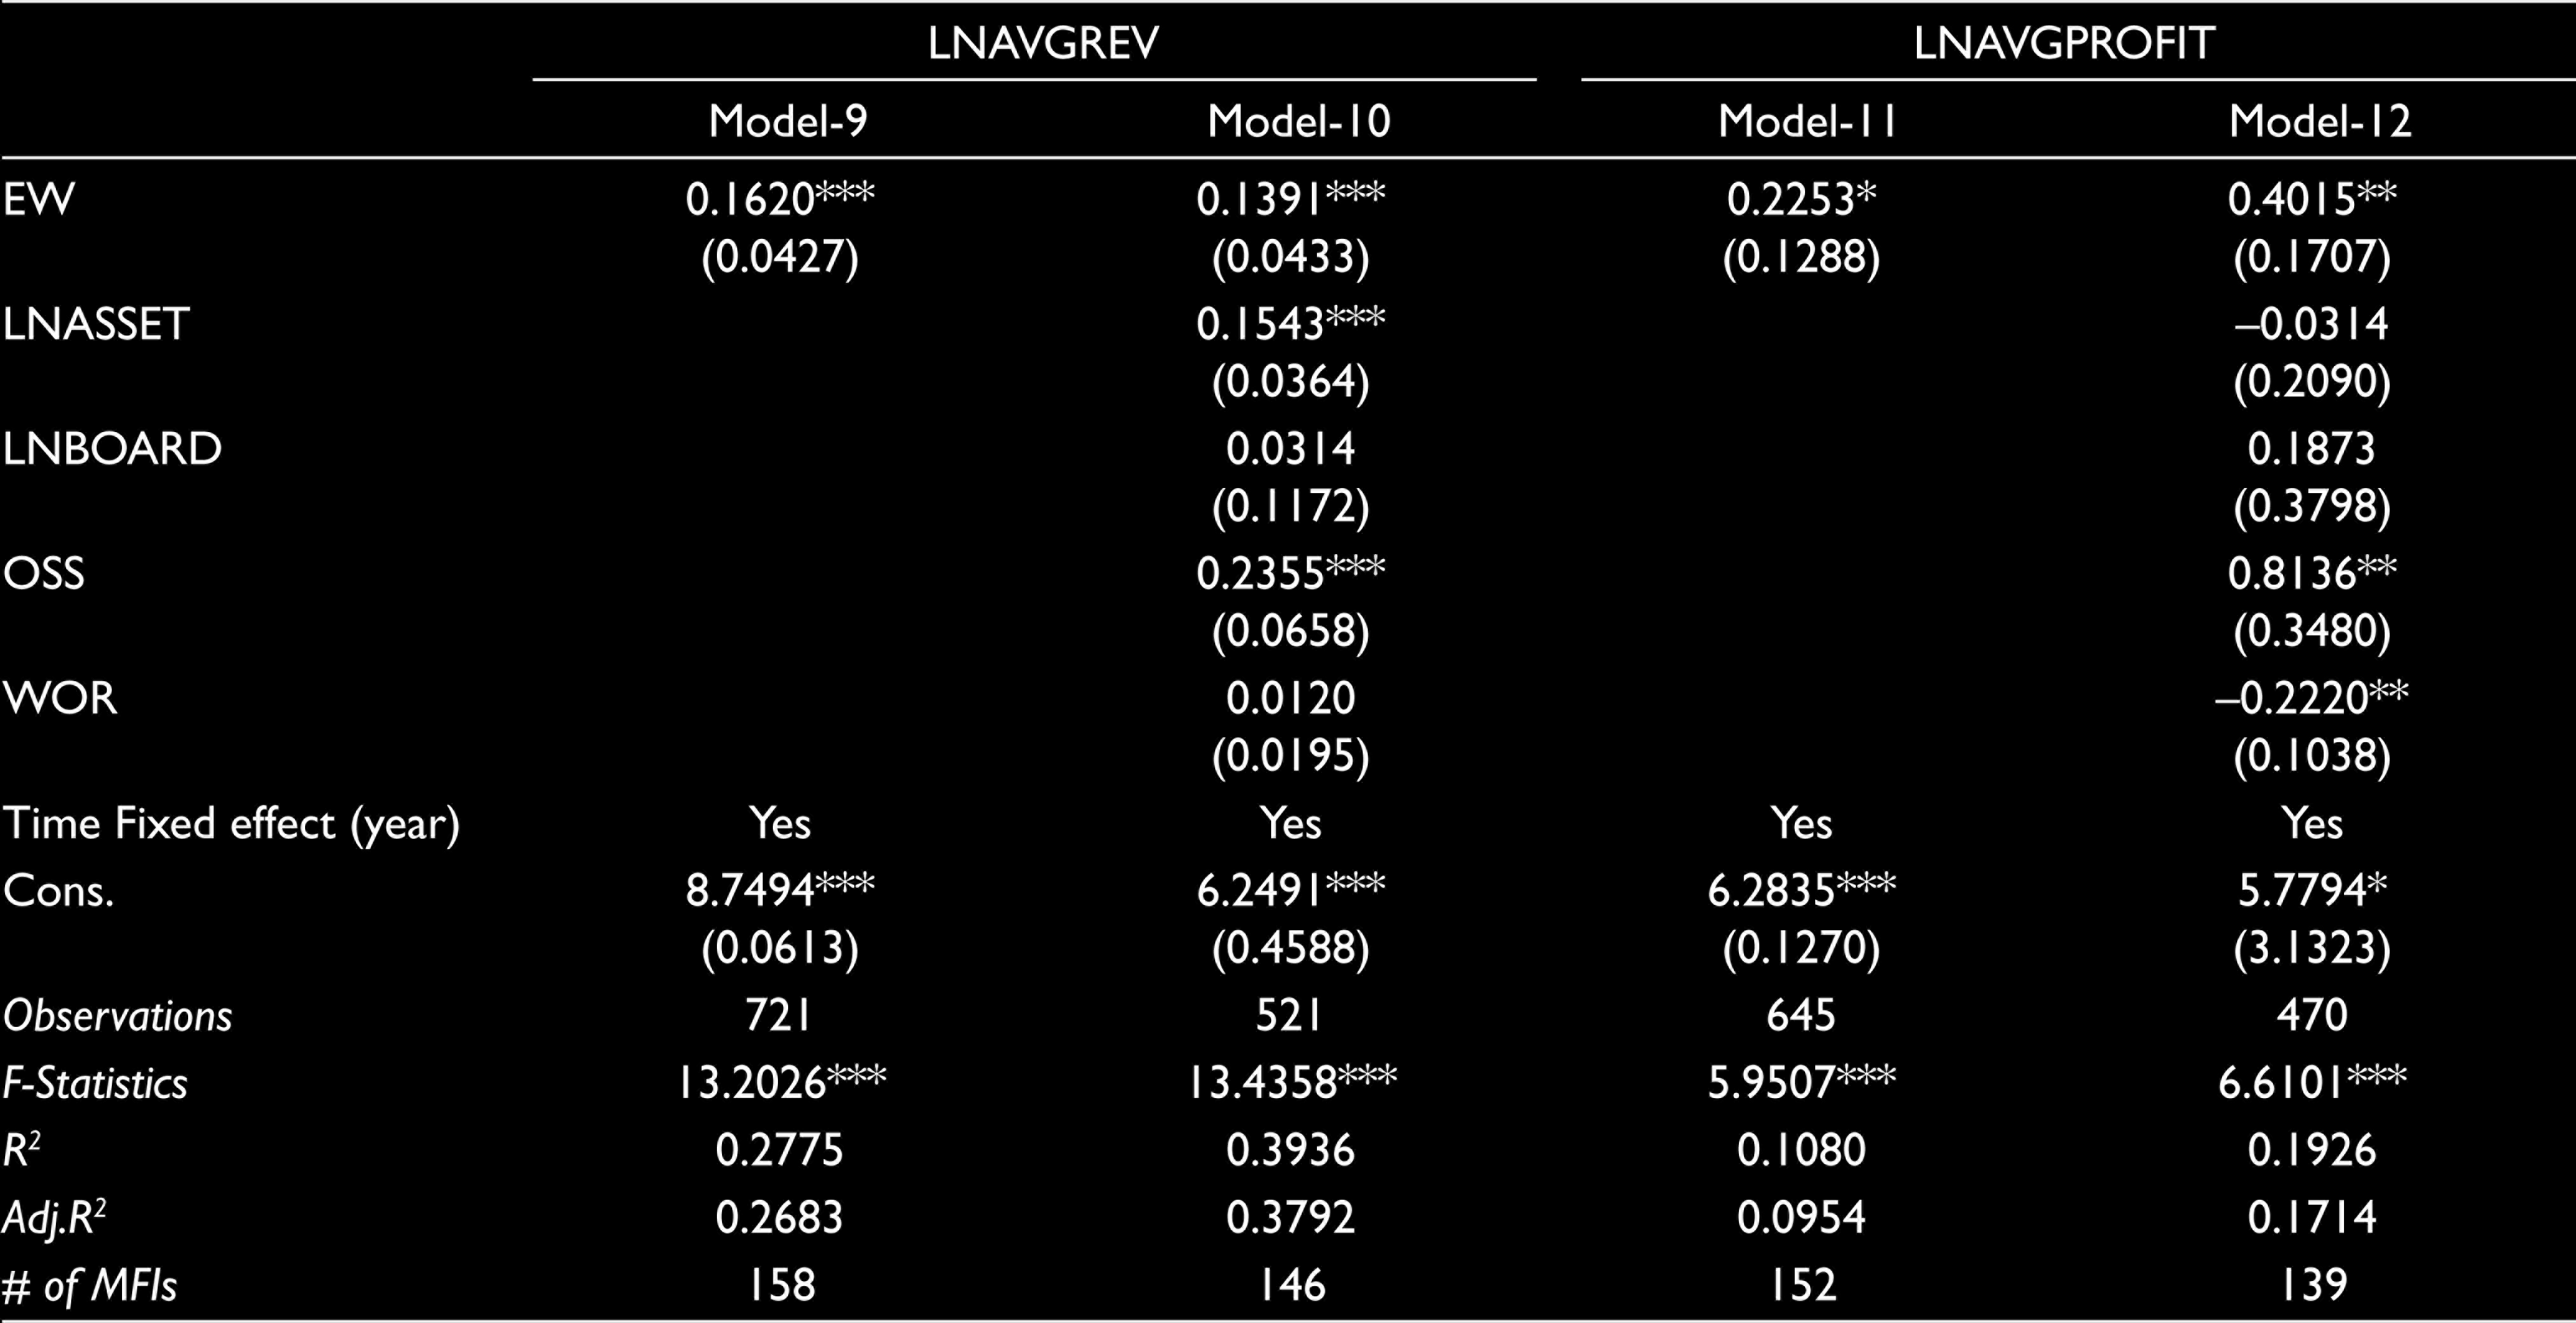
Due to the substantial decline in the amount of donations worldwide, many MFIs are now required to be financially independent to cover all the costs associated with micro-lending activities. Hence, attaining financial sustainability remains a crucial goal for practitioners, policymakers and managers. We have estimated and reported the results of financial sustainability in Table 6 to examine whether payment of wages more than the market level could enhance the financial sustainability of MFIs in terms of financial revenue and profit. Similar to the findings of the breadth of outreach (Table 4), we observed that paying wages above the market level will significantly increase the financial sustainability of the MFIs, as the relationship is positive and statistically significant across all the models reported in Table 6. By paying higher wages, employees of MFIs can be motivated to maintain and generate more revenues and profits. Similarly, well-rewarded employees will also be inspired to work harder and put in their best effort to maintain decent financial sustainability for their organization. Without attaining a better financial return, MFIs will not be able to sustain the payment of higher wages to their employees; hence, they need to earn more either by expanding their businesses or by minimizing the cost of operations, loan delivery and instalment collections.
Overall, our findings lead to similar conclusions as those of Awaworyi Churchill (2020), which suggest the existence of a trade-off between financial sustainability and only the depth of outreach goal of MFIs. In other words, paying efficient wages to employees may enhance the breadth of outreach and financial sustainability of MFIs, but adversely impact the depth of outreach.
Robustness/Additional Tests
Alternative Measure of Efficiency Wages
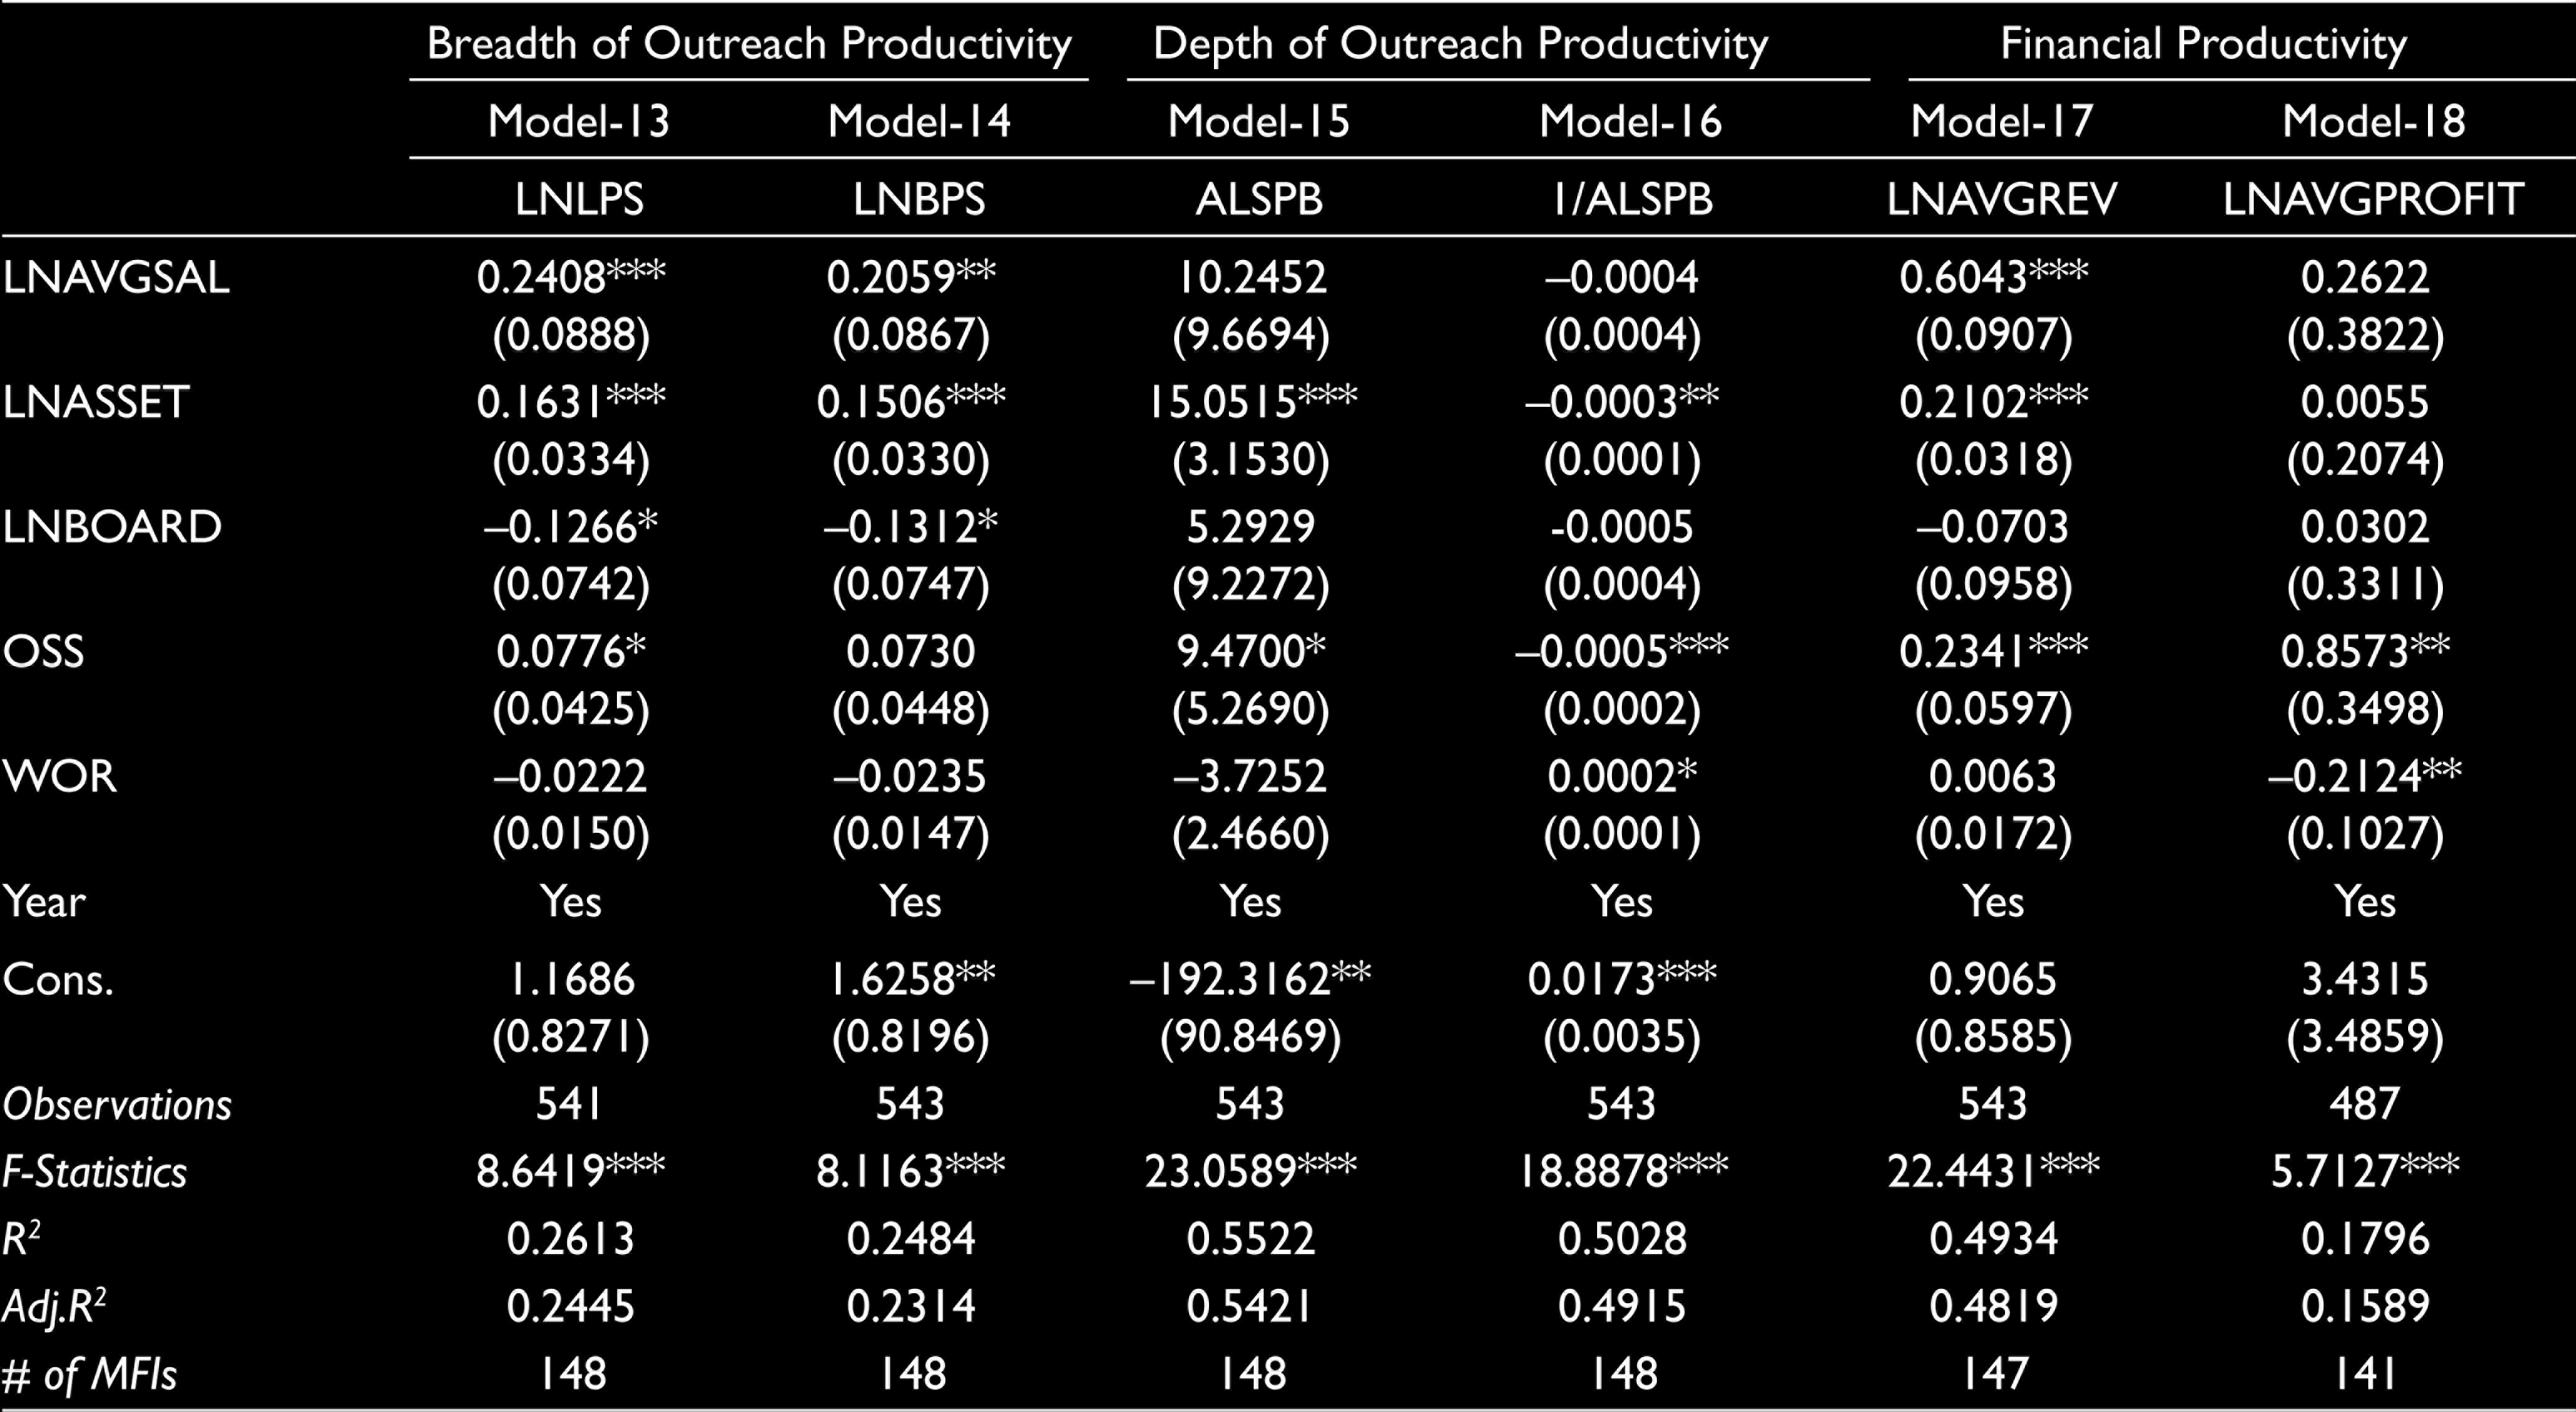
To ensure that our estimates are robust and conclusive, we have used an alternative variable of EW, that is, the natural logarithm of average salary (total personnel expense over the total number of personnel of an MFI-AVGSAL). Again, we found that higher wages lead to higher productivity, both for the breadth of outreach and financial sustainability goals of MFIs (Models 13–14 and Models 17–18). The estimated parameters are statistically significant, except for the depth of outreach (Model 15–16).
Since the coefficient of AVGSAL can be interpreted as an elasticity measure, as both the dependent and the explanatory variables were transformed to natural logarithms, we estimated that a 1% increase in average salary will result in a 0.20%–0.24% increase in the breadth of outreach productivity. On the other hand, a 1% increase in the average salary will result in an approximately 0.60% increase in MFIs’ financial revenue (Model 17), which is the highest increase observed among all the estimated models. Having said that, no statistically significant effect was observed on the overall profitability dimension of financial sustainability of MFIs, despite having a positive coefficient sign (Model 18).
Endogeneity Concerns
To ensure that the findings of our study are unaffected by endogeneity, we have also used a two-step system generalized method of moments (GMM) to estimate Equation (3), consistent with other existing studies in the microfinance literature (Chikalipah, 2018; Lassoued, 2021; Mia et al., 2022).
6
The following equation is considered under GMM:

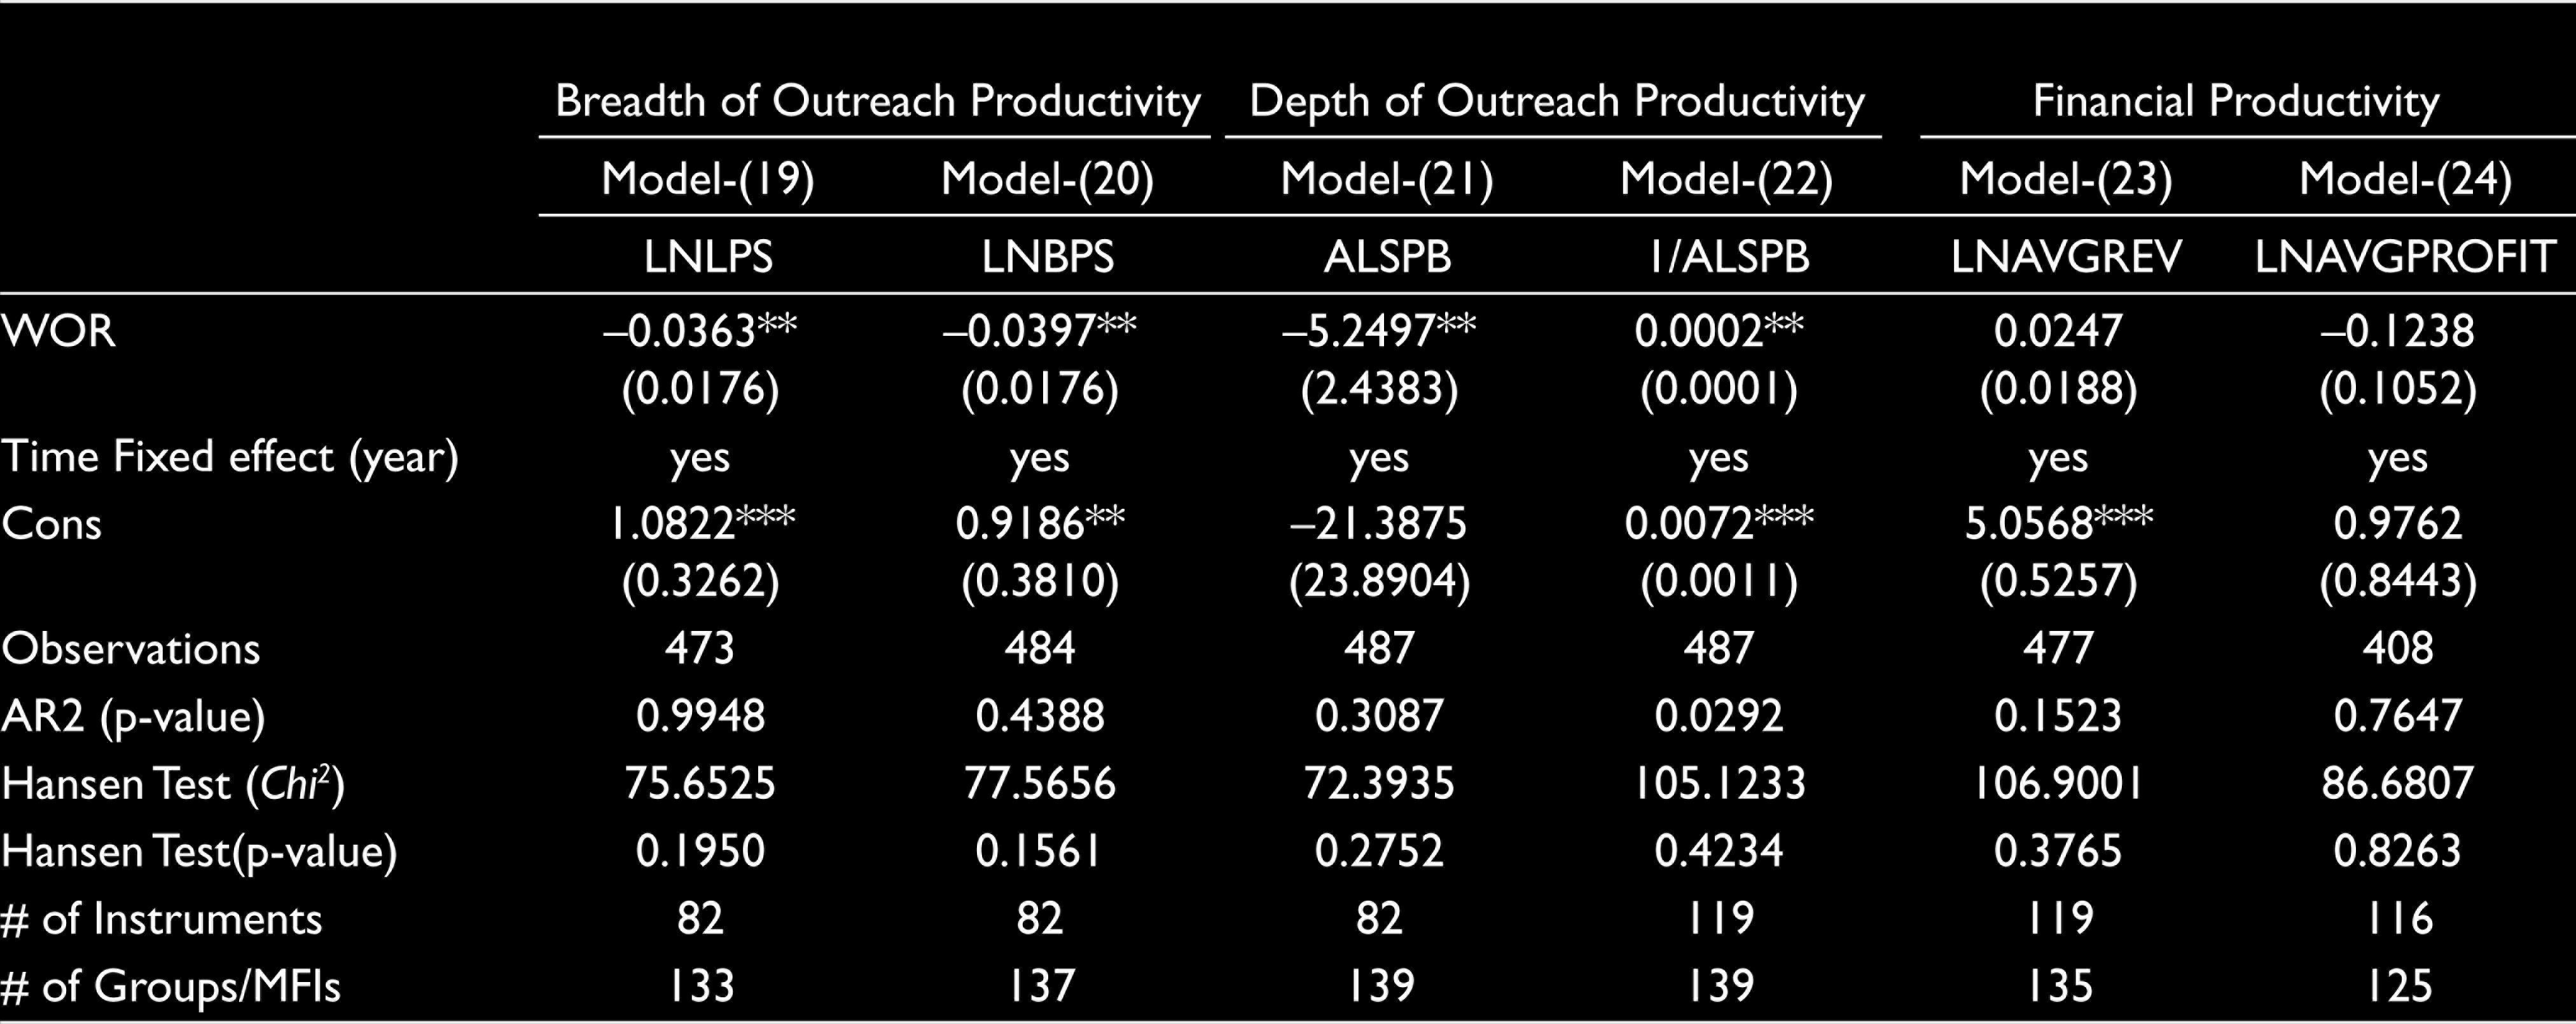
In terms of the diagnostic tests, the Arellano-Bond (AR2) test with a null hypothesis of no second-order autocorrelation was considered in the identification of the second-order serial correlation. For instruments validity, the Sargan test was performed. Moreover, the number of instruments used in the GMM estimation is also lower than the number of individual groups/MFIs in our estimation. Thus, the potential problems of instrument proliferation are not evident in our analysis. Lastly, our sample has N>T, indicating that our selection of the GMM is appropriate. Overall, our GMM results pass all the diagnostic tests specified earlier (stated otherwise), thus validating the consistency and reliability of our results.
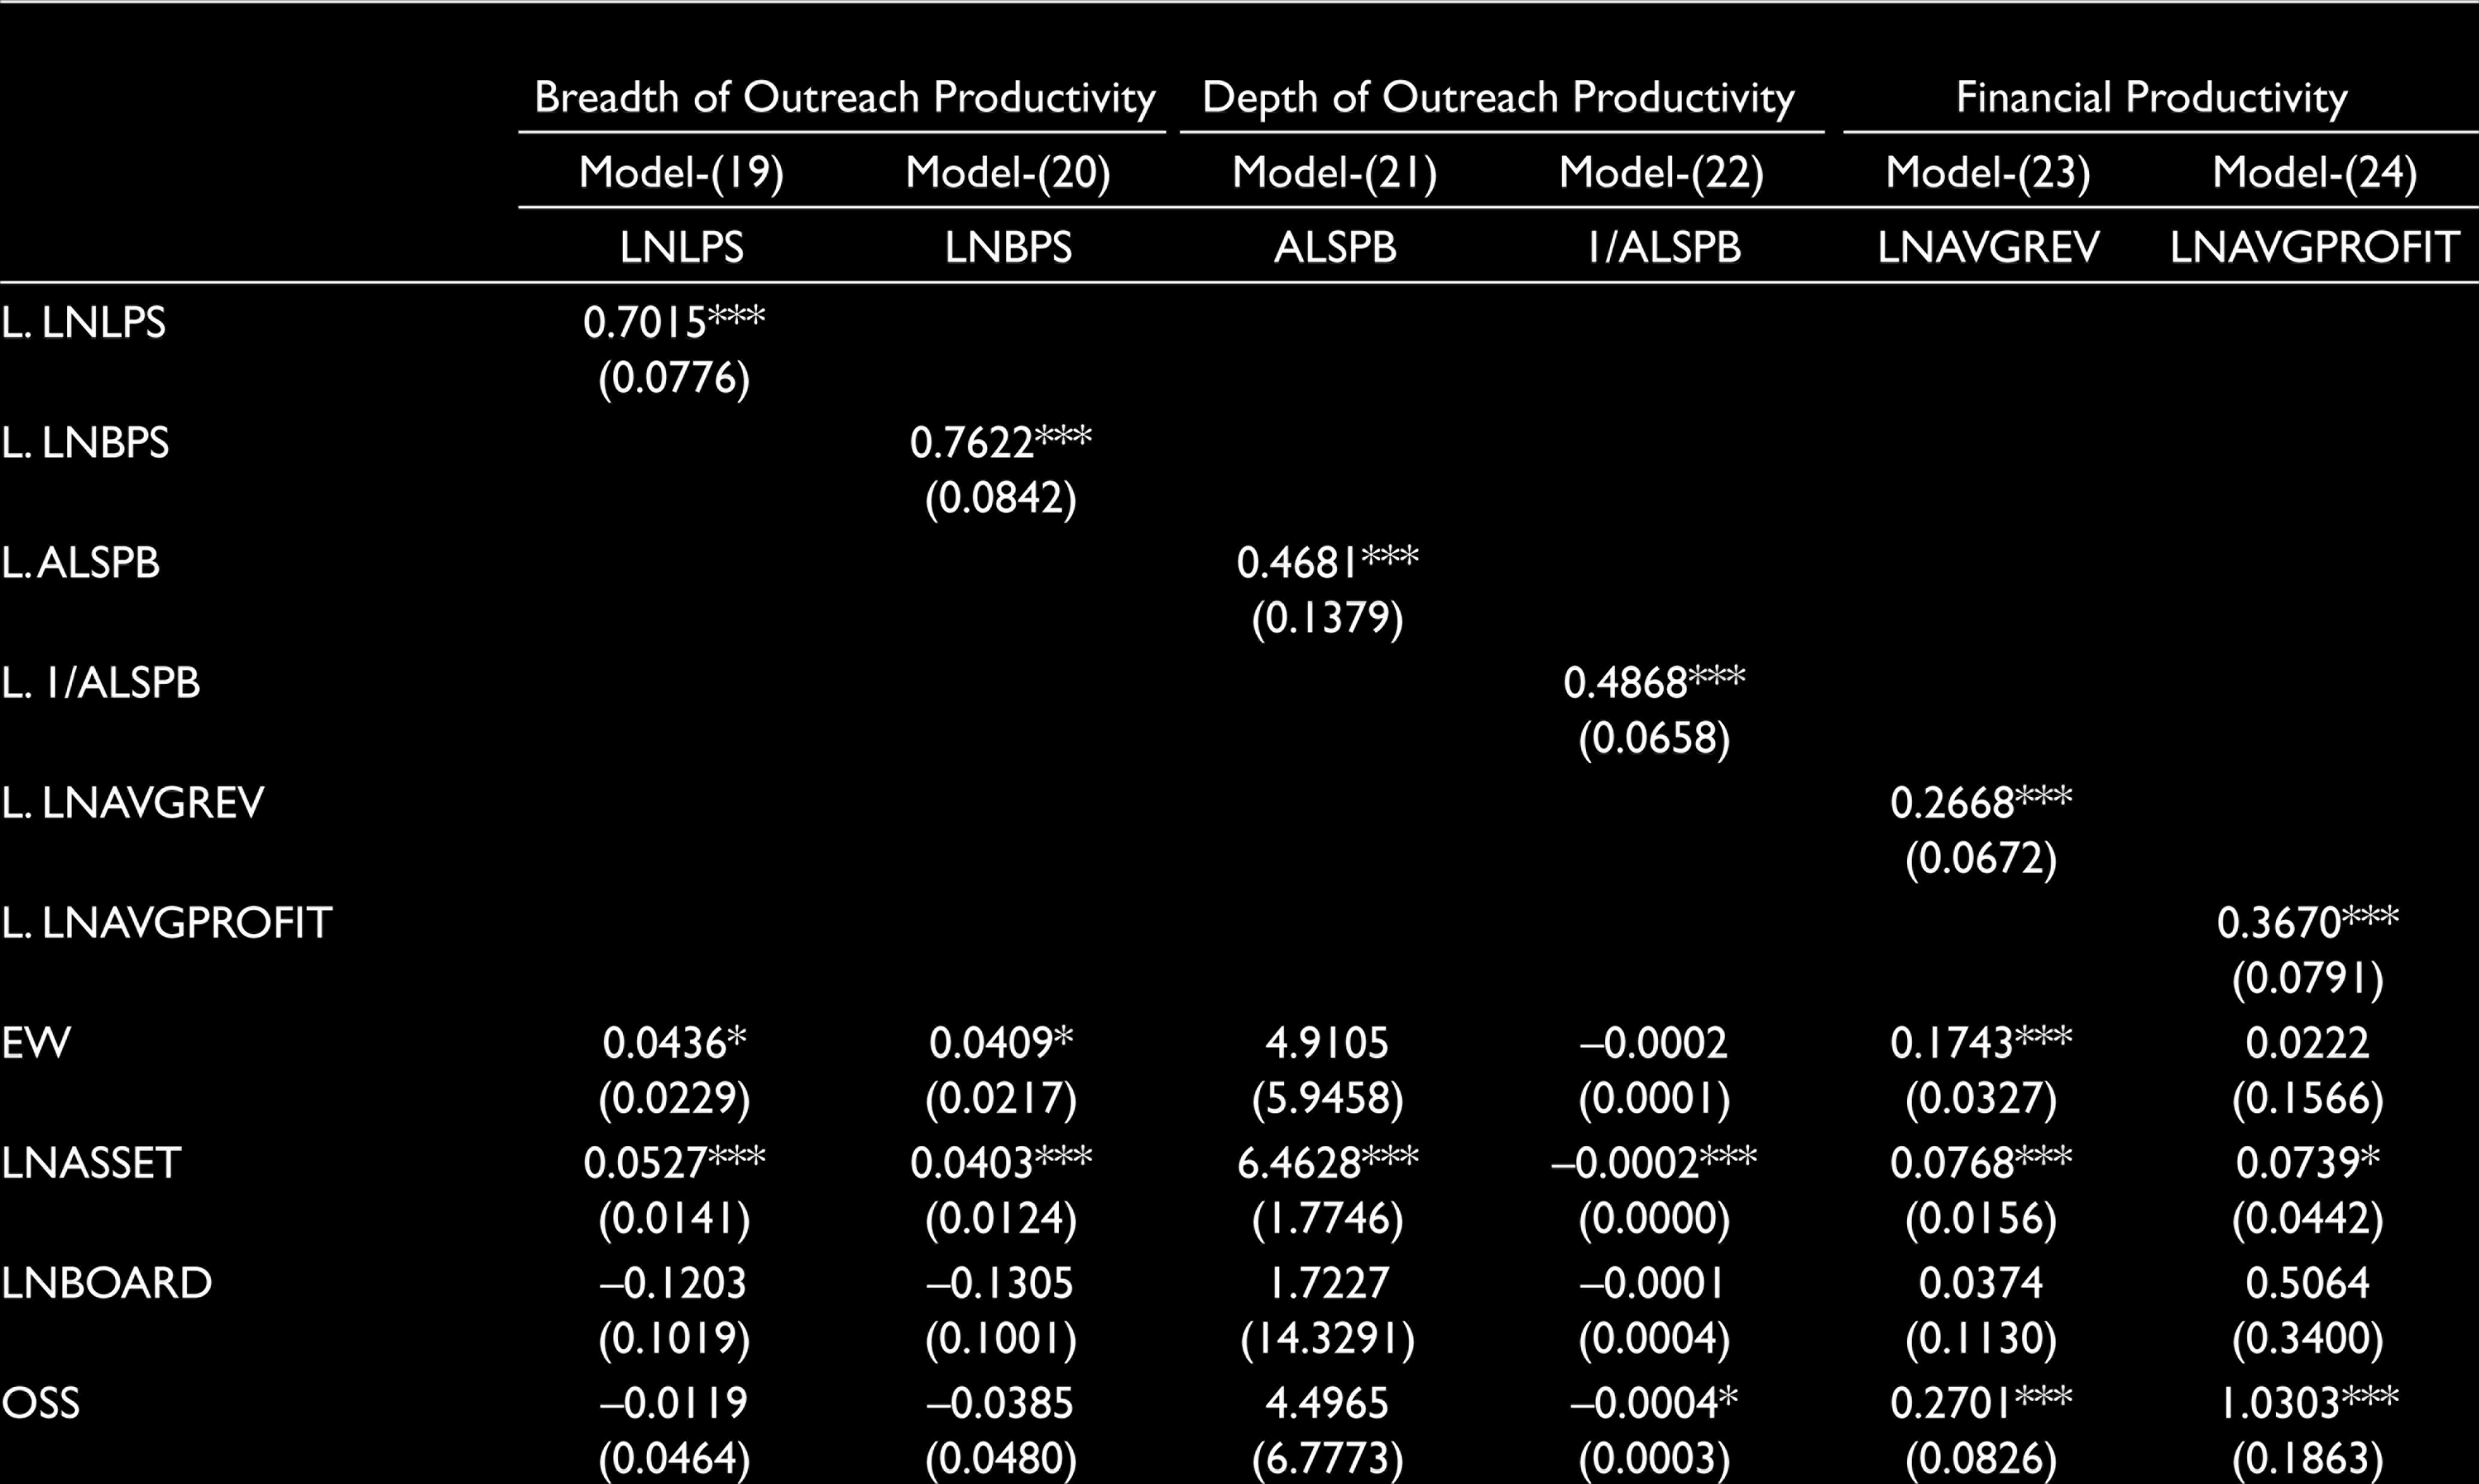
The results of the two-step system GMM are reported in Table 8. Under the dynamic model setting, the effect of EW is statistically significant (except the depth of outreach and profitability dimension of financial performance) and retains the same coefficient signs reported earlier. These results are identical to the findings reported in Table 7 when alternative proxies of EW are considered under static model settings. Thus, the results of the two-step system GMM re-affirmed the robustness of the previous findings and overall implications of the study. Therefore, we can say that EW partially affects the dual objectives of MFIs in India (except for the depth of outreach and profitability dimensions), and the findings are robust to various approaches undertaken in the study.
Robustness Test (Alternative Proxies-Fixed Effects Model).

Robust standard errors in parentheses. * p < 0.10, ** p < 0.05, *** p < 0.01.
Covariates
Looking at covariates, the usage of technology and scale economies may vary between MFIs due to their size effects. Similarly, our results revealed that the size of MFIs can significantly explain the variations in productivity levels and that the outcome is somehow mixed. Concentrating on the total assets (LNASSET) as a measure of MFI size, we found that larger MFIs generally have a relatively better breadth and financial productivity performance (Tables 5–8). The finding corroborates the research works of Nurmakhanova et al. (2015) and Wijesiri et al. (2017), which indicate that large MFIs perform better in both outreach and financial sustainability. These results can be justified by the economies of scale theory. As an instance, larger MFIs incur a lower fixed cost per loan owing to the large pool of loans granted. In addition, they can raise capital at a lower rate from the commercial banks (e.g., due to bargaining capacity) and then charge a lower interest rate to their customers. Furthermore, size helps MFIs to provide a wider range of services to their clients. Reasonably, all these factors are likely to help larger MFIs generate a higher demand for their services (e.g., loans, deposits, etc.) and drive a wider breadth of outreach compared to the smaller MFIs. In contrast, the results also suggest that larger MFIs are also subjected to lower depth of outreach, as indicated in the positive and negative coefficient signs of ALSPB and 1/ALSPB, respectively, which are also statistically significant in most of the models (mainly Tables 5–8).
Robustness Test by Two-step System GMM.
Standard errors in parentheses. * p < 0.10, ** p < 0.05, *** p < 0.01.
On top of that, we also documented that larger MFIs enjoy better financial productivity in the Indian context, as the coefficient sign is positive and statistically significant across models (except a few). Thus, we can claim that large-scale MFIs in the Indian context are very prone to mission drift owing to their exclusion of the poorest clients for better financial gains. Although the research context is slightly different, our results also echo the observations of Pati (2021) that a mission drift exists in the Indian microfinance industry.
The relation between board size (LNBOARD) and outreach performance of MFIs is weak. Estimates evidenced that a 1% increase in the number of board members results in around a 0.14% decrease in the breadth of outreach productivity, assuming all other variables remain constant (Table 7, Model 13 and 14). This finding suggests that a higher board size will result in a lower productivity performance of MFIs, particularly when the breadth of outreach is considered, which is mostly consistent with other existing literature (e.g., Thrikawala et al., 2016). For other dimensions of MFI’s performance, board size was mostly not significant and has mixed coefficient signs.
Our study also suggests that OSS status of MFIs is important to explain the overall financial productivity of MFIs, as its coefficient sign is positive and statistically significant even after using alternative proxies of the dependent variable (Tables 6 and 7). To some extent, our findings also indicate that MFIs with higher OSS may compromise in serving the poorest of the poor as they usually have higher average loan size (mostly not significant; Tables 5, 7 and 8). Reasonably, we also observed that the WOR exhibits a significant negative effect on the financial sustainability dimensions (i.e., profitability), as its sign is negative and significant in Tables 6 (Model 12) and 7 (Model 18). The finding is as expected. However, an interesting result from Table 8 is the statistically significant negative and positive effects of WOR on the breadth (Models 19 and 20) and depth of outreach (Models 21–22), respectively. This finding reiterates that under a high loan write-off environment, MFIs may allegedly reduce their client base and give smaller loans to prevent further worsening of the situation.
Overall, we can conclude that the productivity of MFIs is affected not only by the EW but also by other organizational variables, such as size, OSS, board size and loan WOR.
Conclusions
Although the nexus between EW, as well as the outreach and financial productivity of MFIs, is evident in our study, it remains an under-investigated issue in the microfinance industry. Thus, our study has analyzed this relationship in the context of the Indian microfinance industry using data of 179 MFIs collected over the period 2010–2018 from the MIX Market/World Bank database. Our choice has been motivated by the dearth of empirical evidence on the aforementioned relationship, especially from the perspectives of single-country studies, which are unaffected by the problems of institutional changes that characterize cross- country analyses.
Higher wages in better-performing MFIs can be linked to the reduction in the principal-agent problem, which largely exists in the microfinance industry. On the one hand, MFIs have the social orientation of serving the economically weaker and financially excluded people. On the other hand, the loan officers, who are the facilitators of the MFI policies, may have their personal interests and career concerns, and thus overlook the social objectives by catering for the wealthier customers whose loans can be easily disbursed with minimal effort.
This study provides further empirical evidence suggesting that the theoretical principal-agent conflict and the associated mission drift problem can be partially mitigated if MFIs pay more wages than the overall market rate. Our findings revealed that offering higher wages in the investigated context can significantly increase MFIs’ productivity, in terms of both the breadth of outreach and the financial sustainability of MFIs. Our results also suggest that the breadth is more sensitive than the depth component of outreach, which is consistent with other empirical studies (Acclassato Houensou & Senou, 2019). Therefore, our findings relating to EW provide important managerial implications that MFIs should consider while designing financial incentive packages for their workforce. MFIs experiencing a lower breadth of outreach and financial standards can consider raising their employees’ wages to enhance their performance. Our empirical findings also contribute to the existent literature on EW, considering that its effect is dependent on MFIs’ dimensions and context. Hence, the applicability of the EW theory may not hold or be contingent upon the different possible objectives and dimension of an MFI.
Additionally, our analysis revealed that larger MFIs perform better in terms of outreach (depth) and financial performance due to their scale of operation. The findings also indicated that MFIs should govern themselves with a smaller board size for fast and effective decision-making, and better control of their operations.
Furthermore, it is worth considering that in traditional microfinance ambits, loan officers’ tasks are often overlapping, which could present an obstacle to the measurement of individual performance. Aside from that, loan officers frequently perform their work in rural areas, where monitoring is difficult due to the lack of efficient transport and communication networks. Furthermore, the issue of free-riding may also arise when mutual cooperation between loan officers in conducting certain jobs is required. Consequently, as a policy indication, and in line with the considerations of Labie et al. (2015) and Kraft and Ugarkovic (2006), we suggest the initiation of mechanisms including the assessment of borrowers’ feedback to identify and compensate the best-performing and most productive workers, rather than indistinctly paying all of them with above-market wages. Besides, the introduction of non-financial incentives could be considered, not necessarily as an alternative solution but to further enhance the productivity of MFI workers (Delfgaauw et al., 2020).
The study is not devoid of limitations. First, the productivity measures considered in the paper rely on conventional ratios. This can be improved by considering a more comprehensive measure of productivity (combining both dimensions of MFIs’ objectives variables) through non-parametric approaches (e.g., data envelopment analysis). Second, as we have not integrated gender variables in our study, future studies could also include gender diversification at the board and organizational levels to re-estimate the relationship between EW and the productivity of MFIs. Third, although we have considered a single country, the research framework used in this study can also be applied to transitional microfinance industries with appropriate tools and techniques to validate our findings. Fourth, the results for the depth of outreach can be considered relatively weak, while further investigation is warranted for the various measures of financial sustainability, including a more in-depth examination of the corporate governance structure characterizing different types of MFIs. Lastly, if available, a disaggregated data of financial incentives provided to various levels of MFIs’ organizational ladders could provide a more in-depth and comprehensive understanding of the relationship investigated in this study.
Footnotes
Acknowledgements
The authors greatly acknowledge the constructive comments and suggestions from the four anonymous reviewers on the earlier version of the paper. A great deal of appreciation also goes to the managing editor (Dr Satish Krishnan) for his valuable suggestions.
Declaration of Conflicting Interests
The authors declared no potential conflicts of interest with respect to the research, authorship and/or publication of this article.
Funding
The authors disclosed receipt of the following financial support for the research, authorship, and/or publication of this article: The first author acknowledges the short-term research grant from Universiti Sains Malaysia, Penang, Malaysia [Grant No: 304/PMGT/6315547].
Data Availability Statement
The raw data of this study can be freely downloaded from:
Appendix
The Effect of Efficiency Wage on the Outreach and Financial Sustainability of MFIs (Random Effects Model).
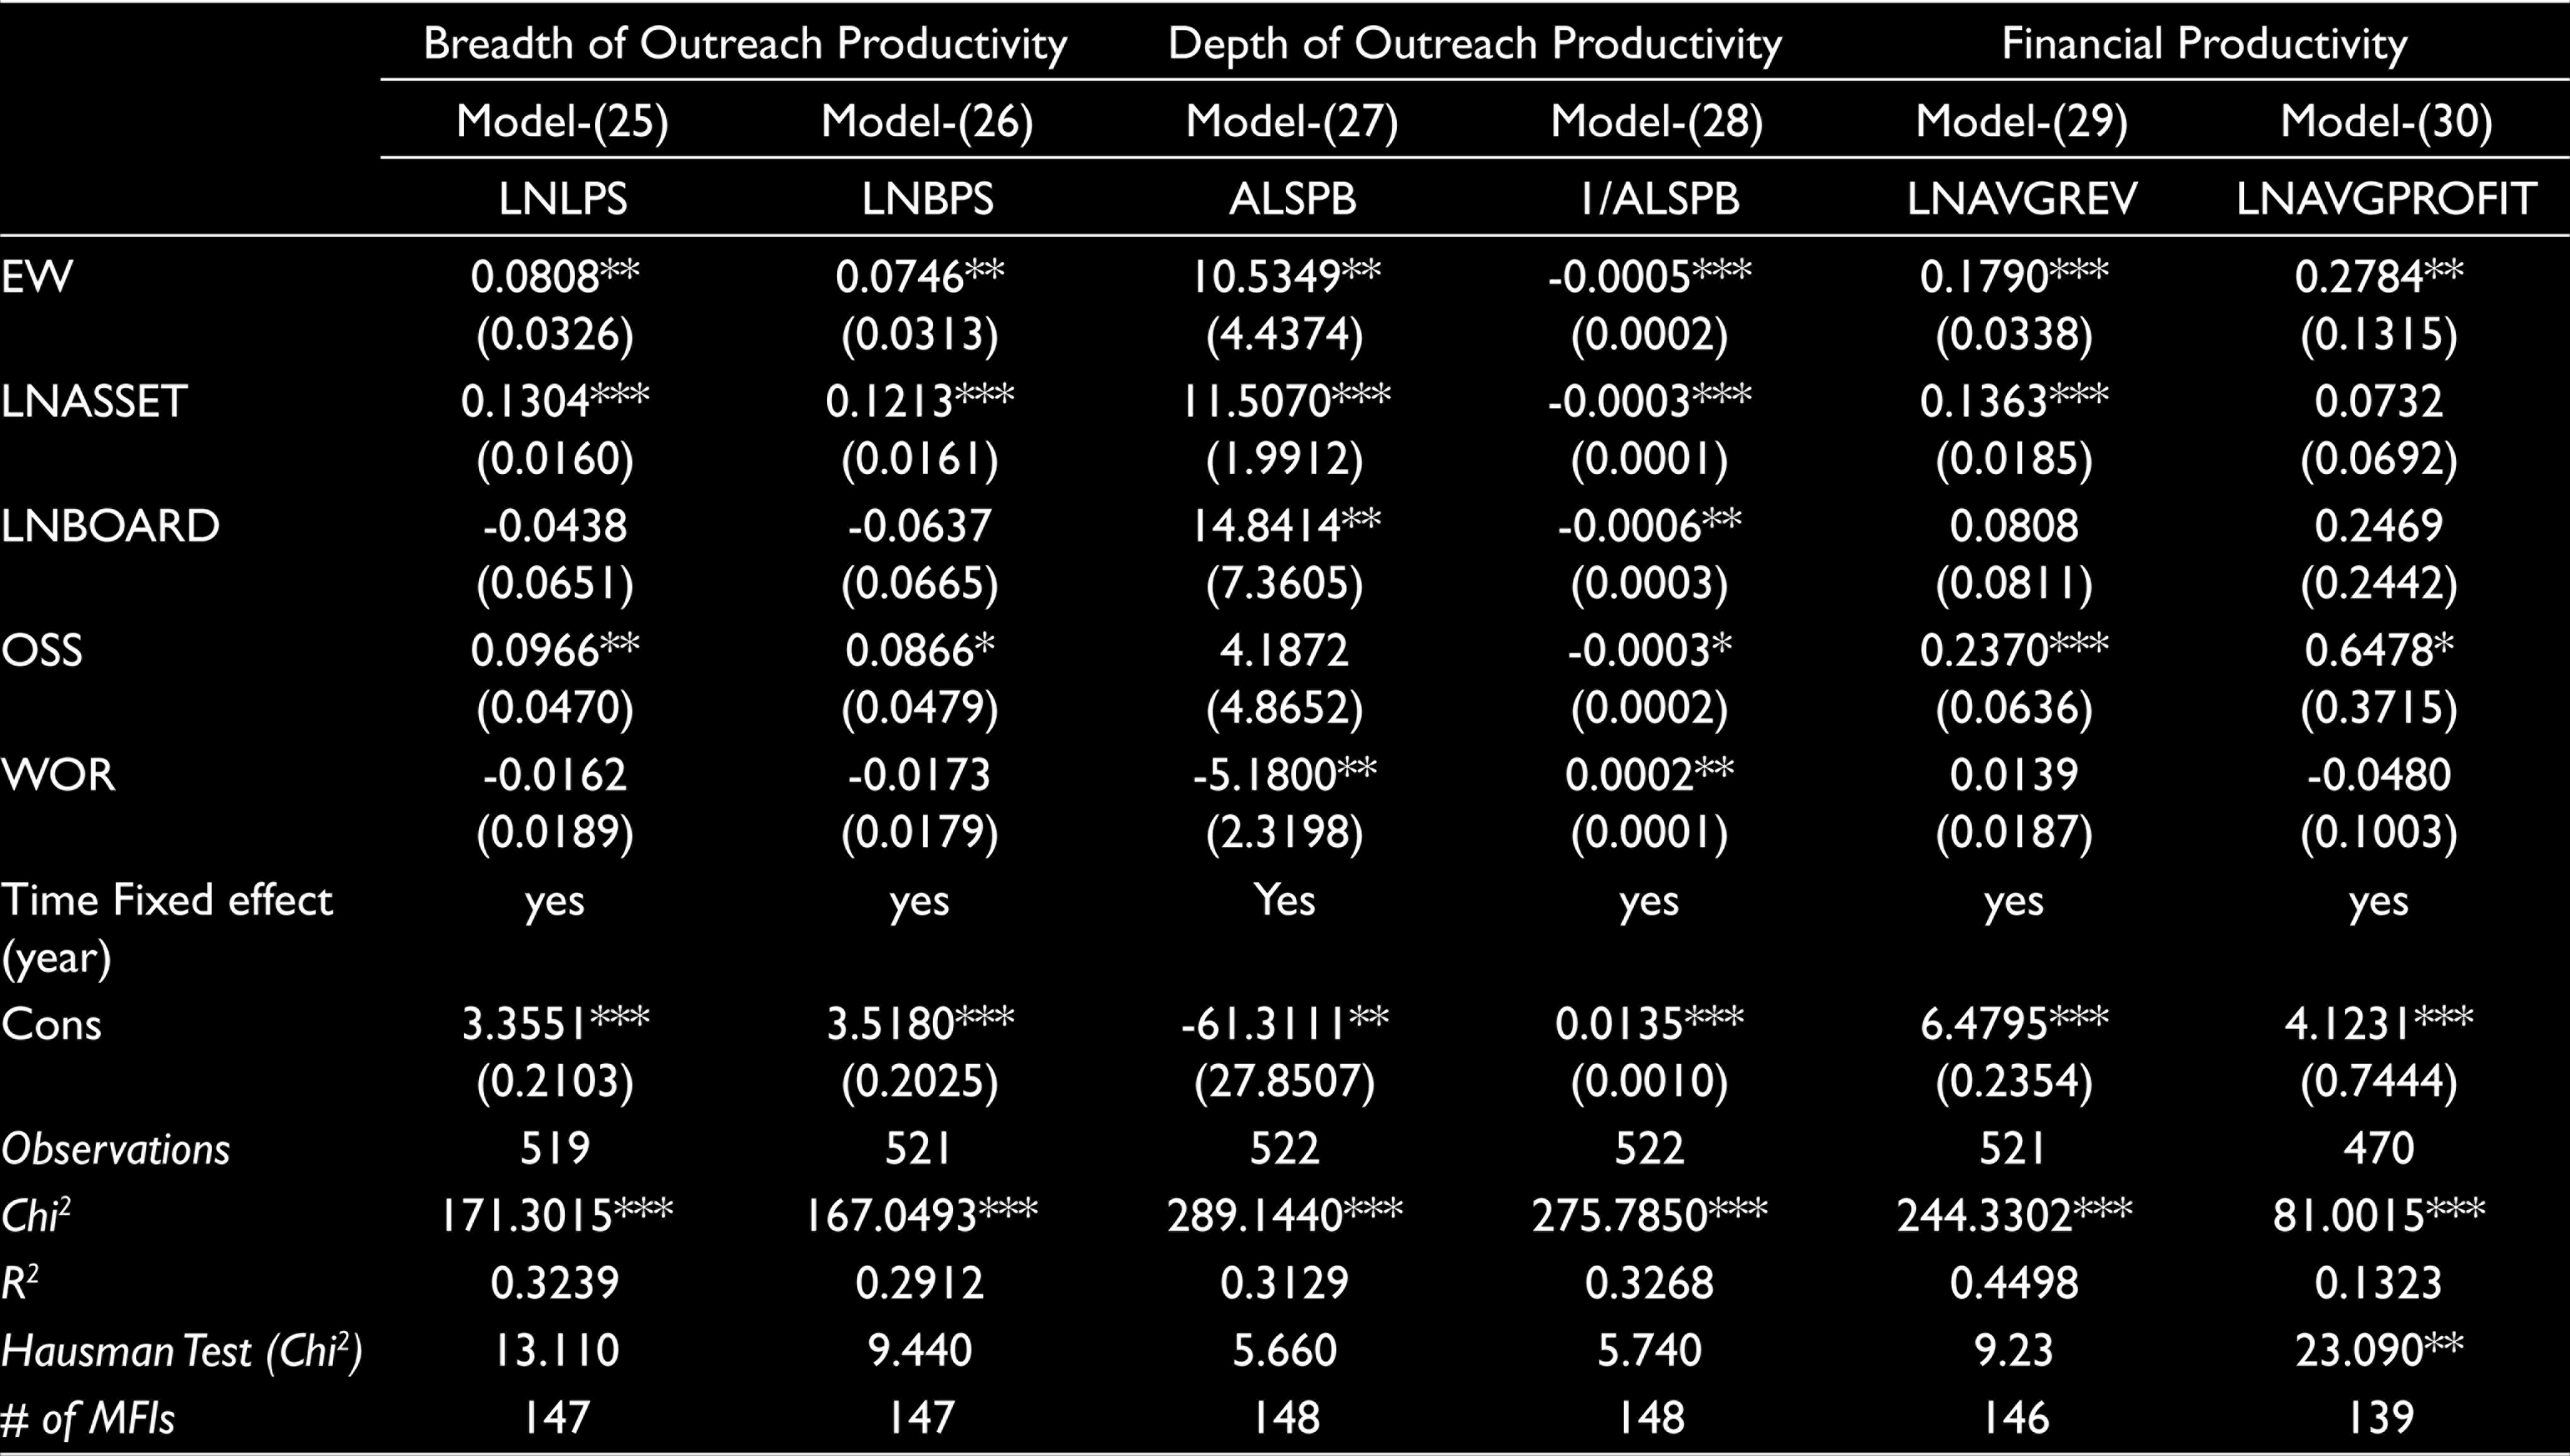
| Breadth of Outreach Productivity |
Depth of Outreach Productivity |
Financial Productivity |
||||
| Model-(25) | Model-(26) | Model-(27) | Model-(28) | Model-(29) | Model-(30) | |
| LNLPS | LNBPS | ALSPB | 1/ALSPB | LNAVGREV | LNAVGPROFIT | |
| EW | 0.0808** (0.0326) | 0.0746** (0.0313) | 10.5349** (4.4374) | -0.0005*** (0.0002) | 0.1790*** (0.0338) | 0.2784** (0.1315) |
| LNASSET | 0.1304*** (0.0160) | 0.1213*** (0.0161) | 11.5070*** (1.9912) | -0.0003*** (0.0001) | 0.1363*** (0.0185) | 0.0732 (0.0692) |
| LNBOARD | -0.0438 (0.0651) | -0.0637 (0.0665) | 14.8414** (7.3605) | -0.0006** (0.0003) | 0.0808 (0.0811) | 0.2469 (0.2442) |
| OSS | 0.0966** (0.0470) | 0.0866* (0.0479) | 4.1872 (4.8652) | -0.0003* (0.0002) | 0.2370*** (0.0636) | 0.6478* (0.3715) |
| WOR | -0.0162 (0.0189) | -0.0173 (0.0179) | -5.1800** (2.3198) | 0.0002** (0.0001) | 0.0139 (0.0187) | -0.0480 (0.1003) |
| Time Fixed effect (year) | yes | yes | Yes | yes | yes | yes |
| Cons | 3.3551*** (0.2103) | 3.5180*** (0.2025) | -61.3111** (27.8507) | 0.0135*** (0.0010) | 6.4795*** (0.2354) | 4.1231*** (0.7444) |
| Observations | 519 | 521 | 522 | 522 | 521 | 470 |
| Chi2 | 171.3015*** | 167.0493*** | 289.1440*** | 275.7850*** | 244.3302*** | 81.0015*** |
| R2 | 0.3239 | 0.2912 | 0.3129 | 0.3268 | 0.4498 | 0.1323 |
| Hausman Test (Chi2) | 13.110 | 9.440 | 5.660 | 5.740 | 9.23 | 23.090** |
| # of MFIs | 147 | 147 | 148 | 148 | 146 | 139 |
Robust standard errors in parentheses. * p < 0.10, ** p < 0.05, *** p < 0.01.