



Abstract
The agricultural sector provides the majority of employment in Pakistan, especially among the poorest segments of the population. Energy provision affects production and livelihoods, especially with the advance of mechanization in agriculture.
Changes in gas and electricity prices affect the income of farmers significantly, thereby reducing the agricultural growth rate over time. Agriculture also has a positive impact on industrial sector exports. The dependence of agriculture on electricity consumption in Pakistan has increased over time, while power generation has not kept up with demand. This article decomposes energy consumption in Pakistan and analyzes the behaviour of change in agricultural production, energy intensity and structural changes over the time.
Introduction
The agricultural sector, which includes crop and livestock, provides employment to over 60 per cent of the population in Pakistan, among which are the poorest of the poor. Their livelihoods are affected by the provision of key agricultural inputs, and this holds true particularly for energy (Mushtaq et al. 2008). Demands for power and natural gas have been on the rise, as the mechanization of Pakistan’s agriculture has continued. Power is used to run agricultural machinery and tube-wells, while gas is used to produce fertilizers and pesticides (PCRAL 2011).
For the last two years, the production of natural gas has been flat, while its demand has been on the rise. Although the Natural Gas Allocation and Management Policy (GoP 2005) assures a smooth supply of natural gas to the fertilizer sector, the latter has been facing a 20 per cent shortage. This gas deficit resulted in capacity underutilization, causing the rise of the urea price by 48 per cent just in one year. Mushtaq et al. (2008) have found a bidirectional causal relation between gas consumption and the gross domestic product (GDP) of agriculture, meaning that reduced gas supply can hamper the growth of the agriculture sector significantly. Furthermore, Khan and Ahmed (2008) have found that demand for electricity is dependent on farmers’ income and price changes. Hence, the change in gas and electricity prices affects the income of farmers significantly.
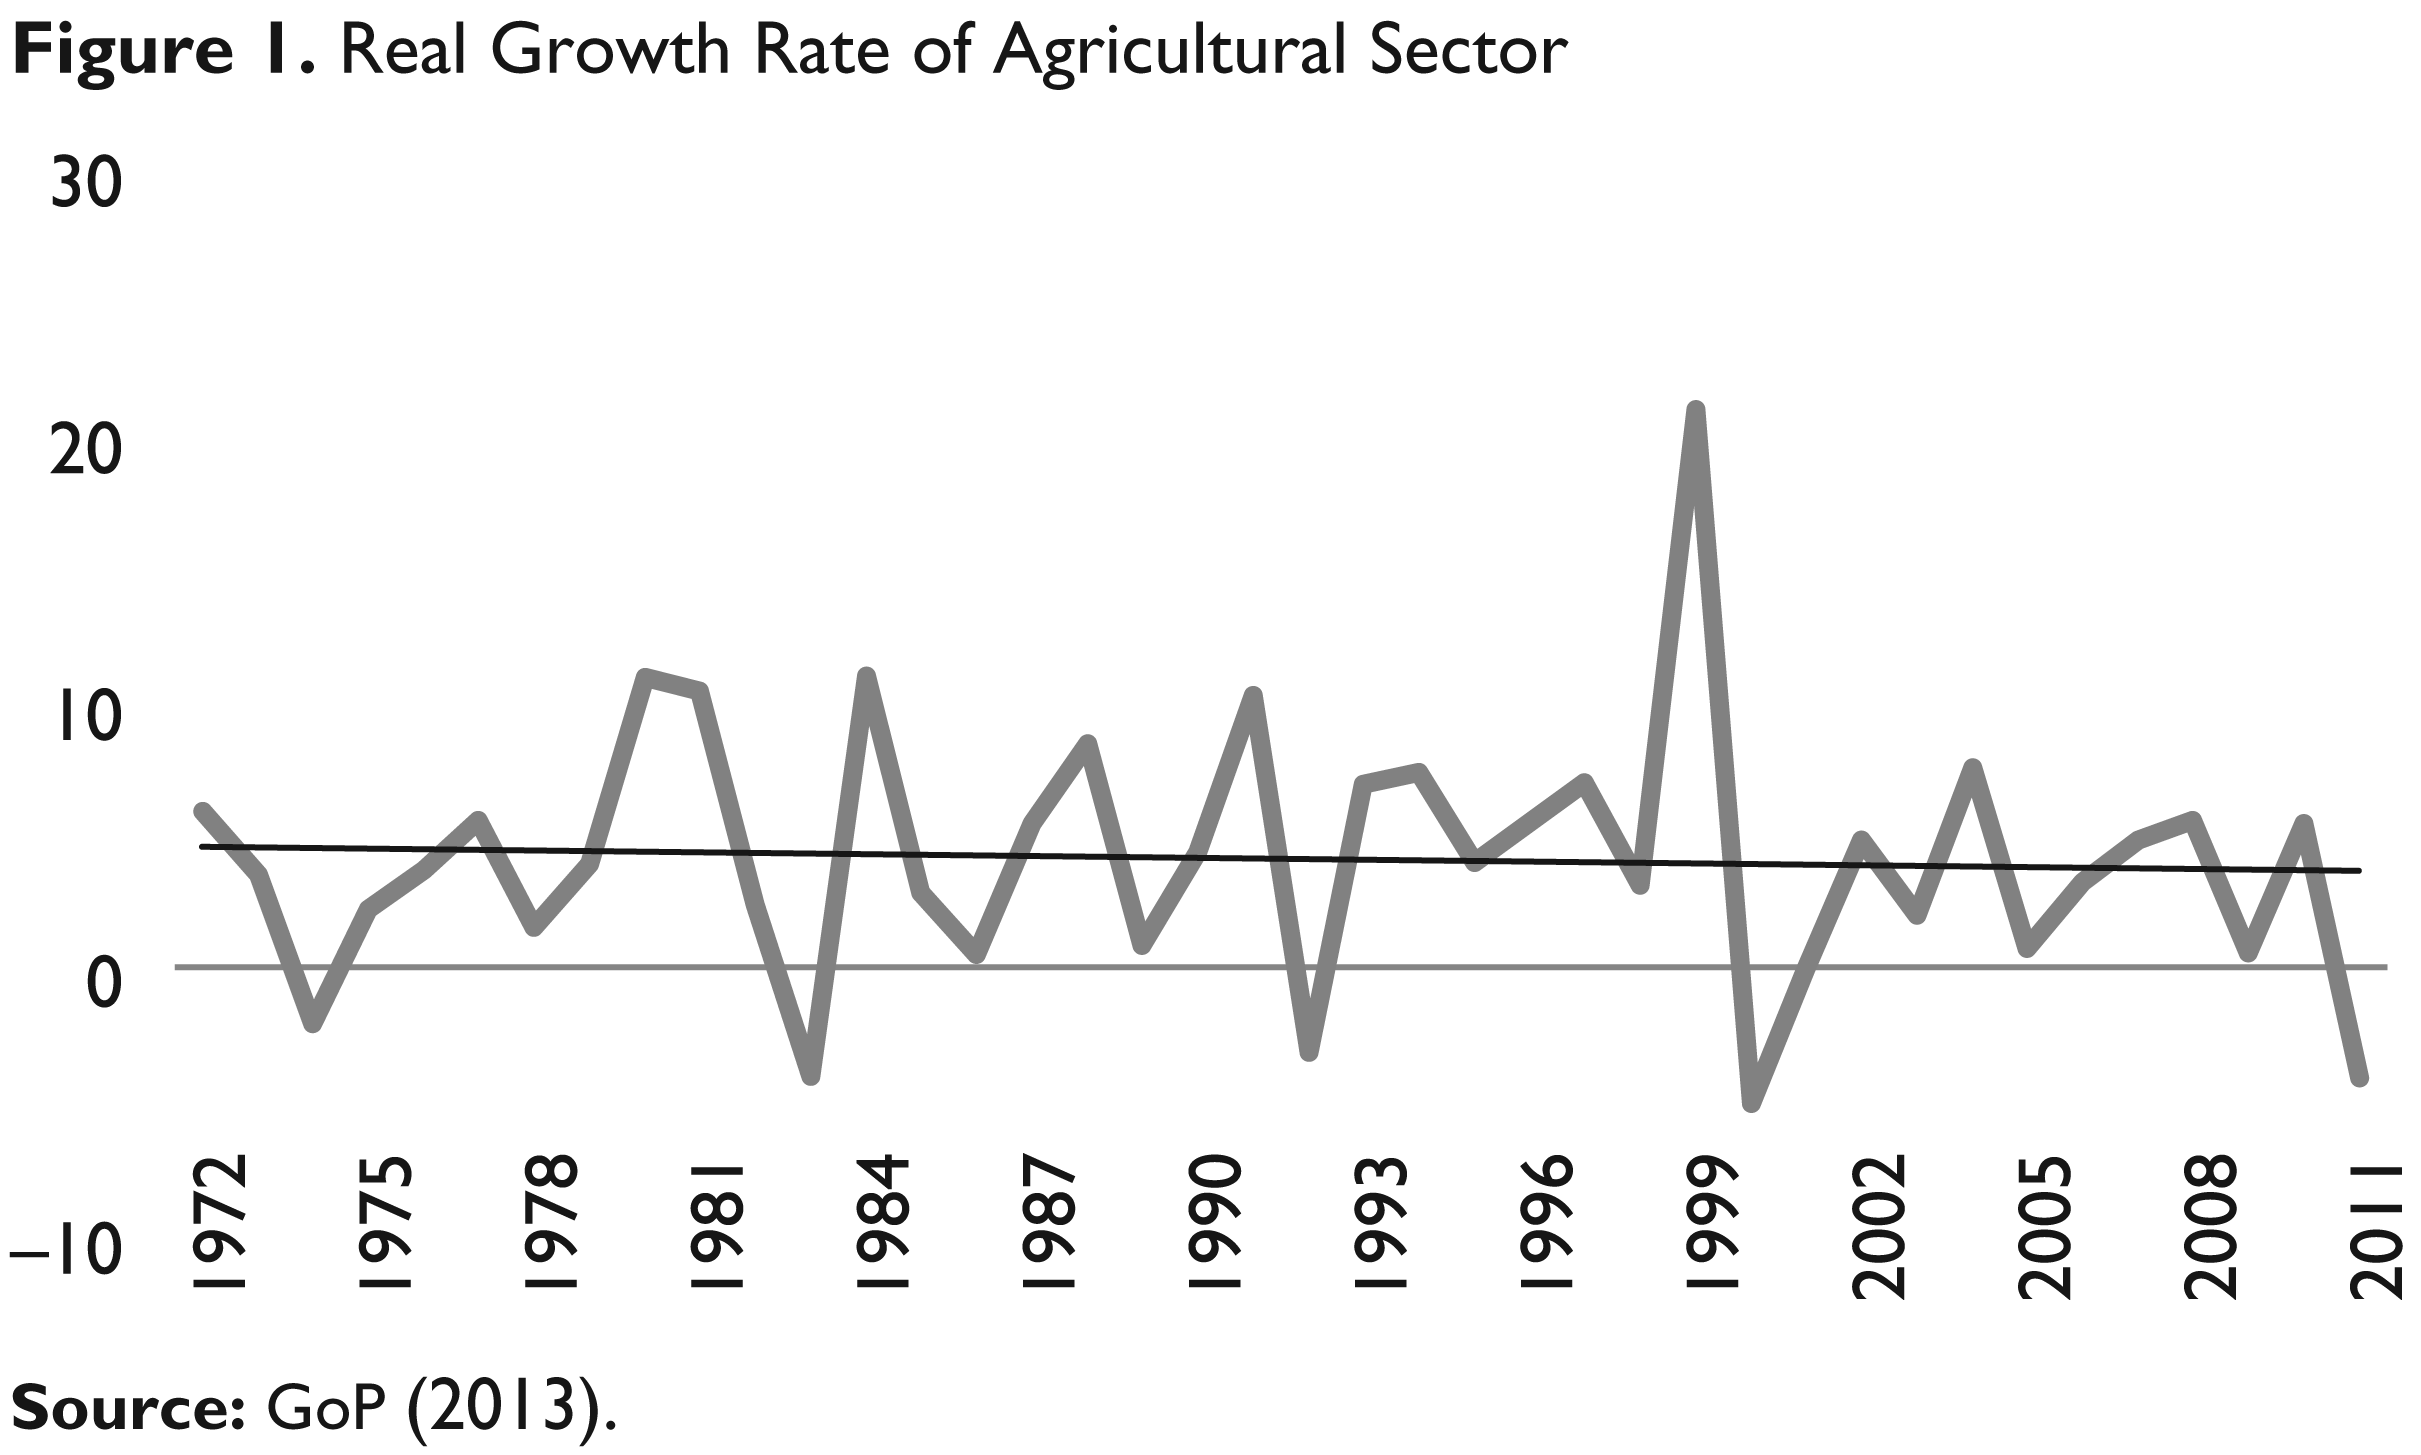
The economic data (see Figures 1–4) reveal that real economic growth in agriculture has been subject to many setbacks. The above issues have reduced the agricultural sector growth rate over time. The limited opportunities in the agricultural sector have lured many people towards other sectors; this fact is evident in a declining share of the agricultural sector in the total value added.
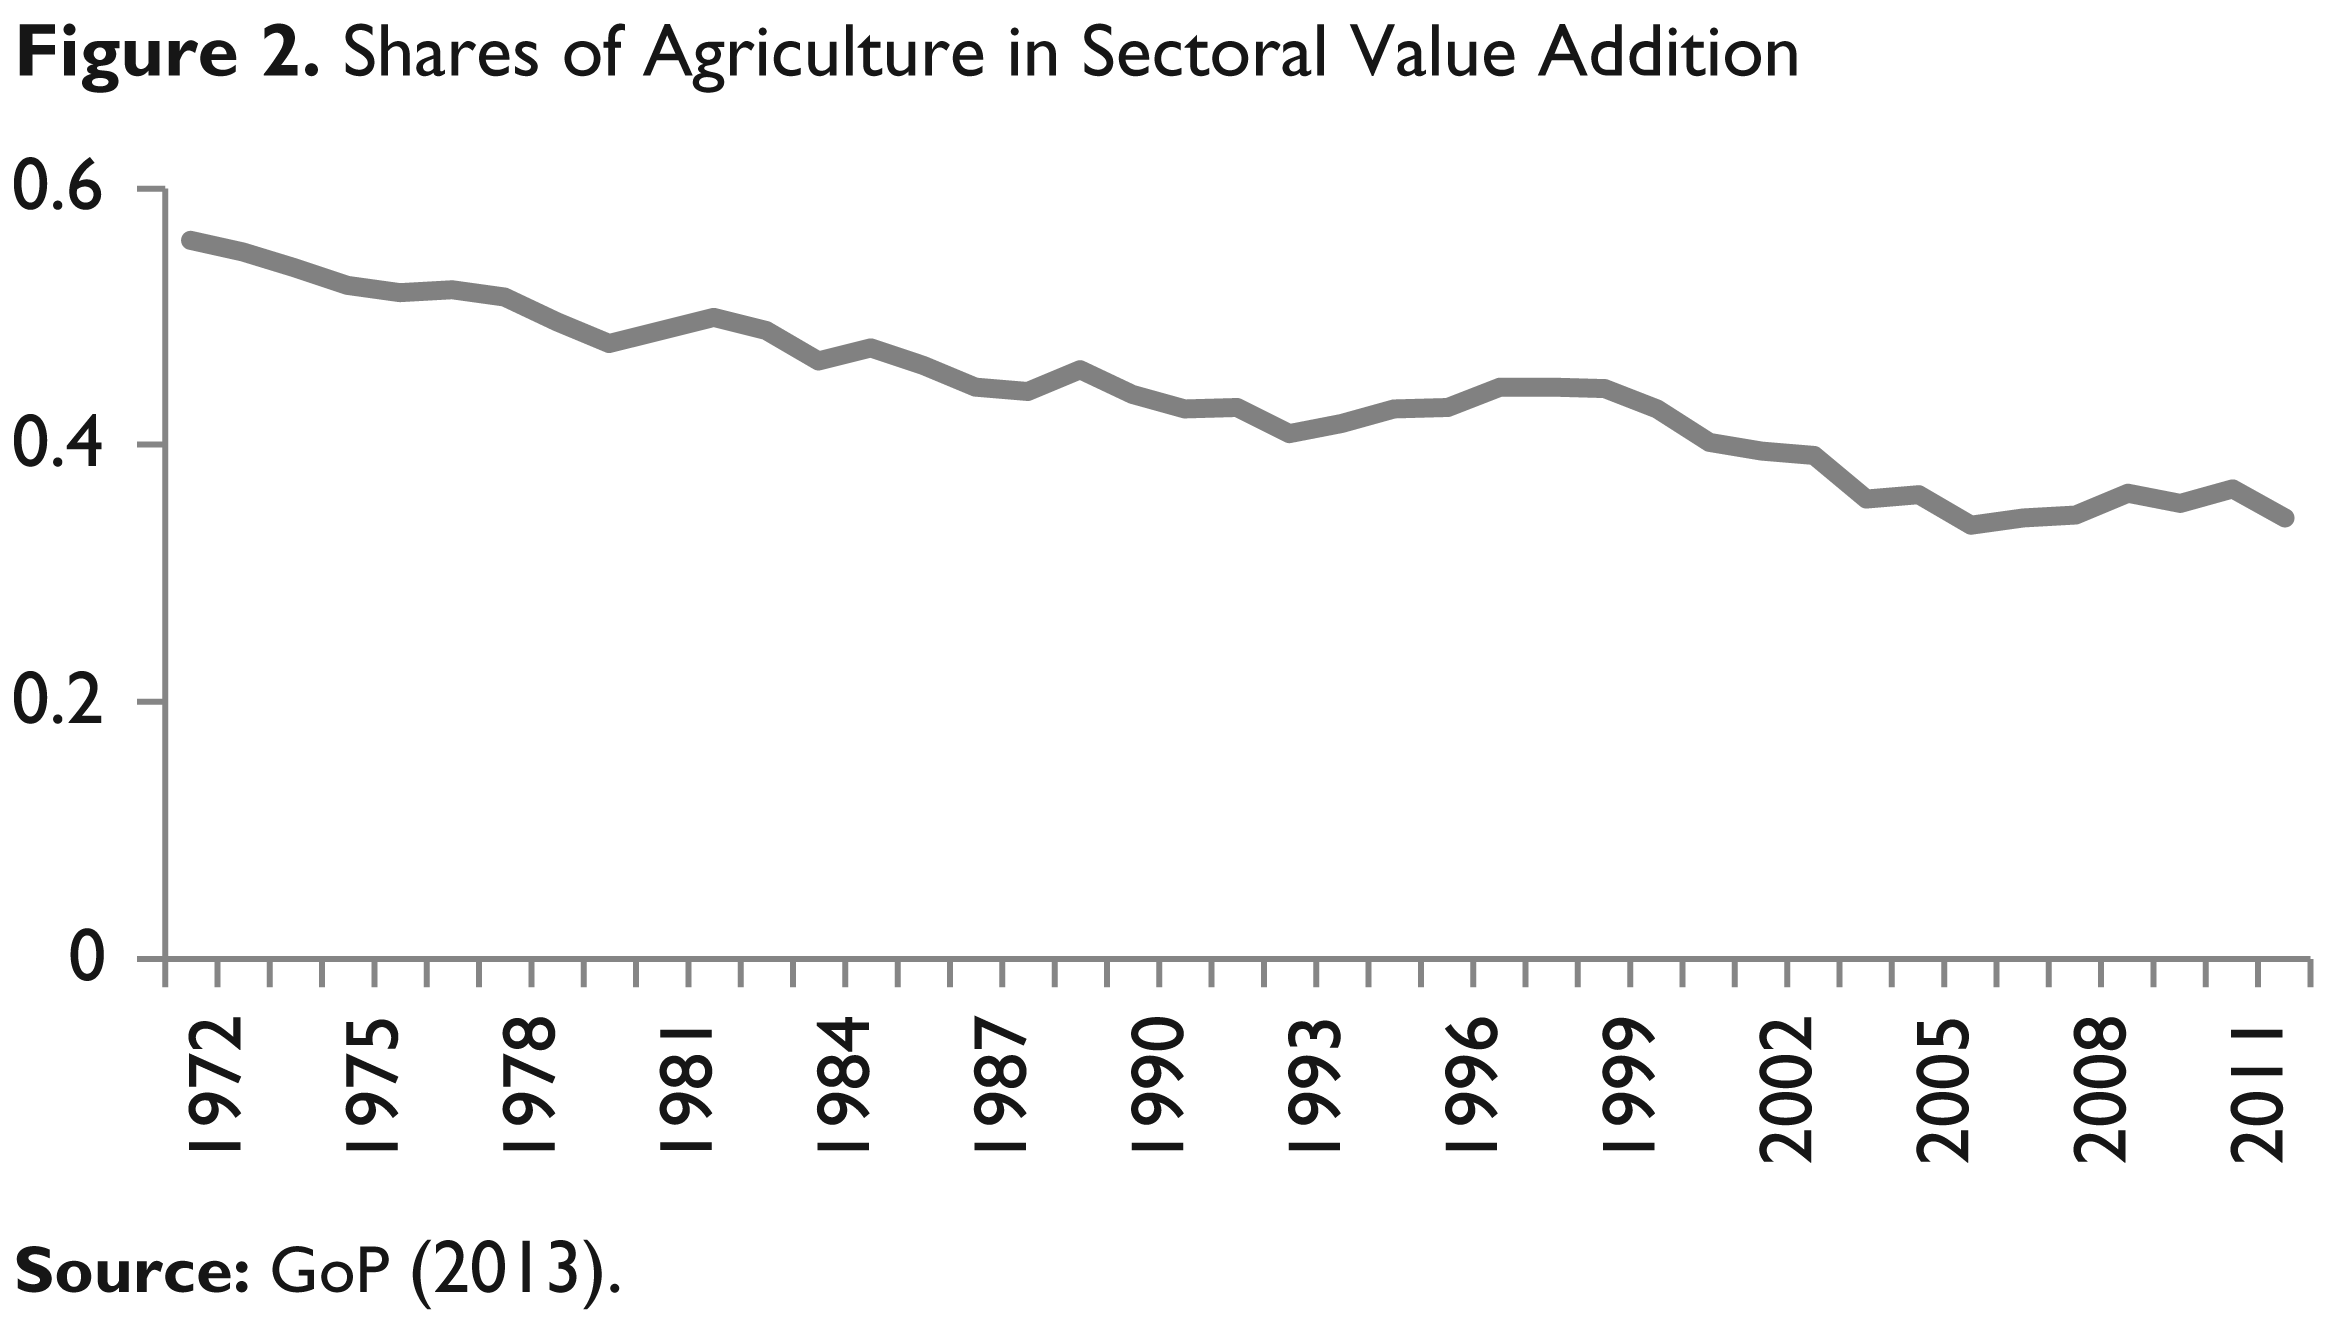
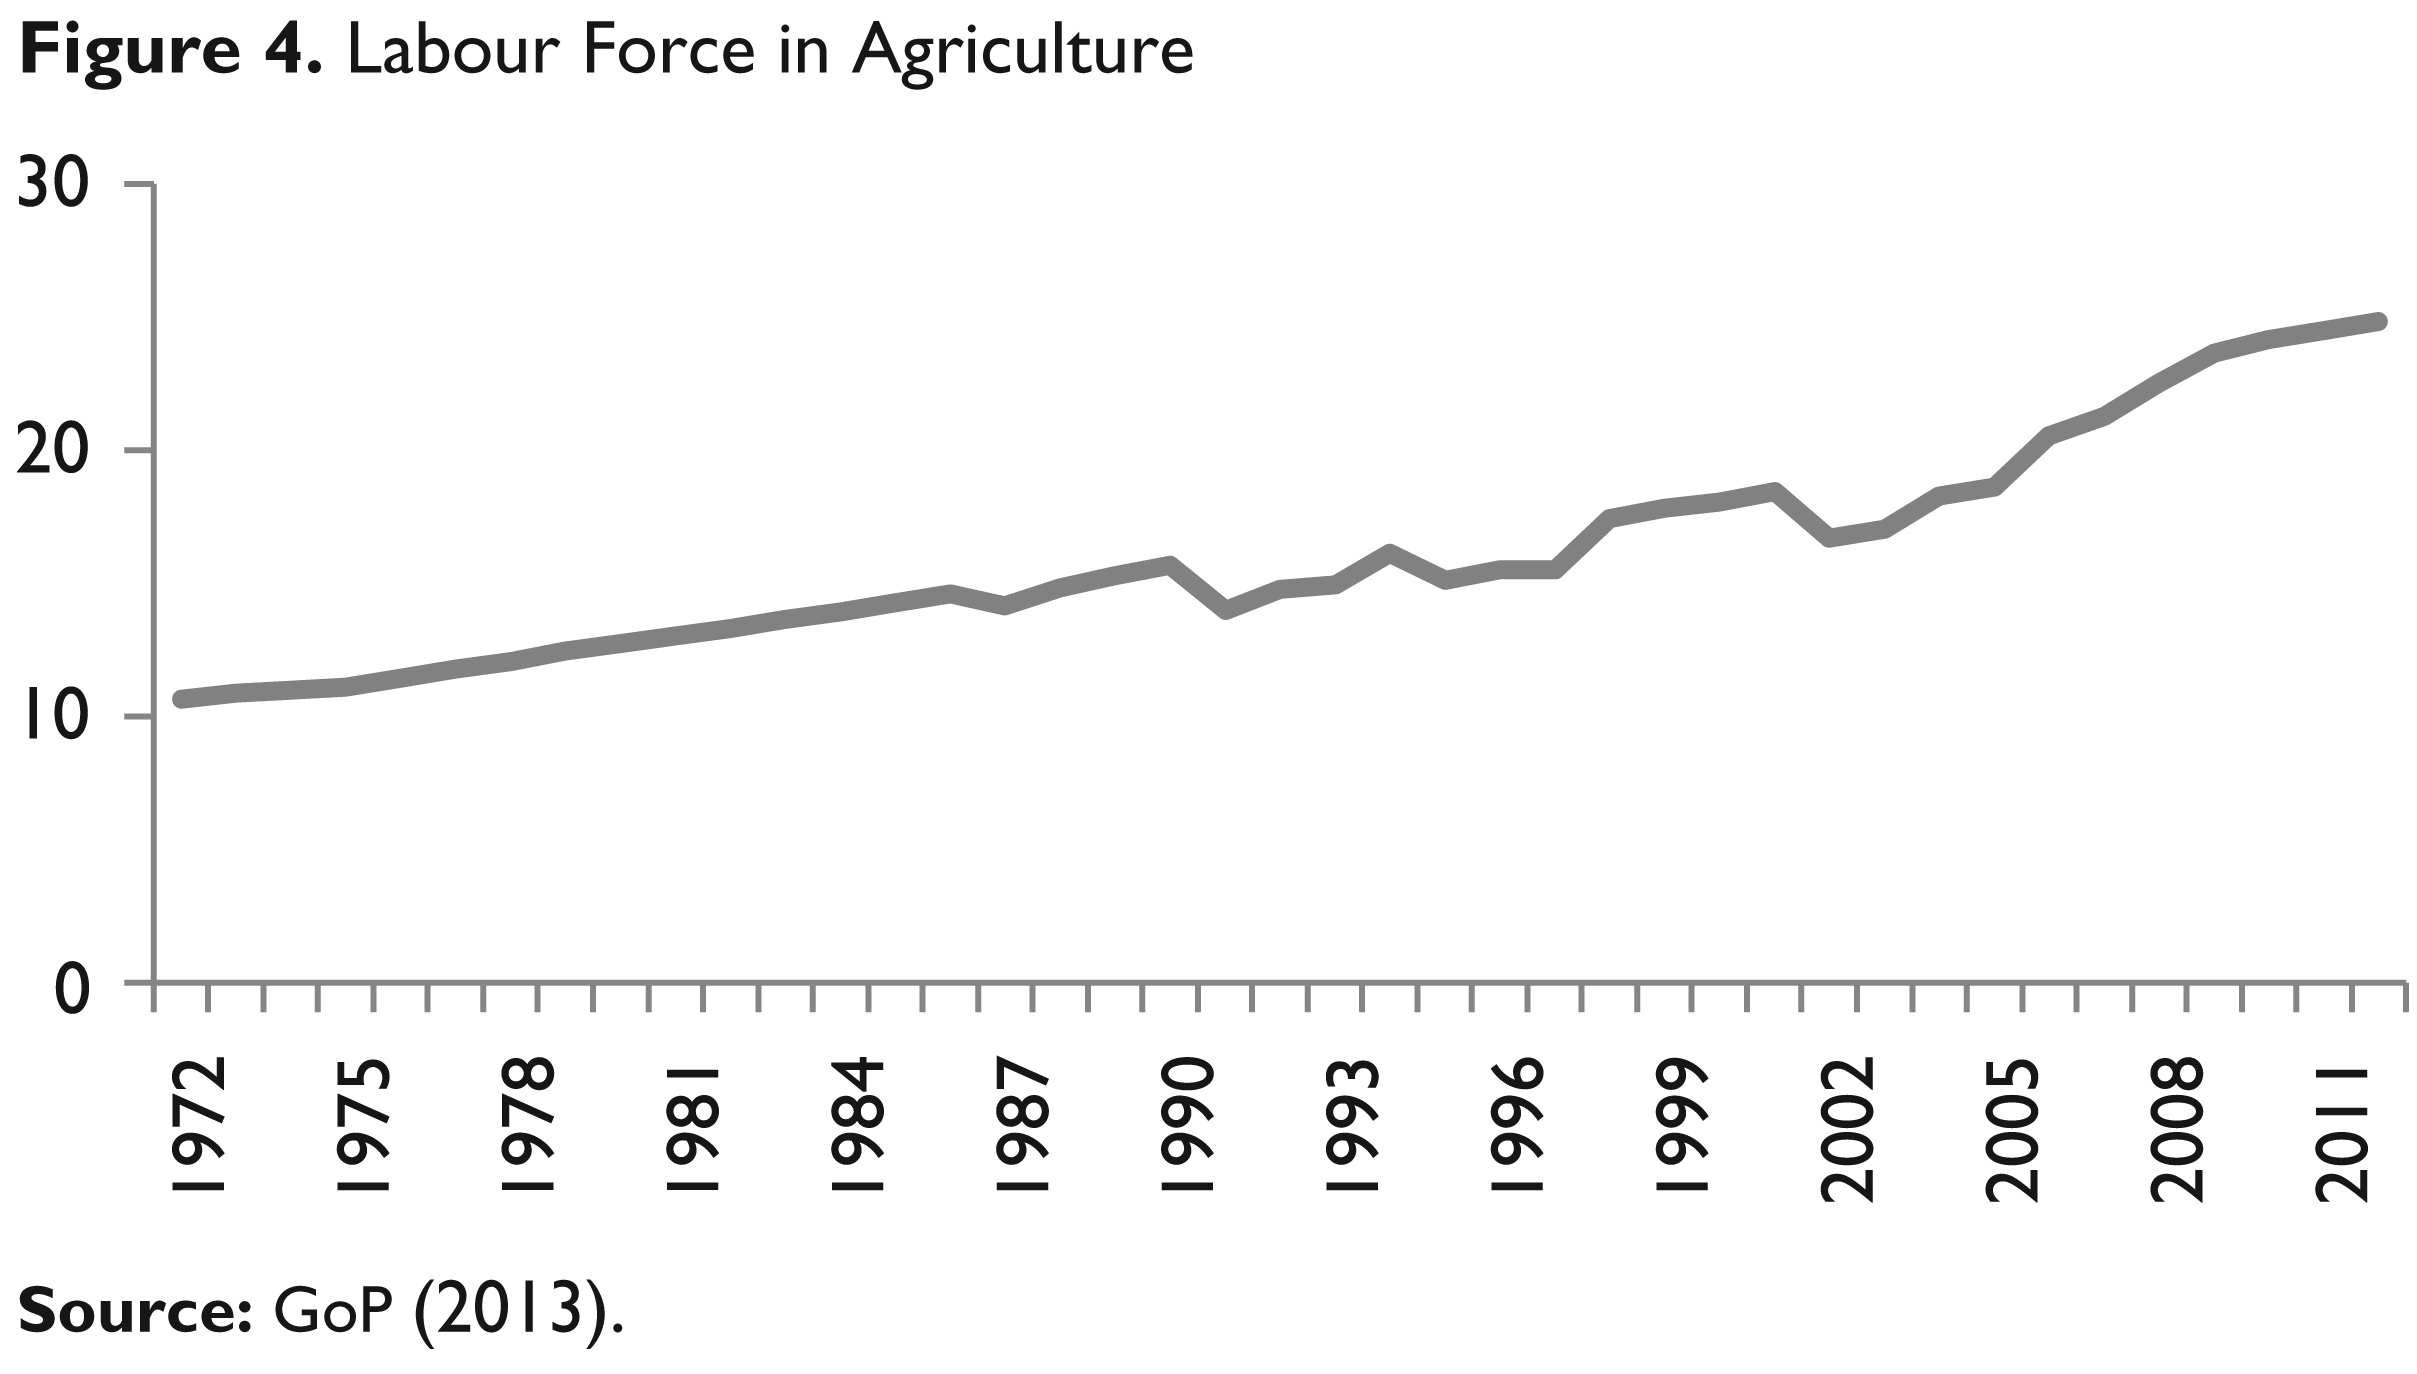
Pakistan exports a limited volume of agricultural products, because a significant share of agricultural products is consumed domestically. However, a large volume of cotton goes into domestic production, which in turn is used to produce 55 per cent of Pakistan’s textile exports. As such, the agricultural sector has a positive impact on industrial sector exports. Despite the falling share of agriculture in the total value addition, a large segment of the labour force, particularly in rural areas, is still employed in agriculture. However, the share of the labour force is declining in the agricultural sector over time. Hence, a stable agricultural sector is very important to maintain the employment level in Pakistan.
It is notable that the dependence of agriculture on electricity consumption in Pakistan has increased over time, while power generation has not kept up with demand. These trends have given us reason to decompose the energy consumption of Pakistan and analyze the behaviour of change in agricultural production, energy intensity and structural changes over the time. To our knowledge, no such study has been conducted for Pakistan. The next section provides an overview of mechanization in South Asia, followed by a discussion of the trends in agriculture and energy use in Pakistan. The literature specific to energy use is then presented with an interest in its application to Pakistan, followed by a detailed estimation strategy of energy use, an analysis of data and variables, and a presentation of the long- and short-run results. Finally, the policy implications are provided.

The Political Economy of Agricultural Mechanization in South Asia
The rapid changes in the agricultural sector significantly affected the small farmers in South Asian countries during the 1960s. The famous Green Revolution had far-reaching implications for productivity by the introduction of high-yielding seed varieties and improved fertilizers. The new biotechnologies—such as, new seeds which enhance the physiological quality, synchronicity and vigour and enable the establishment of crop in diverse environments—provided an impetus for agricultural mechanization. Initially, research emphasized irrigated farming systems, while later it focused on small and vulnerable farmers (Akdemir 2013; Mrema et al. 2008).
Prosperous farmers quickly adopted the improved seeds and fertilizers, and then moved to mechanization. In Pakistan, during the 1970s, around 80 per cent of the private tractors were owned by the wealthiest 2 per cent of farmers (McInerney and Donaldson 1975). The case of India was similar in the same period, where around 96 per cent of private tractors were owned by the wealthy farmers.
Overall, this mechanization process increased the private rate of return of agricultural farms, although in a few countries the gains were derived from the re-distributive channel rather than from the increase in net productivity (Farrington et al. 1982). A few governments tried to boost their agricultural sectors through subsidies. These included both direct and indirect subsidies for fuel consumption, research and development expenditures, discounts on foreign exchange and tax rebates. Farrington et al. (1982) claim that the social benefits of these subsidies were substantially lower than their private profits in some South Asian countries, as, for example, in Sri Lanka. In India, the agricultural subsidies were also promoted under political pressure by farmer communities.
However, a few other South Asian countries witnessed not only the private benefits arising from this mechanization but also its highest social returns. Such benefits were more visible in medium and large-scale mechanized farms in semi-arid areas of both India and Pakistan, where the land-to-worker ratio is high (McInerney and Donaldson 1975). The shift in the agricultural sector had a direct impact on farming profitability. On the other hand, the rising wage rate and higher bullock cost both changed the mindset towards the use of tractors. This increased the crop intensity and diversified the crop pattern towards high value crops, among various other benefits to small-scale farmers (Binswanger 1978). Various Asian countries provided both direct and indirect subsidies for equipment purchases (APO 1996).
During the early mechanization stages, the technology was concentrated in a few hands, increasing the income inequality between the larger and smaller farmers. The empirical evidence reveals that mechanization reduced the demand for labour (Binswanger 1986). This redundant labour force faced a significant reduction in income levels, which increased the incidence of poverty. Similarly, labour demand fell sharply in Japan, Taiwan and the Republic of Korea mainly due to rising urbanization (APO 1996). The basic motivation for agricultural mechanization in South Asia was the increasing wage rates in rural areas (Binswanger 1986).
The Asian countries emphasized higher energy consumption to increase agricultural production (Fluck and Baird 1979). For instance, the average electrical power consumption increased in India from 0.27 kW per hectare in 1950 to 0.40 kW per hectare in 1970 and to 1.02 kW hectare by 1995. Furthermore, in Punjab (India), power consumption rose to around 2.96 kW per hectare, comprised of mechanical energy (74 per cent) and electrical energy (22 per cent), the remainder being from animal sources (4 per cent). This evidence supports the findings of Giles (1967) who first claimed a positive correlation between farm power consumption and agricultural productivity.
Agriculture and Energy in Pakistan
The agricultural sector in Pakistan contributes approximately 21 per cent of GDP. It generates employment opportunities for half of the labour force and engages around 60 per cent of rural households. The Planning Commission (2012) of Pakistan believes that poverty reduction efforts cannot be sustained without a sound agricultural sector. Pakistan has two main food staples, wheat and rice. After the global financial crisis of 2008, the price of these food items has increased by 50 per cent.
Due to the prevailing energy crisis in 2013, Pakistan has set its export target a bit higher (4 per cent) than the previous year. However, rice exports declined by 7.4 per cent due to declining production resulting from expensive production inputs. Similarly, wheat exports declined significantly by 53.3 per cent. The higher cost of production emerging from the high input prices of power, transportation, insecticides and fertilizer reduced the competitiveness of both rice and wheat in the international market (Economic Survey of Pakistan 2012).
During recent decades, from 1971 to 2000, Pakistan’s agricultural sector grew at approximately 4 per cent per year (Aziz 2009). The new high-yielding seed varieties and adequate supplies of fertilizer both contributed to this growth. However, during 2000–08, the agricultural sector experienced a growth rate of around 3 per cent or less, with the weak administrative structure being mainly responsible for this lower than the potential growth rate.
Aziz (2009) finds that the rising food prices pushed around 16 million more people into poverty in 2005–08. Furthermore, Suleri et al. (2009) claim that the intensity of food insecurity is on the rise in Pakistan since 2003; the deteriorating socio-economic conditions and the rising food prices have made around 48.6 per cent of the population food insecure. Among this population, 22.4 per cent are extremely food insecure.
Under the recently approved 18th Constitutional Amendment, the Ministry of Food and Agriculture has been devolved from the federal government to the provincial governments. However, policy-makers quickly realized that some policy, planning and coordination functions in the agricultural sector need to be retained by the federal government. Subsequently, the Ministry of National Food Security and Research was established. This new ministry, which is a federal entity, seeks to ensure food security by establishing the National Food Security Council. However, the facts are not very encouraging, as the growth rate in agriculture was just 3.1 per cent in 2012, mainly because of the dismal performance of its sub-sectors (GoP 2012).
On the other hand, the energy sector is comprised of 21 departments, making energy policy difficult to design and implement. During its election campaign, although the current government had promised to create a single energy ministry, it still has not been able to implement the so-called integrated energy plan. The frequent involvement of federal government in the operations of provincial governments mainly results in inconsistent policy-making.
Although the poverty rate declined from 34.5 per cent in 2001 to 22.3 per cent in 2006, slow economic growth, power shortages and high food and energy prices have increased the incidence of poverty in recent years. In response to rising poverty in the country, the government claims to have increased pro-poor expenditures. Figure 5 indicates that poverty-related expenditures have been increasing in the budget; from 2009 to 2012, there was an average rise of 15 per cent. However, the food support programs came to an end after 2009. Overall, the poverty reduction expenditures increased from Pakistan Rupee (PKR) 316 billion (4.8 per cent of GDP) in 2005 to PKR 860 billion (5.8 per cent of GDP) in 2010.

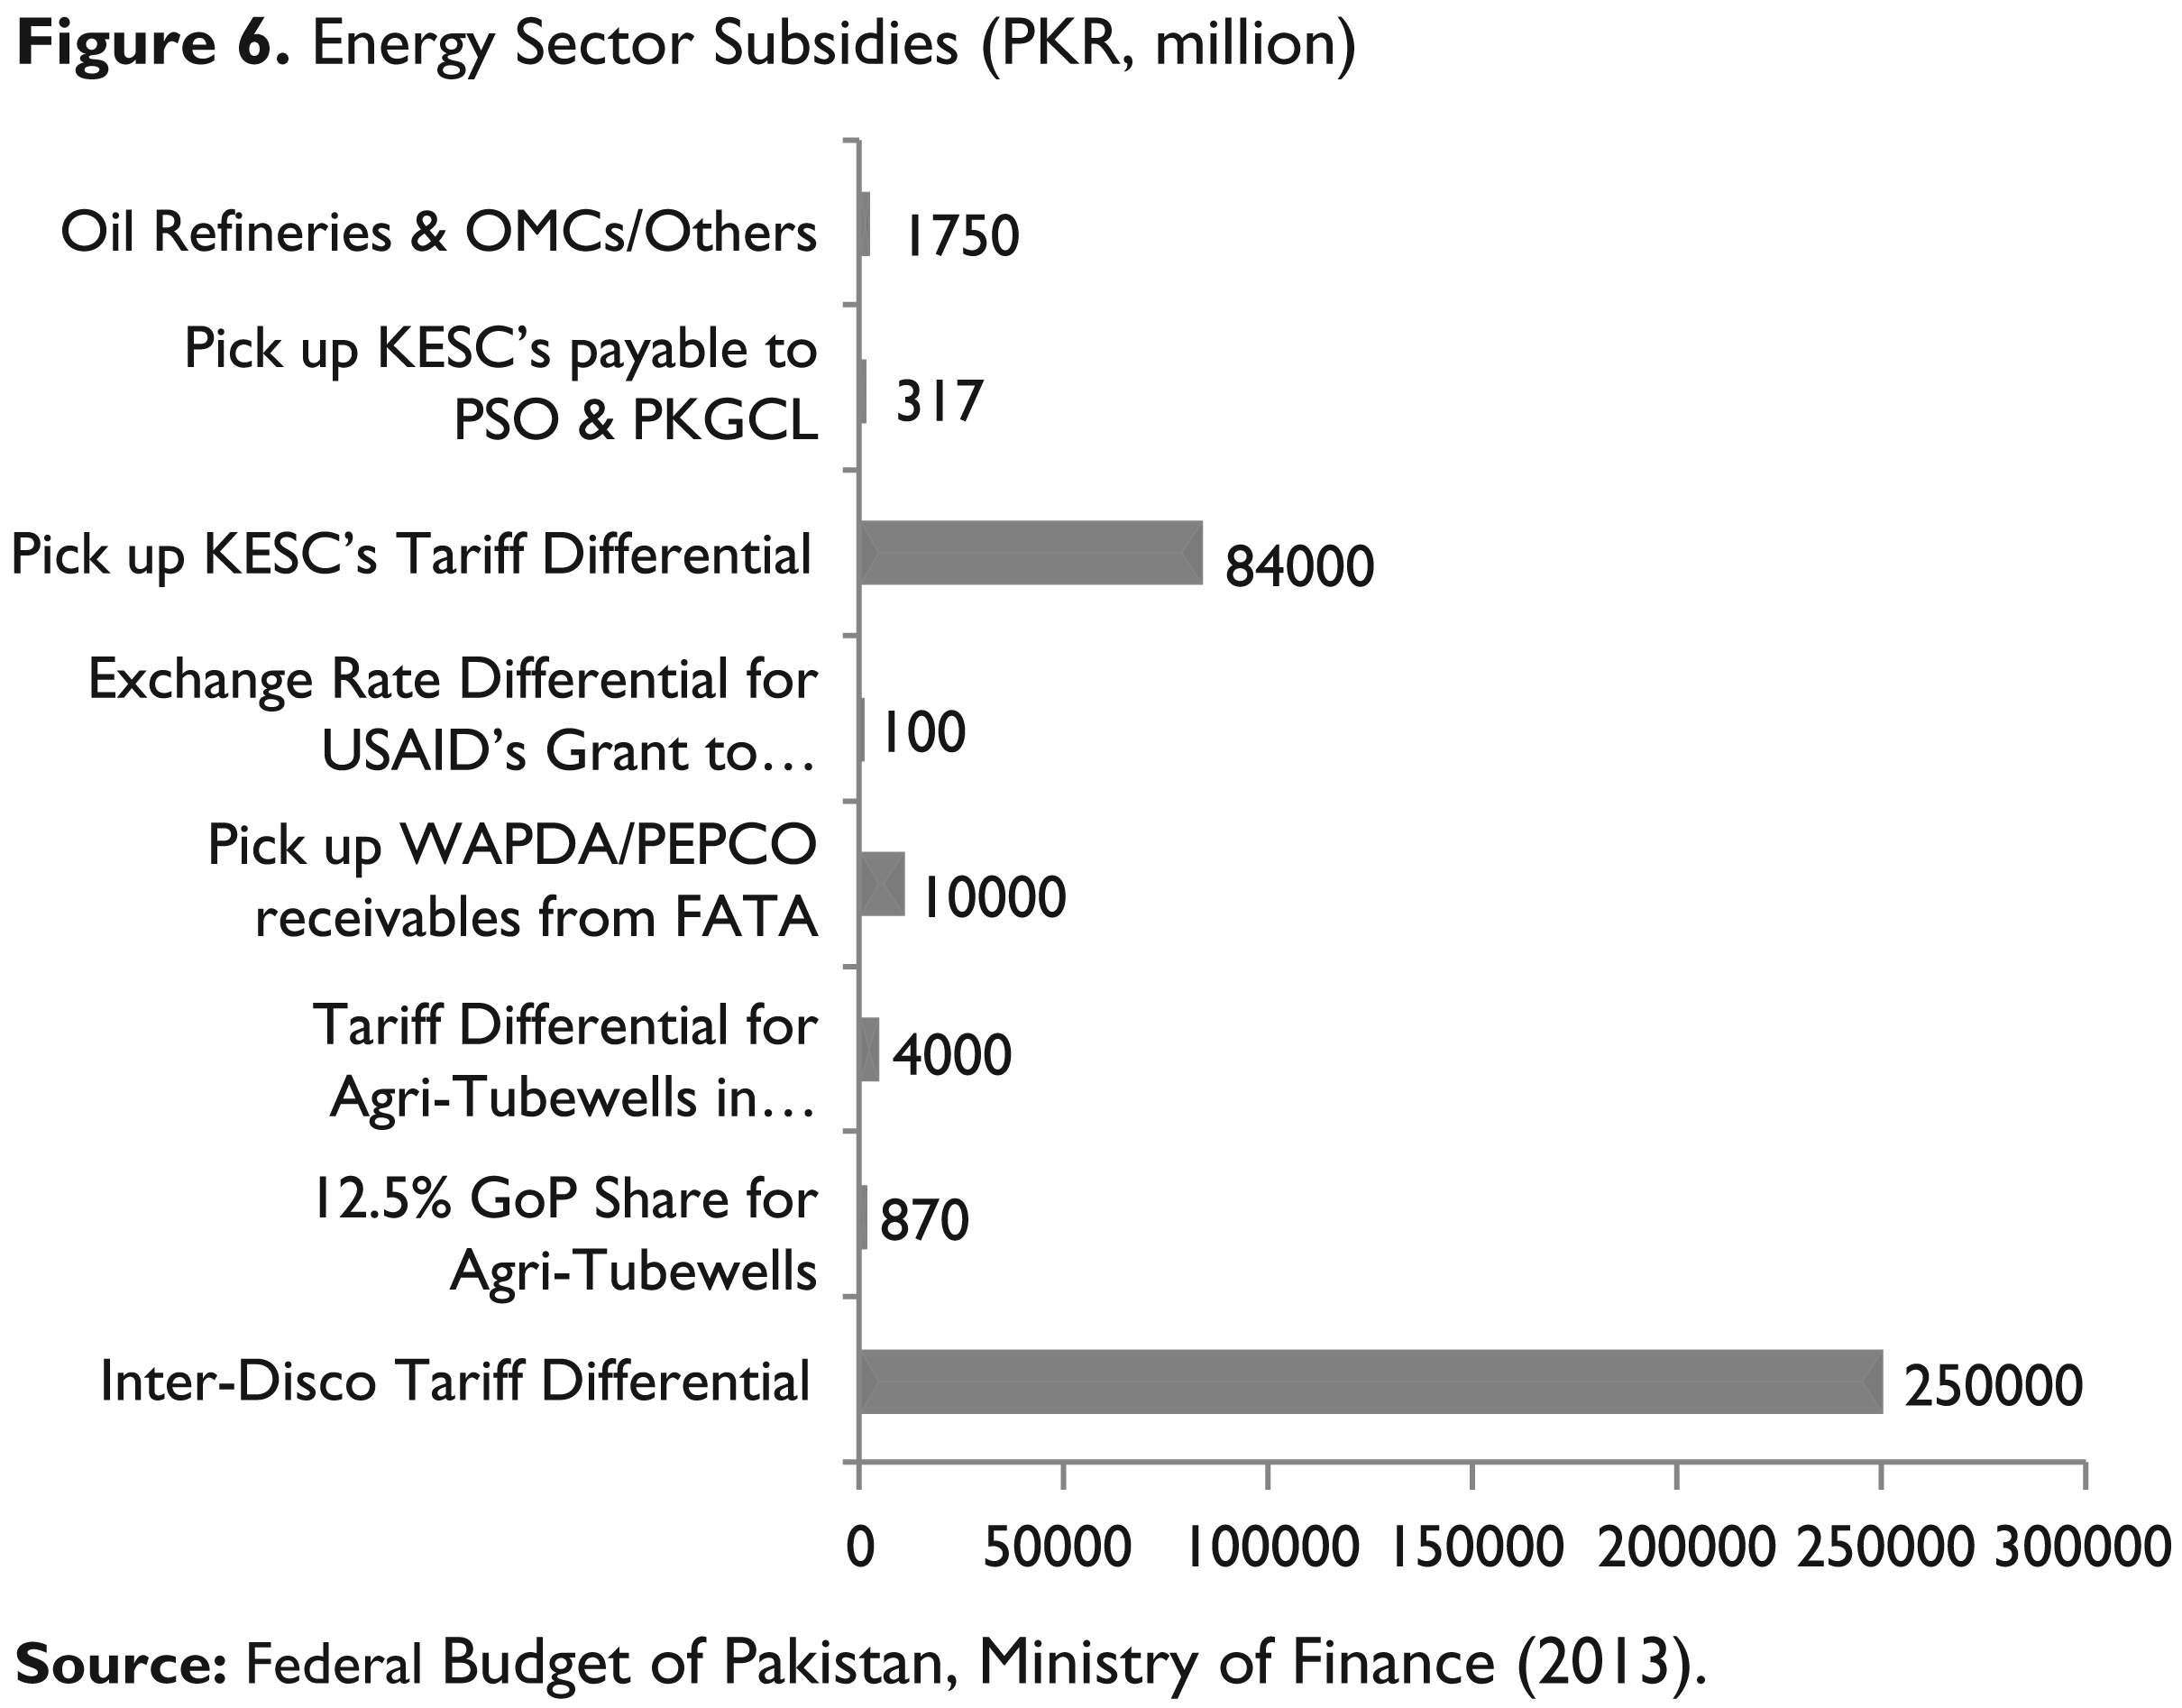
In 2013, the government provided subsidies amounting to PKR 351 billion to the energy sector. Most of these subsidies were provided to the power sector companies (see Figure 6). Out of the total of these subsidies, around PKR 4,870 million (1.4 per cent) was provided to the agricultural tube-wells, in the form of a tariff differential subsidy, which is not a targeted subsidy.
The government claims that these subsidies will provide relief to the poor. In contrast, the planning commission of Pakistan states that only 0.3 per cent of the power sector subsidies target the poor (consumers of 1–100 units of electric power), while the non-poor mostly take the advantage of these subsidies (Economic Survey of Pakistan 2012). Hence, more political will is needed to reduce the scale of these subsidies, eliminate the cross-subsidies and provide targeted subsidies to the poor.
Energy in Pakistan’s Agricultural Sector
The Relationship between Energy and Output
The causal relationship between energy consumption and agricultural output is not very clear. We do, however, have a theoretical understanding that less energy-intensive agricultural products might produce higher yields per acre, and vice versa (Liu 2013). From a global perspective, it seems that energy intensity is associated with the stages of development, as energy intensity in developed regions has fallen over time (see Table 1). However, one should also note that developing regions had lower energy intensity to start with in 1995, so energy intensity has been rising in these regions over time. In 2050, various countries tend to acquire the same energy intensity ratio such as North America, Western Europe, Latin America, Middle East and Southeast Asia, which gives a slight indication of global energy intensity convergence.
Global Energy Intensities in the Agricultural Sector

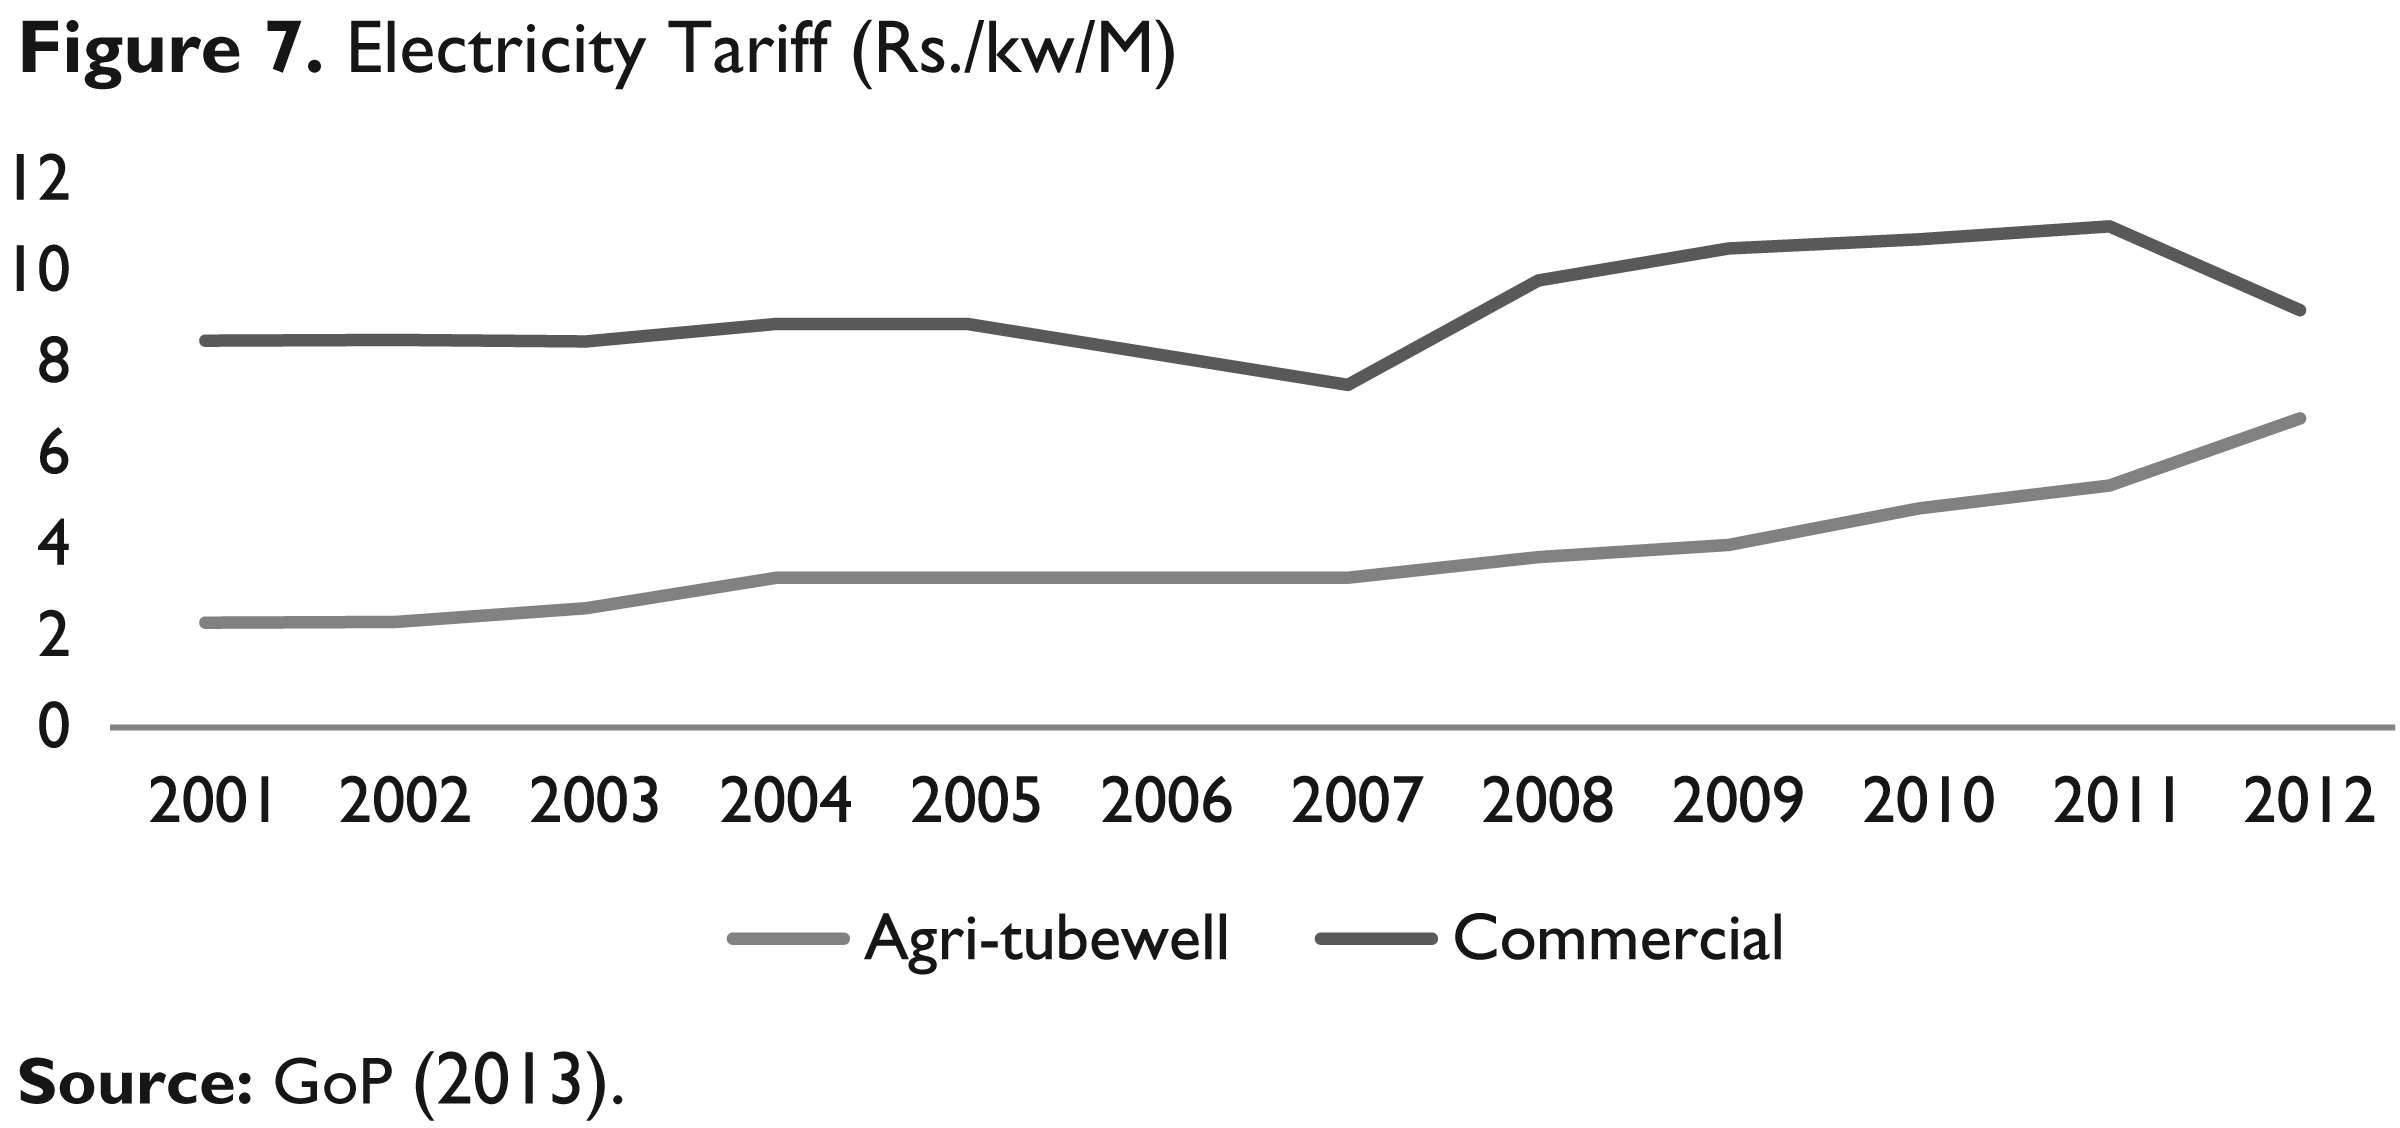
In the past, Pakistan’s agricultural sector has been heavily subsidized by government to improve its productivity. These subsidies were in the form of reduced electricity tariffs for agricultural tube-wells and lower gas prices to the fertilizer sector. However, the above analysis indicates that these measures were unable to produce the desired results. Figures 7 and 8 show the electricity tariff rate and gas price per unit in Pakistan. It is evident that the electricity tariff has been increasing on tube-wells, while it is almost stagnant during the commercial use of electricity. On the other hand, the gas price was kept fixed until 2009, rising thereafter. These facts indicate that the government has realized the insignificance of these agricultural subsidies and has been phasing out these subsidies over the time.
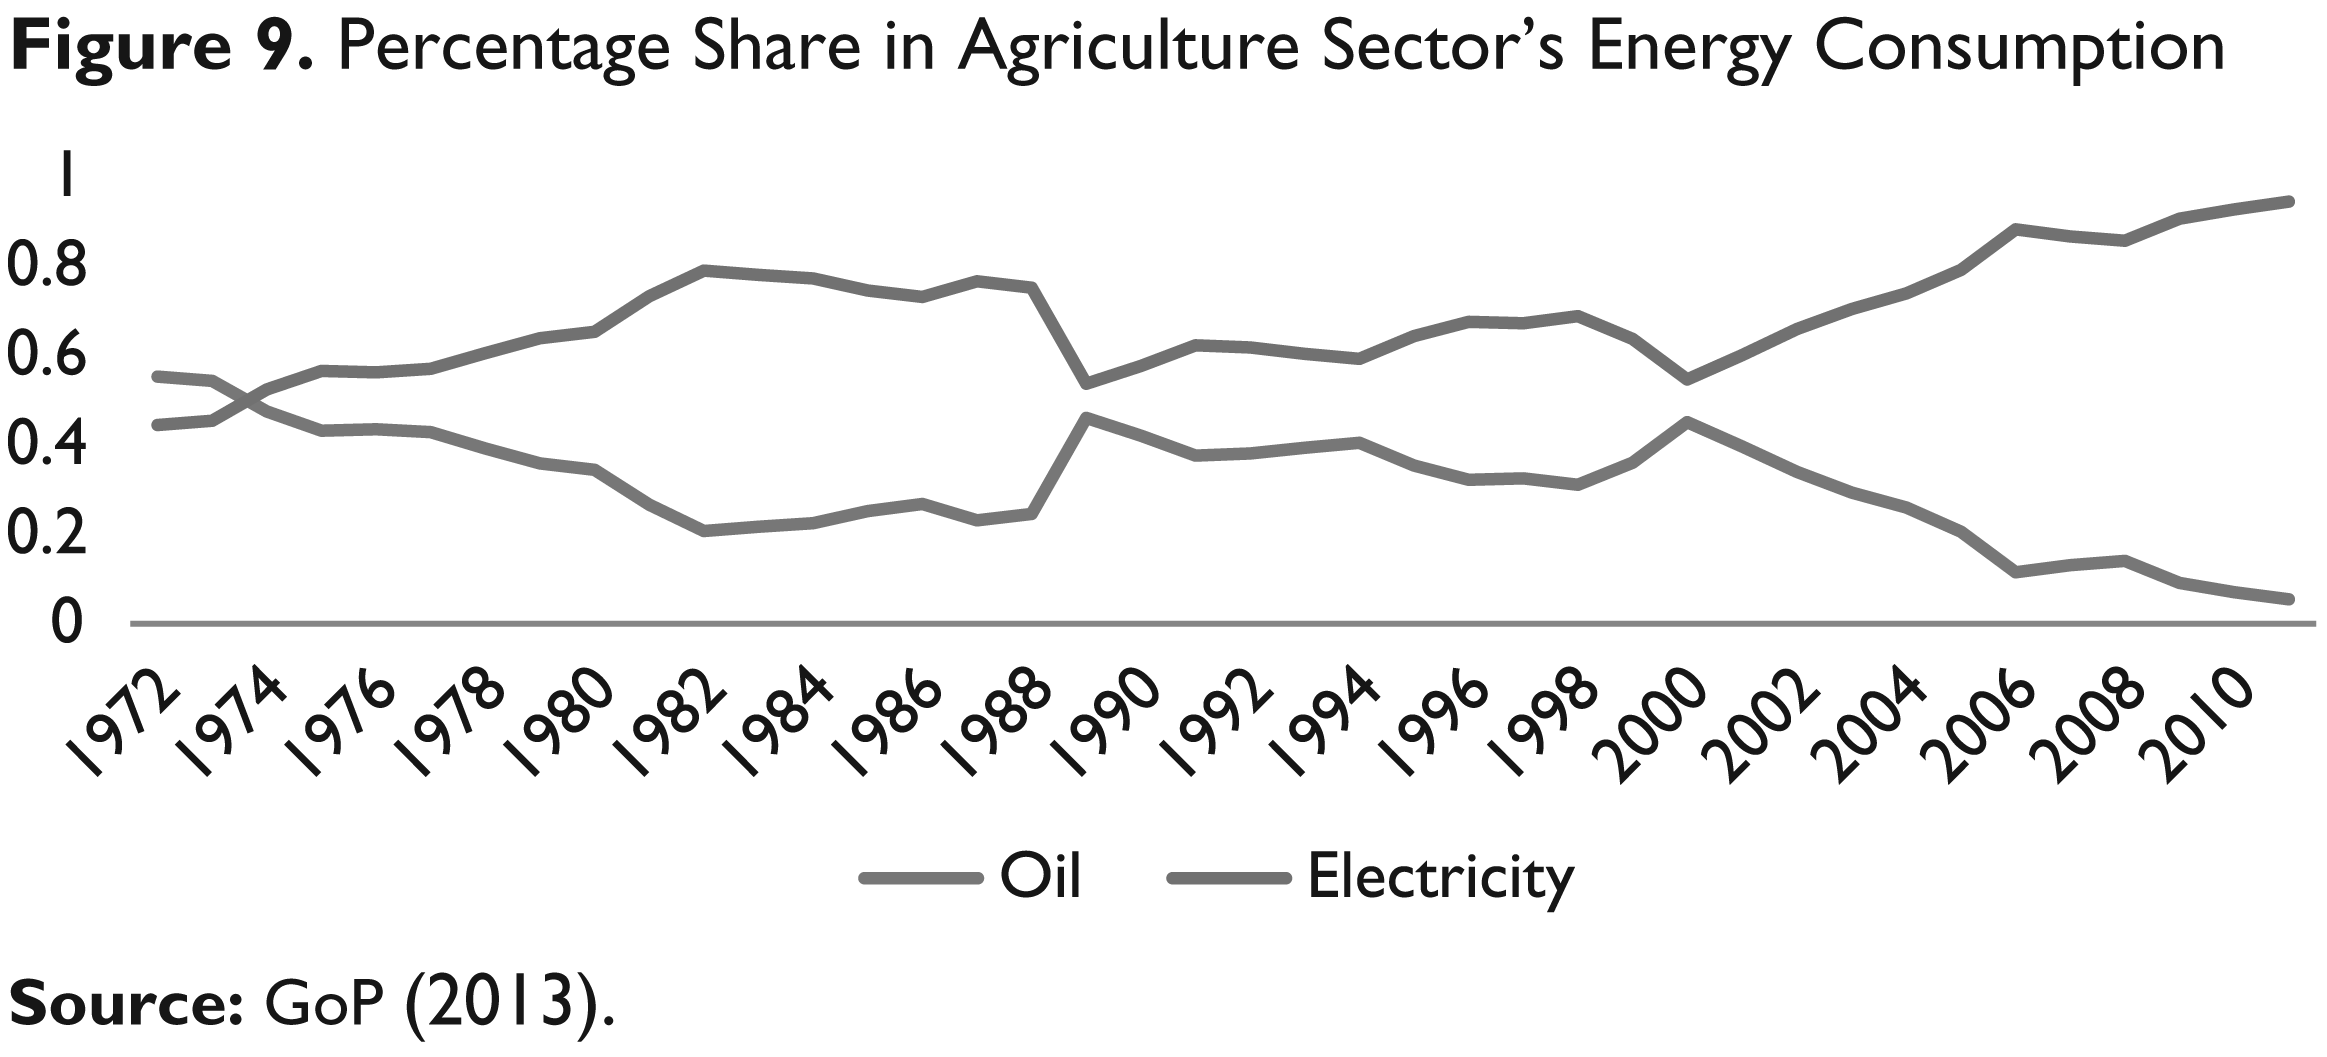
Figure 9 shows the share of oil and electricity consumption in the agricultural sector of Pakistan. Although energy consumption has remained volatile, historically, the agricultural sector has been dependent mainly on electricity consumption. With time, the share of electricity consumption in the agricultural sector has increased. During 2011, the share of electricity consumption in the energy mix increased up to 95 per cent, while the share of oil consumption was just 5 per cent.

Although the dependence of agriculture on electricity consumption has increased over time, the prevailing power generation gap in Pakistan has made it difficult to meet this growing demand of electricity. Furthermore, the National Electric Power Regulatory Authority (NEPRA) has forecasted that the gap between electricity supply and demand may increase in the coming years. In 2012, the rise in the electricity deficit was around 7,000 MW (Pakistan Energy Year Book 2013).
These facts have motivated us to decompose the energy consumption and analyze the behaviour of change in agricultural production, energy intensity and structural changes over the time. We aim to look at the quantitative relationship between agriculture output and decomposed energy consumption variables. Following the empirical literature, the present study has divided energy consumption into structural and intensity effects (Kesicki 2012; Liu and Ang 2003; Ma and Stern 2008; Marrero and Ramos-Real 2013; Nie and Kemp 2013; Shahiduzzaman and Alam 2013), using the logarithmic mean divisia index (LMDI) (Ang 2004; Ang and Liu 2007; Ang et al. 2003; Boyd et al. 1987; Liu and Ang 2003; Marrero and Ramos-Real 2013; Petchey 2010; Shahiduzzaman and Alam 2013) and the structural vector auto-regression framework (SVAR) (Kaufmann 2004; Milunovich and Yang 2013; Narayan 2013; Sims 1980).
Review of Literature on Energy Mix and Intensity
During the development process, the energy mix varies in countries. This change depends mainly on the endowments of fossil fuels and renewable energy potential. However, the share of electricity consumption in the energy mix rises over time in the agricultural sector. The less developed countries generate electricity from oil and hydropower, while the developed countries have access to more diversified energy resources which also include nuclear energy (Burke 2010; Buzzigoli and Viviani 2013; Kesicki 2012).
The energy mix in Pakistan is also skewed towards the usage of oil and gasoline. Figure 10 indicates that 43.7 per cent comes from gas, 29 per cent from oil, 15 per cent from hydropower, 29 per cent from coal and only 0.6 per cent from nuclear and 0.9 per cent from liquefied petroleum gas. However, Pakistan’s Integrated Energy Plan proposes a more diversified energy mix for 2025, which aims to reduce the share of oil in the energy mix and replace it with hydropower and renewable energy (see Figure 11).
It is believed that if Pakistan were to follow the traditional energy mix of 2010, energy consumption would increase to 138 MMTOE that is equivalent to 39,000 MW. Furthermore, oil demand would increase to 34.5 MMTOE and gas demand to 69 MMTOE. These factors would increase the import bill by up to USD 62 billion.


There are various ways of measuring the energy intensity. The marginal product approach is most relevant in indicating a marginal increase in the production of goods and services by consuming one additional unit of energy. It is determined by a complex procedure and is different for each category of fuel. It varies according to the set of activities, the combination of factors of production used and use of energy (Nie and Kemp 2013; Kaufmann 1994).
Schurr and Netschert (1960) are among the pioneers to recognize the significance of energy quality and its impact on output. They find that the composition of energy consumption varies over time, shifting in favour of higher quality fuels and reducing the aggregate energy intensity. The same findings are shared by Berndt (1990). The United States has also witnessed a decline in its energy intensity over time, which might be the result of structural shifts from lower to higher quality energy fuels (Cleveland et al. 2000; Shahiduzzaman and Alam 2013).
Kaufmann (2004) employed the vector auto-regressive framework for energy intensity, energy expenditures, energy mix and energy prices. He found that shifting away from the consumption of coal towards oil reduces the aggregate energy intensity. However, there are limits to such shifts from lower to higher quality energy fuels. In the long run, economies might have to revert to lower quality energy fuels after the exhaustion of efficient oil supplies (Buzzigoli and Viviani 2013; Kaufmann 1992).
There are two schools of thought on energy intensity. The first school asserts that change in the energy mix reduces the energy intensity over time. The second establishes that both technological innovations and structural changes are responsible for reducing energy intensity. Cleveland et al. (2000) finds less evidence of change in energy intensity after adjusting energy fuels for differences in fuel productivity in initial years. In the same period, the economic growth rate was also quite small.
However, technological innovation and structural change both have reduced the energy intensity in the recent years, while also increasing the economic growth rate (Marrero and Ramos-Real 2013). Ma and Stern (2008) also assert that technological change is more important than the change in the energy mix in reducing energy intensity. They find that, in China, the substitution of different fuels has a smaller impact on energy intensity. However, technological progress has reduced energy intensity significantly.
In contrast, Stern (2010) claims that change in the energy mix has increased the world energy consumption by 4 per cent, while reducing global energy intensity by 40 per cent. Hence, it is evident that technological and structural changes go a long way to change the energy mix and reduce energy intensity (Nie and Kemp 2013; Shahiduzzaman and Alam 2013). There is also evidence of shifting from an efficient fuel mix to less efficient fuels when countries are energy scarce. Shifting production activities towards a lower quality energy mix, such as, in India and China, has been increasing energy intensity across the globe.
A review of the literature provides only one study on this topic regarding Pakistan, with many limitations. Alam and Butt (2001) evaluated the intensity and structural effects in the energy consumption of the agricultural sector. They found that structural changes are the main reason behind the rising energy intensity over time. Furthermore, structural and activity effects both increase the energy consumption in the agricultural sector.
These findings indicate that rising production and structural changes both result in inefficient use of energy, while the reasons for these inefficiencies are unknown, this being the first limitation of the study above. Second, the study provides an aggregate analysis of the economy and does not separate the impact of activity and structural effects on the agricultural sector. Third, it does not distinguish between short-run and long-run results. Fourth, it does not provide Granger causality analysis, which is very important from a policy perspective. Hence, the present study aims to fill all these gaps in the literature. The next section outlines the econometric framework employed in this study.
Estimation Strategy, Data, Variables and Results
This section provides two empirical estimation techniques. The first is the LMDI (Ang and Liu 2007; Boyd et al. 1987; Marrero and Ramos-Real 2013; Shahiduzzaman and Alam 2013) and the second is the SVAR framework (Kaufmann 2004; Milunovich and Yang 2013; Narayan 2013; Sims 1980). The former is a standard tool for long-run empirical analysis and provides aggregated results. It resembles the contemporaneous time series decomposition methods, dividing a time series into its different components and examines the overall energy efficiency in the agricultural sector. The latter provides the short-run structural estimates derived from its reduced form estimates.
The Logarithmic Mean Divisia Index (LMDI)
The analysis of change in energy consumption with the help of an index decomposition approach began in the late 1970s. Until the late 1990s, researchers had little consensus regarding the best method of index decomposition. Ang (2004) has provided a baseline study for model selection dividing the famous decomposition method in two categories, that is, Laspeyres index and LMDI. It finds that LMDI provides robust results over time. A number of empirical studies have been using the LMDI method in recent years (Ang 2005; Ang and Liu 2007; Boyd et al. 1987; Marrero and Ramos-Real 2013; Shahiduzzaman and Alam 2013).
The contemporary literature shows that LMDI has become a standard tool for long-run empirical analysis. LMDI can analyze the agricultural sector energy demand and provides results in aggregated form. It resembles the time series decomposition methods that divide a time series into seasons, cycles, trend and irregularities. It examines the overall energy efficiency in agriculture, by aggregating the information of all these sub-sectors. Recently, tracking the energy efficiency through decomposition methods has become part of the index decomposition analysis which is the most rigorous technique. This method provides results revealing long-run trends and demand projections (Kesicki 2012).
Literature divides changes in energy consumption into three categories, that is, activity effect, structural effect and intensity effect (Kesicki 2012; Liu and Ang 2003; Ma and Stern 2008; Marrero and Ramos-Real 2013; Nie and Kemp 2013, Shahiduzzaman and Alam 2013). The activity effect indicates the change in energy consumption arising from economic activities. It accounts for the observed change in energy consumption in agriculture caused by its value addition. Any change in energy consumption related to the changes in the composition of production activity is known as the structural effect. Finally, any change in energy consumption linked to the change in energy intensity is known as the efficiency effect.
Following Marrero and Ramos-Real (2013), Shahiduzzaman and Alam (2013), Petchey (2010), Ang (2004), Liu and Ang (2003) and Ang et al. (2003), the present study employs the additive LMDI decomposition method. This technique allows a given variation in energy consumption of a sector. It is as follows:

where DE, A, S and I stand for change in energy consumption, agricultural value added, the share of agricultural sector in total value added and energy intensity in agriculture sector, respectively. It is evident from Equation (1) that there is no residual value on the left-hand side; this is one of the advantages of using the LMDI method.
The Structural Vector Auto-regression (SVAR) Framework
The significance of structural estimates over reduced form estimates is obvious in the empirical literature. The former provides information that is useful for inferential analysis. Fortunately, the current econometric literature has enabled us to identify the structural estimates from a model, and the SVAR is the most known tool in empirical literature (Milunovich and Yang 2013; Narayan 2013):

where

where:
and
Equation (3) represents the reduced form vector auto-regression (VAR) model and can be estimated by an ordinary least square (OLS) method, because it has identical independent variables on the right-hand side of Equation (3). However, any different composition requires the seemingly unrelated (SUR) framework. The SUR model provides the best estimates if the variables on the right-hand side have different composition (Enders 2004).
The identification procedure requires
The present study also shows the direction of causality among the variables. Although correlation is not a perfect match of causation, it can demonstrate the likelihood of causation or the absence of causation (Geweke 1984). It is as follows:




where
Data and Variables
Following Marrero and Ramos-Real (2013), Nie and Kemp (2013), Shahiduzzaman and Alam (2013) and Petchey (2010), the present study employs four variables: agricultural value added (production effect denoted by A), denominated in PKR million rupee and constant prices for the year 2000; energy consumption (E) in agriculture sector in Tons of Oil Equivalent (TOE); share of agricultural value added in the total value added (structural effect denoted by S) and energy intensity (intensity effect denoted by I). 1
The first two variables are taken from various issues of Pakistan energy yearbooks and economic surveys of Pakistan. The last two variables have been calculated using World Development Indicator data. The period of analysis is from 1972 to 2012. The next section outlines detailed short-run and long-run empirical results.
Results of the Logarithmic Mean Divisia Index (LMDI) Approach
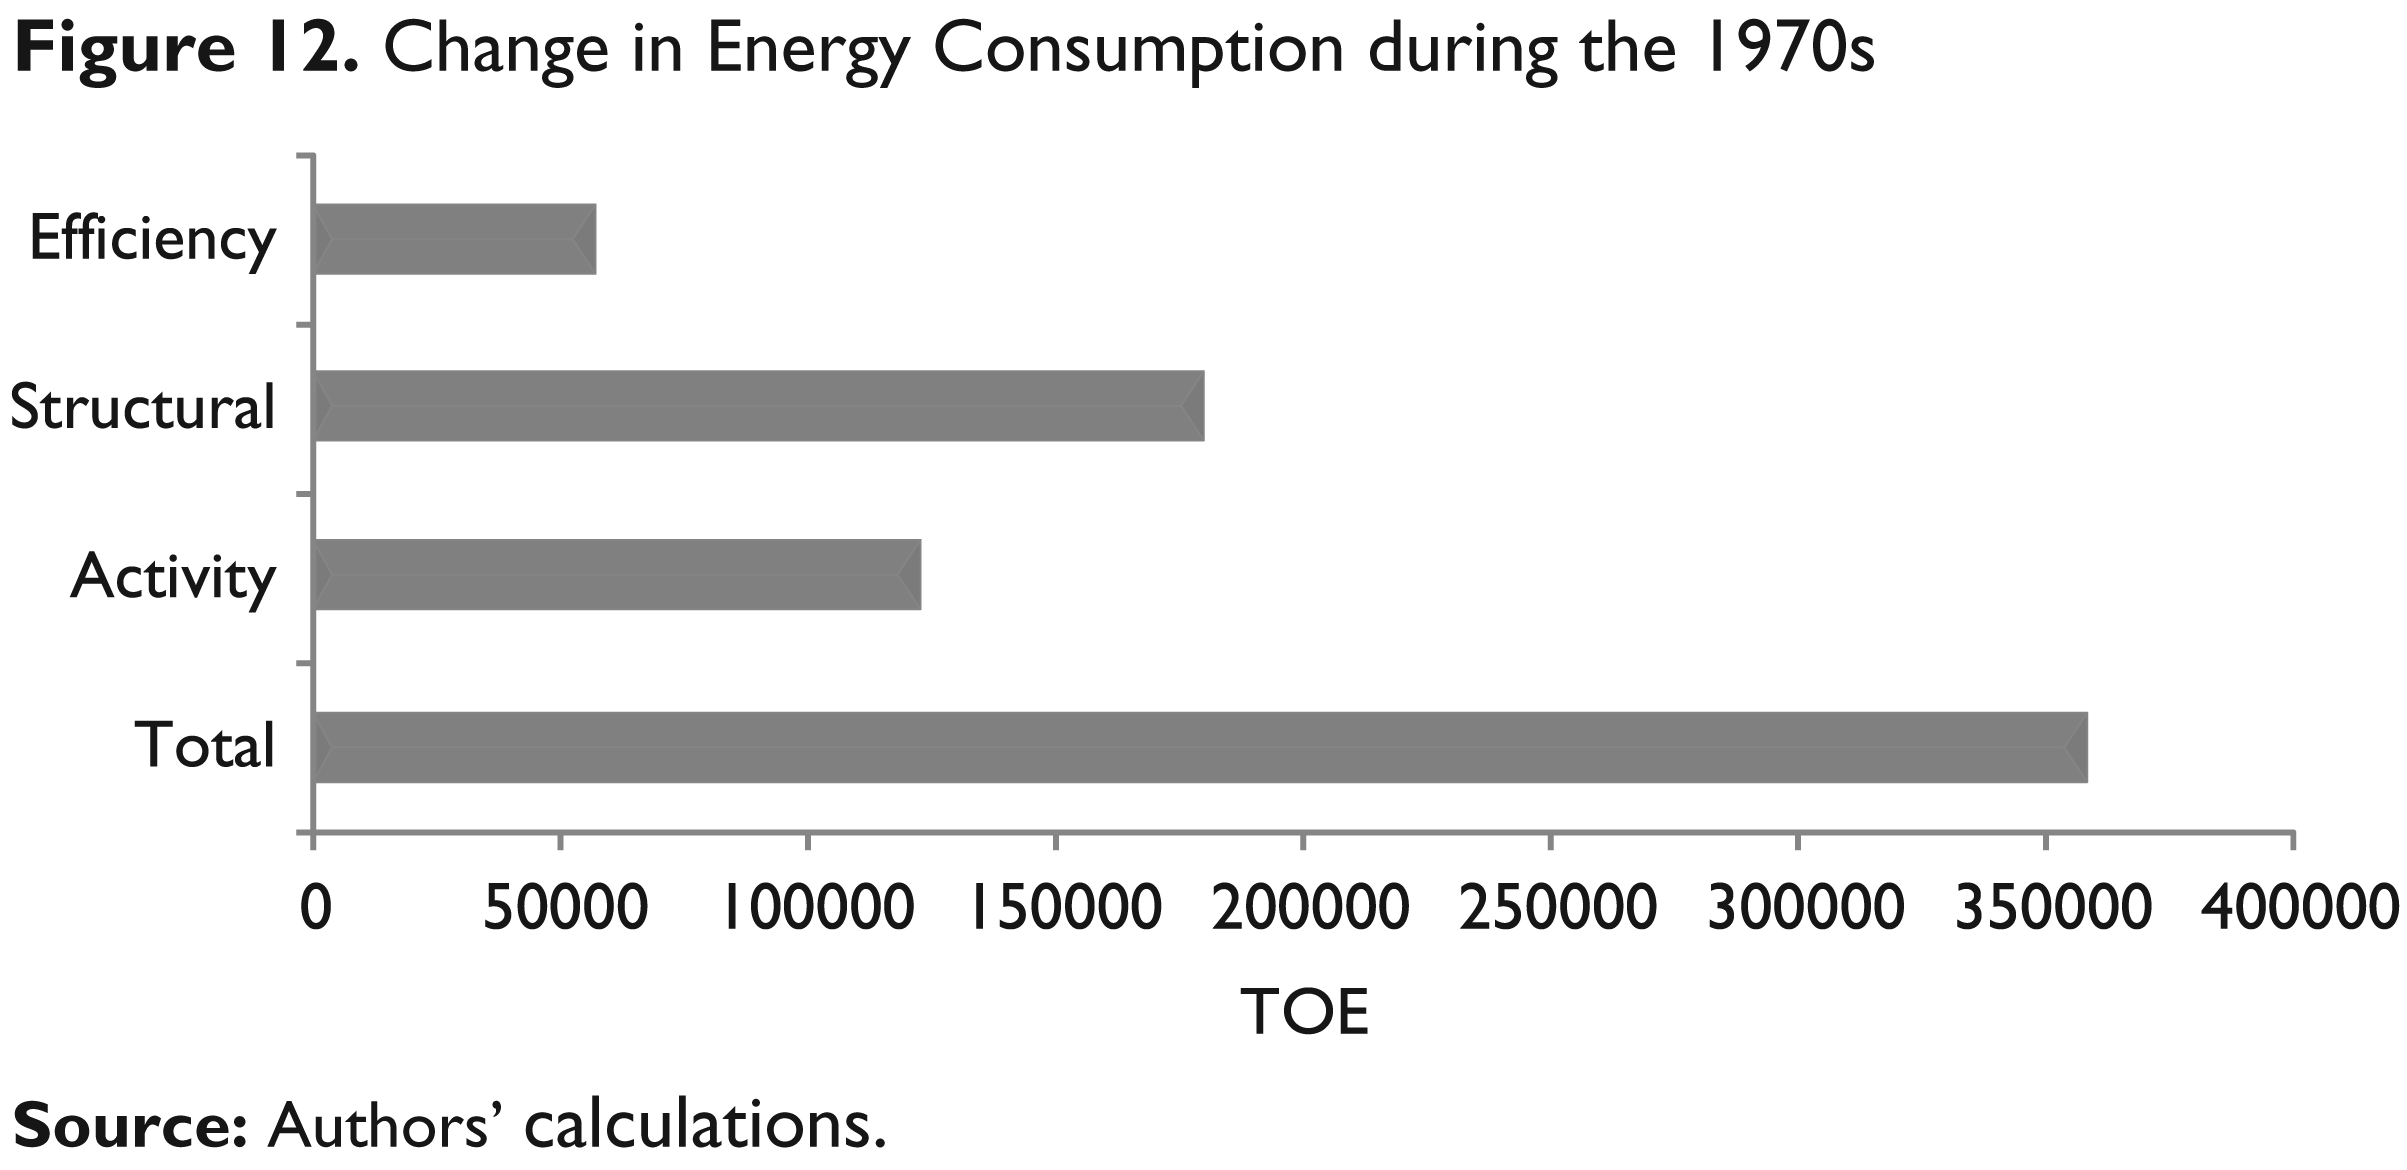
The LMDI results indicate that all the variables under analysis, such as, aggregate production effect, structural effect and efficiency effect, all had a positive impact on energy consumption in the 1970s. Aggregate production increased the energy consumption by 122,036 TOE, and change in aggregate intensity increased the energy consumption by 237,205 TOE. Dividing aggregate intensity into structural effects and efficiency effects shows that the former increased the energy consumption by 179,621 TOE, while the latter increased the energy consumption by 57,584 TOE (see Figure 12).
It is important to note that higher energy consumption owing to the efficiency effect does not mean that Pakistan consumes energy inefficiently. As the efficiency effect is the inverse of the intensity effect, improved efficiency does not imply efficiency in energy consumption. Rather, this might be the result of a change in the pattern of energy consumption, moving from more energy-intensive sub-sectors to less energy-intensive sub-sectors. These results are consistent with Alam and Butt (2001). On the other hand, the structural effect indicates that the structure of the economy changes, such that, society is more prone to energy consumption. At this moment, it would not be easy to predict the pattern of energy consumption, that is, whether it is efficient or inefficient. However, such analysis will be conducted in the next section.
As explained above, during the 1970s a mismanaged exercise of nationalizing production activity in Pakistan increased energy intensity. Many believe this rising energy intensity brought a dampening effect on the output, which is evident from a dwindling factor productivity during the 1970s (Amjad 2012; Burki 2008).
During 1980s, the aggregate production in Pakistan resulted in higher energy consumption by 125,631 TOE. In contrast to the 1970s, the intensity (efficiency) effect reduced energy consumption significantly, while the structural effect increased it. However, the increase in energy consumption was smaller during 1980s. The efficiency effect reduced the energy consumption by 117,950 TOE, while the structural effect increased it by 7,681 TOE (see Figure 13 for details).

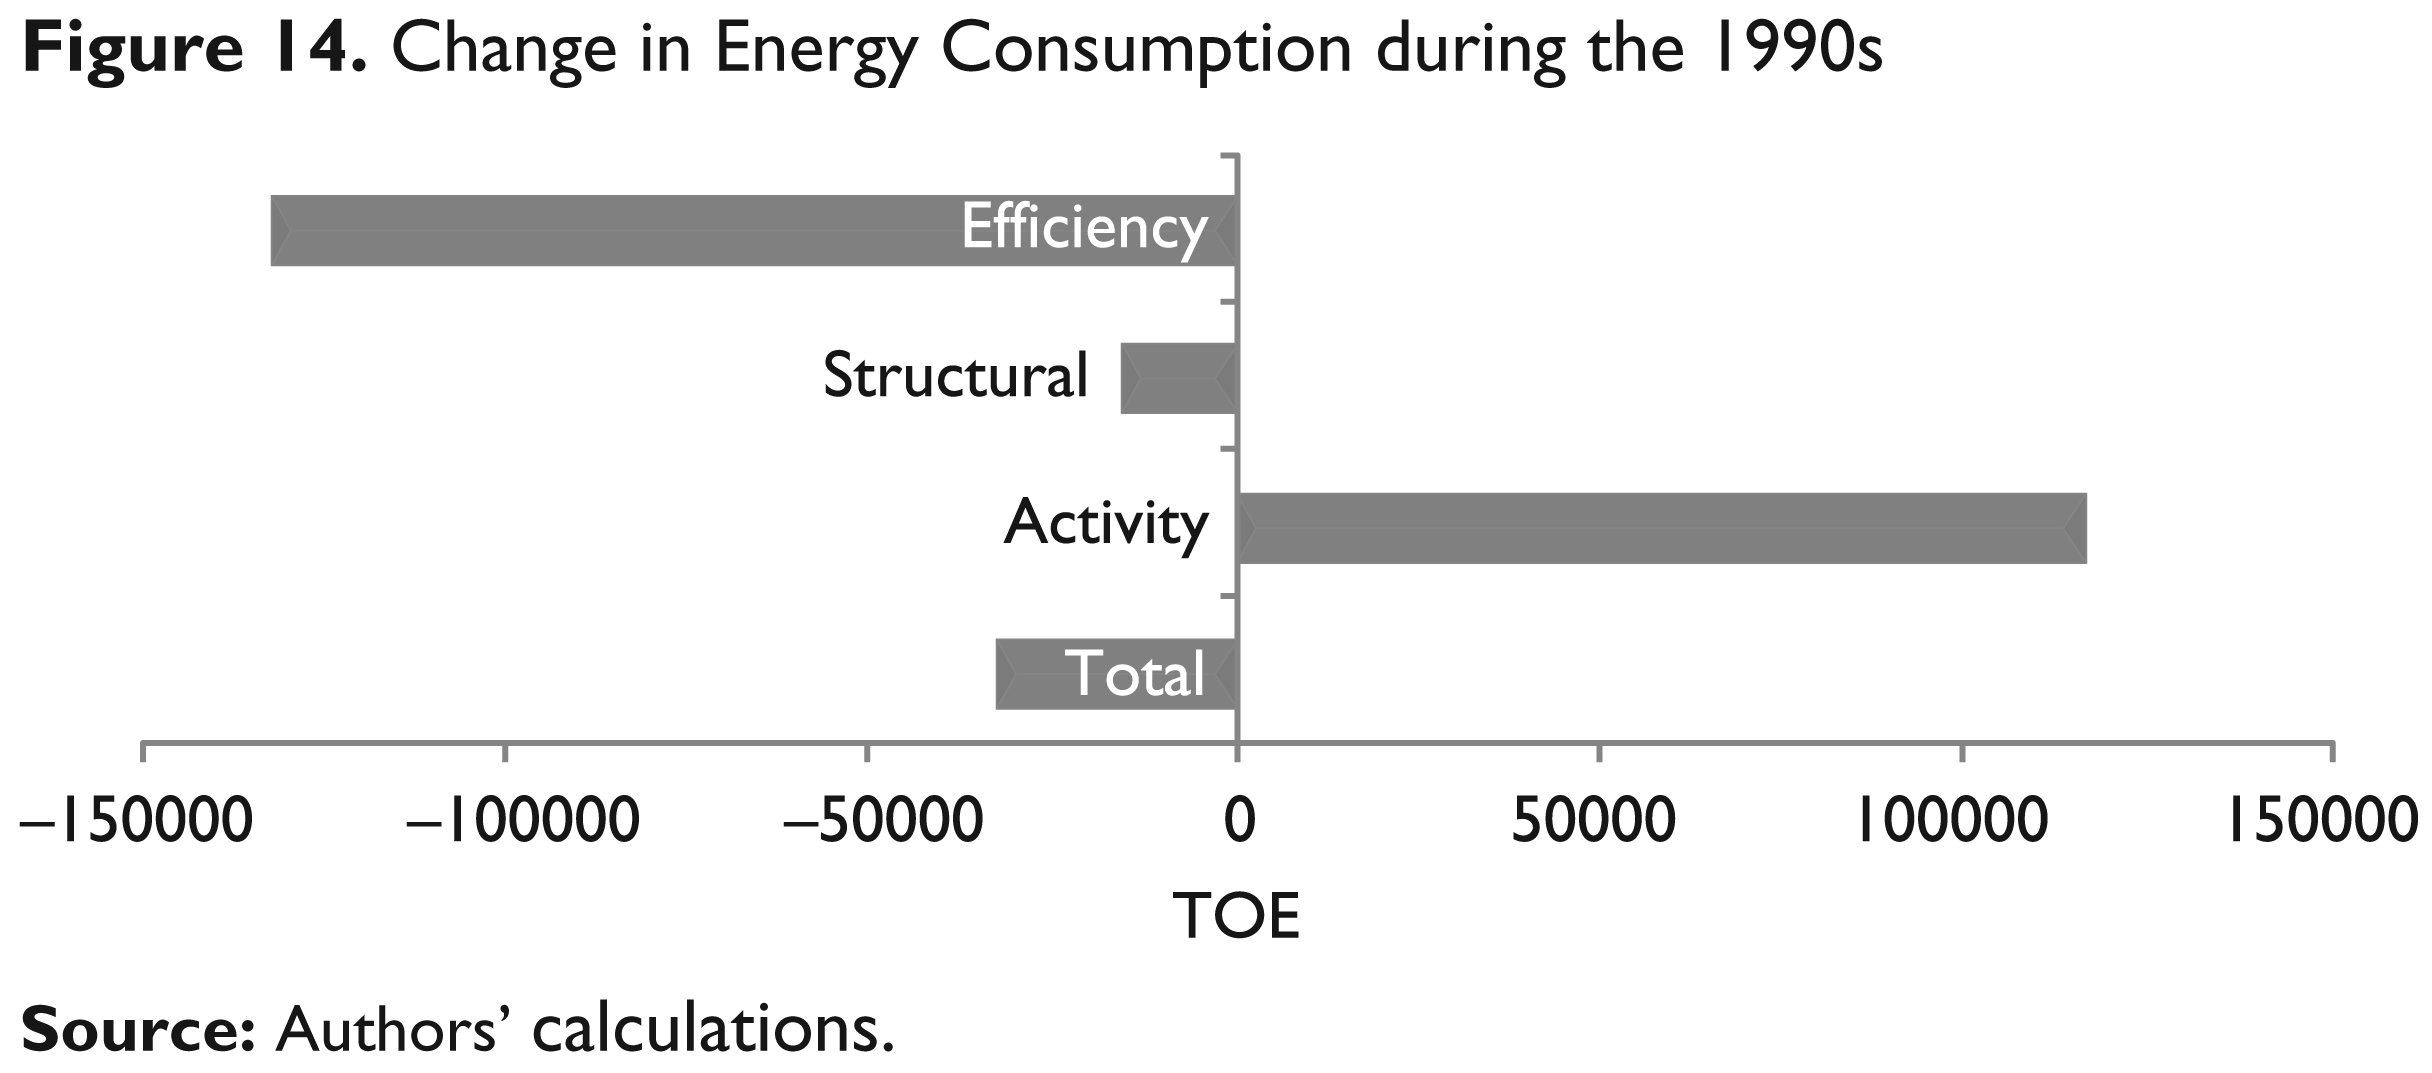
During 1990s, the aggregate production in the agriculture sector increased the energy consumption. However, the efficiency effect and structural effect both reduced the energy consumption in 1990s. It is evident from Figure 14 that the aggregate production in the agricultural sector increased energy consumption by 113,970 TOE. However, the efficiency and structural effects both decreased energy consumption by 130,403 TOE and 16,425 TOE, respectively.
During 2000s, the total energy consumption in agriculture increased by 60,252 TOE (see Figure 15 for details). Disaggregated results indicate that the activity and structural effects both increased the energy consumption by 35,166 TOE and 30,126 TOE, respectively, while the efficiency effect saved energy consumption by 5,040 TOE. These were the long-run results of the LMDI framework; however, the short-run results of the SVAR framework are presented in the following.
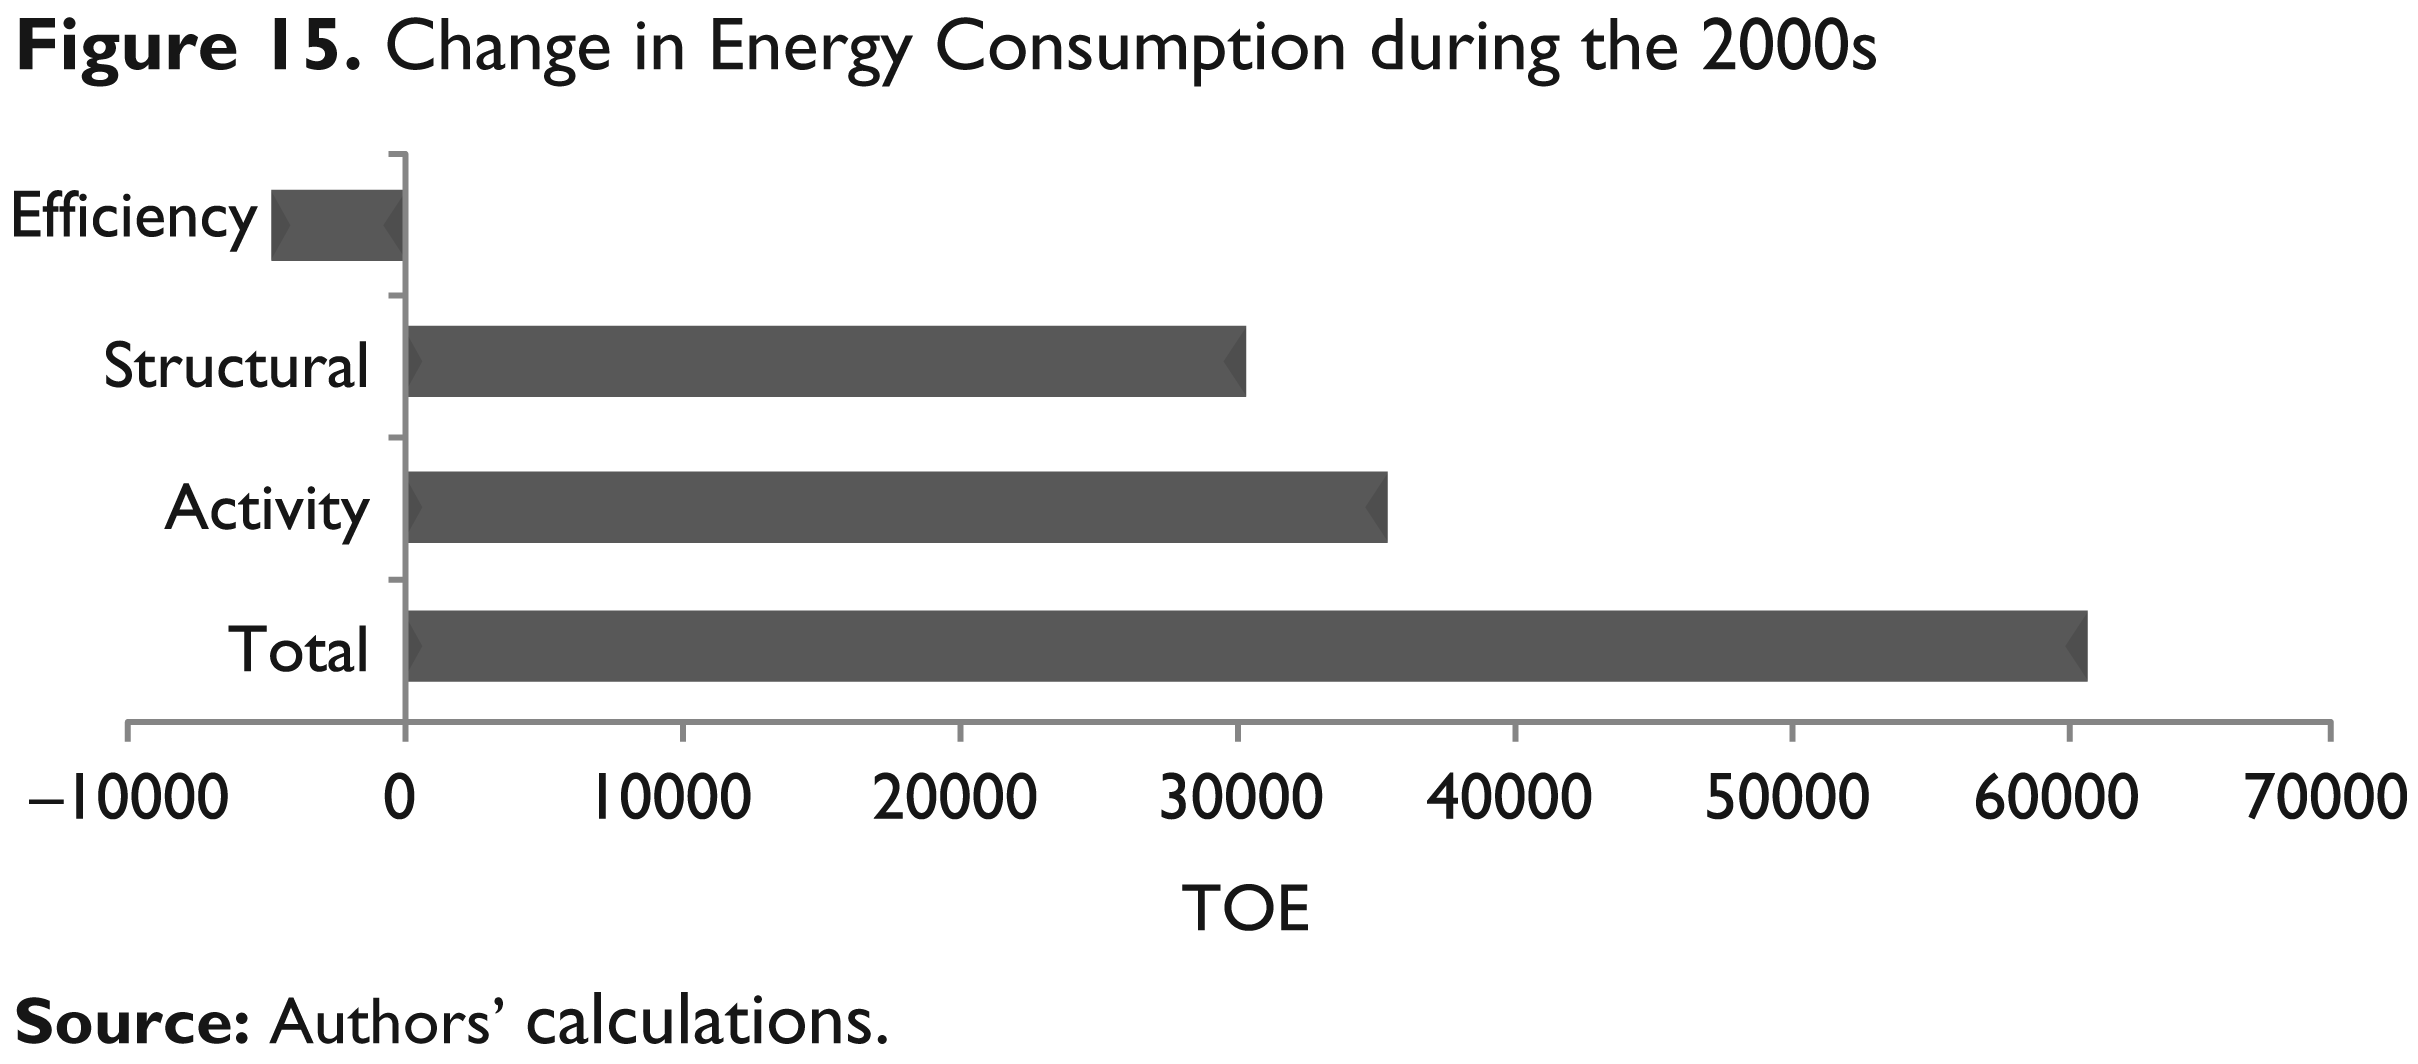
It is clear from the above discussion that aggregate production, structural and efficiency effects had a positive impact on energy consumption during the 1970s. During the 1980s, the aggregate production in Pakistan increased the energy consumption. In contrast to 1970s, the intensity effect reduced energy consumption significantly while the structural effect increased the energy consumption. During the 1990s, the aggregate production in agriculture increased energy consumption. However, the efficiency and structural effects both saved electricity consumption. During the 2000s, the total energy consumption in agriculture increased, and disaggregated results indicate that the activity and structural effects both increased the energy consumption, while the efficiency effect saved energy consumption.
Results of Unit Root Tests
Table 2 provides the results of two unit root tests, including Akaike Information Criteria (AIC) and Schwarz Information Criteria (SIC). These tests operate under the null of unit root against the alternative of a stationary series. Both of these tests provide consistent results that all the variables in this study are stationary. In such a setting, the standard practice allows the use of the SVAR framework. The detailed results of SVAR have been provided in the next section.
Result of Unit Root Tests
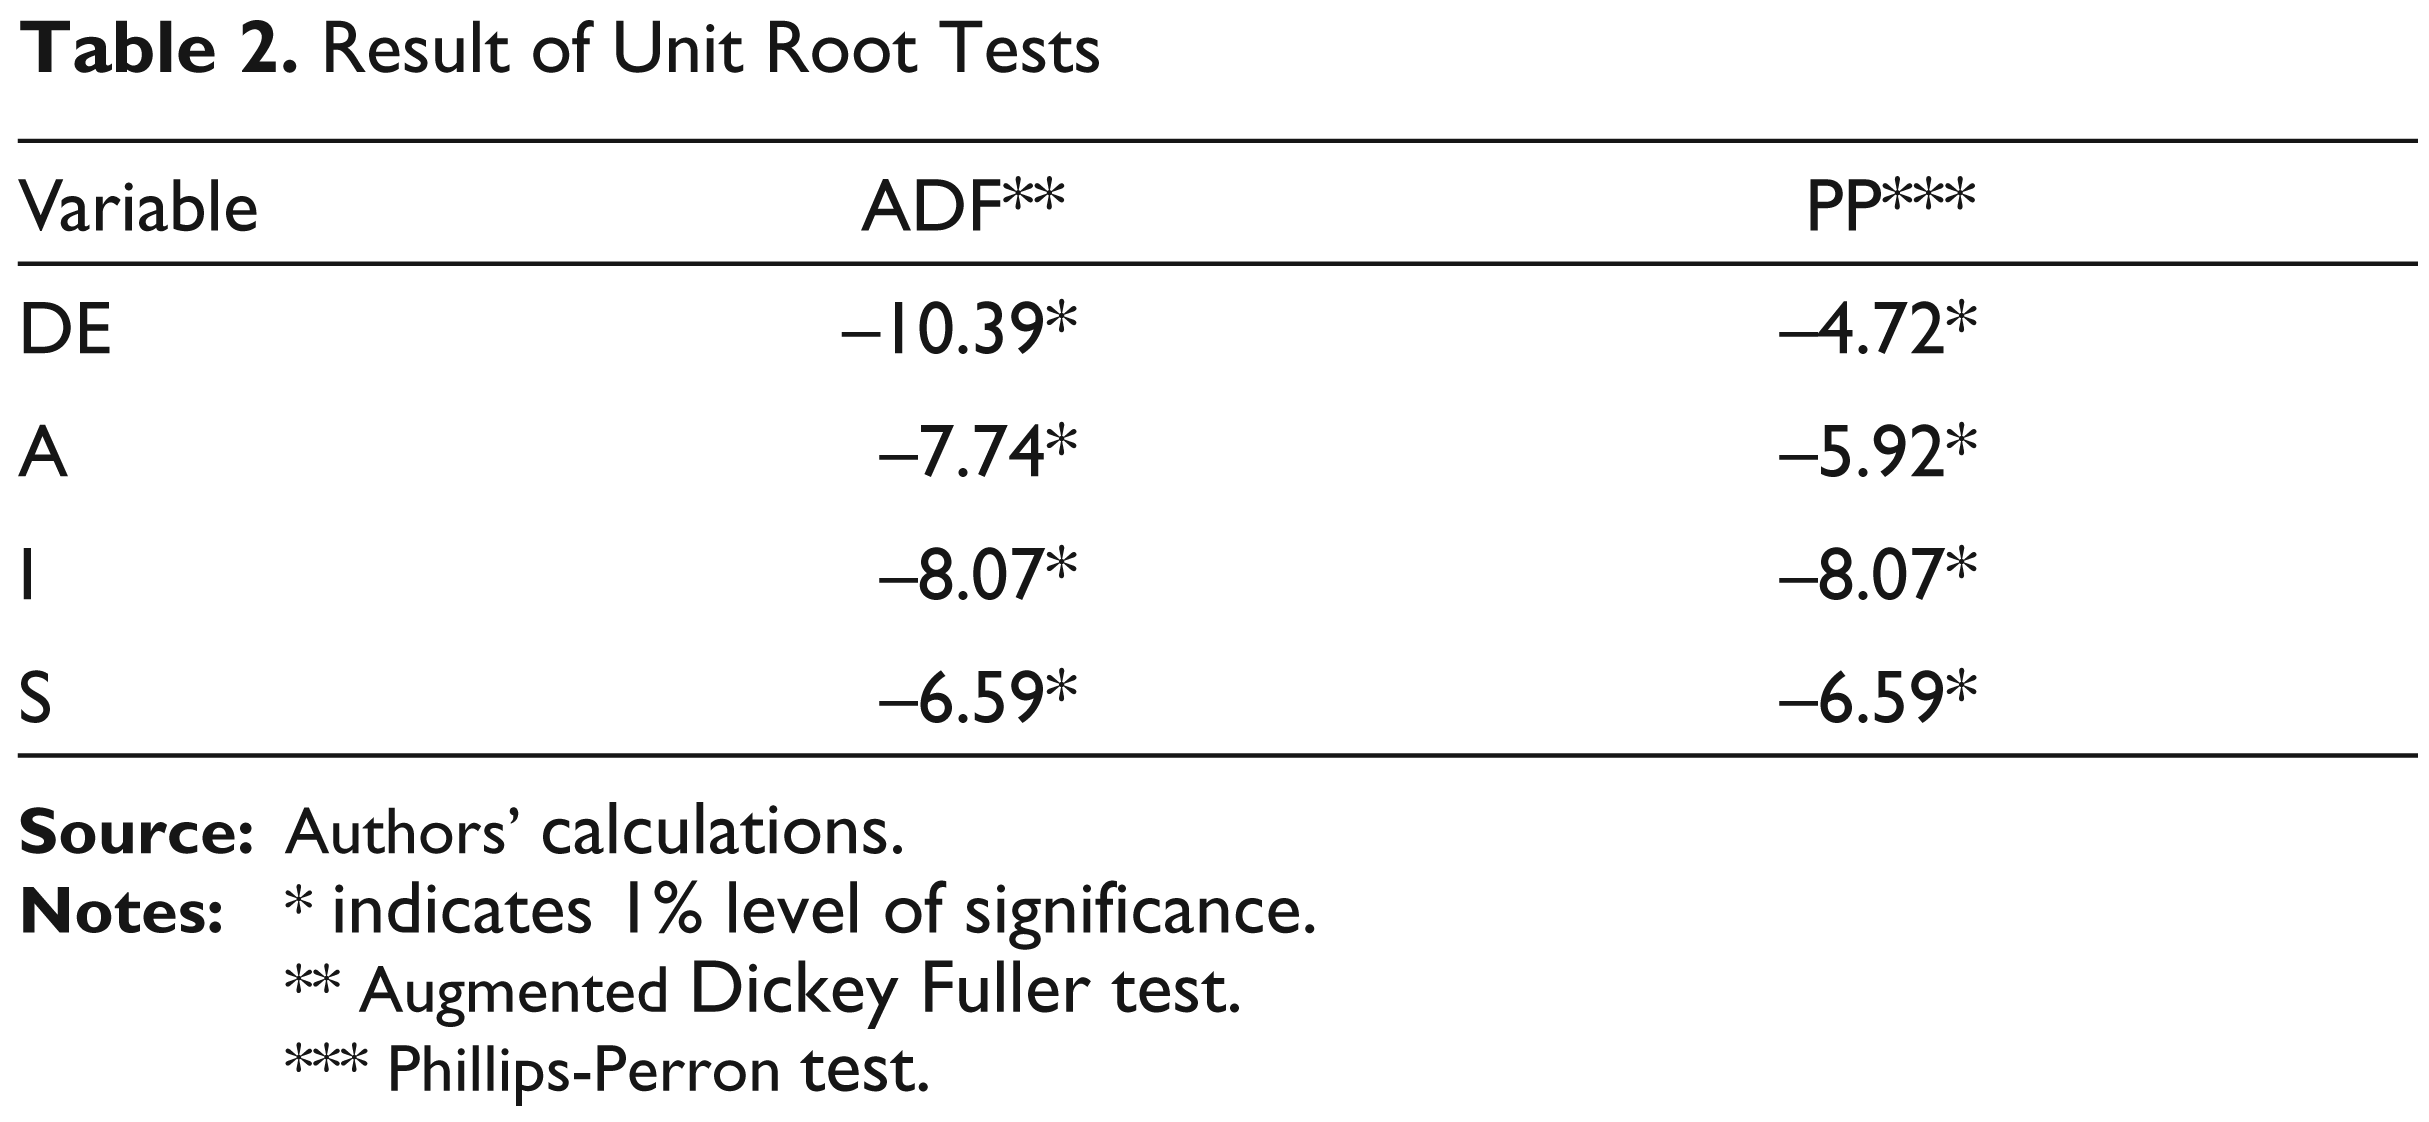
** Augmented Dickey Fuller test.
*** Phillips-Perron test.
Results of Structural Vector Auto-regression (SVAR) Framework
SVAR results indicate that a higher agricultural production has the tendency of reducing the overall energy consumption, by achieving economies of scale; this result is consistent with Jardot et al. (2010).
Higher agricultural production promotes structural changes; the share of agriculture in total value addition increases with reduced energy intensity. Specifically, a minor standard deviation shock to agricultural production initially reduces the change in energy consumption significantly. However, the energy intensity in agriculture declines along with visible positive structural changes. In subsequent years, all the three variables start converging towards their mean values (see Figure 16).
The rising energy intensity has a detrimental impact on the macroeconomic variables. Higher energy intensity means that the same level of output now needs more energy inputs, and hence the cost of production increases. This result has important implications for Pakistan, as the country is heavily dependent on imported sources of energy. Results show that higher energy intensity not only increases energy consumption, but also discourages agricultural production and structural changes. This shows that structural changes are very much dependent on the change in value addition.
Figure 17 portrays the impulse responses for change in energy consumption, agricultural production and structural changes. Results show that higher energy intensity increases energy consumption, while agricultural production and structural changes both experience a negative impact by this intensity shock. Rising energy intensity in agriculture discourages the rise of productivity; hence, people are less motivated towards agricultural production. In subsequent periods, all the variables start converging to their mean values, showing that the system is stable over the time.
Figure 18 provides the impulse responses of energy consumption, energy intensity and agricultural production to a single unit shock to structural changes. It shows that a higher growth rate in the agricultural sector has a positive impact on energy consumption, energy intensity and agricultural production. This implies that although structural changes support agricultural production, they also increase energy intensity in the short run.
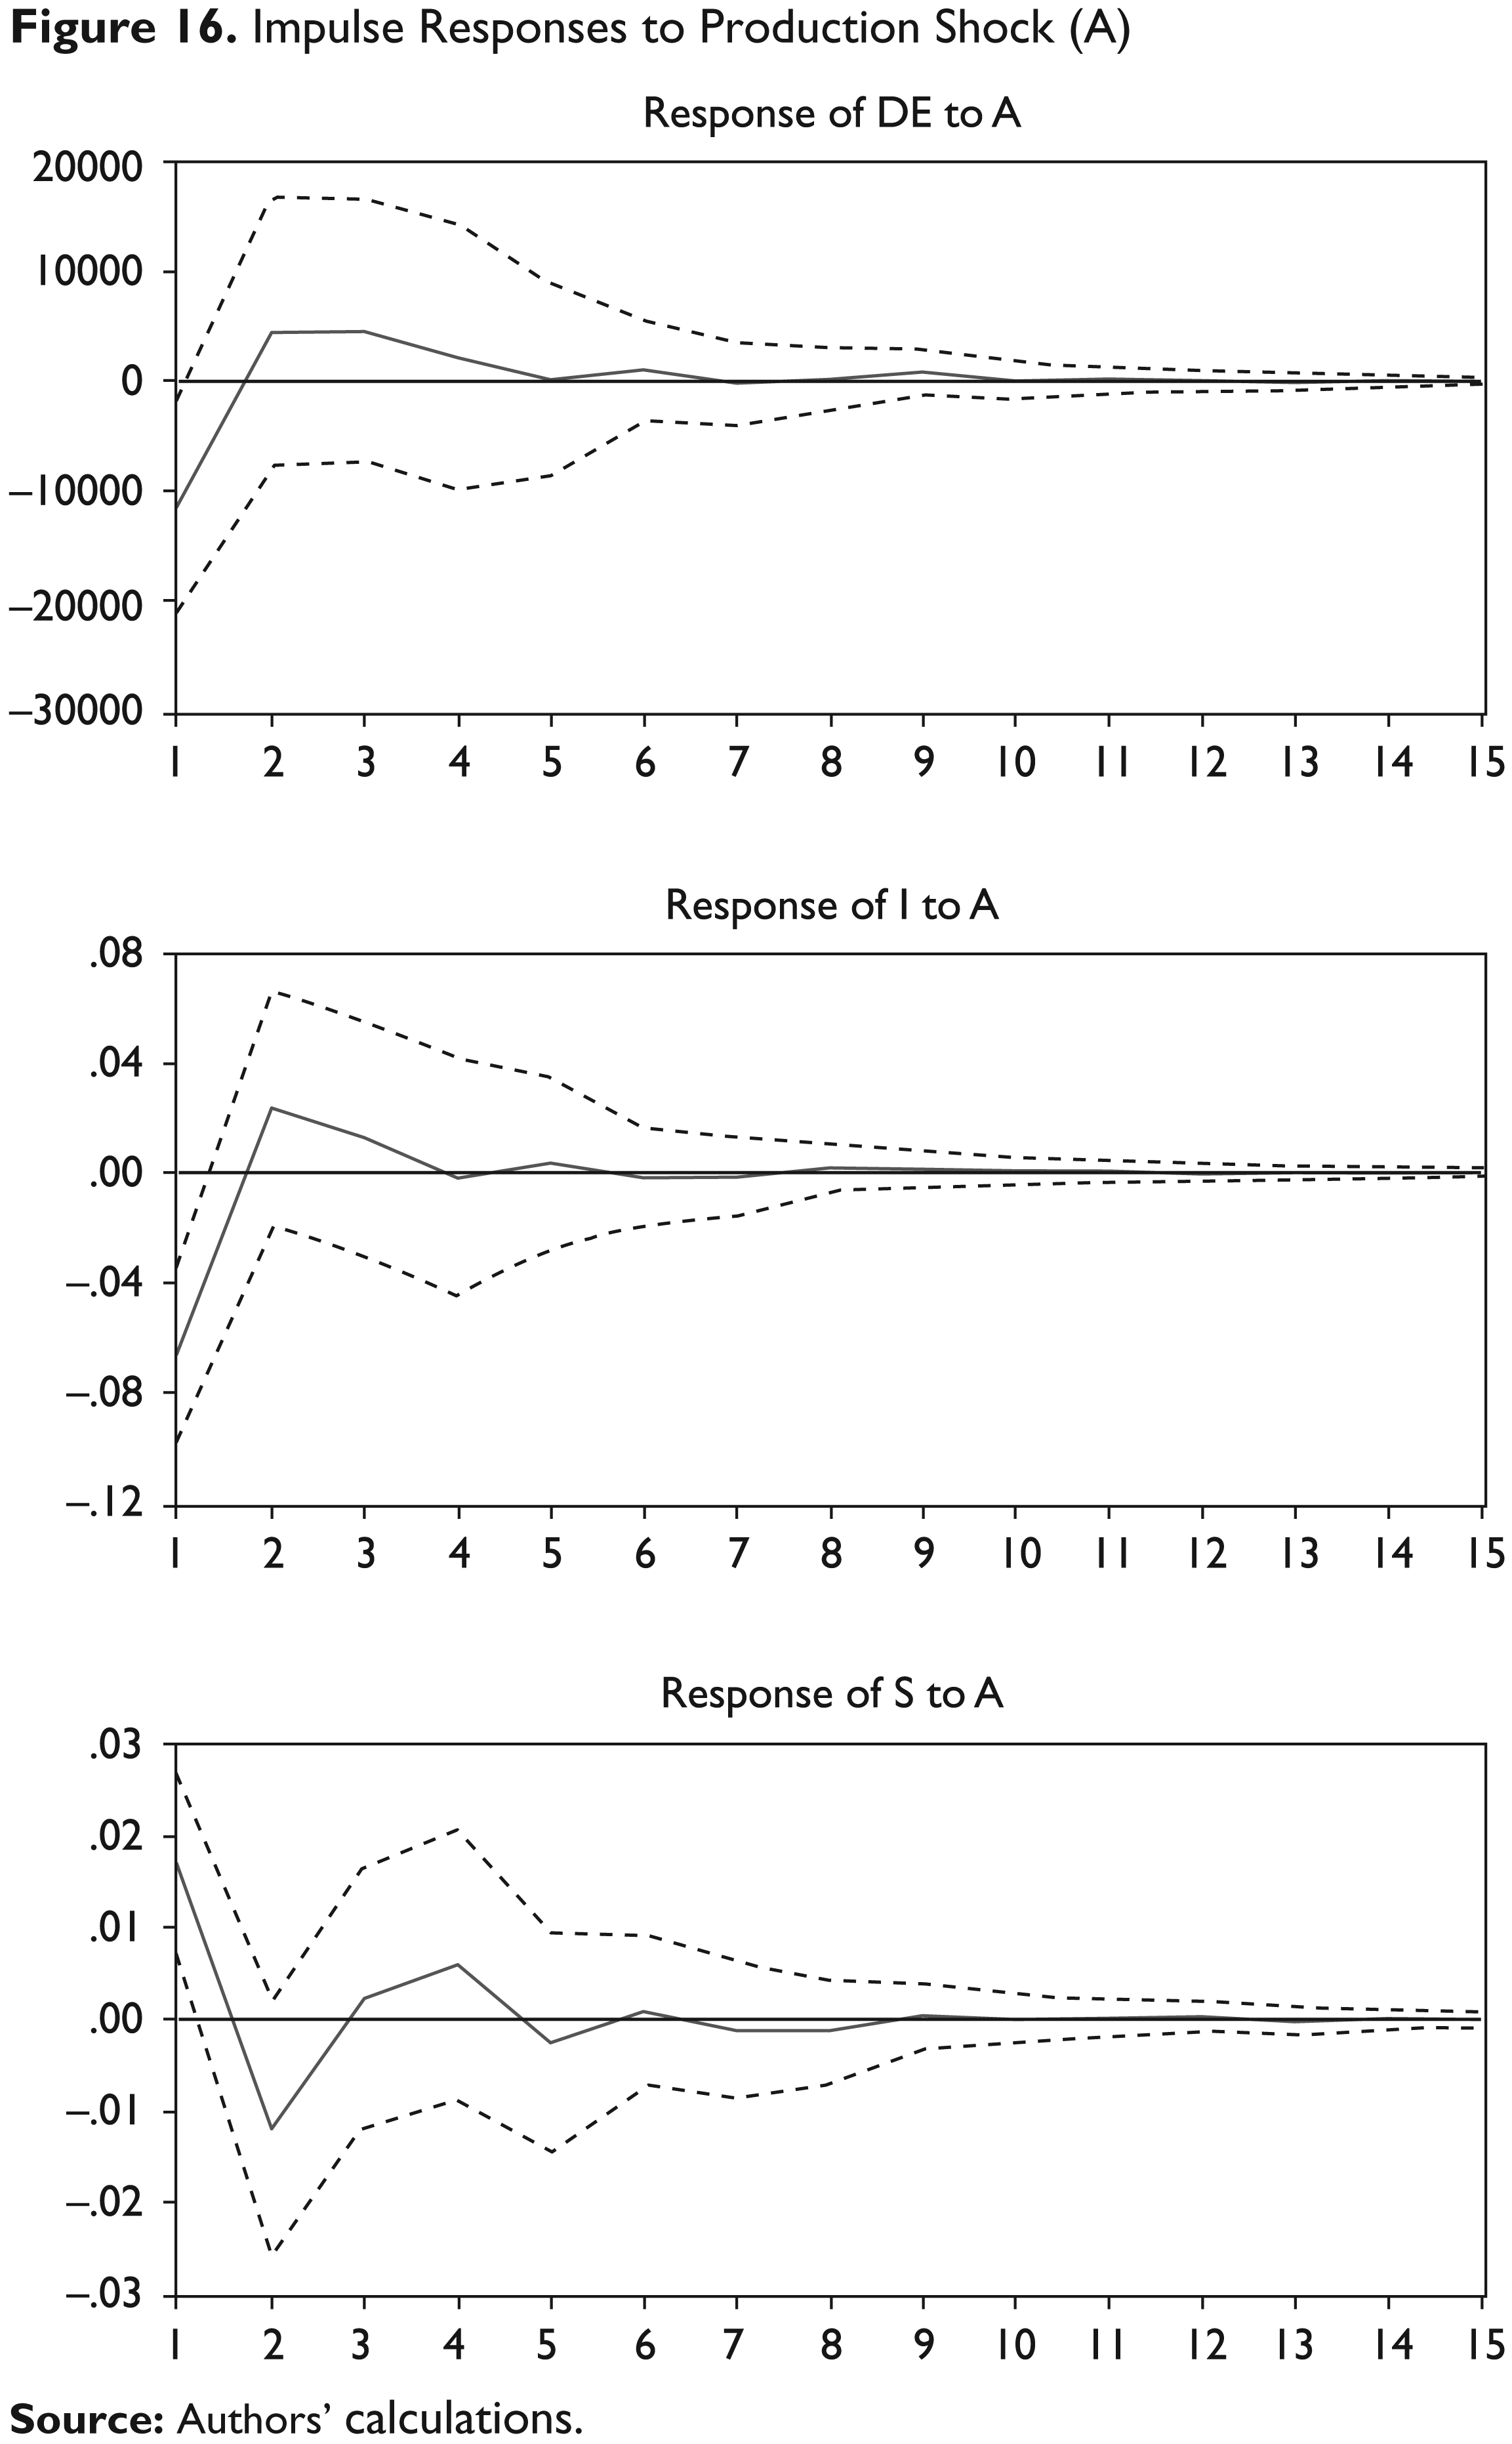
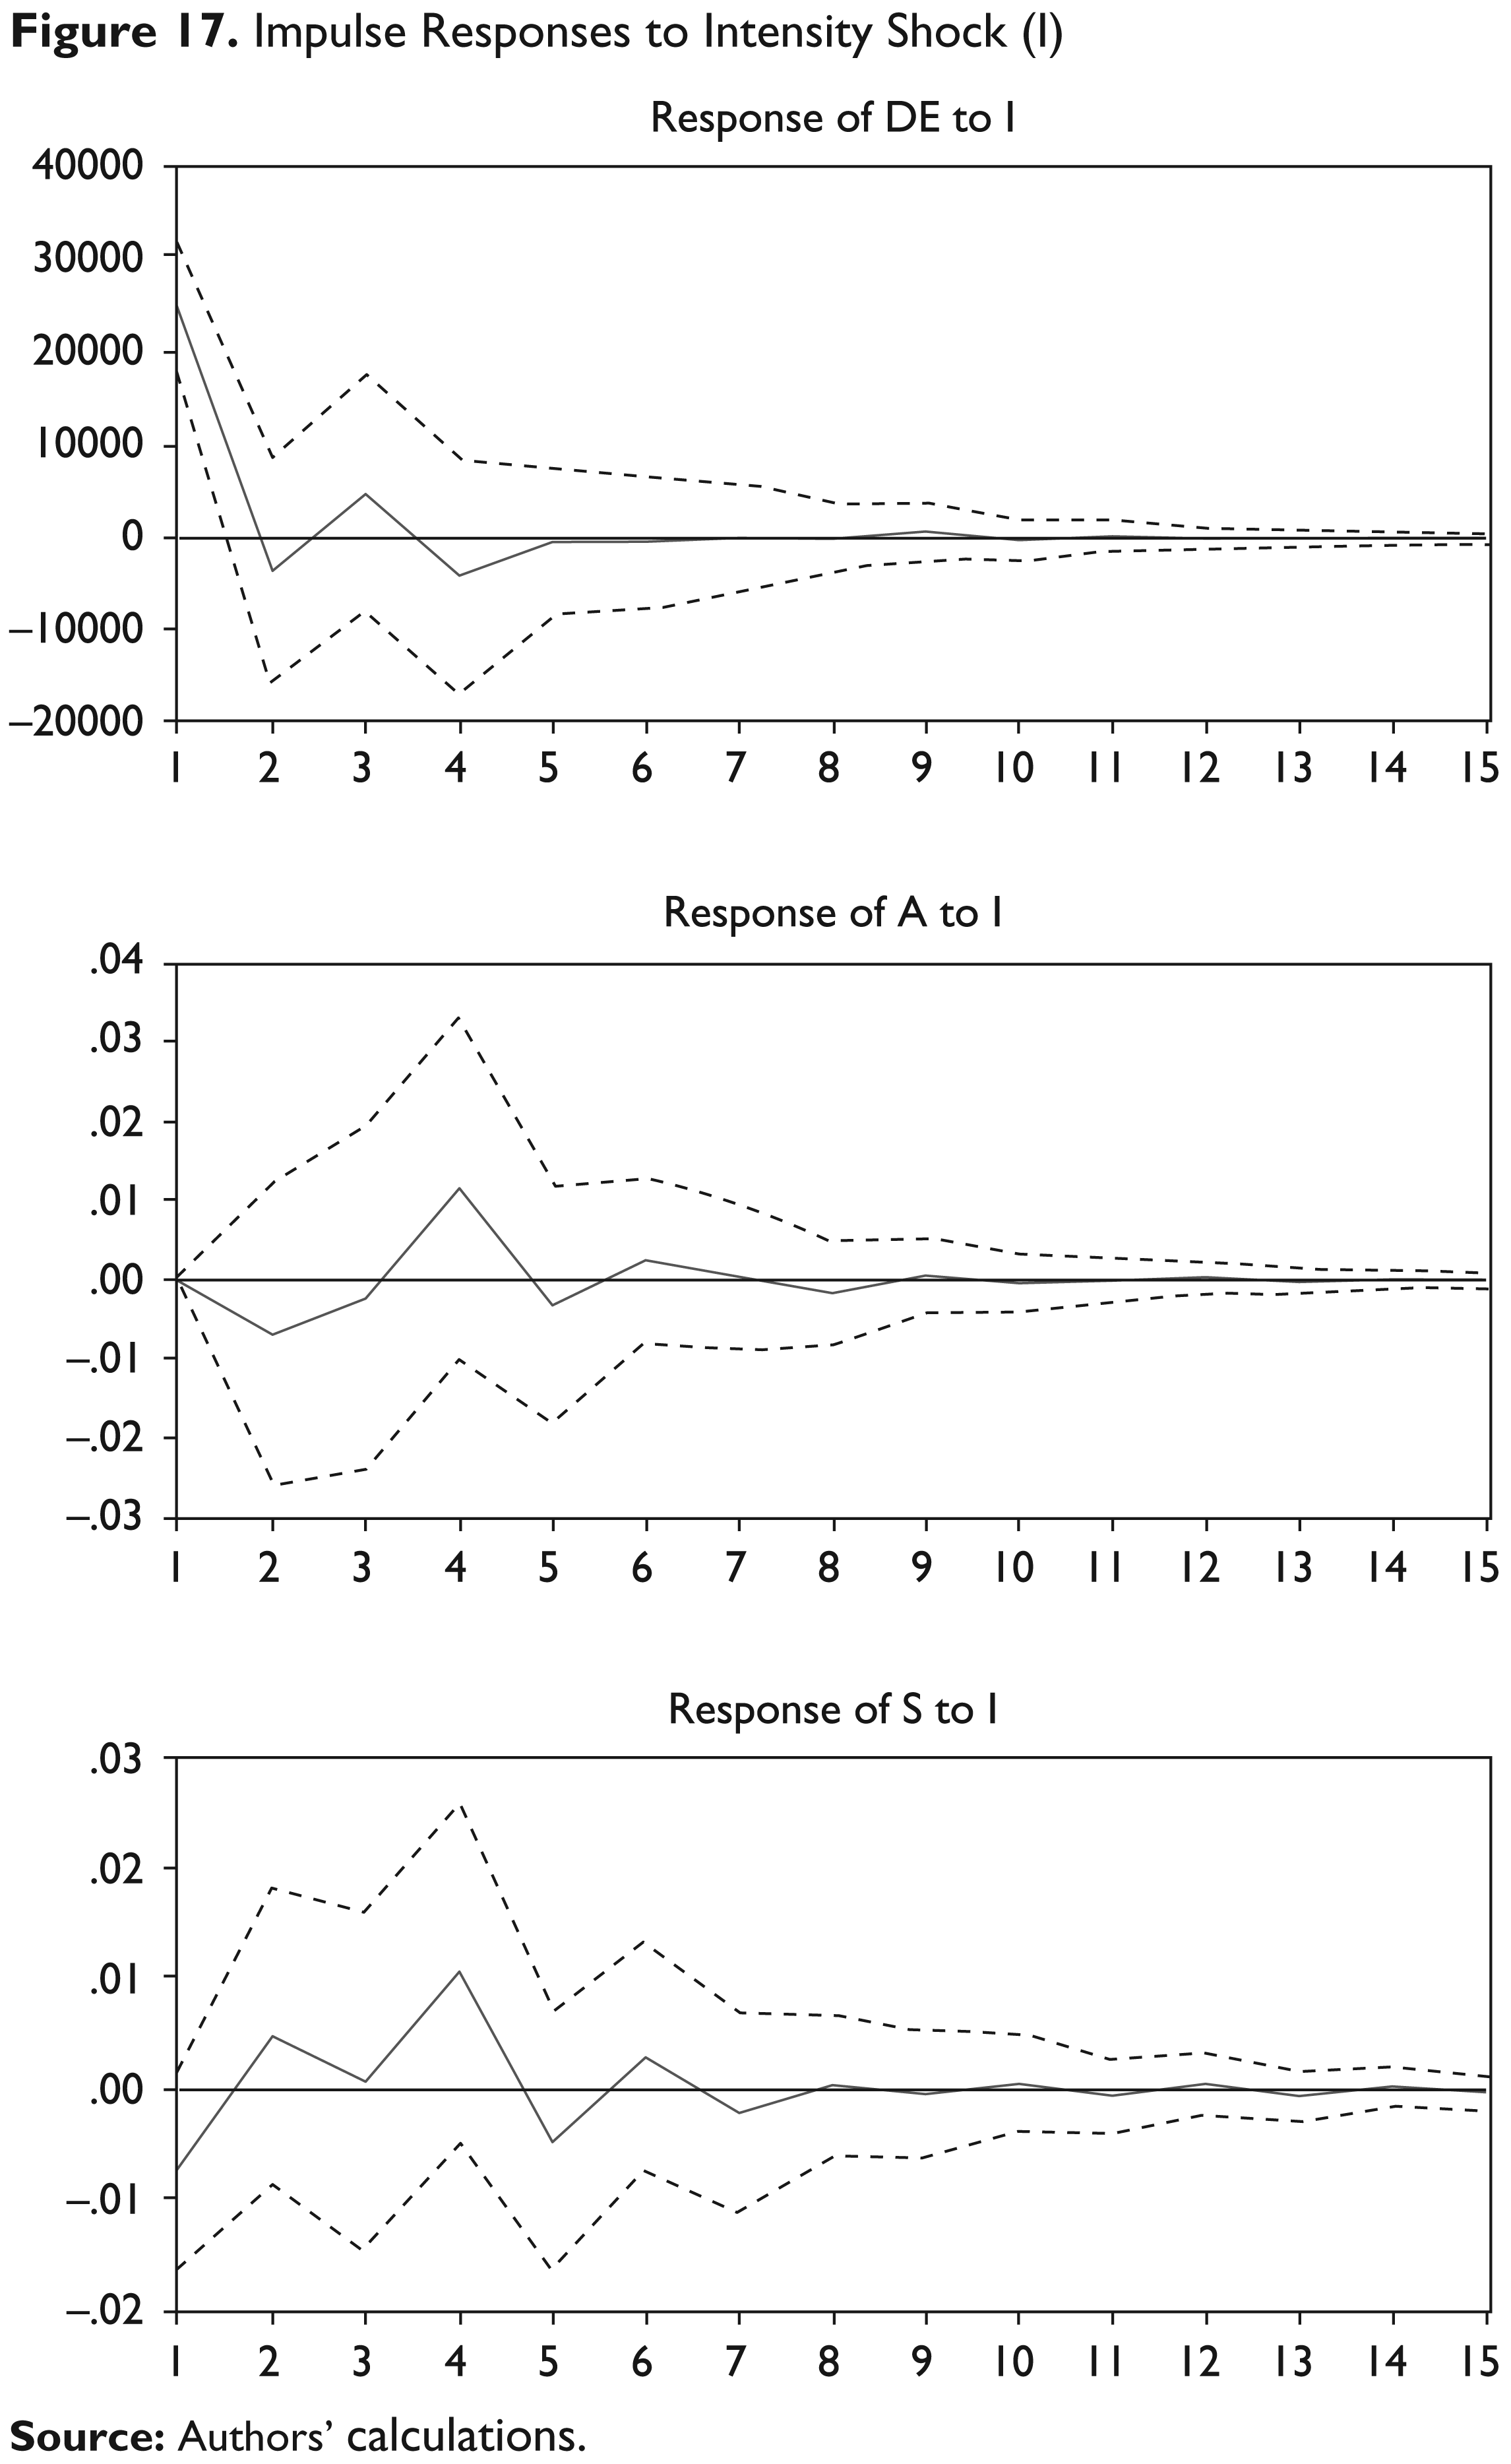

Table 3 shows a variance decomposition analysis of energy consumption. There is little evidence of variation caused by other variables, such as, agricultural production, intensity effect and structural effect. Specifically, after a period of one year, agriculture production, energy intensity and structural changes cause a 0.72 per cent, 0.0 per cent and 3.12 per cent variation in energy consumption, respectively. After a period of five years, this variation becomes 4.6 per cent, 2.9 per cent and 4.5 per cent. Finally, this pattern of variation remains the same up to the 10th year.
Variance Decomposition of Change in Energy Consumption
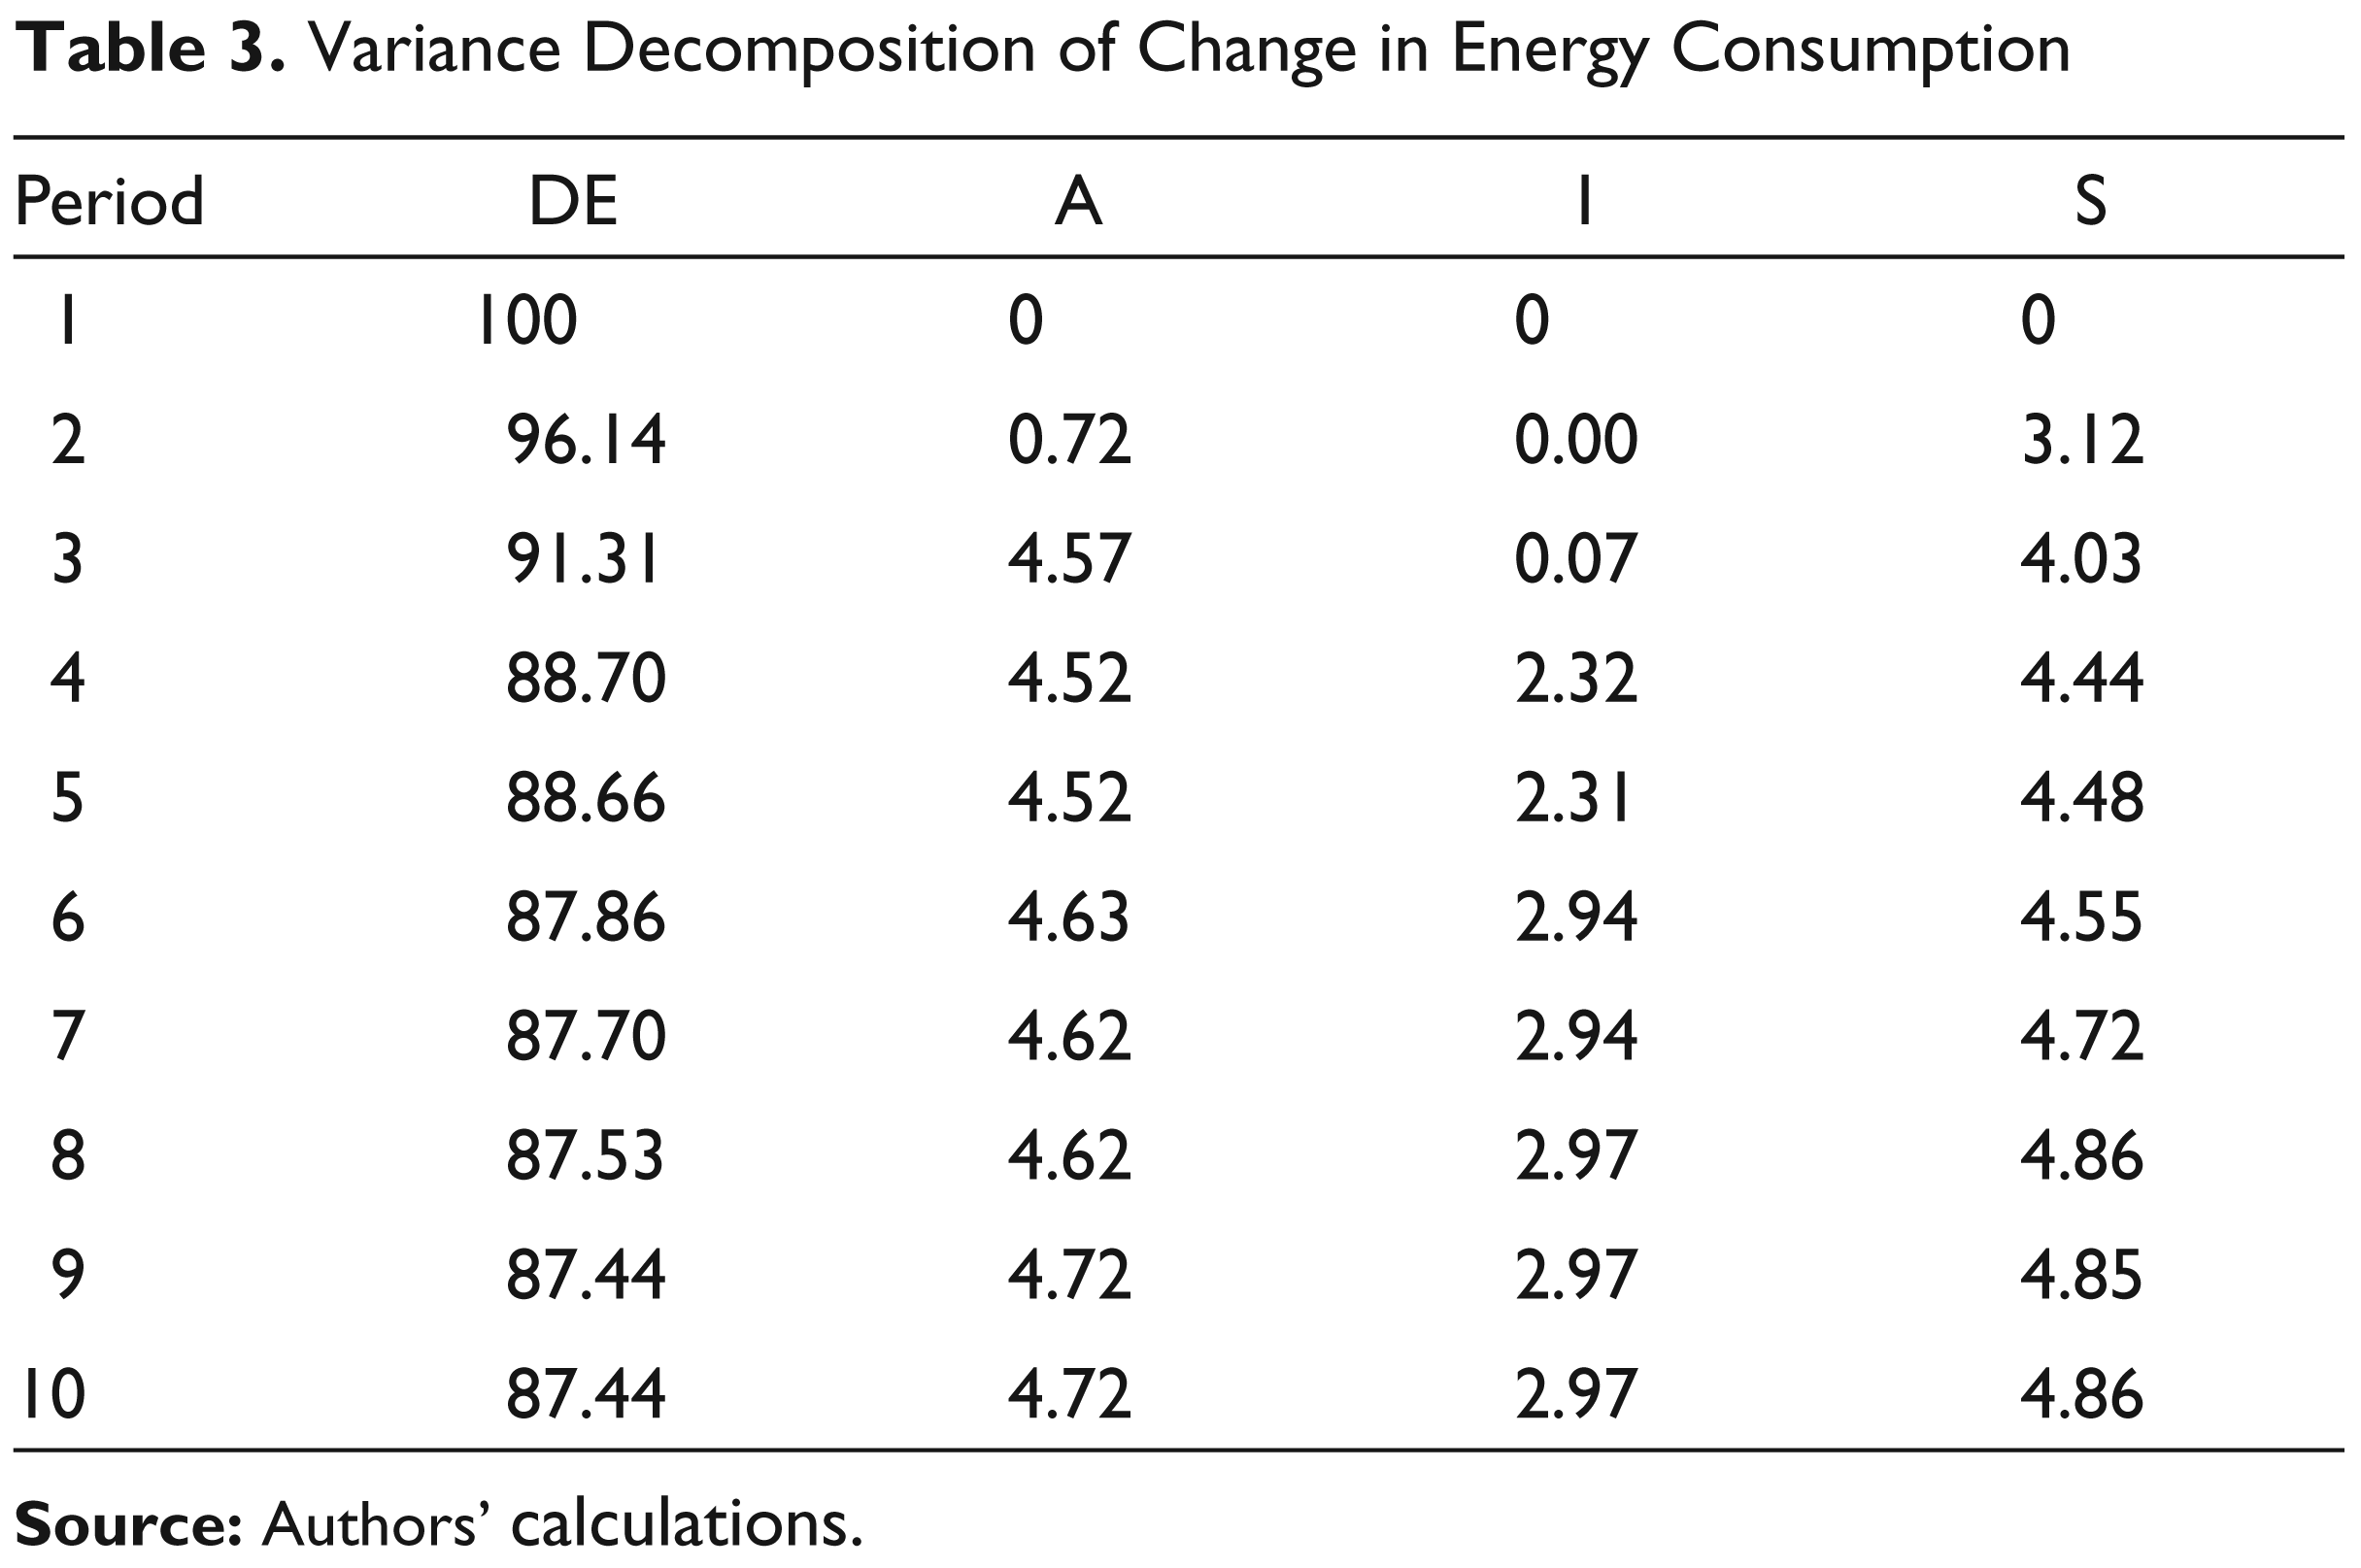
Table 4 elaborates short-run Granger causality in the model, which portrays a bi-directional causal relationship between energy consumption and structural effect. It means that energy consumption and a rising share of agriculture in total value addition are dependent on each other. Structural change is an important determinant of the changing pattern of energy consumption in the short run, and vice versa. The one-way causal relationship between energy consumption and intensity effect, running from the former to the latter, reveals that the energy consumption Granger causes the energy intensity to vary in the short run.
Our results also identify a one-way causal relationship between structural and intensity effects, indicating that structural changes influence energy intensity. These tests are unable to explore any causal relation between the productivity and intensity effects and between structural and activity effects; these results are consistent with Mushtaq et al. (2008).
Results of Short-run Granger Causality

Conclusion and Policy Implications
Historically, the agricultural sector has been dependent heavily on electricity consumption. With time, the share of electricity consumption in the energy mix has been increasing, reaching 95 per cent in 2011. Meanwhile, Pakistan has been facing acute problems in its electricity sector, experiencing a 25 per cent reduction in electricity generation in 2012. This reduction adversely affected agricultural productivity and increased the incidence of poverty. The following results highlight that structural changes taking place from a diversified energy mix can save a lot of energy through its efficient consumption.
During 1990s, a higher aggregate production in agriculture increased the consumption of energy. However, the efficiency and structural effects both saved a significant amount of energy. During the 2000s, the total energy consumption in agriculture increased; disaggregated results indicate that activity and structural effects both increased the energy consumption, while the efficiency effect saved energy. However, it would be important to know the channels through which energy efficiency, agricultural output and structural changes are linked with each other.
Increasing agricultural productivity and reducing the energy intensity both can ensure stable energy supply. The results of this study show that a rise in agricultural production can reduce the change in energy consumption in the short run, indicating a stable energy consumption scenario. Higher agricultural production promotes structural changes that reduce the energy intensity. On the other hand, rising energy intensity has a detrimental impact on macroeconomic variables. Higher energy intensity means that the same level of output now needs more energy inputs; hence, the cost of production increases. These facts indicate that the government should focus on agricultural productivity, as it ensures positive structural changes towards energy efficiency.
Higher energy intensity not only increases energy consumption in agriculture but also discourages agricultural production and structural changes. The former element increases the import bill of the country, as the government pays around USD 1 billion for imported oil to produce 1,000 MW electricity. The latter elements can distort growth in agriculture, which may increase the incidence of poverty in the country, given that half the population in the country depends on agriculture. Pervez and Rizvi (2013) found that, in Pakistan, a 1 per cent decrease in agricultural growth can increase the incidence of poverty by 9.1 per cent.
The government claims to protect the poor by initiating various poverty alleviation schemes; in 2009–12, the government provided PKR 44.8 million to the agricultural sector and other food support programmes. This amount is quite small compared to the untargeted subsidies of PKR 351 billion, which the government provided to the power sector during the year 2013. However, the Planning Commission of Pakistan states that only 0.3 per cent of total power sector subsidies goes to the lifeline consumers (consuming electricity around 100 units a month), while the rich get most of the benefit of these subsidies. These untargeted subsidies, along with various cross-subsidies, should be revised with targeted subsidies being directed only to the poorest of the poor. Based on its findings, the present study advocates the following policy recommendations:
A more diversified fuel mix in the agricultural sector can reduce the energy intensity. Raising agricultural productivity can ensure efficient energy consumption through economies of scale. The literature highlights that mechanizing the agricultural sector can increase its productivity. Hence, the government should facilitate agricultural mechanization through loans and other credit financing schemes. The withdrawal of untargeted and cross-subsidies in the power sector would provide the adequate financial resources for this agricultural mechanization, while the targeted subsidies can really provide relief to the poorest of the poor. Value addition in the agricultural sector has a great impact on poverty reduction; higher agricultural production through mechanization would reduce the incidence of poverty in the country.