
Abstract
Objectives
Illness trends are typically monitored by reportable disease and syndromic surveillance systems, but unanticipated health issues might not be captured. Using diagnosis codes, the New York City Health Department developed a novel data mining process to detect unusual increases in emergency department (ED) visits for any reason.
Methods
We applied the tree-temporal scan statistic in TreeScan software to ICD-10-CM diagnosis codes for ED visits. We searched for unusual citywide increases in ED visits or hospital admissions, over any recent time period, and at any part of and level on the ICD-10-CM tree. We conducted proof-of-concept analyses for March 2020 when COVID-19 emerged, then investigated signals detected in daily, automated analyses during April–August 2025.
Results
If TreeScan analyses had been in place, then increasing hospital admissions for viral pneumonia (J12) would have triggered a signal on March 13, 2020, two days before widespread COVID-19 community transmission was announced. An extreme heat event in June 2025 triggered a signal for admissions for acute kidney failure (N17), prompting outreach to dialysis networks. A sustained signal for hand, foot, and mouth disease (B08.4) prompted outreach to child care programs. Other signals supported situational awareness, including a seasonal increase for swimmer’s ear (H60.33) and burns (T30.0) related to consumer fireworks.
Conclusions
TreeScan quickly detected credible increases in various diagnoses without pre-specification, from minor to severe, rare to common, acute to sustained, and foreseen to unforeseen. TreeScan can strengthen surveillance for health issues related to new pathogens, non-notifiable conditions, environmental exposures, and mass gatherings.
Quickly detecting, investigating, and responding to health emergencies prevents additional illnesses. Health authorities continually monitor reportable diseases and predefined syndromes, so increases in these conditions should be quickly detected. To detect increases in other conditions, it is important to also search for unusual patterns in illness data without pre-specifying conditions of concern. The tree-temporal scan statistic is a data mining tool applied to ICD-10-CM diagnosis codes to monitor vaccines and pharmaceutical drugs for unexpected safety issues. ICD-10-CM codes are routinely available in emergency department data collected by health departments. We demonstrate how to use the tree-temporal scan statistic to search for statistically unusual increases in ICD-10-CM codes in emergency department visits. Health departments can adopt this approach to improve preparedness for any health emergency, whether caused by a new or existing pathogen; environmental hazards like extreme heat, wildfire smoke, or flooding; or incidents at sporting events or other large gatherings.Significance for public health
To detect and monitor outbreaks and other conditions of public health importance, the New York City (NYC) Health Department receives near-real time data on reportable diseases and emergency department (ED) visits. 1 To conduct syndromic surveillance, syndromes like influenza-like illness or heat-related illness are defined using ED diagnoses and chief complaint terms. While useful for public health response and decision-making, 2 reportable disease and syndromic surveillance systems are limited because they only detect the issues that they are prespecified to detect. First, if a new health issue arises that is not a reportable disease or predefined syndrome, then any chance for a public health response might be delayed. Illnesses due to novel pathogens might not be captured, as before SARS-CoV-2 testing became accessible 3 and new diagnostic codes were introduced and incorporated into a COVID-19–like illness syndrome. 4 Syndromes might need updating as clinical knowledge improves, such as removing a fever requirement from a COVID-19–like illness syndrome definition. 5 Second, in prioritizing specificity over sensitivity, definitions might be narrow. For instance, a heat-related illness syndrome relies on clinicians to code visits as directly heat-related, such as for heat exhaustion or sun stroke, 6 and omits indirect effects, such as dehydration or exacerbation of kidney disease. 7 Third, classifying some ED visits into syndromes and ignoring all other visits discards potentially informative data, limiting visibility into real-time population trends. In contrast, the goal of asyndromic surveillance is to search for any unusual increases in illness data, without prespecifying diseases or syndromes of concern.8,9
We aimed to detect increases in health issues that might not be captured by reportable disease or syndromic surveillance. We were motivated to develop, test, and deploy a new data mining process for asyndromic surveillance because previously introduced methods have substantial limitations. The first such method implemented by the NYC Health Department, in 2013, detected relative increases in chief complaint keywords.2,10 Such word alerts tend to preferentially detect obscure terms and can fail to group related visits with different keywords due to typos, abbreviations, and synonyms.9–11 Although improvements using natural language processing, generative topic modeling, and machine learning have been proposed,12–14 their complexity and opacity can impede adoption by public health authorities. Another approach entails assessing weekly trends in International Classification of Diseases, Tenth Revision, Clinical Modification (ICD-10-CM) diagnosis codes.15,16 Treating every ICD-10-CM code separately fails to leverage their clinically meaningful, nested structure. Additionally, using fixed time windows fails to account for different types of health issues emerging abruptly or gradually over different time frames.
We developed a process (Figure 1) for asyndromic surveillance using the tree-temporal scan statistic.17,18 This method simultaneously monitors thousands of ICD-10-CM codes and related code groupings, over varying time frames, while adjusting for the multiplicity of codes and time frames evaluated. A similar approach is used in pharmacovigilance to detect diagnoses indicating possible adverse events, with the distinction of scanning over person-time since vaccine or drug administration19,20 rather than scanning over calendar time. We report results of daily, prospective analyses of NYC ED data, first as mimicked for proof-of-concept for March 2020 when COVID-19 emerged, and then as applied in real-time during April–August 2025. Analytical pipeline for asyndromic surveillance of emergency department diagnoses with the tree-temporal scan statistic at the New York City Health Department.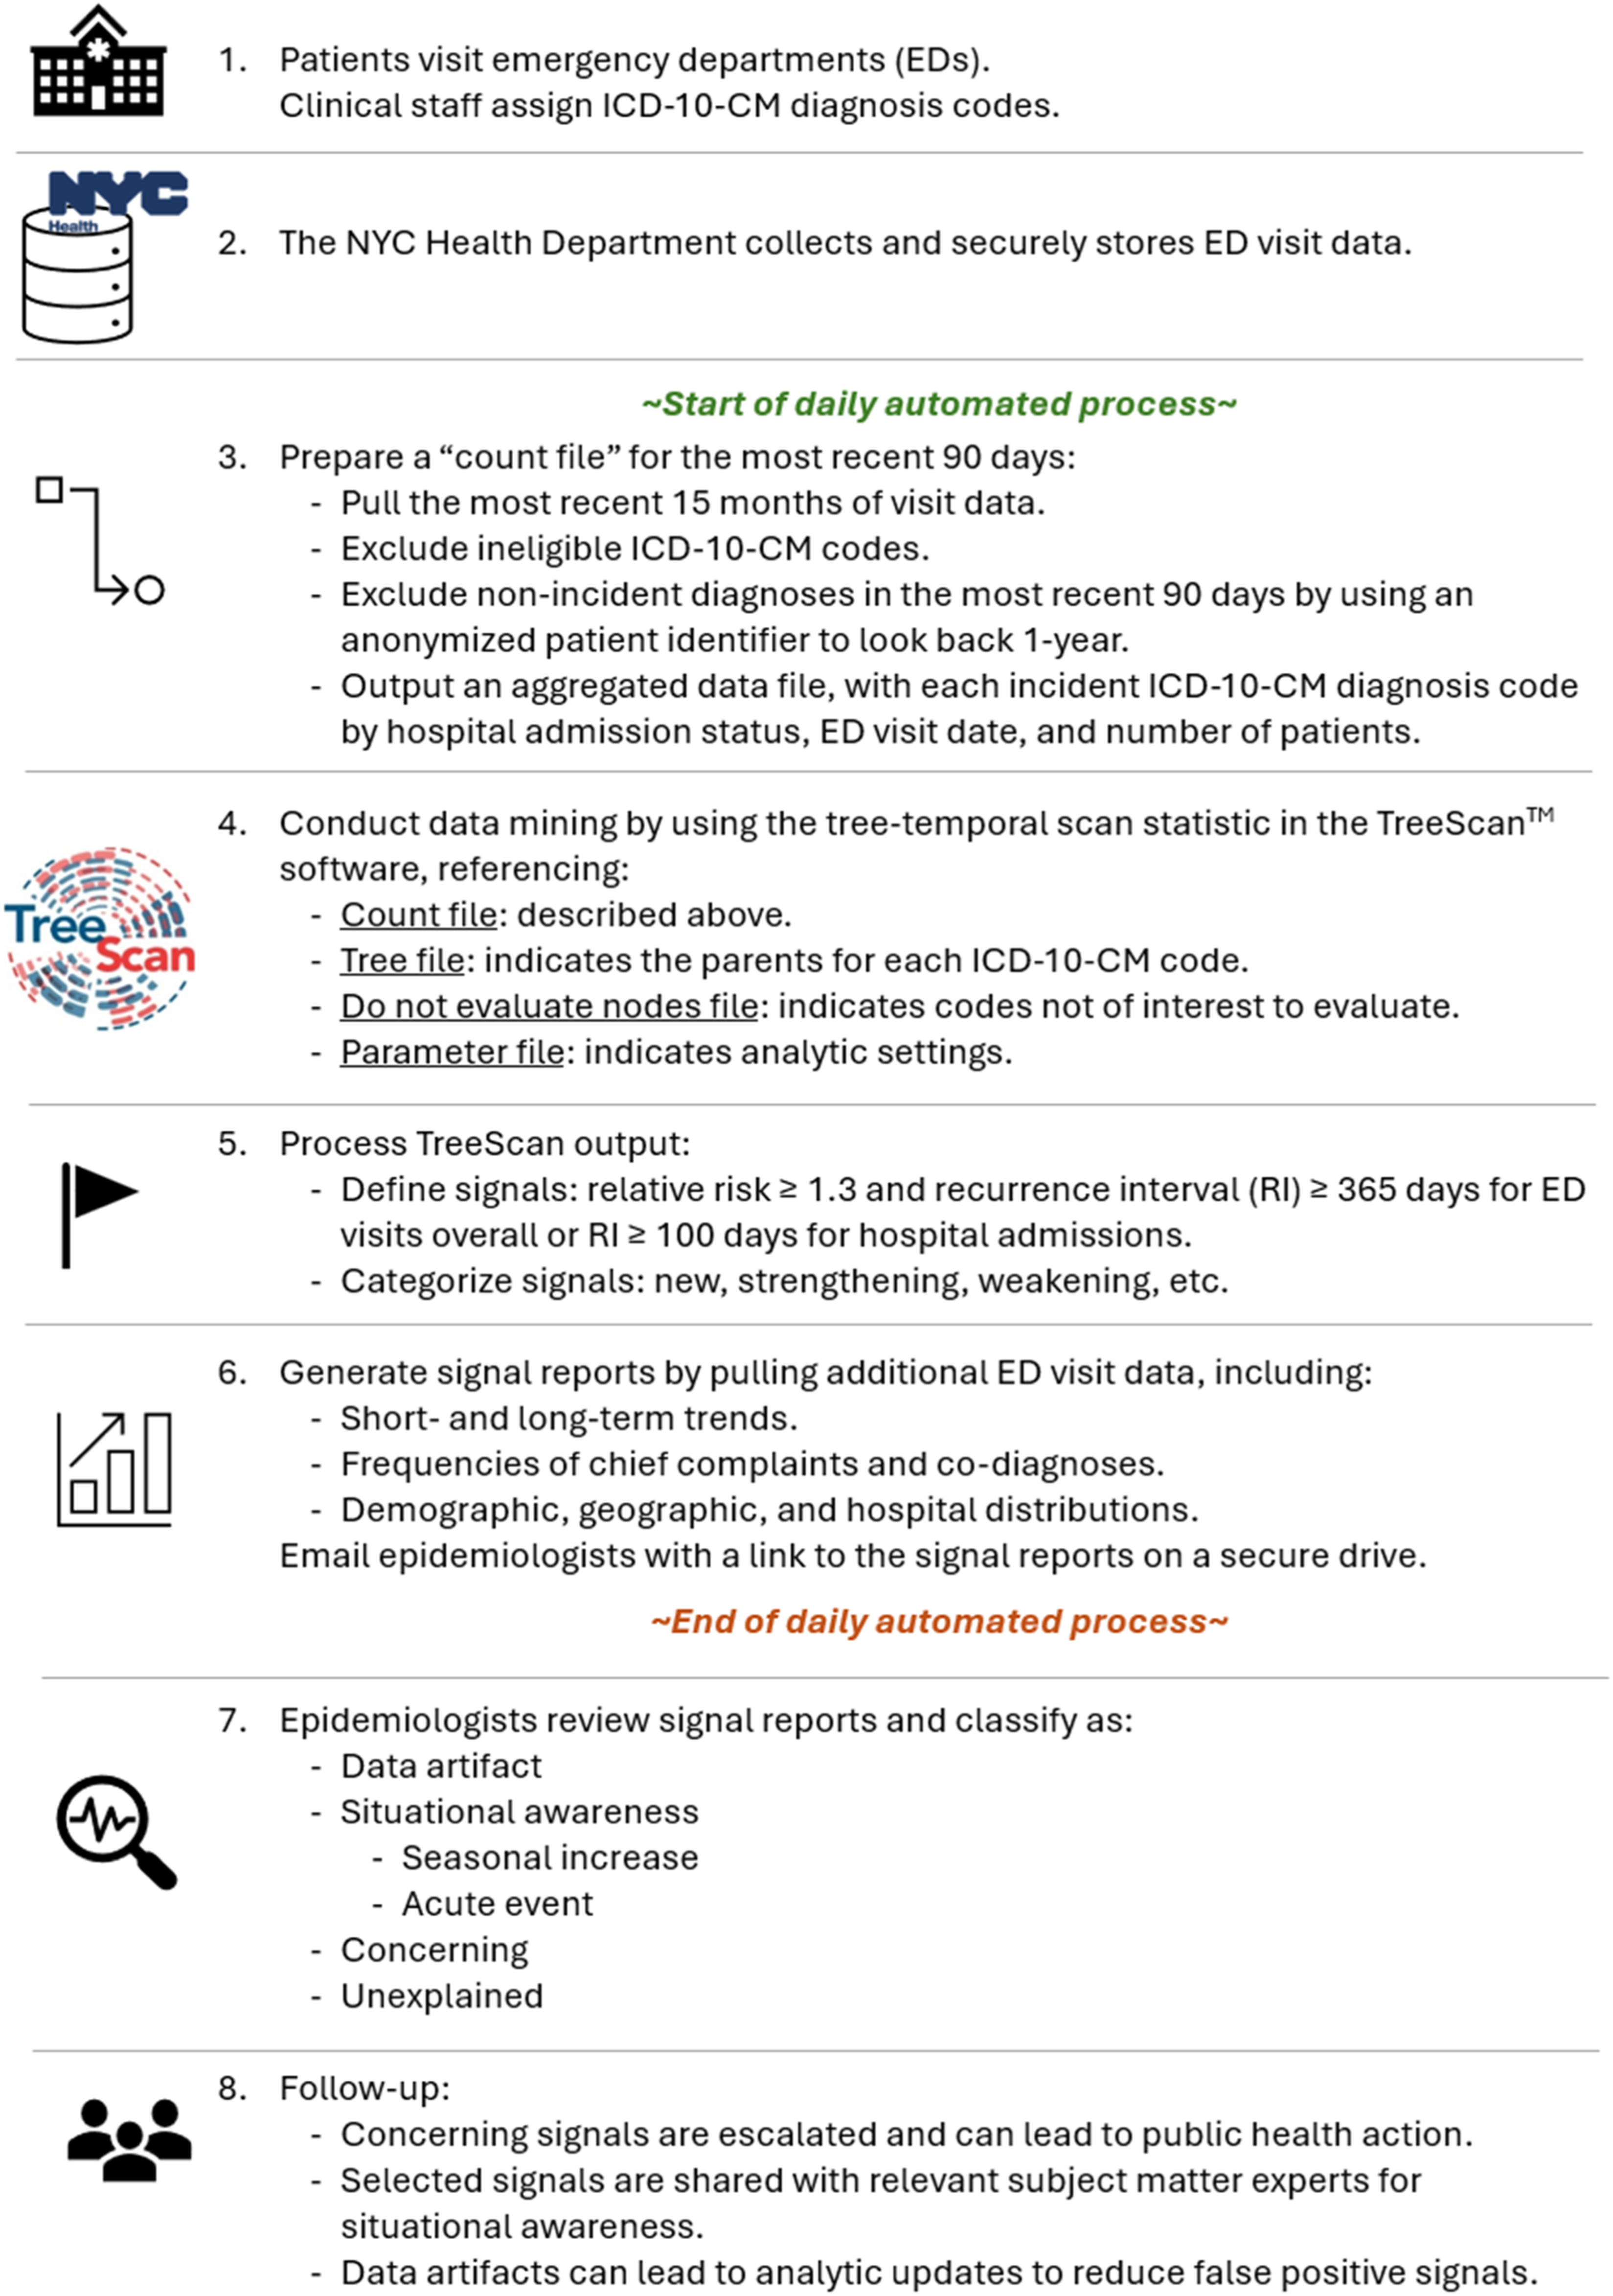
Methods
Emergency department data
The NYC Health Code authorizes the Health Department to collect ED visit data from NYC hospitals. 1 These data include an anonymized patient identifier, demographic characteristics, visit date, disposition, and ICD-10-CM diagnosis codes.1,21 From the latter field, we excluded any ED-provided codes other than ICD-10-CM codes, such as SNOMED and CPT codes, and standardized by removing extra spaces and decimal points. We determined all diagnoses per patient per visit that were eligible (acute health issues of interest), incident (first diagnosis per ICD-10-CM tree subchapter within a 1-year period), and unique (one diagnosis per subchapter per day) (eMethods 1 in the Supplement).
A daily input file for the past 90 days consisted of three columns: (1) a hyphen-delimited concatenation of hospital inpatient admission status (1 = admitted; 0 = not admitted) and ICD-10-CM code, (2) visit date, and (3) the citywide count of patients with that admission status and ICD-10-CM diagnosis on that date. We followed reporting guidelines for studies using observational routinely-collected health data. 22
Tree file
A tree file consisted of every eligible ICD-10-CM code and its parents (eAppendix 1 in the Supplement). ICD-10-CM codes are grouped in a hierarchical tree structure, reflecting general or specific disease conditions affecting different body systems, with related diagnoses on the same tree branch. We downloaded the tree structure provided by the Centers for Medicare & Medicaid Services. 23
We assigned three nodes to every ICD-10-CM code, distinguished by whether the patient was admitted (“1-” prefix) versus not admitted (“0-” prefix), as well as a parent node (“2-” prefix) indicating any ED visit for that diagnosis, regardless of admission status. This allowed us to simultaneously evaluate diagnoses for all ED visits (“2-” prefix) and for admissions only (“1-” prefix), without also evaluating diagnoses for non-admissions only (“0-” prefix).
We added supplemental nodes connecting ICD-10-CM codes on different parts of the tree sharing a common etiology (eAppendix 1 in the Supplement). When infections increase for a particular pathogen, for example, Mycoplasma pneumoniae, some patients might have pneumonia (J12-J18) while others might have acute bronchitis (J20) or another illness manifestation.
24
To improve the signal-to-noise ratio to quickly detect outbreaks, we added pathogen-specific supplemental nodes to scan not only for increases affecting a common body system on the same tree branch, but also for increases in illnesses caused by a common pathogen (Figure 2). Excerpt of an International Classification of Diseases, Tenth Revision, Clinical Modification (ICD-10-CM)-based tree structure for an emergency department diagnosis of J15.7 (pneumonia due to Mycoplasma pneumoniae). In tree level 6, patients are classified as admitted (“1-” prefix) or not admitted (“0-” prefix). Both nodes have 3 parents in level 5. First, both nodes share the parent of ED visits for J15.7 regardless of admission status (“2-” prefix). Second, a parent for 1-J15.7 is 1-J15 (admissions for bacterial pneumonia, not elsewhere classified); correspondingly, a parent for 0-J15.7 is 0-J15. Third, a parent for 1-J15.7 is 1-Mycoplasma pneumoniae (admissions for Mycoplasma pneumoniae); correspondingly, a parent for 0-J15.7 is 0-Mycoplasma pneumoniae. Shaded nodes are not evaluated because either the entire tree level is not evaluated (too general) or the individual node is not evaluated (not of interest). By applying the tree-based scan statistic to this structure, we simultaneously searched for increases in any of the 6 unshaded nodes, i.e., pneumonia due to Mycoplasma pneumoniae; bacterial pneumonia, not elsewhere classified; and Mycoplasma pneumoniae infections affecting any organ system — each in hospital admissions only and ED visits overall.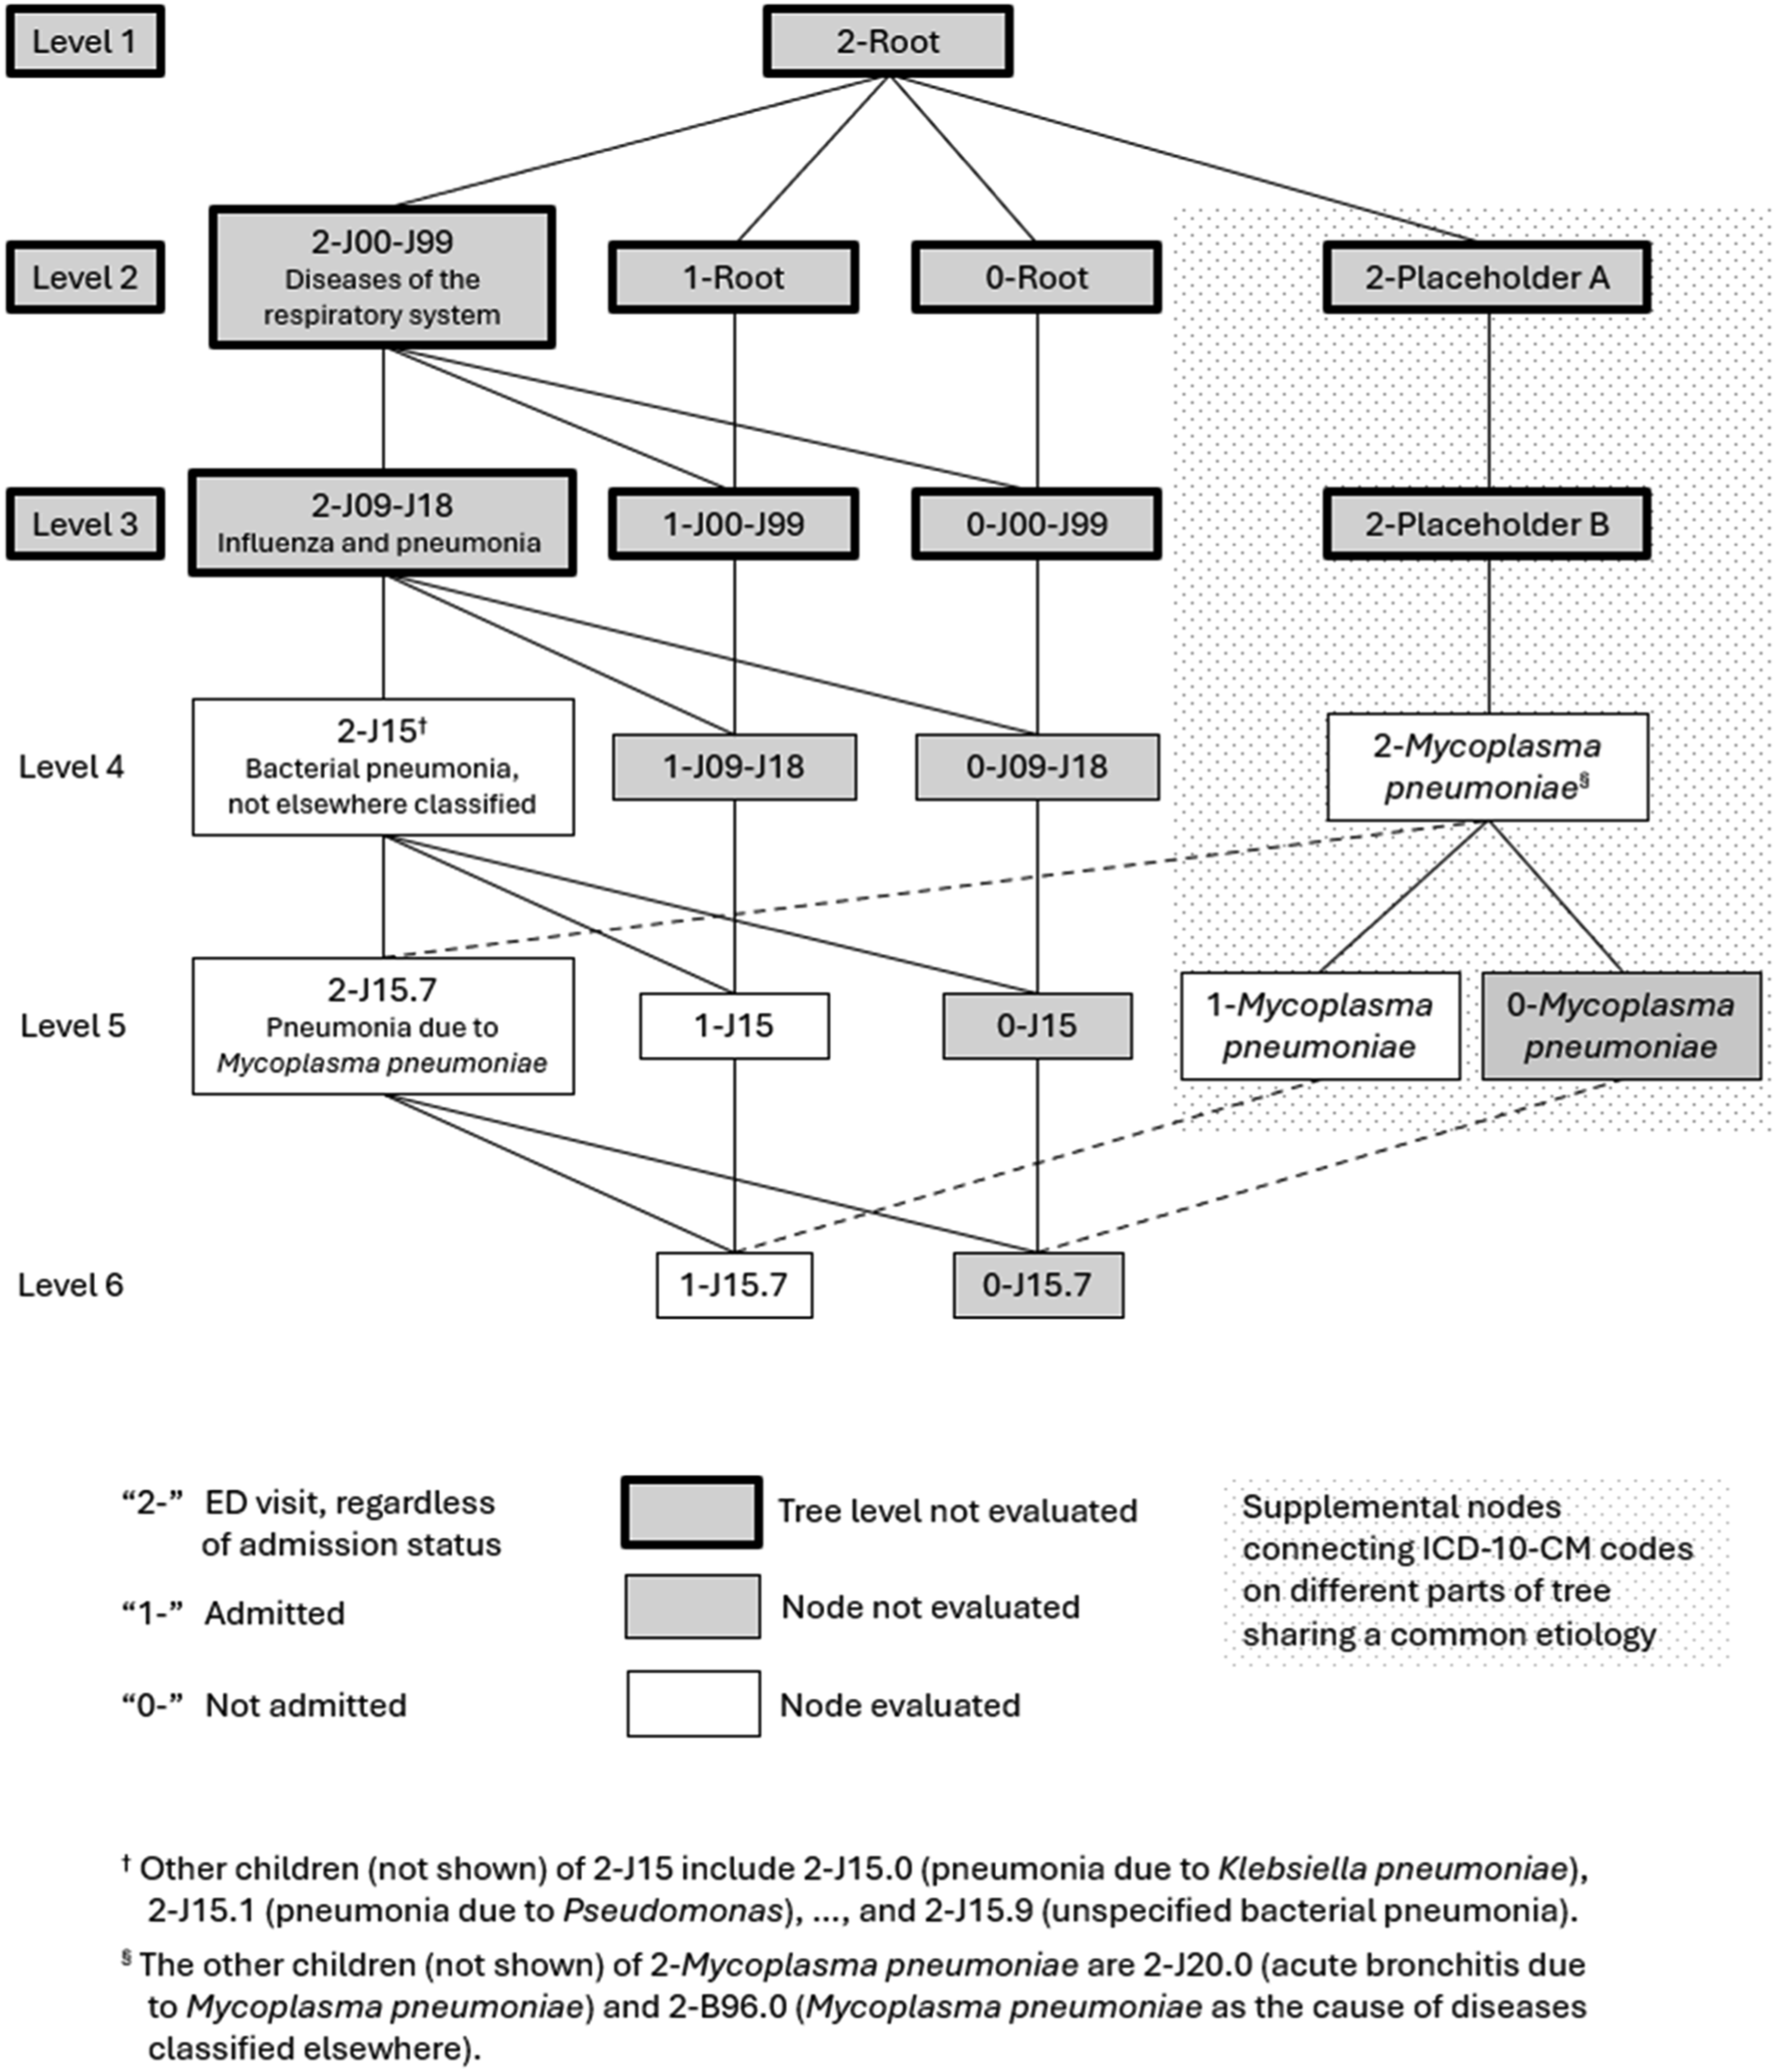
Tree-temporal scan statistic
Specifications for asyndromic anomaly detection using the tree-temporal scan statistic applied to New York City emergency department diagnosis codes.

Abbreviations: ED, emergency department; ICD-10-CM, International Classification of Diseases, Tenth Revision, Clinical Modification; NYC, New York City; RI, recurrence interval; RR, relative risk.
We used Monte Carlo hypothesis testing to control overall type I error across the multiplicity of overlapping sets of diagnoses and time windows evaluated on any analysis day. Statistical details are in the TreeScan user guide. 25 We defined signals based on relative risk and, to account for the daily analytic cadence, the recurrence interval (RI = 1/P-value). The RI represented the duration of daily surveillance required for the expected number of clusters at least as unusual as the observed cluster to be equal to 1 by chance. 27 The higher the RI, the less likely a cluster was due to chance alone. 26 We tracked RI trends as signals strengthened, held steady, and weakened, mirroring epidemic patterns (Table 1).
Proof-of-concept: COVID-19 emergence
We mimicked daily surveillance for February 29, 2020 (when the first laboratory-confirmed COVID-19 case was diagnosed in NYC 3 and prior to which no increase in COVID-19–like illness syndrome in EDs was observed 28 ) through March 15, 2020 (when widespread community transmission was announced 29 ). SARS-CoV-2 testing had been restricted at public health laboratories and not yet commercially available, curtailing situational awareness. 3 We assessed if and when increases in COVID-19–related diagnoses could have been detected by our new approach had it been applied at the time.
Real-time prospective analyses and signal interpretations
We launched daily, automated analyses on April 4, 2025 and, in parallel, developed a signal management framework. 30 For each signaling diagnosis, we reviewed summary data, including weekly trends for the most recent four years to assess seasonality; frequent co-diagnoses; and differences between baseline and cluster periods in patient demographic characteristics and in the distribution of EDs to which patients presented.
First, we validated signals by ruling out data quality problems and artifacts of care seeking or hospital coding practices. When patients disproportionately presented to certain EDs, we determined whether the health issue was truly geographically focused versus a hospital-specific change. Infrequently, this entailed contacting ED personnel to inquire about their use of a particular diagnostic code. We inspected temporal graphs and determined whether a diagnosis became an increasing percentage of all diagnoses for ED visits due to an increase in the numerator versus a decrease in the denominator, which might indicate a false positive.
Next, validated signals were prioritized, considering statistical strength, persistence, novelty, potential public health impact, the severity and preventability of the diagnosis, and the vulnerability of the exposed population. Prioritized signals were shared with relevant subject matter experts at the NYC Health Department. Finally, officials determined whether signal assessments were concerning and warranted public health action, such as outreach to health care providers.
We compiled illustrative examples of TreeScan signals detected during the first five months of daily analyses conducted during April–August 2025. We assessed timeliness; classified new signals as data artifacts (i.e., false positives), concerning, supportive of situational awareness for either acute events or typical seasonal increases, or unexplained (e.g., low priority to assess); and calculated the positive predictive value.
We could not calculate the sensitivity of the system because there does not exist a gold standard list of every health issue truly emerging in NYC during the study period. However, to gain insight into scenarios where TreeScan might fail to signal, we investigated why this system did not detect a large Legionnaires’ disease outbreak in July 2025.
Results
Proof-of-concept: COVID-19 emergence
Signals for COVID-19–related diagnoses in New York City emergency departments detected by mimicking prospective daily analyses using the tree-temporal scan statistic, February 29–March 15, 2020.

†The signal detection date was the day after the rolling time range ended. These proof-of-concept analyses used a time range of <90 days because NYC hospitals consistently transitioned from ICD-9-CM to ICD-10-CM as of December 21, 2019. The signals detected on March 10, 2020, for example, were based on an 80-day time range of December 21, 2019–March 9, 2020, with no data lags.
‡The maximum possible RI for this analysis was 274 years. When using 99,999 Monte Carlo replications, the smallest possible P-value is 1/99,999 = 0.00001. With a daily prospective analysis frequency, the maximum RI was thus (1/0.00001)/365 analyses per year = 274 years. When the null hypothesis of no clusters is true, then during a 274-year period, the expected number of clusters with RI≥274 years is 1.
*Subcodes included.
§Same day as the declaration of a local state of emergency (https://www.nyc.gov/assets/home/downloads/pdf/executive-orders/2020/eeo-98.pdf).
¶This was a supplemental node connecting ICD-10-CM codes on different parts of the tree sharing a common etiology. The child nodes for “other coronavirus” were B97.2 (coronavirus as the cause of diseases classified elsewhere) and B34.2 (coronavirus infection, unspecified).
#Same day as widespread community transmission was announced in New York City. 29
Abbreviations: ED, emergency department; ICD-10-CM, International Classification of Diseases, Tenth Revision, Clinical Modification; N/A, not applicable; RI, recurrence interval.
Heat-related illness
On May 18, 2025, TreeScan detected a spike for ICD-10-CM code T67 (effects of heat and light) on the prior day. The chief complaints indicated that patients presented with heat stroke and heat exhaustion after participating in a half marathon under unseasonably hot and humid conditions. 31 This demonstrates that TreeScan can detect health issues associated with mass gatherings and sporting events.
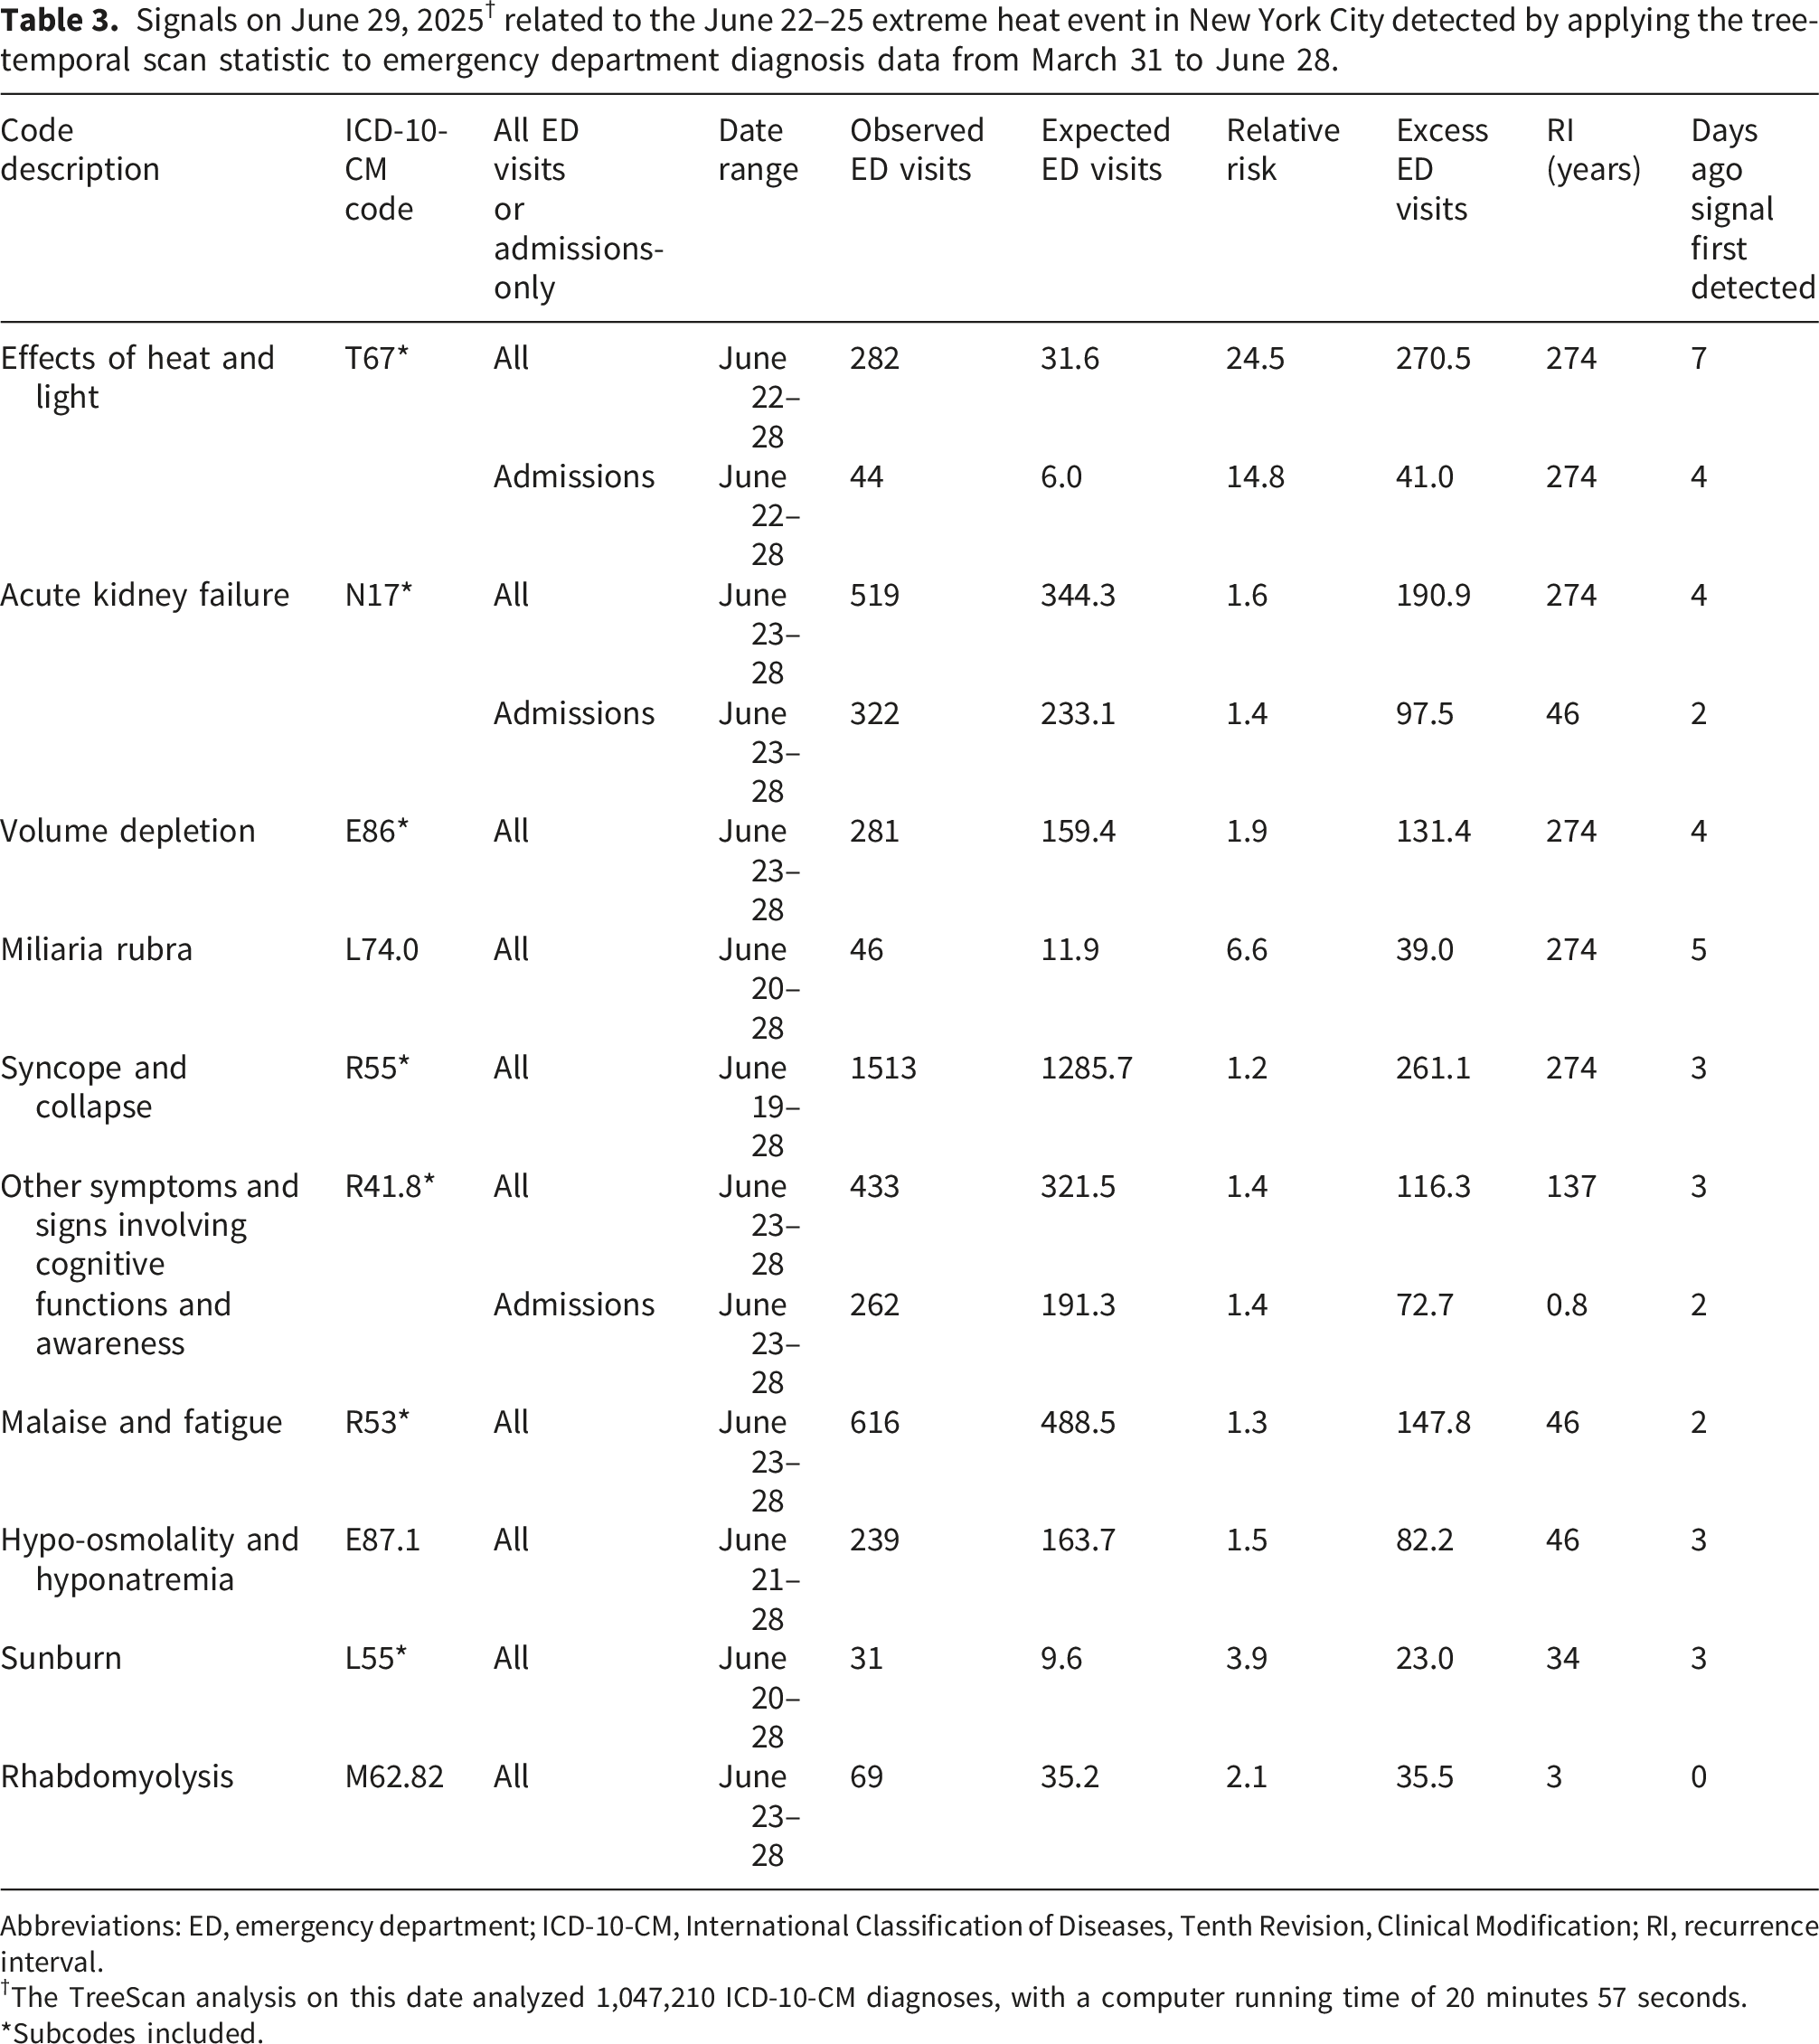
Signals on June 29, 2025 † related to the June 22–25 extreme heat event in New York City detected by applying the tree-temporal scan statistic to emergency department diagnosis data from March 31 to June 28.
Abbreviations: ED, emergency department; ICD-10-CM, International Classification of Diseases, Tenth Revision, Clinical Modification; RI, recurrence interval.
†The TreeScan analysis on this date analyzed 1,047,210 ICD-10-CM diagnoses, with a computer running time of 20 minutes 57 seconds.
*Subcodes included.
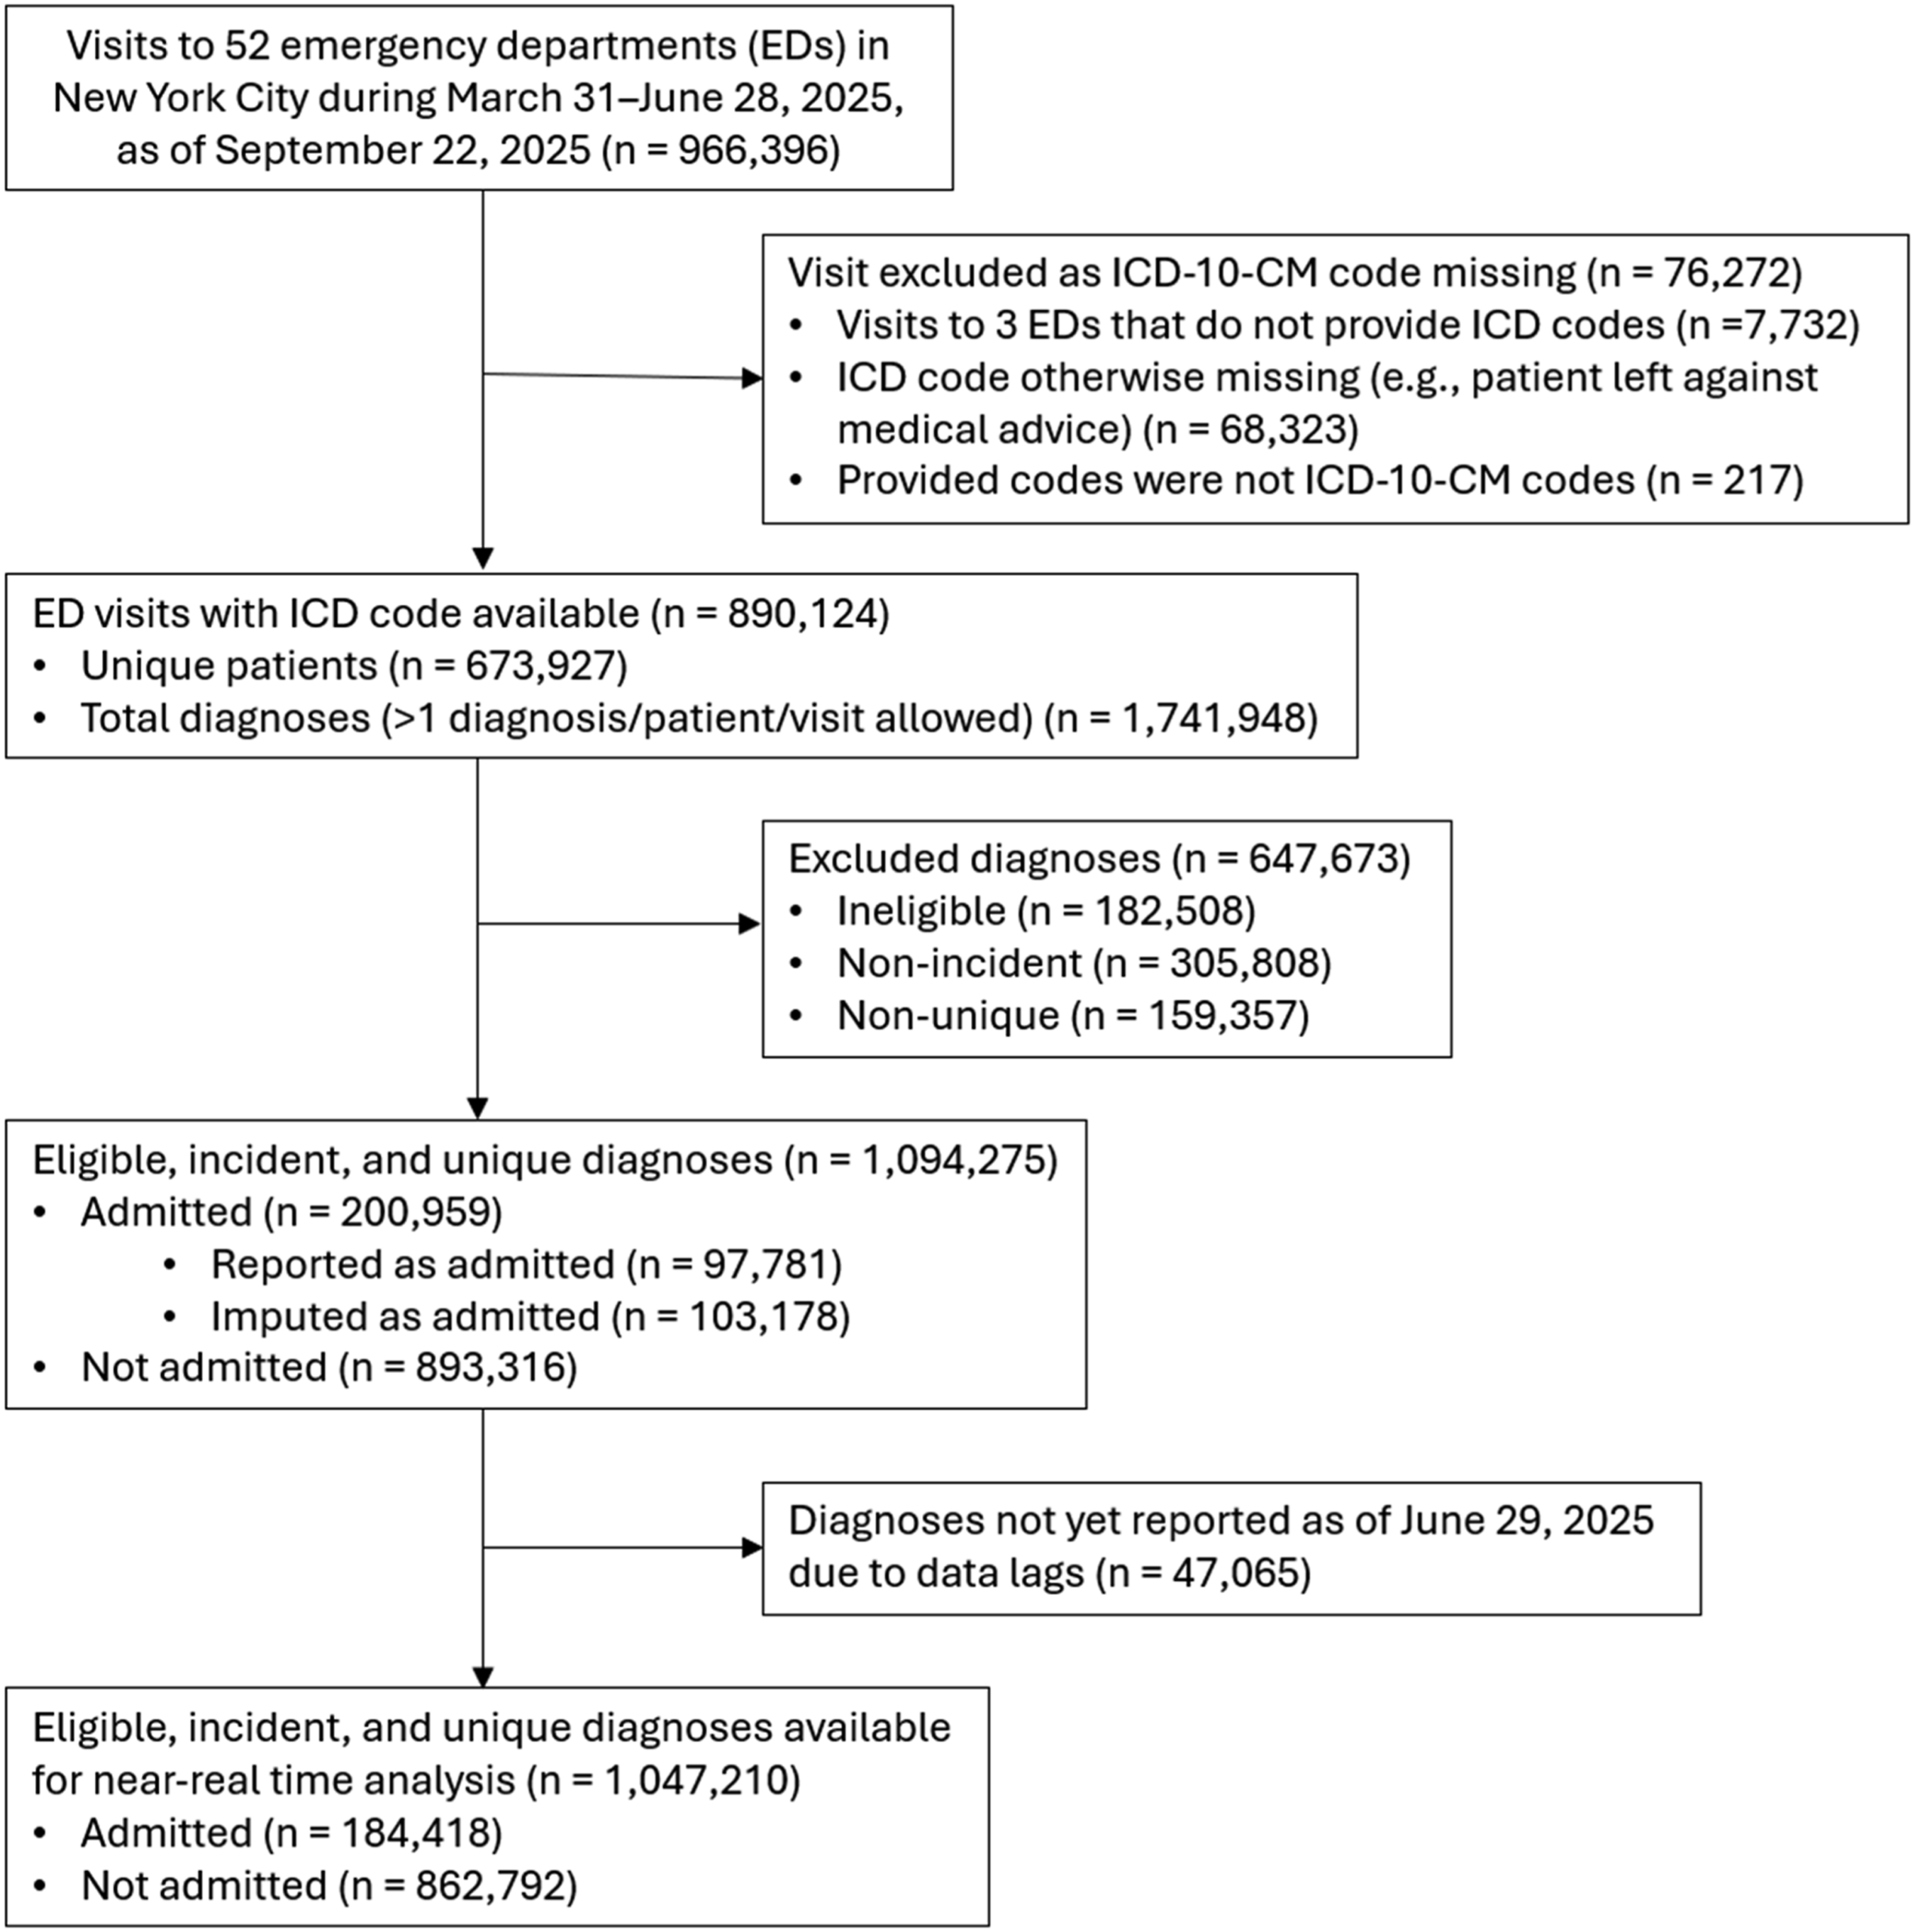
Population flow diagram for input file for analysis run on June 29, 2025.
Hand, foot, and mouth disease and other seasonal increases
On April 5, 2025, TreeScan detected the start of a seasonal increase in diagnoses for B08.4 (enteroviral vesicular stomatitis with exanthem), also known as hand, foot, and mouth disease (HFMD) (eFigure 3 in the Supplement). In the United States, HFMD is a common, typically mild viral illness that is easily transmitted among young children, peaks seasonally from spring to fall, and is not notifiable to health departments. HFMD continued to signal for >4 months of daily TreeScan analyses, with the last signal on August 19. A comparison of weekly trends showed the seasonal increase in 2025 was markedly larger than that of the three prior years (eFigure 3 in the Supplement).
NYC child care providers are required to report HFMD clusters (≥3 cases within a single child care facility) to the NYC Health Department. An unusual increase in reported HFMD clusters in child care facilities independently corroborated the increase in ED diagnoses. Unusual HFMD increases were concurrently noted in multiple states. 33 In response, the NYC Health Department disseminated HFMD messaging to all child care programs regulated under NYC Health Code Article 47 for group day care and Article 43 for school-based child care, highlighting HFMD prevention through handwashing, disinfection, and temporary exclusion of infected children.
TreeScan also detected diagnoses with seasonal increases of similar magnitude as prior years. These included L23.7 (allergic contact dermatitis due to plants, except food [commonly poison ivy exposure]), H60.33 (swimmer’s ear), and T63.44 (toxic effect of venom of bees). These signals did not warrant public health action.
Injuries
TreeScan detected signals on July 5, 2025 for T30.0 (burn of unspecified body region, unspecified degree) and on July 9 for W39 (discharge of firework) (eFigure 4 in the Supplement). For T30.0, patient chief complaints typically did not mention the burn source, although for three patients with no W39 co-diagnosis, “fireworks” or “firecrackers” were mentioned. The NYC Health Department issues annual press releases around Independence Day encouraging New Yorkers to avoid consumer fireworks, citing counts of fireworks-related ED visits 34 as determined by W39 or “fireworks” in the chief complaint. During July 4–8, 2025, 35 ED visits were classified as fireworks-related, while TreeScan estimated 40.4 excess visits for T30.0, indicating W39 was likely under-coded. To lessen reliance on clinicians documenting fireworks-related visits, future public health messaging could account not only for visits directly attributed to fireworks, but also concurrent excess visits for burns.
On August 18, TreeScan detected a spike for W34.00 (accidental discharge from unspecified firearms or gun) (eFigure 4 in the Supplement). The spike was attributable to a mass shooting at a bar on August 17. 35 Historically, certain prior mass casualty events have required standing up supplemental surveillance systems. 36 This signal demonstrates that TreeScan can be used to monitor injuries related to mass casualty events automatically and without pre-specification.
False positives
Three signals were classified as data artifacts. TreeScan detected an increase in F10.929 (alcohol use, unspecified with intoxication, unspecified), which was a diagnosis too specific to plausibly reflect a population-level emergent health issue. Diagnoses aggregated to less specific, higher levels of the tree (i.e., F10.92, F10.9, and F10) had not increased. Consequently, we added additional codes to the file of nodes not to evaluate.
On May 27, TreeScan detected a spike in diagnoses for H66 (suppurative and unspecified otitis media) on the prior day, which was the Memorial Day holiday. The patients were predominantly young children. This signal appeared to reflect a temporary shift in care for young children with ear pain from health care provider offices, which were closed for the holiday, to EDs.
On June 15, TreeScan detected an increase in V89.2 (person injured in unspecified motor-vehicle accident, traffic) during June 11–14, with the highest excess cases on the prior day. With unusually low overall diagnosis volume on Sunday, June 14, and for a serious health issue like motor-vehicle accidents where patients would not delay care seeking, a signal for this diagnosis appeared to be driven by an unusually low volume for other diagnoses.
A missed cluster
A community cluster of Legionnaires’ disease in central Harlem was detected on July 25, 2025 by applying the space-time scan statistic to electronic laboratory reports. 26 This cluster, which grew to 114 cases diagnosed during July 22–August 19, 37 was not detected by TreeScan. Of 100 outbreak-linked patients with an ED visit, only 6 patients were diagnosed with A48.1 (Legionnaires’ disease). The most common diagnosis, with 72 patients, was J18.9 (pneumonia, unspecified organism), for which the background frequency was high, with 3,269 diagnoses citywide during the outbreak period. Thus, the signal-to-noise ratio in citywide temporal analyses was low for a nonspecific diagnosis and a geographically localized outbreak.
Prospective analysis summary
During April–August 2025, TreeScan detected 84 unique signals. Three signals were data artifacts, so the positive predictive value was 96%. Of the remaining 81 signals plausibly reflecting true increases in health issues, 32 (40%) reflected typical seasonal increases, 20 (25%) were related to an acute event, 27 (33%) were unexplained, and 2 (2%) were concerning and resulted in public health action.
Regarding timeliness, for six acute events, including three heat events, a half marathon, a shooting at a bar, and Independence Day celebrations, at least one related signal per event was detected the following day. For the 32 diagnoses exhibiting typical seasonal increases, the median interval from the TreeScan cluster start date to first detection was 8 days (interquartile range: 6–15 days). The more rapid the seasonal increase, the faster it was detected.
Discussion
By applying the tree-temporal scan statistic to ED diagnoses, we detected increases in various health issues without pre-specification that affected NYC residents and visitors. Within the first five months of daily analyses, TreeScan demonstrated sensitivity to detect true increases in diagnoses that were minor (e.g., allergic contact dermatitis due to poison ivy exposure) and severe (hospital admissions for acute kidney failure); rare in the ED (miliaria rubra [heat rash]) and common (syncope and collapse); acute (a 1-day increase in heat exhaustion from a half marathon) and sustained (a prolonged HFMD increase); and foreseen (injuries from consumer fireworks around Independence Day) and unforeseen (gunshot wounds). Moreover, the investigative burden for false alarms was low. Only three signals appeared to be data artifacts, as determined by inspecting automated signal summary reports.
Two concerning signals prompted focused outreach separately to dialysis networks and child care programs. If TreeScan analyses had been in place during COVID-19 emergence, then policymakers might have had timelier knowledge of widespread community transmission and illness burden and severity. Factors increasing risk of severe complications, including cigarette smoking and type 2 diabetes, might have been characterized by mid-March 2020, before more resource-intensive studies could be conducted. In comparison with traditional syndromic surveillance, TreeScan detected increases in diagnoses for COVID-19–like illness, heat-related illness, and fireworks-related injuries, which were also detected using syndrome definitions. TreeScan added value by supporting more nuanced awareness of evolving situations, including for diagnoses excluded from syndrome definitions, such as heat-related acute kidney failure and excess burns not coded as fireworks-related.
We provide a comprehensive toolkit to support local implementation at other health departments. Our novel process can be replicated using the resources in the Supplement, including: code for removing non-incident and ineligible diagnoses from one’s own ED data; a tree file including supplemental nodes connecting diagnoses on different parts of the tree sharing a common etiology; a list of diagnoses not to evaluate; parameter settings with justifications; and code for defining and classifying signals and generating summary reports to support signal interpretation. Embedded in these files is a novel mechanism to simultaneously search for increases in diagnoses from ED visits overall and the subset resulting in hospital admission. Once automated, analytic maintenance requirements are minimal besides ensuring timely and complete ED data and accounting for newly added ICD-10-CM codes at least annually each October. 23
Limitations
Repurposing ICD-10-CM codes for public health surveillance carries limitations. First, patients with no ICD-10-CM codes assigned were excluded from analysis. These patients might have left against medical advice or discontinued care for other reasons, and their missingness could reduce population representativeness 38 and contribute to missed or delayed signal detection. Second, where assigned, ICD-10-CM codes might misclassify patients’ true health conditions. Diagnoses are assigned during ED visits and at discharge, prior to potential later adjustment by hospital billing departments, so likely reflect clinical impressions. Validating all diagnosis codes for population surveillance is impractical, but even with baseline misclassification and variation in coding processes across clinicians and institutions contributing noise, signals of increases above baseline should be detectable. Third, although we provided examples of detecting health issues the immediate day after an acute event, illnesses requiring more time to diagnose and data delays can contribute to missed or delayed signal detection. We are unaware of systematic differences in ICD-10-CM code timeliness by nature of diagnosis, hospital system, or admission status in NYC, but timeliness could vary within and across jurisdictions.
TreeScan did not detect a Legionnaires’ disease outbreak, indicating imperfect sensitivity to detect every health issue in NYC. Depending on the signal-to-noise ratio, a geographically limited outbreak might not be apparent in citywide temporal analyses, especially when patients are assigned nonspecific and common diagnoses, such as for pneumonia caused by an unspecified organism. TreeScan analyses of ED visits should thus supplement and not replace other aberration detection methods, such as spatiotemporal cluster detection of reportable diseases. 26 Health issues primarily affecting a subpopulation might not be detected in population-wide analyses. Stratified analyses restricting to selected subpopulations of special interest could improve the signal-to-noise ratio for such issues.
Practice implications
A unified, practical, and timely approach for asyndromic surveillance has been heretofore elusive. By mining ED diagnosis data, authorities now can automatically detect credible increases in visits for any cause, without preselection. The process could be applied to any data source with ICD-10 codes, including urgent care visits and hospitalization claims, as well as cause-of-death mortality data.
We demonstrated the effectiveness and public health utility of reviewing TreeScan signals in near-real time to detect health issues, launch investigations, mitigate hazards, support situational awareness, and allocate resources. In accordance with ethical and legal frameworks, 39 governmental public health entities should protect patient confidentiality while enabling data use for surveillance purposes, including detecting aberrations within local areas. The tree-temporal scan statistic uses only deidentified, aggregated input data. The TreeScan software is locally installed, and confidential information is never transmitted elsewhere for analysis. Signal validation and investigation activities should be limited to authorized personnel who securely access the minimum data necessary for public health surveillance and illness prevention and apply knowledge of the local context. This is of paramount importance for signals of sensitive health issues that might lead to discrimination or stigmatization. Additionally, when appraising the scale and scope of a health issue, persons not represented in the output should also be considered. This includes persons with difficulty accessing ED care, those who presented to the ED but were not assigned ICD-10-CM codes, and those who might have been assigned erroneous codes.
This system will perform best when complete and accurate ICD-10-CM codes are quickly available, underscoring the importance of medical coders and public health informatics infrastructure. In our setting, a high percentage of diagnoses were available for analysis as of the morning after the day of the ED visit. Other jurisdictions should assess their data timeliness and determine if different types of diagnoses are available at different lags. If recent data are highly incomplete and the analysis is not run at a lag, then the false-positive rate could be inflated by ICD-10-CM codes that require less diagnostic workup so tend to be reported more quickly. Staff reviewing signal reports should also consider local factors influencing diagnostic coding accuracy. Additional work is warranted to further develop and codify a signal management framework 30 and to train public health officials on signal assessment. A community of practice around scan statistics would be helpful for sharing knowledge around signal detection and interpretation.
In addition to infectious disease outbreak detection, TreeScan can be used to detect health issues during mass gatherings, such as for sporting, political, religious, or cultural events and health effects of environmental exposures, including extreme heat, extreme cold, hurricanes, flooding, wildfire smoke inhalation, and power outages. TreeScan can also detect population-level increases in newly emerging pathogens (e.g., COVID-19 emergence) and in conditions not required to be reported to health departments, such as HFMD and Mycoplasma pneumoniae infections, 24 which otherwise can be difficult to monitor in near-real time. With adjustments to time frames, this approach could also be useful in detecting longer-term effects of changes in health policy and services. 40
Supplemental material
Supplemental material - Asyndromic Surveillance of New York City Emergency Department Diagnoses with the Tree-Temporal Scan Statistic
Supplemental material for Asyndromic Surveillance of New York City Emergency Department Diagnoses with the Tree-Temporal Scan Statistic by Sharon K. Greene, Alison Levin-Rector, Martin Kulldorff and Ramona Lall in Journal of Public Health Research.
Footnotes
Acknowledgments
We gratefully acknowledge Leah Seifu, Joel Ackelsberg, and Rachel Paneth-Pollak (NYC Health Department) for contributions to real-time signal interpretation and follow-up. Judy Maro and Katherine Yih (Harvard Pilgrim Health Care Institute) provided helpful guidance for generating input files and automating TreeScan analyses. Drs. Seifu, Ackelsberg, Paneth-Pollak, and Maro also provided constructive suggestions on a previous manuscript draft. We additionally thank the Syndromic Surveillance Team (NYC Health Department) for ED data maintenance, Pierre Amiel for testing the code provided in the supplemental material, and Scott Hostovich (Information Management Services, Inc.) for incorporating updates into TreeScan software v2.3. A preliminary version of this work was presented at the U.S. National Syndromic Surveillance Program Community of Practice Call in January 2026 (https://vimeo.com/1168977770). This article was preprinted at ![]() .
.
Ethical considerations
The NYC Health Department Institutional Review Board determined this study (#24-084) was exempt human subjects research under 45 CFR §46.104 (d) (4) (iii) because it involved secondary use of clinical data, thus waiving the need for participant informed consent.
Author contributions
Greene (https://orcid.org/0000-0002-3509-2377): Conceptualization (lead), Formal analysis (supporting), Funding acquisition (lead), Investigation (supporting), Methodology (equal), Project administration (lead), Software (supporting), Supervision (lead), Writing – original draft (lead), Writing – review & editing (lead). Levin-Rector (https://orcid.org/0000-0002-4747-4188): Data curation (supporting), Formal analysis (supporting), Methodology (supporting), Software (supporting), Writing – review & editing (supporting). Kulldorff (https://orcid.org/0000-0002-5284-2993): Conceptualization (supporting), Methodology (equal), Software (lead), Writing – review & editing (supporting). Lall (![]() ): Conceptualization (supporting), Data curation (lead), Formal analysis (lead), Investigation (lead), Writing – review & editing (supporting).
): Conceptualization (supporting), Data curation (lead), Formal analysis (lead), Investigation (lead), Writing – review & editing (supporting).
Funding
The authors disclosed receipt of the following financial support for the research, authorship, and/or publication of this article: This work was supported by the U.S. Centers for Disease Control and Prevention [grant numbers NU50CK000517-05-02, NU51CK000368-02-00, and NU90TU000059-02]. The findings and conclusions in this article are those of the authors and do not necessarily represent the official position of the NYC Health Department or the Centers for Disease Control and Prevention.
Declaration of conflicting interests
The authors declared no potential conflicts of interest with respect to the research, authorship, and/or publication of this article.
Data Availability Statement
Sample code for replicating our analytical pipeline with a user’s own data source is provided in the Supplement. For transparency and reproducibility of signals related to an extreme heat event, TreeScan input and output files (which contain no confidential patient data) for prospective surveillance on June 29, 2025 are provided in the Supplement. The TreeScan software (https://www.treescan.org) and source code (![]() ) are freely available.
) are freely available.
Supplemental Material
Supplemental material for this article is available online.
References
Supplementary Material
Please find the following supplemental material available below.
For Open Access articles published under a Creative Commons License, all supplemental material carries the same license as the article it is associated with.
For non-Open Access articles published, all supplemental material carries a non-exclusive license, and permission requests for re-use of supplemental material or any part of supplemental material shall be sent directly to the copyright owner as specified in the copyright notice associated with the article.