
Abstract
In recent years, it is not only an innovator (institution), who is important for technology innovation, but increasingly important have become the micro and macro environment, since technological innovation requires cooperation, supportive legal, political, managerial, economic, social or environmental factors. As analogies in Japan, the USA, India or China, also the European Community, has to respond adequately to this trend through supportive legislation, management, infrastructure and cooperation. This article has the key purpose to outline selected issues and challenges of technological innovation and management in the world, as input into the comprehensive analysis of technology patenting in the EU countries since 1980. As a basic research methodology we chose patent research and database analyses of the EPO and WIPO databases. We examined the granted patents in comparison with several additional indicators, such as, a number of inhabitants, national GDP, VC investment, or patent publications by technology. In this limited patent analysis, we tried to distinguish between developing and developed countries of the EU. The result of this research shows that there are significant differences between developed and developing countries of the EU, not only in terms of technological innovation and patent intensity, or commercialisation of innovation, but also related to the focus and management of the technology innovation.
Introduction
Technological innovation can be characterised as the set of processes, facilities and know-how by which improved products, services or processes are created and offered to the market and society. In the history of technological innovation, we can find many individual radical innovations (e.g., a steam engine, electric bulb, transistor radio, calculator, TV, PC or mobile) that have changed or created new markets, brought changes in society and the environment. If we look at the brief history of technology/innovation, then naturally J. Schumpeter is considered as the grandfather of innovation policies (around the 1930s). One of the most important Schumpeter’s theories was that innovation can be regarded as ‘creative destruction waves’ that can change the whole market for the benefits of those who take advantage of discontinuities faster (Martin, 2012). Schumpeter proposed technological innovation as an innovative mix of different production tools and capacities so as to transform inputs into final products (Schumpeter, 2005). W.R. Maclaurin can be considered as a pioneer of technological innovation with his linear model of innovation (in the 1940s). He proposed technological innovation as a sequential process based on four phases: fundamental research, applied research, engineering development and production engineering (Maclaurin, 1947). Although this procedure is highly simplified/generalised, it may be still valid in a specific context. By the 1950s, Maclaurin and other authors had been studying complex economic/growth effects related to technology changes (Godin, 2008). During the 1950s and 1960s, S.C. Gilfillan and W.F. Ogburn were among the first academics that devoted a lot of efforts to study technological innovation and its effects on society (preferences, habits, social classes, culture, ethics, etc.) (Ogburn, 2012). They proposed that technological innovation highly impacts on certain social changes and vice versa. And thus social innovation must be adequately supported to keep pace with technological progress. Although, Ogburn claimed that there is usually a long time lag between the origin of technology invention and the time of its economic effects (Godin, 2006). Thus also, the social changes come after some ‘delay’, such as, those of ICT, the Internet or advanced technologies. Since the 1970s, a common issue within the innovation literature has been a decline in business results of existing companies and some social changes when radical technological innovation is introduced to the market (Slocum & Rubin, 2008). This process is usually accompanied by the appearance of new companies which gradually dominate the market. These new companies often support the local economy and also create new jobs in remote regions. Since the 1980s, the high support for technological innovation have provided new technology parks (such as the first Silicon Valley, Sophia Antipolis, Route 128, Bentley, Tsukuba Science City, etc.) and focused attention on the geographical concentration of technology development (Edgington, 2008). This trend has also had the impact on R&D support and technology management (TM) all over the world. In the 1990s, many technological innovations were based on the radical–incremental theories, bringing the terms like competence enhancing/destroying, architectural innovation and disruptive technologies (Christensen & Raynor, 2003). After the year 2000, there have been introduced new approaches in TM with the focus given to support creativeness and innovation of all employees at an early stage. There is the tendency of international companies to buy up rapidly progressive technology start-ups, to use out/multisourcing or open innovation rather than over-investing own research capacities and existing technologies. However, this requires supporting basic as well as applied research networks, motivation of all employees and the system of effective IP protection. Many companies and governments have responded to these trends by preparing plans, processes and laws to create institutional networks for corporate, regional and national innovation systems (with more or less success).
In the next section of this study, we will focus on some important aspects of technological innovation and management in the world. Among the major issues of this section may include: how to measure the effectiveness of technology innovation or how to improve the positive effects of technological innovation, how to improve cooperation within technological innovation networks, what is the role of the national research and innovation strategies to promote technological innovation, etc.
Selected Relevant Aspects of Technological Innovation, Support and Management
Despite the general technology dynamics, if we study World Technology Fund as an open-end fund based in Luxembourg, the value of the fund has only increased by 20 per cent during the last 5 years (Bloomberg, 2014). However, new know-how diffusion, new laws, policies, norms, socio-economic changes, environmental pressures or changes in perception can lead to new opportunities for technology innovators (Yang, 2005). But, similarly to product innovation, sources of technological innovation can be either external (market-pull) or internal (technology-push) (Di Stefano, Gambardella and Verona, 2012). As it was already indicated, innovation of modern technologies not always follows the well known S-curve regarding the development and diffusion (White, 2008). There are many discontinuities, but we do not know yet how to generalise them. What we know is that technological innovation is generally more complex and costly than product innovation and often foregoes it. Technological innovation may require a set of follow-up longer-term processes (organisational, infrastructural or managerial changes) that should lead to new product/service improvements which are beneficial for the company and its environment (Liu, Mingxing & Zhang, 2012). Technological innovation should have a potential to secure new supply resources, reorganise and improve manufacturing and business conditions, save materials and business resources, improve functions and quality of products and services, seize or open up new markets, improve environmental quality of production, etc (Mao, 2007).
One of the most complex/important measures of the success of technological innovation is innovation efficiency. But linking innovation inputs and outputs only with business performance indicators can lead to the incorrect results, because, for example, an amount of research expenditures, research intensity or research manpower does not immediately mean better business/regional results. Technology costs are usually long-term costs, and investments that do not immediately result in profits may be regarded as sunk costs (Koellinger, 2008). Technological innovation takes time before it starts to be really effective for a company. A number of product/process innovations, a number of technology licensees, patents, trademarks, royalties, etc., and all these outputs do not confirm the innovation efficiency of the company. Positive innovation efficiency may be achieved through a longer term and more complex results while taking into consideration also better goodwill, know-how, working conditions, culture, waste disposal or market coverage related to the technological innovation. Meanwhile, the real technological innovation efficiency can be less important for low- and medium-technology companies than for high-tech industries (Alvares & Crespi, 2003). High-tech companies usually invest more in innovation processes and their investments are more risky. Therefore, these companies require the higher efficiency as other companies in less risky sectors. Similarly, innovation efficiency is more important for smaller technology innovators like for larger companies. Large companies usually have much more innovation outputs due to the higher capacities or technology diversification and can use their innovation results for different products and processes. Based on the study of Cruz-Cázares, Cristina & García-Marco (2013), the highest innovation efficiency was identified in the timber/wood industry (60.2 per cent), followed by the transport equipment industry (47.6 per cent), and the lower innovation efficiency was identified in the chemical industry (16.3 per cent) and the clothing industry (10.6 per cent). We can say that higher the innovation efficiency, lower the risks of the industry. Other indicators for measuring the ‘performance’ of a specific technological innovation may be the diffusion of the technological innovation, knowledge development, market formation, higher employment, lower emissions, higher VA or a number of technology customers (Markard & Truffer, 2008).
Along with the upward pressures on efficiency, automation or environmental acceptability of technological activities, technological innovation processes have become more and more complex due to the co-development of new markets/market structures, new socio-technical requirements, new institutional policies and norms, etc. There are created sectoral, regional or national innovation networks/value chains in which the actors cooperate/compete, develop, diffuse and use technological innovations. The competitive landscape is changing with technology markets, new device manufacturers entering the value chain due to the cross-industry technologies like nano-, biotechnologies, transport systems or ICT (CSC, 2013). Thus, also Technology management (TM) should not only build upon internal needs of an enterprise, but also upon customers’ requirements, competitors’ activities, suppliers’ possibilities and the orientation of the macro environment within which the enterprise interacts. Technological innovation may contribute to the positive restructuralisation of its environment. It may promote more flexible organisation of business processes, open cooperation, establishment of new markets or sectors, improve business and national socioeconomic adaptability and competitiveness, etc. It may even change cultural traditions in a region, but also globally. But, new technology can be also very disruptive to its environment. It may require more suppliers, new business models, new solutions to eliminate waste and emissions or higher costs for technology control. It can cause higher prices and risks for the company and its environment. It may also affect negatively socio-economic environment and health of the population, if taking into account the negative aspects of biotechnology, nanotechnology or ICT. Therefore, TM (with public cooperation) should study if a new technology is developed or diffused in accordance with the needs of the enterprise and its environment (endogenous technology), or if the technology is developed outside the problems and requirements of its environment (exogenous technology). Then, it is necessary to identify/eliminate reciprocal effects of the technological innovation on its environment. If a technology has indirect, irrelevant and subsidiary effects on the environment, then this is a technology with low transformative capacity (music and media industry, entertainment, banking or financial sector). If there are invoked direct, incisive and generally disruptive effects, this technological innovation has a high transformative capacity (chemical and pharmaceutical sectors, automotive industry, energy or telecommunication) (Dolata, 2009).
The high sectoral and regional transformative capacity of new technologies may lead to positive, but also unwanted technology-driven pressures to change the structural/ institutional organisation of the sectoral system. The complementary factor—sectoral adaptability enables a region or an industry to anticipate and utilise technological innovation based on planned and useful changes or reactive and crisis-ridden patterns of change (Dolata, 2008). Technological innovation promotion requires supportive legal, political, economic, social or environmental factors. Especially, technology and innovation strategies/policies that will be promoting national innovators, strategic technology projects, but also the prospective innovation of SMEs. Other supportive factors are positive competition policies, preventing monopolies and protecting private capital. Each innovation activity is specific and depends on specific conditions of a company; therefore, also public support for innovation should be adapted to regional conditions and situation, that is, smartly specialised. In many advanced economies (e.g., Japan, USA, China, the UK, Denmark, SRN, the Netherlands and the UK), these factors and their desired changes are subject to strategic participatory planning and policies, with the participation of governmental, regional, business, as well as public institutions. Thus, TM exceeds the boundaries of an enterprise or an industry and also becomes a macro discipline.
For example, Japan adopted its first Science and Technology Basic Plan in 1996 in order to enhance its S&T environment, to strengthen own R&D capabilities, and to ‘return’ R&D results back to the society. This plan was a national strategy for R&D and technology policies, and created a 5 years guideline for each ministry in charge of R&D (Edgington, 2008). Since this first plan, such planning has been repeated every 5 years. The innovation system in Japan has had in recent years a specific problem; there are many incremental technological innovations, but only few radical innovations. Technological innovations in Japan are often based on imports of foreign technology that results in deficits in the royalty balance of payments, although the country invests about 3.3–3.4 per cent of GDP in R&D compared to China (1.5–1.7 per cent), the EU (1.7–1.9 per cent) and the USA (2.8–2.9 per cent) (World Bank, 2013). In the US, the analogous Strategy for American Innovation should provide a commonsense and sustained approach to ensuring that innovations drive the US future economic growth and competitiveness. The Strategy has three main areas: investment in the building blocks of American innovation (workforces, scientific research and infrastructure), promotion of market-based innovation (R&E tax credits, support for innovative entrepreneurs, entrepreneurial ecosystems, etc.) and catalysation of breakthroughs for national priorities (alternative energy, health IT, educational technologies, biotechnology and nanotechnology, etc.) (OSTP, 2011). China’s Medium and Long-term Plan for the Development of S&T (2006–2020) was launched by the Chinese government. The plan has the main goal to turn China into a highly innovative nation by 2020. The key quantitative goals include: investing 2.5 per cent of GDP in R&D every year, raising technological innovation contributions to the economic growth to more than 60 per cent, reducing dependence on imported technology to less than 30 per cent of VA, and ranking among the 5 best countries in terms of granted patents and scientific papers citations (Simon, Cao & Suttmeier, 2007). This plan has also qualitative aspects; one of the main principles is called ‘Zizhu Chuangxin’ (independent or home grown innovation). 1 The Europe 2020 Strategy proposes a vision of Europe’s social market economy in the twenty-first century based on the restructuralisation of the European research and 3 per cent R&D spending achieved by 2020. In the EU, the key socio-economic goal is to improve general knowledge by R&T and thus also the social standard of people. In 2011, the R&D spending from general university funds (GUF) accounted for 33.2 per cent of total GBAORD; 2 the R&D financed from other sources than GUF created 17.0 per cent. For example, in 2010, in Japan, improvement of knowledge: R&D financed from GUF was also the key goal, creating 36.4 per cent of GBAORD, while in the US– 57.3 per cent of GBAORD was allocated only to defence (Eurostat, 2013c). According to the Europe 2020 Strategy all member states should also foster excellence and smart specialisation, reinforce cooperation between universities, research and business, implement joint projects and enhance cross-border cooperation etc. to ensure the diffusion of technology across the EU territory (EC, 2010b). For example, European Technology Platforms (ETPs) provide wider support for technology projects in the EU. ETPs are industry-led stakeholders’ forums that develop short- to long-term research and innovation agendas and roadmaps for actions at the EU and national level to be supported by both private and public funding. 3 However, it is a pity that many legislative, development, but also operational initiatives of the EU in the field of technology/technology management are defined in very general terms, usually oriented only to promote ICT, nanotechnology, biotechnology and environmental acceptable technological innovation.
On technological innovation activities/patents in the EU, we will focus in the analytical section of this article. The main hypothesis of this research can be determined as: There are significant differences between developed and developing countries of the EU, not only in terms of technological innovation and patent intensity, or commercialisation of innovation, but mainly related to the focus, organisation and management of science, research and innovation in the field of technology. These differences can be conditioned not only by certain historical traits/lags, but also by the overall system and promotion of technology in the EU countries.
Systemic Insights in Technological Innovation and Patents in the European Union
The main goal of this analytical part is to study the patent intensity in the EU-28 countries and selected related indicators and circumstances (since 1980). As the key measures, we chose a number of granted technology patents with a comparison of other indicators, such as, number of inhabitants, national GDP, VC investment and patent publications by technology. In this limited patent analysis, we tried to distinguish between developing and developed countries of the EU. As it is well known, a granted patent is a legislatively protected innovation that is new, useful, non-obvious and safe. But, a patent must be transformed into new products, technologies and designs before it is commercially successful. Most granted patents have small or no commercial significance, which is one reason that only 1.5 per cent of patents are ever litigated and only 0.1 per cent of patents are ever litigated to trial. In many Japanese companies only 20–25 per cent of granted patents are commercially successful. Patents can have a limited commercial value, either because they include technology that is not commercially important, or because owners do not know how to commercialise the technology effectively. But in the same way, several patents can have significant economic importance, for example, technologies like Google glass, 3D printing, Touch ID, electric cars and many others (Lemley & Shapiro, 2005). Based on the survey of 600 practitioners within the IP Portfolio Management Trends Survey, it is obvious that the competitive significance of patent scan be related to factors like: uniqueness of innovation, cost control, alignment with a business strategy or a patent scope (IMF, 2012). More complex the scope better protection of the inventor and better competitive strengths. Another study of the commercialisation outcomes of 3,700 Australian inventions indicated that patents play a positive, but a modest, role in the decisions to manufacture inventions. Only 4–8 per cent of patented innovations are really used in practice. Although, many unpatented innovations were commercialised successfully (Webster & Jensen, 2011). However, this is a complex issue that depends not only on the patent aspects, but on all related business processes, including marketing, finance or quality issues. For example, it costs 5–6 times more to find a new customer as to keep an existing one. About 95 per cent of dissatisfied customers do not complain, but more than 90 per cent of them will never come back (Russel & Taylor, 2010).
In general, technological innovations are conditioned by adequate technical, organisational, personal and financial support. One of the important indicators in this context is the amount of technical cooperation grants, which are focused to support the transfer of technological and managerial capacities to perform specific technical projects. Based on this indicator (BoP, current US$), we can notice the high variations in the funds spent in relation to the Global economic crisis, for example, China spent about 929,590,000 USD in 2009 and only 729,990,000 USD in 2011 (within these grants), while India spent only about 266,040,000 USD in 2009 and 325,510,000 USD in 2011 (World Bank, 2014). The 7th FP funded European Cooperation in Science and Technology (COST) by 250 million EUR during the years 2007–2013. The R&D spending in the EU-27 accounted for 256.6 billion EUR in 2011; and on average of 511 EUR per capita. A decade before, R&D spending was 370 EUR per capita (Eurostat, 2013a). It is evident that these indicators were significantly lower than in the US and China. Another indicator of R&D intensity is High-technology export. 4 If we look at the high-tech export as percentage of manufactured exports in the EU, China and the US in 2007 and 2011, then, before the crisis in 2007, it accounted for 27.2 per cent in the US, 26.7 per cent in China and only 14 per cent in the EU. In 2011 it was 25.8 per cent in China, 18.1 per cent in the US and only 15.5 per cent in the EU. It is clear that this percentage drops mainly in the USA, but in the EU countries, it is still the lowest (UNDATA, 2014). In 2010, there were about 50,000 companies in high-tech manufacturing in the EU. High-tech companies were situated mostly in Germany, the UK, Italy and the Czech Republic, all together created about 55 per cent of the high-tech sector in the EU. In 2011, 2.4 million people were employed in the high-tech manufacturing, which corresponded to 1.1 per cent of the total employment. Germany was the leading exporter of high-tech products in 2012, followed by the Netherlands, France and the UK (Eurostat, 2013b).
If we look at our analysis of the EPO patent database (1980–2012), we can notice that the most patented technologies are Electrical machinery, apparatus, energy; Transport technology; and Medical technology. 5 In the past 15 years, Medical technology has been the leading category among patent applications to the EPO. Medical technology is also the most published topic in many scientific journals. For example, only in 2012, the EPO received about 10,412 Medical technology patent applications; 42 per cent from the USA and 38 per cent from Europe (EPO, 2012). The least patented technologies are technologies for Analysis of Biological Materials; IT methods for management; and Micro-structural and nano-technology (NT). The reason may be that NT is still very much an object of basic research and thus highly indefinite of an economic potential. Especially, the EU countries have the problem to transfer NT inventions into commercial products (EC, 2004). The ratio between the average numbers of the most and the least patented technologies is 16:1. In the period 1980–1990, there was the increase of technology patents by about 116 per cent, during 1990–2000, it was only 1 per cent, and in the period 2000–2012, it was about 59 per cent. After the fall of the Eastern Bloc in the 1990s, the Copenhagen criteria for candidates to join the EU were agreed upon the member states. It took a decade, until some Eastern countries restructured their research and innovation systems and fulfilled the conditions for joining the EU. In total, the EPO registered 1,167,830 technology patents during 1980–2012, which is about 48 per cent of all technology patents issued within the EU countries. For example, the USPTO registered 4,784,872 patents during 1977–2012 (USPTO, 2013) (Table 1 and Figure 1).
Patents Grants by Technology, Total Account by Filling Office: EPO (1980–2012)
Source: WIPO (2014).
Source: WIPO (2014).
Technological and organisational innovation is a significant precondition for product innovation, especially in manufacturing companies. Higher shares of technological innovators also reflect a higher level of innovation activities in a country. If we look at the number of technology patents registered within national patent offices of the EU (1980–2012), then in all areas of technology patenting in the EU dominate Germany, France and the UK. Germany is one the most innovative country in terms of patents after the USA, China and Japan. In 2011, France (and Slovenia) provided the best (direct and indirect) support for business R&D as per cent of GDP. The UK was the second best (after the USA) in academic R&D, with specific strengths in the medical and social sciences (OECD, 2013). In Germany and France dominated Transport technologies and Electrical machinery, apparatus, energy. In the UK dominated technologies for Civil engineering. These technologies are also highly patented in France and Germany. Germany also had a lot of patents in the measurement field. Among the well-known companies in this field belong, for example, BMCM, OPTACOM and HKM. The least patented technologies in Germany, France and the UK were Micro-structural and nano-technology, IT methods for management and Analysis of biological materials. For example, Analysis of biological materials (in general) is still an emerging field of modern analytical chemistry and thus it may lack scientific foundations for its further rapid development (McSheehy & Mester, 2003). In total, the EU countries recorded 2,410,787 patents registered within the national patent offices, while the developed countries recorded 2,089,430 (87 per cent) and the developing countries recorded only 321,357 patents (13 per cent) in the period 1980–2012. In this period, the most patented technologies in the developed EU countries were Transport technologies (146,757 patents), Civil engineering (129,909 patents) and Electrical machinery, apparatus, energy (128,684 patents), especially in France, Germany and the UK. In the developing countries, there dominated Organic fine chemistry (34,566 patents), Pharmaceuticals (25,704 patents) and Civil engineering (20,846 patents), especially in Hungary, Poland and Greece in the period 1980–2012. Although, medical technology is the field with the highest volume of applications in the EU (as we already mentioned), in the developed countries dominated industrial technology patents and in the developing countries dominated chemical technology patents. But the European chemical industry is one of the largest sectors, in terms of productivity and employment. Innovation in the chemical industry creates a basis for raw materials supplies in many industries as well as for the development of advanced materials (such as, hybrid and lightweight materials, materials for tissue engineering, etc.), and advanced technologies for more flexible production with more efficient use of energy, feedstock or water (CEFIC, 2011). The least patented technologies in the developed and developing EU countries were the same, Micro-structural and nano-technology, IT methods for management and Analysis of biological materials (Table 2).
The fewest technology patents were granted in Malta, Estonia and Lithuania. While, Cyprus did not recognise any technology patents registered within the WIPO database in the period 1980–2012. For example, Cyprus, Estonia and Ireland are the STI (science, technology and innovation) followers within the EU. But for example, the innovativeness of Lithuania, Malta or Slovakia is below the EU-28 average. These countries are moderate innovators (EC, 2013). On average, it was 86,100 technology patents in the EU-28 countries during the period 1980–2012. The difference between developed and developing economies in the EU is significant. On average, it was 149,245 technology patents in the developed EU countries, and only 22,954 patents in the developing EU countries. Only seven countries (FR, DE, IT, PL, ES, SE and the UK) achieved above average results in terms of this indicator. Among the developing countries, there was only Poland, which indicated above average results according to this indicator. But in recent years, Poland has slowed down its STI intensity, becoming a modest innovator with the innovation growth rate of about 0.4 per cent (EC, 2013). For example, companies in Luxembourg or Ireland generate a significant share of inventions abroad, but only up to 30 per cent of their patented inventions are owned by foreign firms. The reverse is true in Poland. Poland reported that foreign companies contribute less than 40 per cent of the total foreign funds for R&D, mainly because of funding from the EC and other international bodies (OECD, 2013). In recent years, government agencies have distributed more than 40 per cent of OP IE funds to large companies for technological innovation through capital investment (Kapil, Piatkowski, Radwan & Gutierrez, 2013). Technology absorption in Poland, but also in other developing countries should be financed more by revolving instruments (loan funds, VC funds, etc.) rather than grants (Figure 2).
Patents Grants by Technology, Total Account by National Filling Office (1,980–2,012)
Source: WIPO (2014).
If we look at the number of technology patents (1980–2012) per 100,000 inhabitants then the first place belongs to Luxembourg with 1,699 patents per 100,000 inhabitants. The second place belongs to Sweden and the third to Finland, with 1,031 and 882 patents per 100,000 inhabitants. All these countries can be considered as developed economies. Luxembourg belongs in the EU among the STI followers with the innovation growth rate of 0.7 per cent in 2012. In recent years, Luxembourg has recorded one of the highest growth rates of international scientific publications among the member states. The main problem of the innovation development in Luxembourg is in relatively low business investment (EC, 2013). Except private companies, the Luxembourg’s RDI system also consists of public research actors, such as public research centres, governance bodies, chambers and professional federations or the University of Luxembourg (OECD, 2007). Many technological transfers in Luxembourg are carried through cooperation between companies and their customers, as well as through the mobility of skilled staff. For small open economies like Luxembourg, Slovakia or Slovenia, technological innovation cooperation is highly based on the involvement of foreign partners. This is also conditioned by national and regional technology specialisation and support, opportunities for international cooperation and proximity to international knowledge centres.

Source: WIPO (2014).
For another example, Sweden and Italy applied for almost the same number of patents over 2009–2011 and had the comparable share of patents controlled by foreign firms (21 per cent), but they had different shares of innovation generated abroad, around 31 per cent in Sweden and only 8 per cent in Italy. The share of R&D staff in total employment in Finland and Denmark achieved about twice the EU average (1.1 per cent) in 2011 (OECD, 2013). In 2013, Finland introduced R&D tax incentives reflecting eligibility rules and their use by firms, which depends not only on R&D expenditures, but also on real effectiveness of innovation. In developing economies like Malta, Croatia and Lithuania, it was only 41–112 patents per 100,000 inhabitants. The innovation performance of Malta dropped significantly (−16 per cent) during 2010–2012 (OECD, 2013). With less than 10 applications per year, Malta had the lowest patenting activity. 80 per cent of companies that submitted patents in Malta belonged to international corporations; this number was one of the highest in the EU 6 (MCFSAT, 2011). The strong decline was mainly in PCT patent applications, 7 in sales of new-to-market and new-to-firm innovation or patent revenues from abroad. Croatia belongs among modest innovators within the EU with the annual average growth rate of 2.1 per cent (EC, 2013). Relative strengths were in non-R&D innovation expenditures, community trademarks and knowledge-intensive services exports. Similarly with Malta, the significant decline was in PCT patent applications, and in societal challenges for better innovation. The public sector covered the most of R&D spending, but did not commercialise its innovation and technology properly (Correa & Borowik, 2010). Lithuania had quite high the innovation growth rate of about 5 per cent during 2008–2012 (EC, 2013). Relative strengths were in human resources and financial support. Lithuania had around 6,000 scientists in 2009. The private sector invested about 0.24 per cent of GDP in R&D in 2011. It total, it was 0.94 per cent GDP for research and innovation in 2011 (EC, 2013d). The country has also increased its non-R&D innovation expenditures significantly. The main problems are with unopened, not very attractive STI system and protection of intellectual assets.
On average in the EU-28 countries, it was 447 technology patents per 100,000 inhabitants, while in the developed EU countries, it was 667 patents on average and in the developing EU countries, it was only 227 patents per 100,000 inhabitants in the period 1980–2012. Only 10 countries (AT, DK, FI, FR, DE, HU, IE, LU, SE and the UK) achieved above average results in terms of this indicator. Among developing countries, it was Hungary, which indicated above average results. Hungary belongs among moderate innovators in the EU with the innovation growth rate 1.4 per cent during 2008–2012. The above average innovation performance of Hungary is due to its high performance (third-best in the EU) in contribution of the medium and high-tech product exports to the trade balance. And the growth rate of venture capital investments has been the highest of all member states in recent years. The problem is that two-thirds of the patented inventions in Hungary are owned by foreign firms. The Hungary’s innovation policy has changed over the past 10 years. The Széchenyi Plan (ÚSzT) revised/improved the S&T Innovation Policy Strategy in early 2011 and is currently the key strategic document. But, technological innovation of many Hungarian companies, especially SMEs, is under developed. Although, the recent Enterprise Technology Development Initiative has funded the technology area within the budget of about 200 million EUR (OECD, 2012a) (Figure 3).

Source: WIPO (2014).
If we compare the number of annual average technology patents per 1 billion EUR of the national GDP, then the leading positions belong to developing countries. In the first place is Bulgaria with 24.9 patents. The second place belongs to Hungary and the third to Romania, with 21.7 and 10.4 patents per 1 billion EUR of the national GDP, although the innovation performance of Bulgaria and Romania is well below the EU-28 average. Since the beginning of the Europe 2020 initiative in 2010, many member states have increased their STI growth, but Bulgaria and Romania have experienced a dramatic decline (−18.7 per cent and −5.1 per cent) (EC, 2013). Among the main problems of these innovation systems may be unopened research systems, weak governmental financial support, low business investment and weak linkages between innovation stakeholders. The main focus of R&D investment is more on basic research while maintaining a legacy superstructure of research institutes and universities. In 2007–2011, Bulgarian companies invested about 0.3 per cent of GDP in R&D, while the public R&D spending was only 0.29 per cent in this period. The underdeveloped R&D infrastructure may be also perceived as the key reason for the Bulgaria’s weak position when it comes to technology licensing, high-tech exports, technology patenting or scientific publications. The IPR system in Bulgaria is also highly costly and overly administrative especially for SMEs (Mi.government, 2013). The Romanian R&D system is characterised by outmoded structures and attitudes, high fragmentation and isolation that do not reflect the global trends (World Bank, 2011). Due to the long-term underinvestment, the number of researchers decreased highly from 1998 to 2010, while the average age of scientists increased. The low attractiveness of the research career made it very difficult to attract best young people into research as in many EU countries. Meanwhile, the business innovation system was not properly supported by functional technology transfers and risk capital was also absent (EC, 2010a).
In developed economies like Belgium, Italy and the Netherlands, it was only 2.4–3.6 patents per 1 billion EUR of the national GDP. On average, it was 6.6 technology patents annually per 1 billion EUR of GDP in the EU-28 countries. In the developed EU countries, it was only 5.7 patents on average and in the developing EU countries; it was 7.5 patents annually per 1 billion EUR of GDP. The above-average results were achieved by 10 countries (AT, BG, FI, FR, HU, PL, RO, SI, SE and the UK) of the EU-28 in terms of this indicator. This indicator has only an indicative purpose, because a higher proportion of technology patents per GDP may not reflect the real innovative progress of the country. Since countries with lower GDP may have a higher share of technology patents (Figure 4).
Source: WIPO (2014).
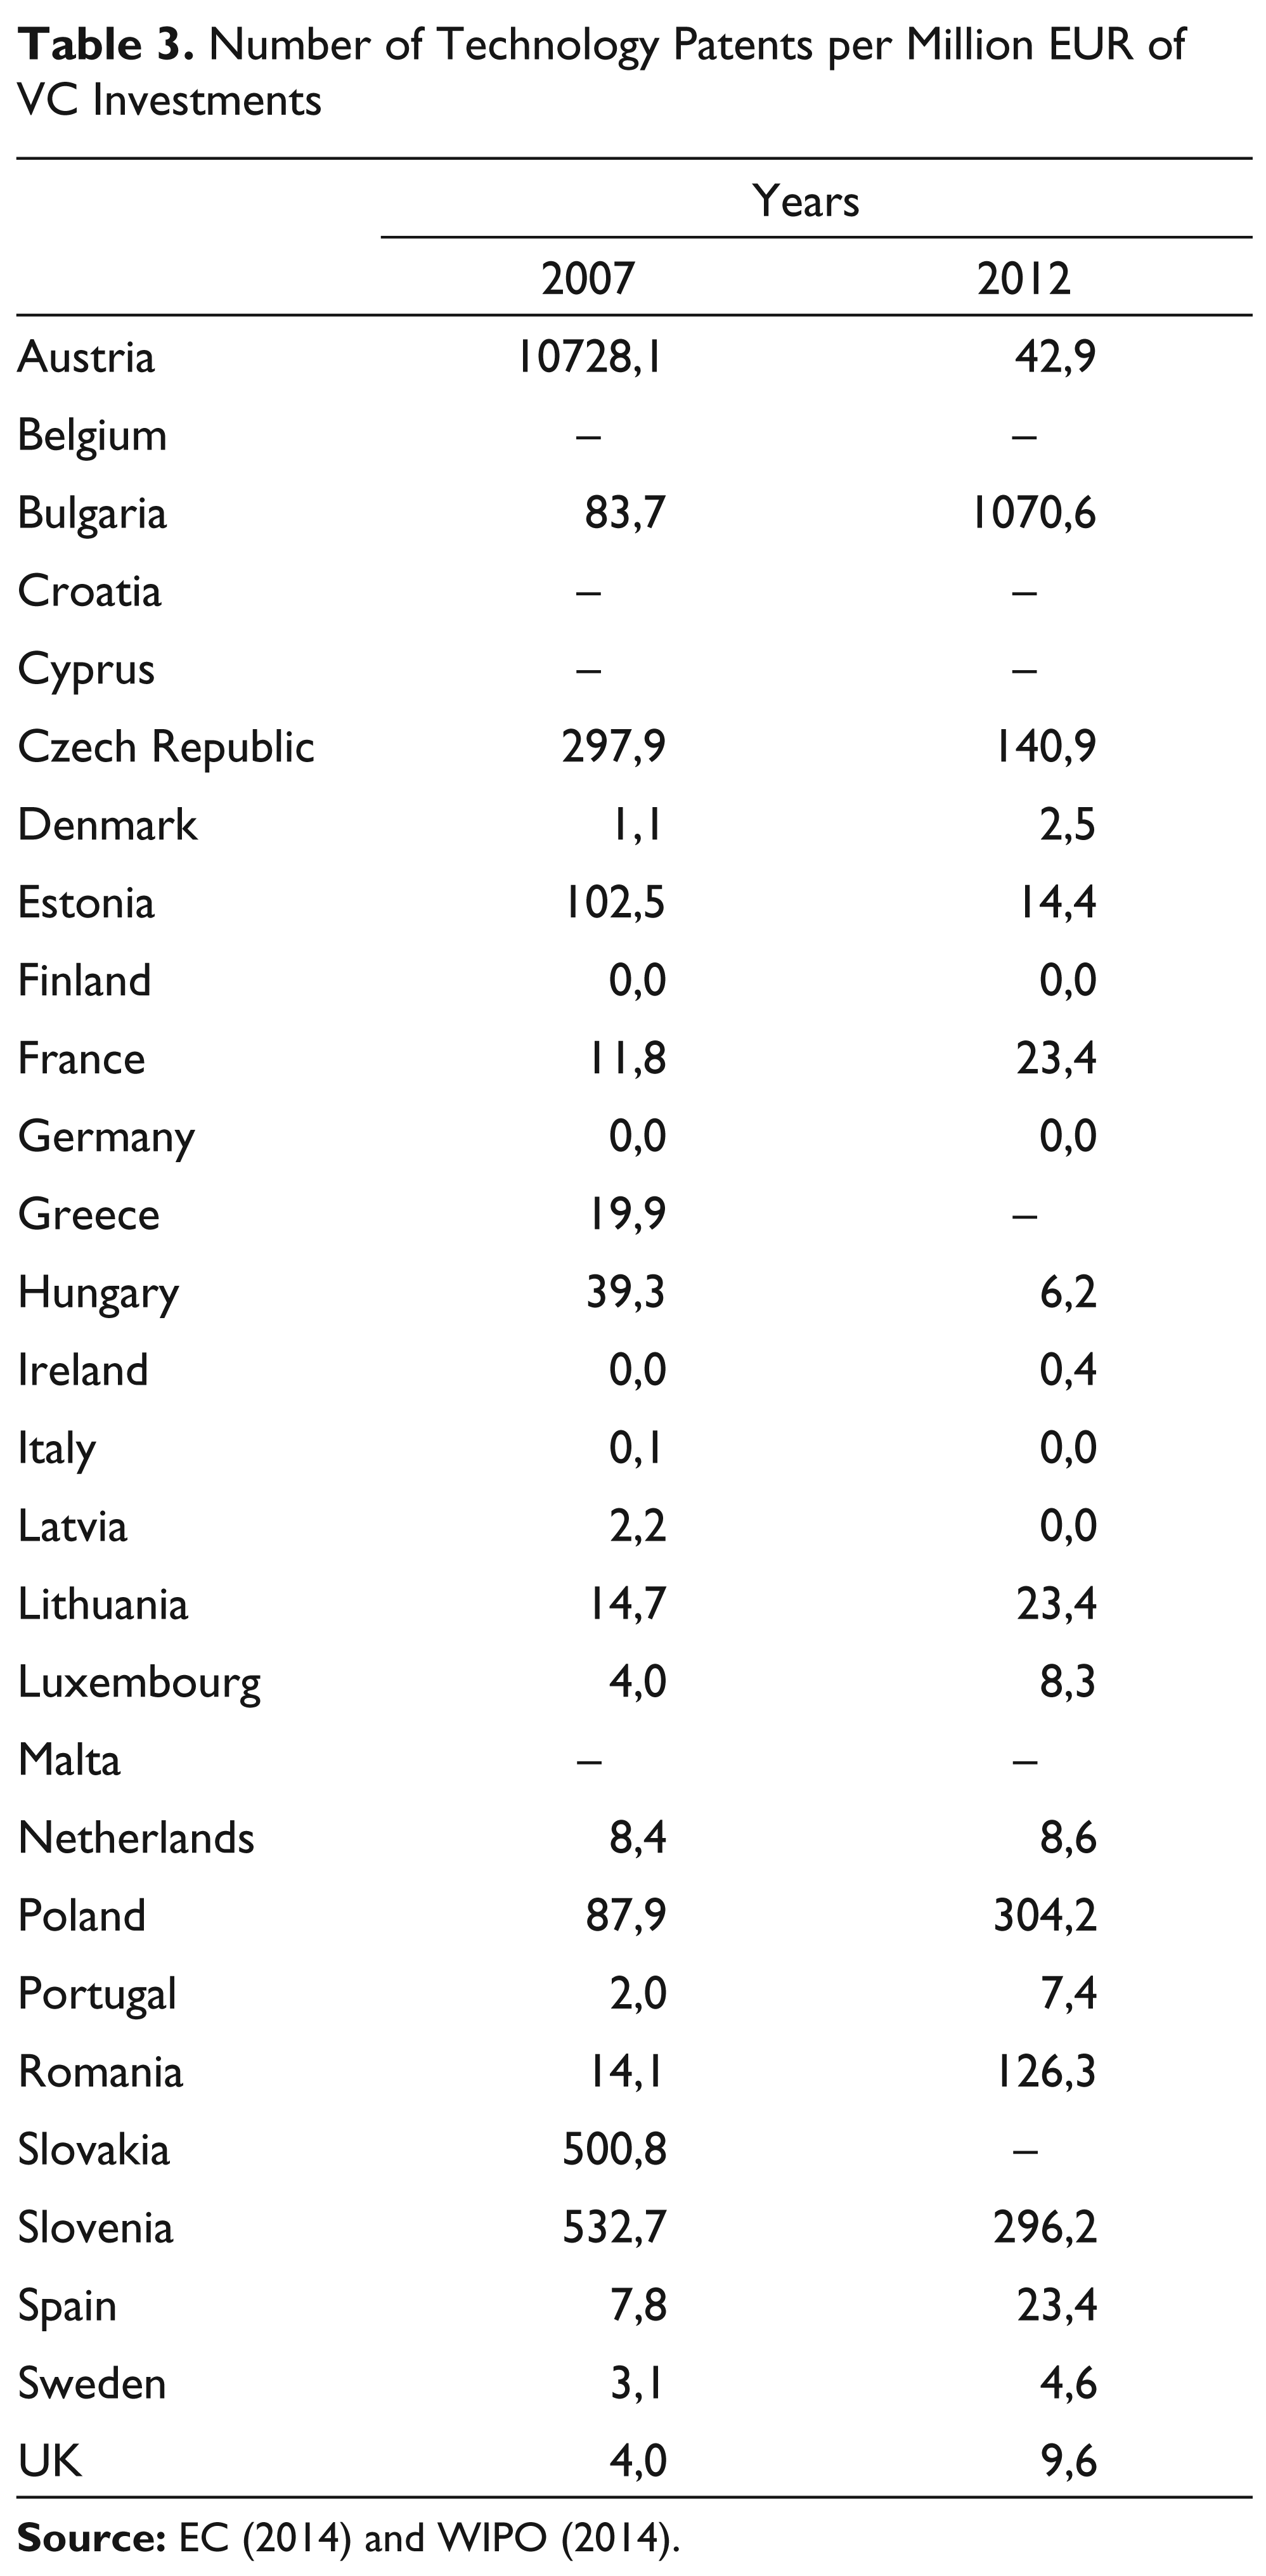
The indicator—number of technology patents per million EUR of VC investment—can reflect how effectively a venture capital (VC) is also allocated in the technology field. But again, countries with lower VC investment may have a higher share of technology patents. If we only compare the years 2007 and 2012, 8 then the results are as follows. In January 2007, The Seventh Framework Program started with the budget of about 55.5 billion EUR (2007–2013). While the annual 7th FP budget increased by about 100 per cent (2013/2007), the number of technological innovations decreased by 2 per cent (2013/2007). 9 The most technology patents per unit of VC investment recorded Austria in 2007 and Bulgaria in 2012. Slovenia, Slovakia and the Czech Republic also achieved good results in this area. Austria belongs among innovation followers within the EU, with the performance close to the EU-28 average. Within the Strategy for research, technology and innovation of the Austrian Federal Government (Era.gv, 2011), the country plans to become an innovation leader in the technology field in the EU. Relative strengths are in good R&D and education infrastructures. The positive results are also observed within international scientific publications and community trademarks. The Austrian research spending increased in the past decade from 1.94 per cent of GDP to 2.76 per cent (Era.gv, 2011). The main problems are in low non-R&D innovation expenditures and SMEs innovation and marketing activities (EC, 2013). In Austria, Denmark and Sweden more than 60 per cent of researchers is employed by business enterprises and higher education institutions. In Austria, Denmark and Germany, institutional R&D funding creates the principal mode, while the funds from abroad represent only 20 per cent of all business R&D investment. In terms of collaboration on innovation, large innovative firms collaboration rates range was more than 70 per cent in Austria, while among SMEs, the rate of collaboration was only 20–40 per cent (OECD, 2013).
The least technology patents per unit of VC investment paradoxically recorded developed economies such as Italy, Ireland and Denmark. In the EU countries, there were issued approximately 594 patents in 2007 and 117 patents in 2012 on average (per country) per million EUR of VC investments. We can also notice the decrease in the efficiency of the VC use in technology fields over these two years. The most of European venture capital comes from government resources. Although in recent years, a new group of European VC firms has been created. 10 The group has announced that they want to invest about 30 million EUR in start-ups in Europe (The Economist, 2013) (Table 3).
Number of Technology Patents per Million EUR of VC Investments
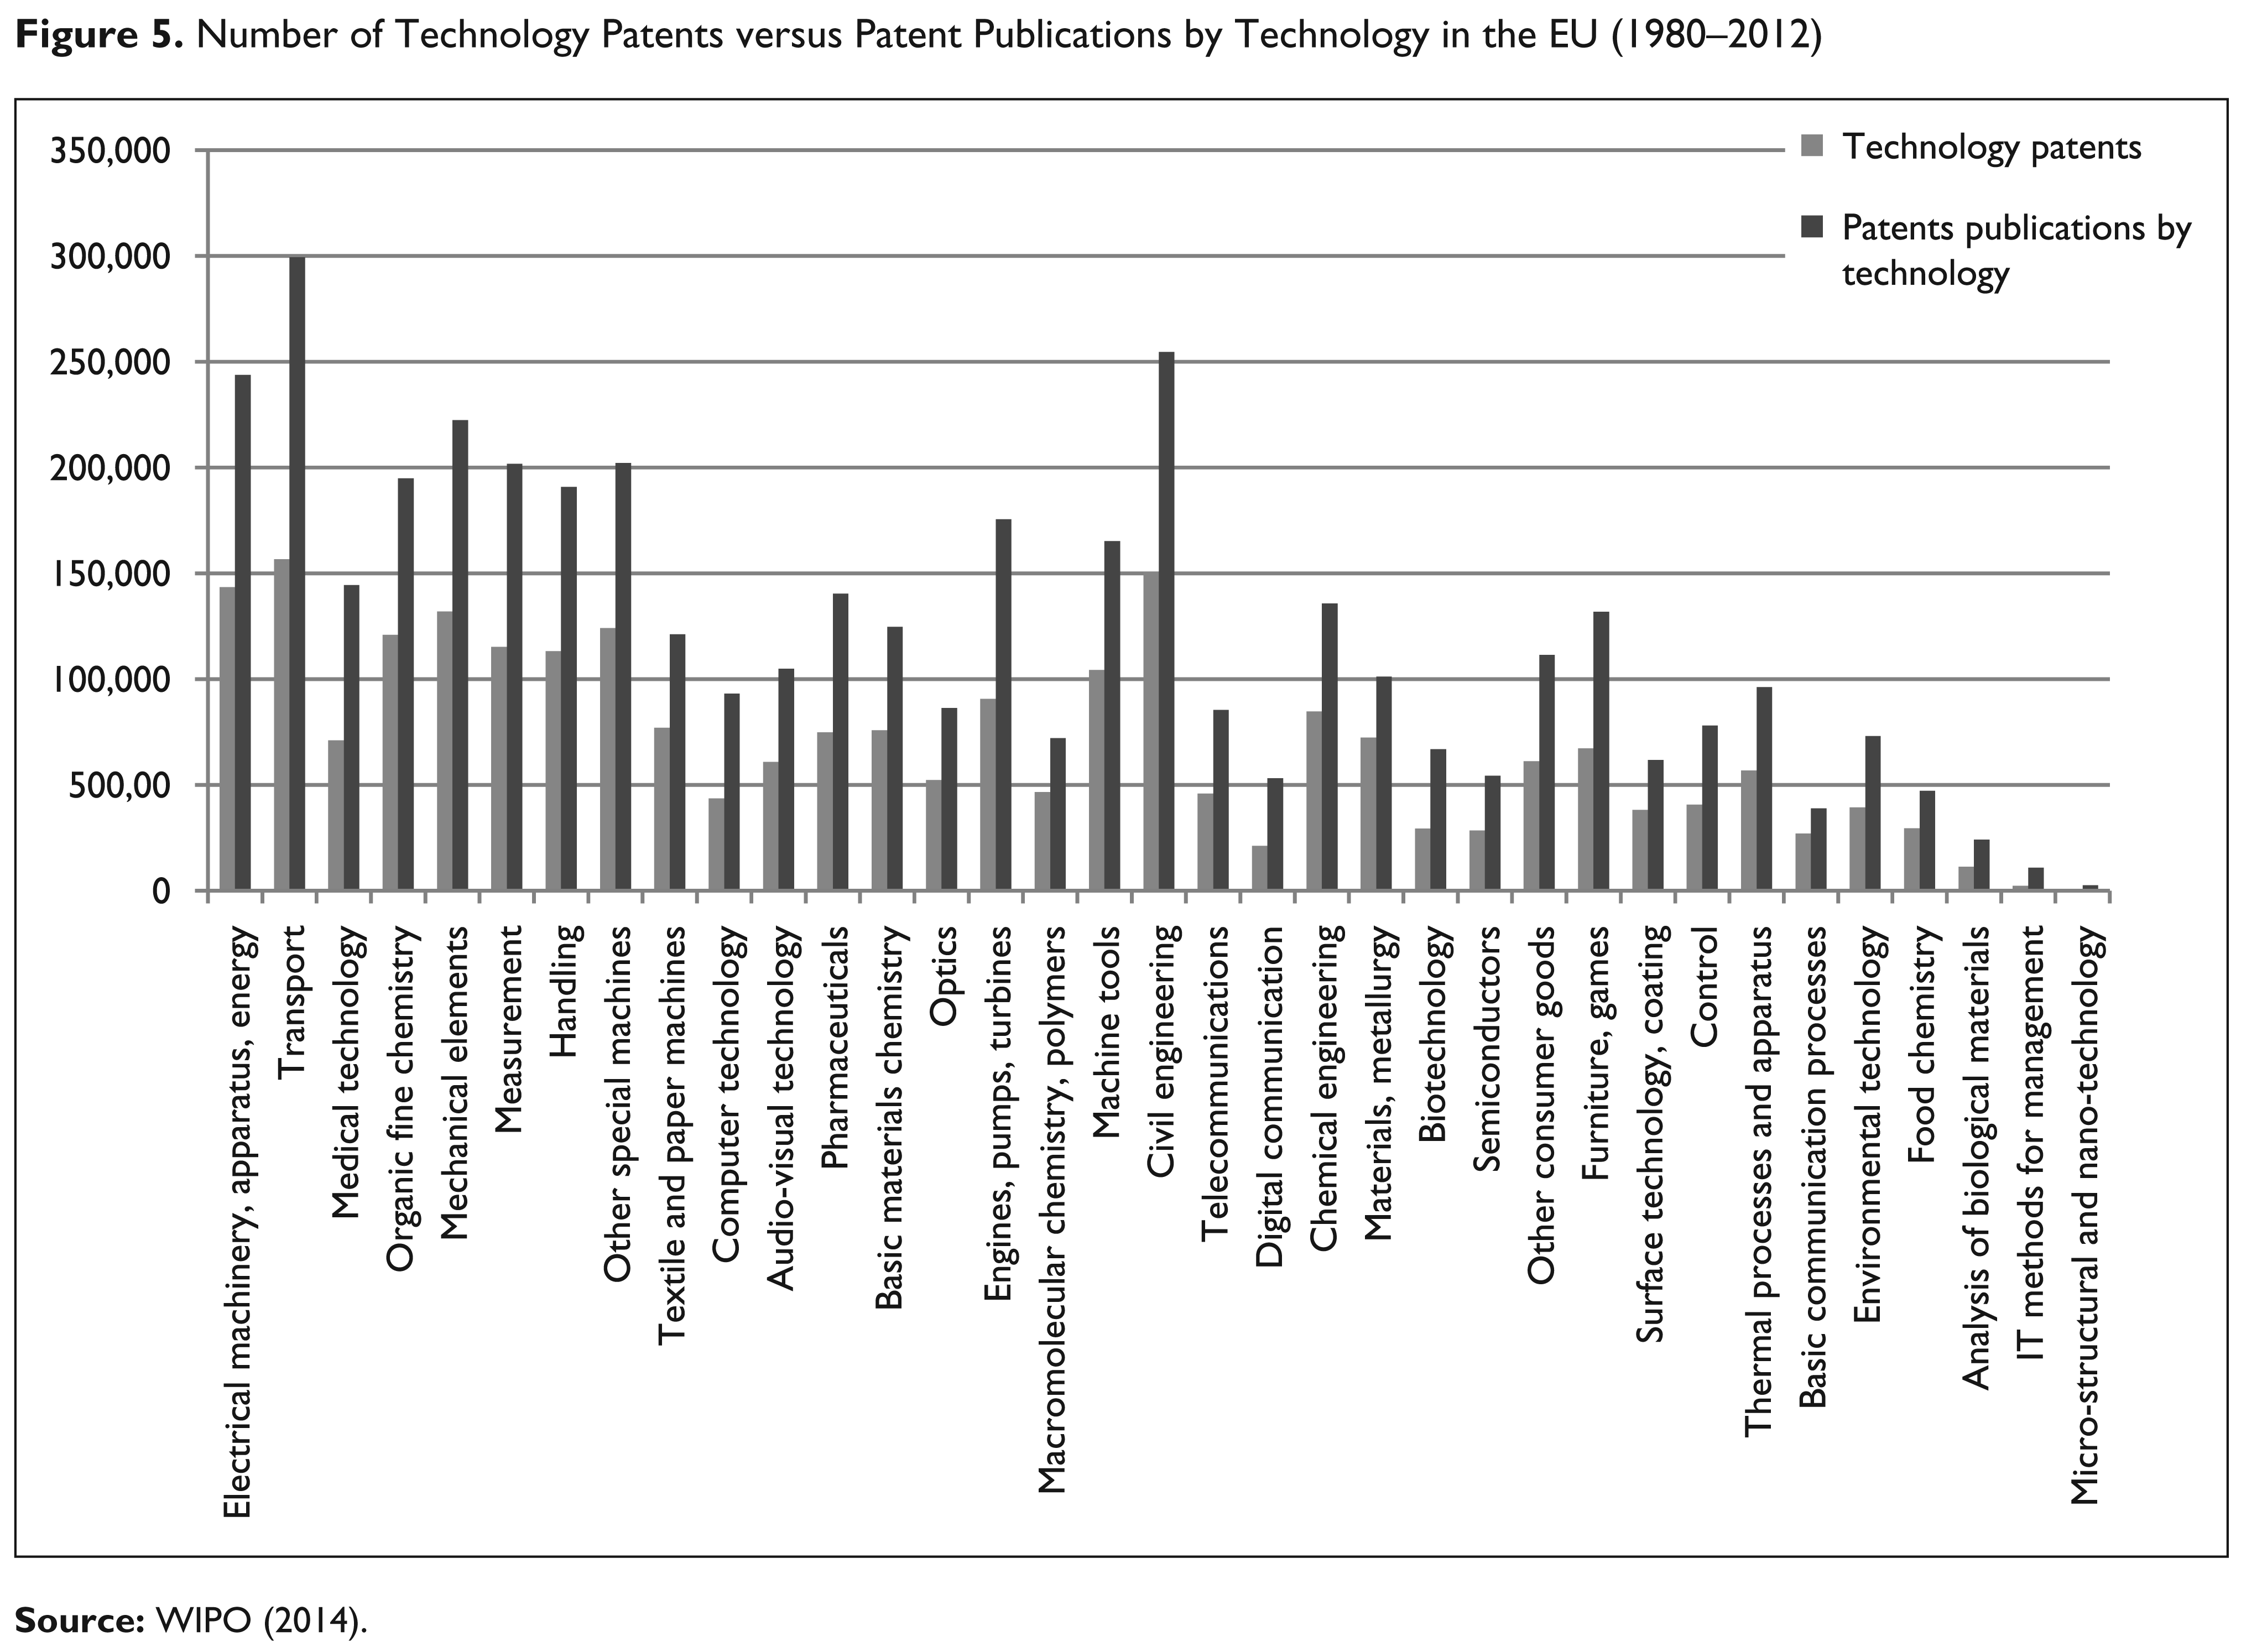
Based on the last indicator of this study: patent publications by technology (1980–2012), we can notice that the most publications had Germany, France and the UK. The least publications were recorded in Malta, Cyprus and Lithuania, which had the overall smaller number of granted technology patents. In terms of the development of patent publications by technology, the most publications were disclosed during the period 1980–1990, and at the least during the period 1991–2000. One of the reasons may be that since the early 1980s, the new PC revolution has impacted on many aspects of business practices as well as on technological innovation also in the EU. ICT have also accelerated high-tech development in many European countries. Although, the countries such as Croatia, the Czech Republic, Latvia, Lithuania, Slovakia and Slovenia did not record any patent publications by technology in the years 1980–1990, they were part of the communist bloc in Europe and thus highly isolated from the general technological progress. On average, we found 150,398 patent publications by technology during 1980–2012 in the EU-28 countries, while in the developed EU countries, it was 266,611 patent publications on average and in the developing EU countries, it was only 34,184 patent publications. Only five countries (FR, DE, IT, PL and the UK) achieved above average results in terms of this indicator. Among developing countries, it was only Poland which had above average results. The Gross domestic expenditures on R&D (GERD) were 0.74 per cent GDP in Poland in 2010, and the plan is to reach 1.7 per cent GDP by 2020. The Polish government funded about 64 per cent and companies about 24 per cent of GERD in 2010. This numbers are very similar to other developing countries of the EU. But, only 2.7 per cent of export in Poland created high-tech products that was the lowest share in the EU in 2009 (Nowak, 2009). Although, the number of technology parks and centres has tripled since Poland joined the EU in 2004 (OECD, 2012).
If we look at the technology patents that were the most published, these are Transport; Civil Engineering; and Electrical machinery, apparatus, energy. For example, the EC is preparing a strategic framework for transport innovation and deployment, based on the White Paper’s vision for an integrated, efficient, safe and environment-friendly European transport system by 2050. 11 The least published technology patents were Microstructural and nanotechnology; IT methods for management; and Analysis of biological materials. For example, one of the most innovative areas is IT methods for management, the problem is that the EPO receives more than 1,000 applications every year and only 30–50 per cent is granted. The other fast growing technologies in the EU are Nano-tech, digital communication and medical technology. It applies here that the most patented technologies are also the most published and vice versa. On average, it was 1.7 publications per a technology patent in the EU countries in the period 1980–2012 (Figure 5).
Conclusions
This study was focused on selected aspects of technological innovation/patenting in the EU in order to indicate selected trends and to encourage member states to more positive investment in sustainable technological development as the engine of economic and social growth. However, a patent is only one measure of innovation performance of firms, regions or countries. A patent must be transformed into new products, technologies or designs before it can be commercially successful. Most granted patents have small commercial significance, which is one reason why many companies do not decide to patent their innovations. Real competitive significance of patents can be related to factors like: uniqueness of innovation, cost control, alignment with a business strategy or a patent scope.
Source: WIPO (2014).
If we look at the results of the EPO (WIPO) patent database analyses (1980–2012), we can see that the most patented technologies in the EU are: Electrical machinery, apparatus and energy; Transport technology; and Medical technology. These technologies can be considered as ‘moderately demanding’ in terms of requirements for research and development. The least patented technologies are technologies for Analysis of Biological Materials; IT methods for management; and Micro-structural and nano-technology (NT). The main reason can be that many of these technologies are still an object of basic research and more demanding research and thus indefinite of an economic potential. Especially, the developing EU countries may have a problem to transfer their inventions into commercial products. In the period 1980–1990, there was the increase of technology patents by about 116 per cent; during 1990–2000, it was only 1 per cent; and in the period 2000–2012, it was about 59 per cent. In total, the EPO registered 1,167,830 technology patents during 1980–2012, which is about 48 per cent of all technology patents issued within the EU countries. It applies here that the most patented technologies were also the most published and vice versa.
If we look at the number of technology patents registered within national patent offices of the EU (1980–2012), then in all areas of technology patenting in the EU dominate Germany, France and the UK. Germany is one the most innovative country in terms of patents after the USA, China and Japan. In total, the EU countries recorded 2,410,787 patents registered within the national patent offices, while the developed countries recorded 2,089,430 (87 per cent) and the developing countries recorded only 321,357 patents (13 per cent) in the period 1980–2012. In this period, the most patented technologies in the developed EU countries were Transport technologies (146,757 patents), Civil engineering (129,909 patents) and Electrical machinery, apparatus, energy (128,684 patents), especially in France, Germany and the UK. In the developing countries, there dominated Organic fine chemistry (34,566 patents), Pharmaceuticals (25,704 patents) and Civil engineering (20,846 patents). In the developed countries dominated industrial technology patents and in the developing countries dominated chemical technology patents. These results partly confirm our main hypothesis. But, the least patented technologies in the developed and developing EU countries were the same: Micro-structural and nano-technology, IT methods for management and Analysis of biological materials.
If we look at the more objective indicator: the number of technology patents (1980–2012) per 100,000 inhabitants, then the first place belongs to Luxembourg with 1699 patents per 100,000 inhabitants. The second place belongs to Sweden and the third to Finland, with 1031 and 882 patents per 100,000 inhabitants. In developing economies like Malta, Croatia and Lithuania, it was only 41–112 patents per 100,000 inhabitants. On average in the EU-28 countries, it was 447 technology patents per 100,000 inhabitants, while in the developed EU countries, it was 667 patents on average and in the developing EU countries, it was only 227 patents per 100,000 inhabitants in the period 1980–2012. Only 10 countries (AT, DK, FI, FR, DE, HU, IE, LU, SE and the UK) achieved above average results in terms of this indicator.
As for these results and our main hypothesis, for small open economies, like Luxembourg, Ireland, Croatia, Lithuania, Latvia, Slovakia or Slovenia, technology cooperation is highly based on the involvement of foreign partners. Many developed economies produce a significant share of technological innovation abroad, but only a small percentage of these inventions are owned by foreign companies. This is also highly conditioned by national and regional technology specialisation and support, opportunities for international cooperation and proximity to international knowledge centres. The public sector usually covers the most of R&D spending, but may not commercialise its innovation/technology properly and vice versa. The main problems of many small developing countries of the EU are: an unopened unattractive STI system, low business investment, high fragmentation of technology R&D, inappropriate linkages between innovation stakeholders, small risk capital investment or weak protection of intellectual property. The main focus of R&D investment is usually on basic research while maintaining a legacy superstructure of research institutes and universities.
Technology/innovation investments, however, cannot be measured only as the share of R&D expenditures on GDP. This indicator may not reflect the intensity of the technology development of the region/country. If we compare the number of annual average technology patents per 1 billion EUR of the national GDP, then the leading positions belong to developing countries. Moreover, while the annual 7th FP budget increased by about 100 per cent (2013/2007), the number of technological innovation decreased by 2 per cent (2013/2007). We could also notice the decrease in the efficiency of the VC use in technology fields in many countries. The most of European venture capital comes from government resources. Technological innovation, especially in the developing countries of the EU should be financed by the rotation of financial instruments, such as bank loans, venture capital, business angels capital, private business loans, subsidies, not only by project EU funds. Technology development in the EU countries should be smartly specialised based on specific features and advantages of the different regions. It should be clearly specified in the national S&T strategies, plans and budgets, which are the key technologies that we want to support and what is the role of each country in the complex technology development of the EU. It is also necessary to substantially reduce bureaucracy associated with technology development, fundraising, warranties, patenting, licensing, etc. There is a need to constantly support more purposeful technology cooperation, so-called the innovation infrastructure between the Member States, to remove duplication in R&D, to support small innovative companies and regions, for example, by tax incentives, which could bring new impulses also for developed member states, etc. However, these are already topics for further research.