
Abstract
The present study explored the determinants affecting service quality of solar product dealers. The study is based on primary data, collected from a total of 345 solar pump users from different villages and rural areas of Punjab. Exploratory factor analysis, confirmatory factor analysis, and paired sample t-test have been used to examine the data. Furthermore, the SERVQUAL scale has been used to measure the service quality of solar product dealers. Paired sample t-test was used to measure the users’ expectation and perception gap between service quality dimensions. The results validated that five factors namely reliability, responsiveness, assurance, empathy, and tangibility influence service quality of solar product dealers and there is no significant difference between perceptions and expectations of solar product users except for the responsiveness dimension. As far as gap analysis is concerned, the dimension ‘responsiveness’ was responsible for the highest gap score. So, perceptions of solar product users are not fully being met with their expectations.
Keywords
Introduction
As per the World Energy Council (2013), there exists a population of around 1.2 billion which is having access to electricity. It is estimated that the world energy demand will rise to 44 per cent between 2005 and 2030 (Machado, Alexandra, & Fortunato, 2018; Siddik & Kabiraj, 2018; Silva et al., 2018). Coal, petroleum and oil form the largest part of fulfilling the global energy demand but as these sources are limited, these will extinguish in the near future (Chen, 2001; Cosimo, 2018; Kim & Choi, 2005). With the setting up of more power plants for generating energy to cope up with the demand, there is a resultant increase in the emission of greenhouse gases (GHGs) including carbon dioxide (CO2) and fly ash which is responsible for a number of health issues with people these days (Jiangwei, 2018; Kim & Choi, 2005; Uberoi, 2007). According to Birol (2007), there exists a twin energy-related problem around the globe; that of environment degradation because of in-effective consumption of energy and insufficient supply of energy respective to the demand. The different energy generating technologies include hydro plants creating problems of displacement of people from the area and disturbing the ecosystem (Chen, 2001; Siddik & Kabiraj, 2018; Uberoi, 2007). Nuclear energy have major waste disposable and decomposition issues. However, solar energy witnesses to be the best alternative being clean and abundantly available (Jiangwei, 2018; Lai & Cheng, 2016). The primary factors to be considered for installation of solar products include the initial cost and the maintenance cost of solar energy products (Chen, 2001; Cosimo, 2018; Mostafa, 2007).
In a developing country like India, there are 86,000 villages which are using kerosene for lighting purposes (Adelekan, 2012; Lai & Cheng, 2016; Tove, 2017). They spend US$ 8 per month on this while a 70-watt solar can produce the electricity in monthly instalment of US$ 5 (Jiangwei, 2018; Lai & Cheng, 2016; Pavel & Rajagopal, 2017). For the awareness and growth of solar energy systems, it is important to reduce the cost technologically in order to make it feasible for purchase (Siddik & Kabiraj, 2018; Uberoi, 2007). The three parameters for understanding the relevance of these products include scalability, influence on environment and the price factor (Cosimo, 2018). It can be stated here that solar energy is so significant that the daylight received in an hour from sun is more than the energy required by every individual in one year (Adelekan, 2012; Chen, 2001; Pavel & Rajagopal, 2017). Moreover, earth receives around 178,000 terawatts (TW) of energy from sun in a year (Jain & Kaur, 2006; Wei, Chiang, Kou, & Lee, 2017). International Energy Agency (2010) stated that securing the environment with effective use of energy keeping cost under control are the key objectives of the nations around the world. It requires the contribution of stakeholders worldwide in order to put efforts towards energy implication and development (Cosimo, 2018; Mostafa, 2007; Pandey, 2007; Wei et al., 2017).
Different Types of Services Provided by Solar Energy Product Dealers
Pre-Sales Services
Pre-sales services assure customers to receive complete information about solar products and other information related to operating principles, operation requirements, benefits and drawbacks, usage limitations, the efficiency of appliances and quality principles (Gallagher, Mitchke, & Rogers, 2005; Molenaar, Huijben, Bouwhuis, & Brombache, 2002; Saccani, Songini, & Gaiardelli, 2006). As a result, customers can make decisions about the purchase of the solar systems (Levitt, 1983; Shields & Young, 1991). Nowadays, most of the companies are shifting from being product centric to knowledge and information centric and this has become success factor for the companies (Iansiti & Mac, 1997; Owlia & Aspinwall, 1996). Solar product dealers guide customers through the selection of solar system that best suits the customer’s current and future energy requirement (Drucker, 1993; Nonaka, 1991; Saccani et al., 2006; Waeyenbergh & Pintelon, 2002). Solar product suppliers only conclude final sale of system after following conditions are met:
When consumer is fully aware of the product specifications and product energy generation potential All required components of solar system are available in the stock A solar system warranty contract with terms and conditions Planned dates for precautionary maintenance (Levitt, 1983; Owlia & Aspinwall, 1996).
Solar products go through an acceptance process of the customer prior to operation to evaluate that includes customer receiving operation and installation instructions (Abdullah, 2006; Saccani et al., 2006). Installations of solar system are only performed by qualified technicians within 10 days from its purchase date to ensure proper installation and working of these systems (Iansiti & Mac, 1997). Suppliers perform the commissioning process of solar system at the end of installation that includes: measurement of solar panel voltage, solar system’s circuit current and maximum power under direct solar radiation where photovoltaic (PV) panel is installed; verification of all connections of solar system; testing of power loads for proper operation; and testing of electrical protection (Crosby, 1984; Ellram, 1995; Iansiti & Mac, 1997; Juran, 1988; Magretta, 1998; Saccani et al., 2006; Thoben, Jagdev, & Eschenbacher, 2001).
After-Sales Services
After solar system installation and commissioning, suppliers continue to assist customer during regular maintenance scheduled activities as well as during solar system troubleshooting requests occur at no additional charge during the warranty period of the solar system (Iansiti & Mac, 1997; Levitt, 1983; Wise & Baumgartner, 1999). After-sales services are the potential source of competitive advantage (Ellram, 1995; Kaplan & Norton, 1992). Therefore, most of the manufacturing companies provide after sales services (Frambach, Wels-Lips, & Gundlach, 1997; Keegan, Eiler, & Jones, 1989). It includes warranty terms and conditions, on-going support to customers, and maintenance and service of solar systems (Kaplan & Norton, 2004; Neely, Adams, & Kennerley, 2002; Olve, Roy, & Wetter, 1997).
Objectives of the Study
To explore the service quality determinants of solar product dealers.
To analyse the service quality gap between expectations and perceptions of solar product users with respect to the solar product dealers in Punjab.
Theoretical Background and Hypotheses Formulation
Until now, various studies have used SERVQUAL scale for examining the service quality of different service sectors and organisations. To find out the service quality gap between expectations and perceptions of solar product users for solar product dealers, hypotheses were formulated. SERVQUAL scale consists of five dimensions which are as follows:
H1: There is no significant gap between expectations and perceptions of solar product users for dimension ‘reliability’.
H2: There is no significant gap between expectations and perceptions of solar product users for dimension ‘responsiveness’.
H3: There is no significant gap between expectations and perceptions of solar product users for dimension ‘assurance’.
H4: There is no significant gap between expectations and perceptions of solar product users for dimension ‘empathy’.
H5: There is no significant gap between expectations and perceptions of solar product users for dimension ‘tangibility’.
Research Gap
India is a developing country and there exists a great scope for the new technologies that can be adopted by the companies and the residents to make way for a growing and sustainable country (Jain & Kaur, 2006; Kim & Choi, 2005; Machado et al., 2018; Siddik & Kabiraj, 2018). This has led to the introduction of solar off-grid having a high opportunity of application especially in rural/remote areas (Chen, 2001; Jiangwei, 2018; Kim & Choi, 2005). Since there are approximately around 400 million people in India having no access to electricity, solar energy has high potential as an alternative to precious fossil fuels resources (International Energy Agency [IEA], 2010). The use of solar energy products holds even more significance with the rising level of depletion of fossil fuels on one hand and on the other hand, realising the awful impact of using the fossil fuels, especially depletion of ozone layer, increasing cost, global warming and environment degradation (Cosimo, 2018; Pandey, 2007; Siddik & Kabiraj, 2018; Silva et al., 2018; Tove, 2017; Uberoi, 2007). According to the International Research Institute for Climate and Society (2017), year 2016 was recorded as the warmest year since nineteenth century. Hence, this has created an alarming situation for a shift towards eco-friendly and renewable energy resources. Although various studies have been conducted on solar products around the world, very few studies have been conducted on service quality of solar product dealers in India. Amongst the few studies such as Ladhari (2009); Beamish and Ashford (2007); Abdullah (2006); Parasuraman (2002); Loiacono et al. (2002); Kaynama and Black (2000); Gronroos (2001); Hoffman and Johns (1997); Johns (1999); Owlia and Aspinwall (1996); Magi and Julander (1996); Cronin and Taylor (1992); Juran (1988); Crosby (1984); Zeithaml (1981); Oliver (1980) examined the service quality in four different service sectors. However, neither of them have considered the various services quality determinants of solar product dealers. Furthermore, this research is a comprehensive study, since very less work has been done on service quality of solar product dealers. Hence, this research will give significant data on determinants of service quality of solar product dealers.
Database and Research Methodology
The study is designed using primary data collected from 345 solar pump users in the rural areas and villages of Punjab. A well-structured, pretest research schedule was used for interviewing the respondents in the three main regions of Punjab, namely, Malwa, Majha and Doaba that were selected for data collection. The respondents were approached through convenience as well as judgmental sampling. A total of 345 solar submersible pump users belonging to different age groups, gender, education qualification and income level were contacted for data collection. The data from respondents was collected during the period of May 2015–May 2017. The responses were collected using a seven point Likert scale from strongly agree to strongly disagree (Likert, 1932).
Construction of the Research Schedule
In item generation step, study identified the distinct items that are to be used to measure each dimension of service quality of solar product dealers. An extensive literature survey of earlier studies related to the service quality was carried out for the generation of items. After reviewing the previous literature, modified SERVQUAL scale developed by Parasuraman et al. (1988) was used. Exploratory factor analysis (EFA) has been used to refine the modified scale and confirmatory factor analysis (CFA) has been used to examine the strength of the developed scale (Hair, Black, Babin, & Anderson, 2015). Prior to the item generation with the help review of the literature, meeting with the experts and users were also consulted for making construct more effective. Apart from it, a pilot survey of 120 respondents was conducted. In the following section, the items included in scale have been discussed. SERVQUAL scale was developed by Parasuraman, Zeithaml, and Berry in 1985, and later in 1988, the authors modified scale to five dimensions with only 22 final items.
Conceptual Model for Measuring Service Quality
The SERVQUAL scale is a tool used for measuring the quality of service of any organisation (Parasuraman et al., 1985). SERVQUAL scale is implied to estimate the expectations of the customers towards a service quality and customers’ perception for the service of the organisation (Abdullah, 2006; Magi & Julander, 1996). The scale is formed using five dimensions of service quality, that is, assurance, reliability, empathy, responsiveness and tangibility (Abdullah, 2006; Ladhari, 2009; Owlia & Aspinwall, 1996). Parasuraman et al. (1985) developed the SERVQUAL scale of service quality for the first time for a study on four service sectors including credit card services, telephone services, retail banking and maintenance of electrical appliances. The scale identifies five gaps in service, that is, the gap between customers’ expectations and management perceptions; the gap between management perceptions and service specifications; the gap between service quality specifications and service delivery; the gap between service delivery and external communication; and the gap between customer expectations and management perceptions which make the quality of service unsuccessful (Abdullah, 2006; Cronin & Taylor, 1992; Gronroos, 2001; Juran, 1988; Parasuraman et al., 1988; Zeithaml, 1981).
Demographic Profile of the Respondents
As far as the educational qualification is concerned, 42.03 per cent respondents belong to higher secondary; 28.11 per cent to matriculation; 22.61 per cent to graduation and 7.25 per cent to post-graduation. As per income, 55.65 per cent belong to income category of ₹600,001–800,000 followed by 35.36 per cent to income segment of ₹400,001–600,000. Only 3.77 per cent belong to income less than ₹400,000 and 5.22 per cent lie in income category of above ₹800,001. As per region, 113 (32.8%) respondents are from Doaba, followed by 107 (31%) respondents from Majha and 125 (36.2%) from Malwa region of Punjab. As per profession, all the respondents are involved in the agriculture sector and using solar submersible pumps for irrigation purposes.
Data Analysis and Discussion
Principal component method of factor analysis technique has been applied to identify the factors that affect service quality of solar product. After applying EFA, a total of 22 items were reduced to five factors. The value of Cronbach’s alpha came out to be 0.827, which is meeting the qualifying cut off criteria of 0.6, stating that data is suitable for further analysis (Hair et al., 2015; Rovai, Bakar, & Ponton, 2013; Schuessler, 1971). The Kaiser-Meyer-Olkin (KMO) measure is 0.842 which describes that the sampling is satisfactory and appropriate for factor analysis (Bollen, 1989; Byrne, 1998; Kaiser, 1974; Schuessler, 1971; Suhr, 2006).
KMO and Bartlett’s Test

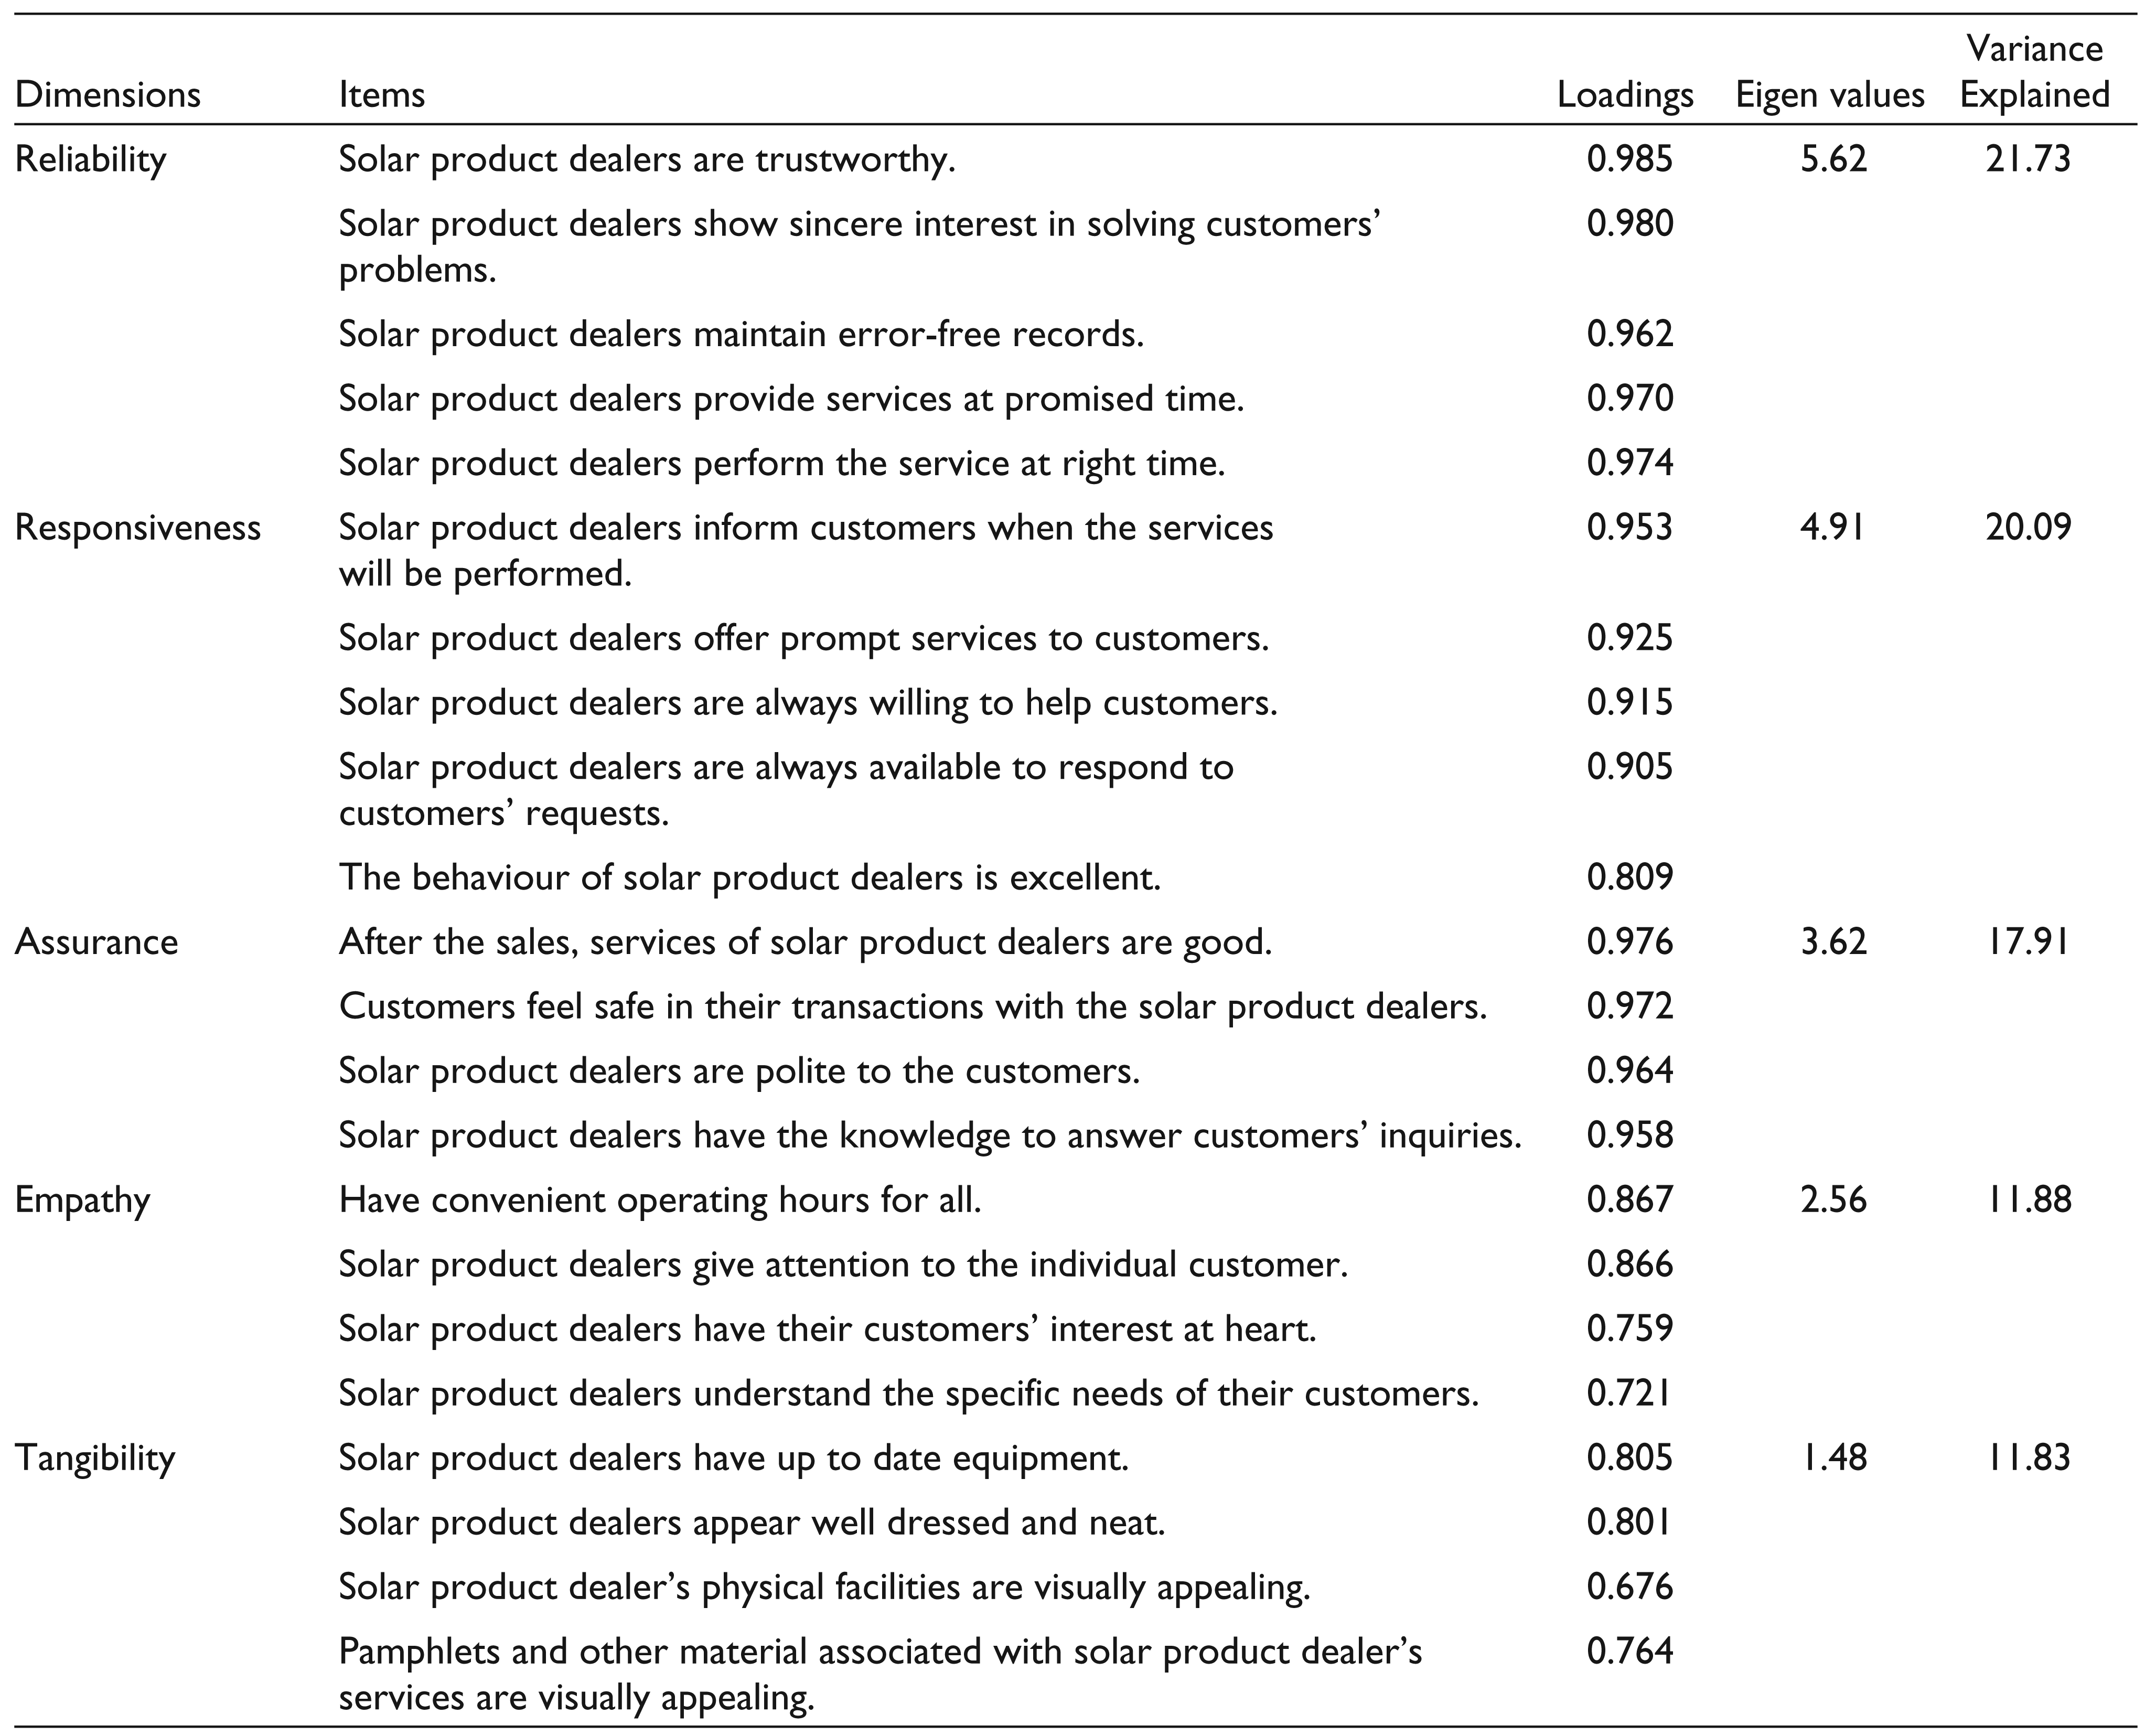
In the present study, total variance explained is 82.745 per cent and the study lost only 17.255 per cent of the information contained in data (Achen, 1982; Fazlina, Jusoh, & Wan, 2010; George & Mallery, 2003; Hair et al., 2015; Rovai et al., 2013). Table 2 describes that there are only five factors that have eigenvalues more than one. Table 1 described that all the 22 items are grouped into five factors and achieved recommended loading of more than 0.6 representing highest factor loading (Achen, 1982; Babyak & Green, 2010; Costello & Osborne, 2005; Fazlina et al., 2010; Gatignon, 2010; George & Mallery, 2003).
The summarised results of factor analysis have been shown in Table 2 depicting that the first dimension, ‘reliability’ comprises of five items relating to service quality of solar product dealers and explains that there is 21.736 per cent of variation of the data, with an eigenvalue of 5.625. Second factor highlights the need of ‘responsiveness’ in service delivery. It explained 20.096 per cent variation in the data, having an eigenvalue of 4.910. The third dimension, ‘assurance’ was responsible for 17.192 per cent of variation, having an eigenvalue of 3.627. Fourth dimension, ‘empathy’ explained 11.883 per cent variation in data with an eigenvalue of 2.561. The fifth factor ‘tangibility’ consists of four items with 11.837 of total variance and 1.482 eigenvalue. So overall, it may be concluded from the factor analysis results that all dimensions such as reliability, responsiveness, assurance, empathy and tangibility denote significant influence on service quality of solar product dealers. First three factors explain 59.025 per cent of total variance. Fourth factor explains 11.883 per cent variance and all factors together explain 82.745 per cent of variance.
Rotated Component Matrix
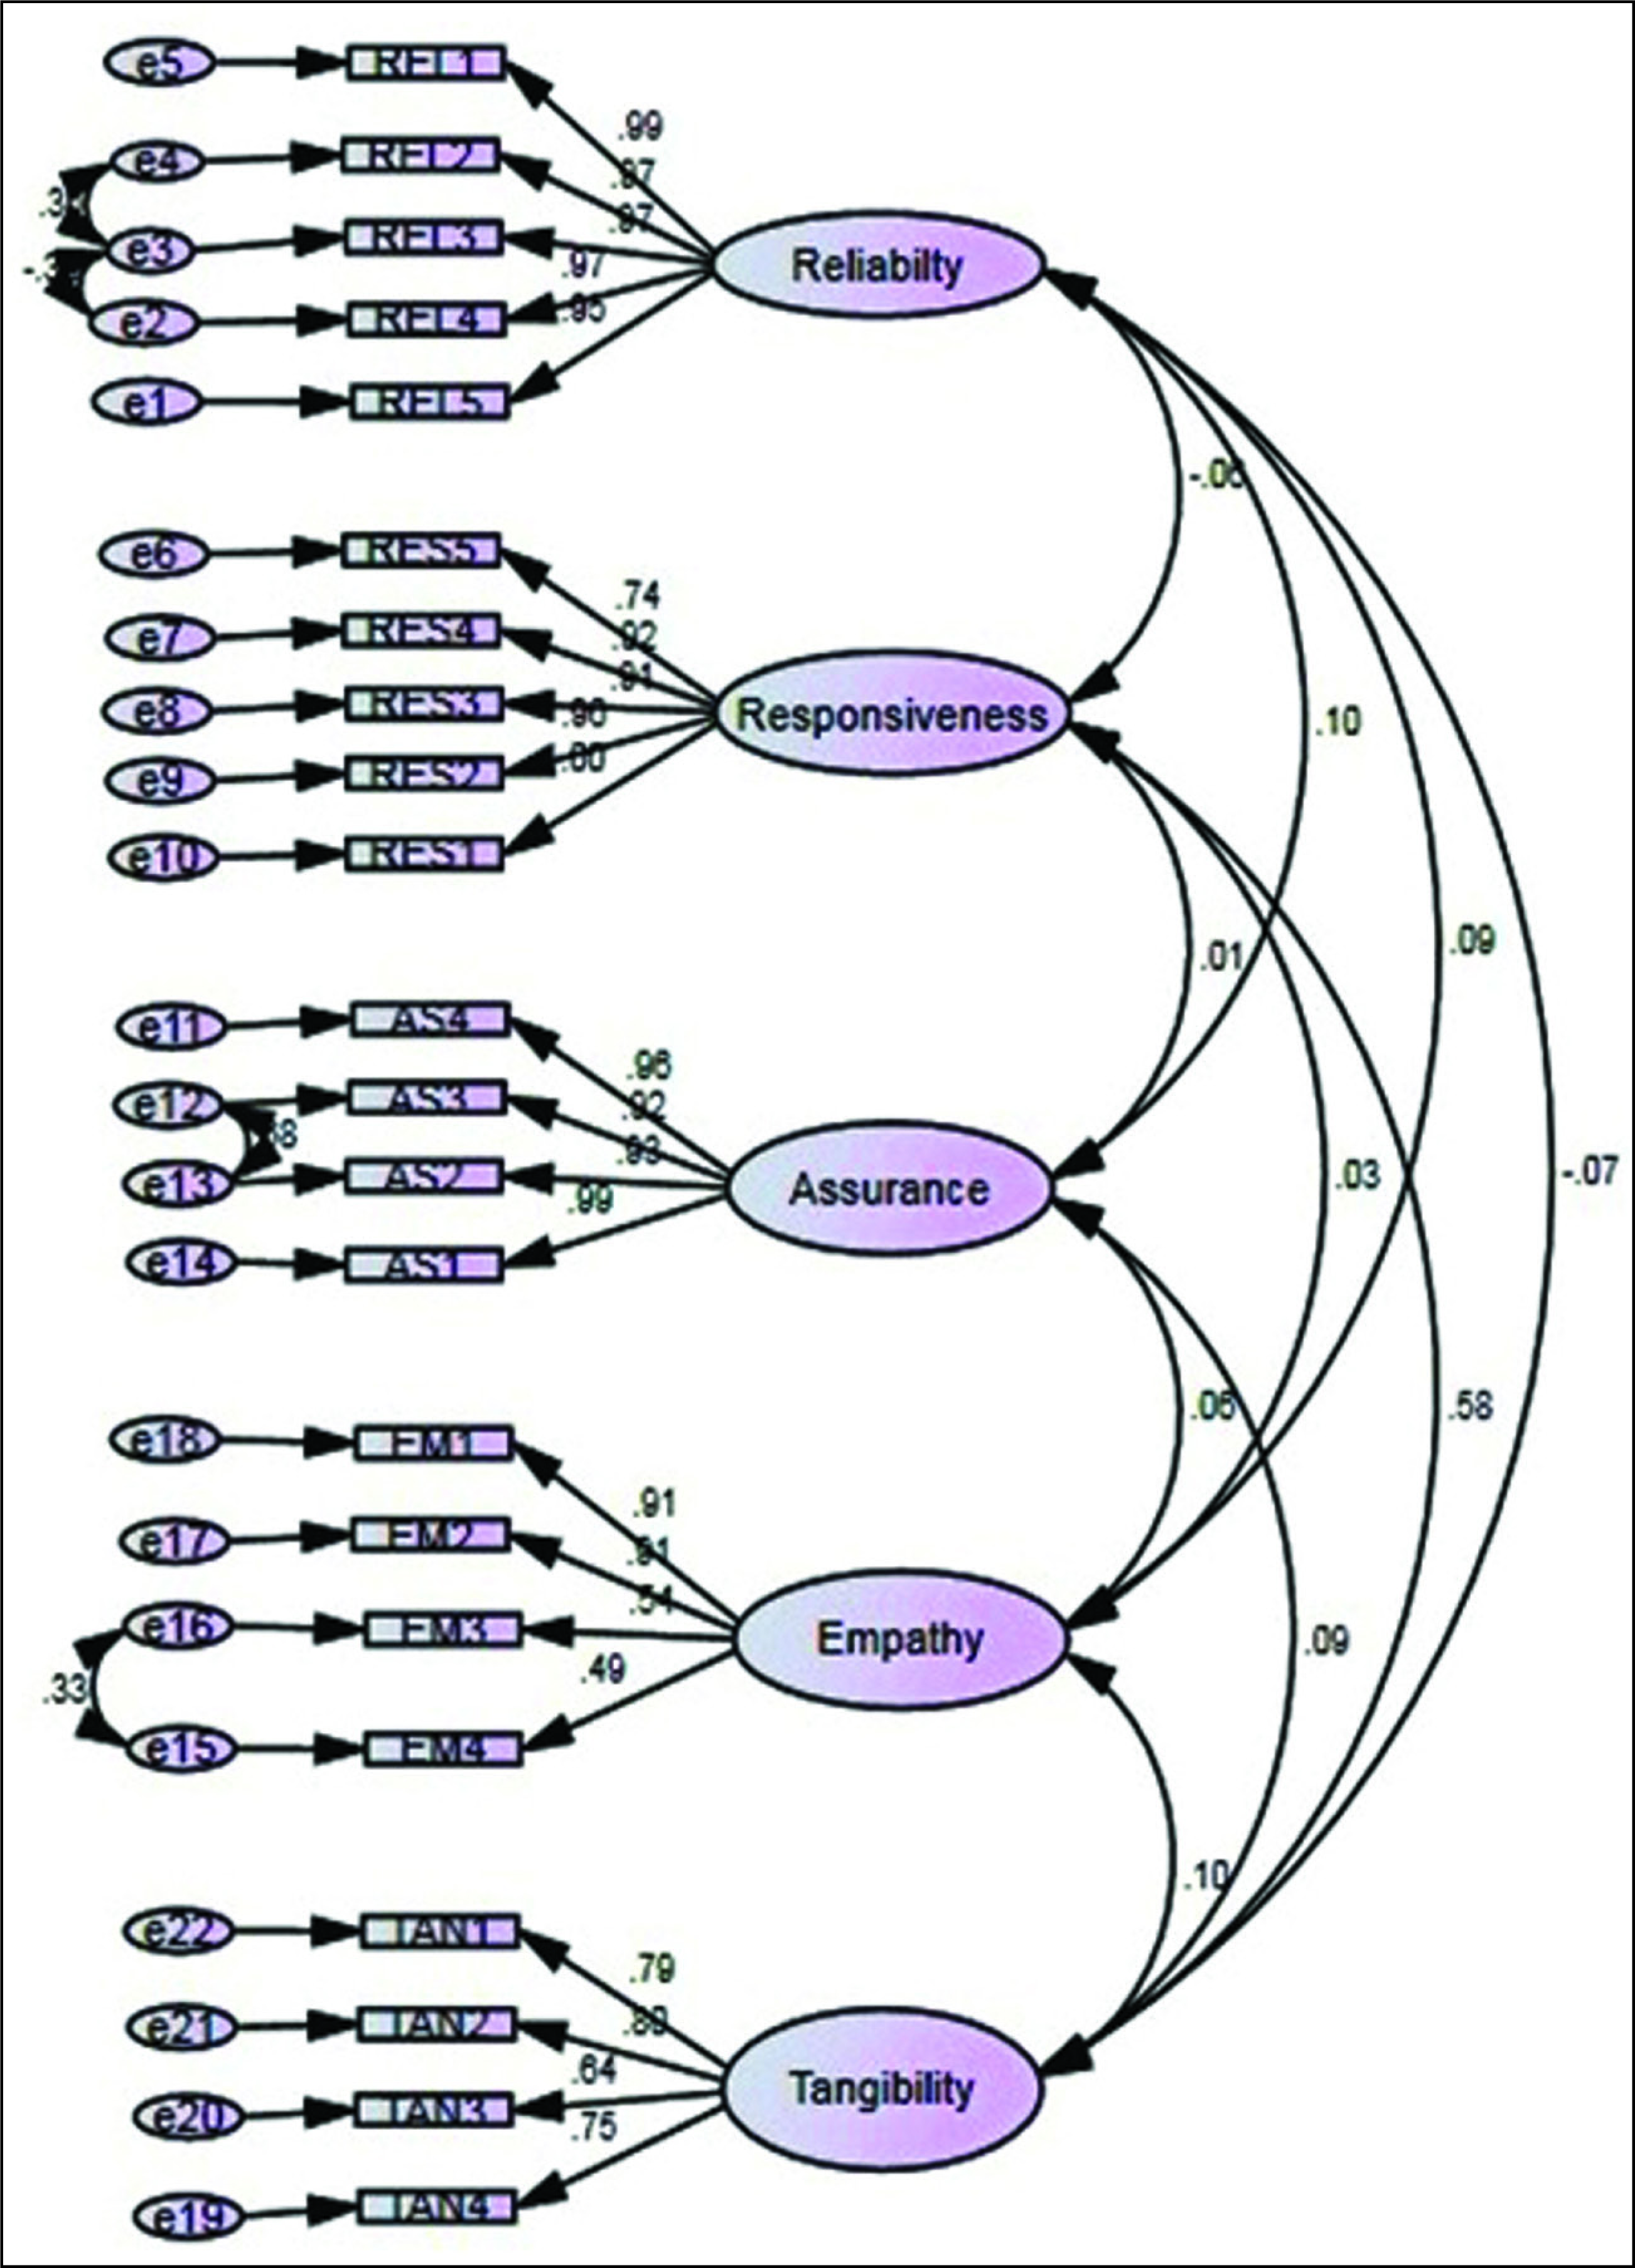
Measurement Model of Goodness-of-fit Statistics

The measurement model was found to be valid in terms of discriminant validity. Results shown in Table 4 conclude that there is no validity concern (Cooper & Schindler, 2008; Creswell, 1994; Hair et al., 2015; Hu & Bentler, 1999; Kline, 2011; Rovai et al., 2013). So, the findings of the analysis provide proof that all the five dimensions have influence on the service quality of solar product dealers.
Discriminant Validity

The Service Quality Gap between Expectations and Perceptions
Firstly, mean scores for expectations and perceptions were calculated and their difference was taken as gap. According to Parasuraman et al. (1988), it is, however, common that a negative gap score is created when the consumers’ expectations exceed actual service perceived (perception–expectation). The result of perception and expectation gap for before- and after-sales service quality of solar product dealers have been shown in the Table 5.
Results of Paired Sample T-test

Hypotheses Testing
H1: There is no significant gap between expectations and perceptions of solar product users for dimension ‘reliability’.
H2: There is no significant gap between expectations and perceptions of solar product users for dimension ‘responsiveness’.
H3: There is no significant gap between expectations and perceptions of solar product users for dimension ‘assurance’.
H4: There is no significant gap between expectations and perceptions of solar product users for dimension ‘empathy’.
H5: There is no significant gap between expectations and perceptions of solar product users for dimension ‘tangibility’.
Discussion of Outcomes
The p-value (0.180) > 0.05 and tTab(2.776) > tCal(1.621) for df = 4. Thus, the tabulated t-value and p-value is greater than calculated value and 0.05 concluding that there no significant gap lies between expectations and perceptions for reliability dimension. In case of second dimension, ‘responsiveness’ p-value (0.027) < 0.05 and tTab(2.776) < tCal(3.399) for df = 4, hence, calculated t-value is greater than tabulated t-value and significance value is less than 0.05. Therefore, results conclude that a statistically significant difference lies between the means of expectations and perceptions for responsiveness dimension for the service quality of solar product dealers. Moreover, the p-value (0.149) > 0.05 and tTab(3.182) > tCal(1.929) for df = 3, due to the means of expectations and perceptions and the directions of t-value research conclude that no statistically significant gap lies between expectations and perceptions for assurance dimension. Similarly, in the case of empathy dimension, p-value (0.071) > 0.05 and tTab(3.182) > tCal(2.751), df = 3 and for tangibility, the p-value (0.139) > 0.05, tTab(3.182) > tCal(2.004) for df = 3. For both aforementioned dimensions, the calculated t-value is less than tabulated t-value and p-values are greater than 0.05. As a result, present research concludes that that there is no statistical gap between expectations and perceptions for empathy and tangibility dimensions for service quality of solar product dealers.
The results in Table 5 showed that there is no significant difference between perception and expectation of solar product users except for the dimension ‘responsiveness’. As far as gap analysis is concerned, the dimension ‘responsiveness’ was responsible for the highest gap score. So, perceptions of solar product users are not fully being met with their expectations (the gaps indicate that the perceptions are lower than their expectations). In order to fill this gap, solar product dealers must offer mistake free services to make customers feel more comfortable.
Limitations of the Study
Since the study is restricted to Punjab state only, conclusions cannot be generalised. Data is collected using convenience and judgmental sampling from rural areas of Punjab. Hence, results of the research are not representing the overall population. People in other areas of India may have varying perceptions. Although efforts have been made for considering all aspects of the study, some dimensions may have been skipped. The responses given by respondents may suffer from personal biases because the respondents might have not intentionally provided their correct responses. So, it could affect the results of the study.
Directions for the Future Research
A similar study in the Indian context with a larger sample size enabling better generalisation of results can be taken. Studies may also be incorporated regarding customers’ willingness to pay extra for solar energy products. There is further scope for similar studies on solar technologies concerning the rooftop photovoltaic and solar thermal system, etc. This study has been conducted by taking only rural population. Further studies can also be conducted in the urban area. The sample of the research can be extended to other states of India, so as to check the sociocultural effect on the adoption of solar energy products.
Conclusion and Recommendations
The present study determines the service quality determinants of solar product dealers. On the basis of an earlier study, it has been observed that good service quality enhances the level of satisfaction among the customers as it impacts the behavioural intentions of the customers supporting the relationship marketing paradigm ultimately leading to formation of quality relationship between service provider and renderer (Beamish & Ashford, 2007; Cronin & Taylor, 1992; Olve, Roy, & Wetter, 1997). Putting forward the same perspective, it is significant to acknowledge and understand the nature and the role of after-sales services. Rather, the present research intended to focus on exploring the factors which influence before- and after-sales service quality of solar product dealers, specifically through efficient after-sales services. Moreover, the research not only considers the service quality determinant rather embodies other aspects of adding value through product differentiation. The study thrived to understand the specific factors contributing to customer satisfaction as researches have been only partially successful in highlighting them. However, as depicted by the earlier studies, installation and delivery are highly interposing elements to customer satisfaction (Gallagher et al., 2005; Levitt, 1983; Molenaar et al., 2002; Saccani et al., 2006). And indeed, fostering of the delivery of service quality and building a favourable relation with the customers will eventually help in retaining the customers (Drucker, 1993; Shields & Young, 1991; Waeyenbergh & Pintelon, 2002). For any business to survive and progress, customer satisfaction is the foremost objective as it is always profitable to retain the existing ones through quality service and satisfaction than acquiring new customers (Abdullah, 2006; Iansiti & Mac, 1997; Levitt, 1983). Providing quality service to the customers is not anymore considered to be an extra effort by the companies rather it has become a basic and necessary business strategy to provide high quality services for being profitable in the business (Crosby, 1984; Ellram, 1995; Juran, 1988; Magretta, 1998; Thoben et al., 2001). Solar energy industry having an edge over other industry energy resources is becoming the most favourable and progressive industry (Nonaka, 1991; Owlia & Aspinwall, 1996; Saccani et al., 2006).
The present article is an attempt to measure the level of satisfaction for the various services among the solar product dealers in the state of Punjab. For an empirical study, a refined SERVQUAL model is formed with five dimensions of tangibility, reliability, responsiveness, empathy and assurance. It has been observed from the extracted results that the service quality by the solar product dealers in the town is highly satisfactory by the customers. Moreover, the customers had a delightful experience regarding some of the attributes including environment protection, efficient and timely services initiatives. However, responsiveness of the dealers towards the complaints, queries, security and correct transactions, and prompt response and willingness of staff towards complaint handling have been dissatisfactory. Although, customers have shown a positive response towards yet other constructs as prompt services, to be stated specifically.
Managerial Implication
The results of the research are reliable and valid because data has been collected from primary sources. Further, it is an empirical study which is best suited accordingly to the stated objectives of the research. This research is expected to be useful to the solar manufacturers, regulators, customers, product and service providers, and for other environmental institutions. The present study has also analysed the consumer perception and expectation regarding service quality of solar product dealer. These findings may be useful to the solar product companies to improve their offered services. This research may be useful to the regulators to frame guidelines and policies while introducing new solar technology in the industry which is best suited to the customers.
Nowadays, customer satisfaction is most important and it authenticates and validates the firm’s success. The solar manufacturer should maintain customer relations as the lifespan of the solar energy products is up to 25–30 years. The manufacturers should regularly call up the customers and should take the feedback regarding the functioning of the solar energy product. Manufacturers should provide better after-sales services which include panel installation, repairs and maintenance for five-year warranty period of the solar energy product. The solar manufacturers must provide proper information and attention to solve the customer queries and must provide the toll-free number to the customers for solving their problems. The manufacturer should provide immediate service in the case of any lapse in the functioning of solar energy product. The solar companies should provide training to the dealer, installers, and all sales executives. This will facilitate them to demonstrate the benefits of solar energy products to the consumers.
Footnotes
Declaration of Conflicting Interests
The authors declared no potential conflicts of interest with respect to the research, authorship and/or publication of this article.
Funding
The authors received no financial support for the research, authorship and/or publication of this article.