
Abstract
This study examines the impact of COVID-19 on market sentiment and the stock market’s reaction at different investors’ time horizons in India. We applied wavelet coherence analysis and event study methodology during waves 1 and 2 of COVID-19 on NIFTY 50 firms. The results of this study report that market-related implicit sentiment proxies depicting the market’s bullish (bearish) sentiment negatively (positively) correlate with COVID-19 during the first wave of the pandemic in the short-term to medium-term (until 16 days). Using the event study method to compute abnormal stock returns during waves 1 and 2 of COVID-19, we found statistically significant negative abnormal returns during wave 1 only. Our findings extend the literature that examines the market reaction to COVID-19. The results generally hold for various robustness checks.
Introduction
The novel coronavirus (COVID-19) has affected people’s life (Liu et al., 2020b). Financial markets have witnessed several pandemics, and researchers have studied the impact of those pandemics on the stock market. Lai et al. (2016) studied the impact of Severe Acute Respiratory Syndrome (SARS) on property buyers in Hong Kong, and Ferreira and Karali (2015) studied earthquakes and stock markets. The impact of natural disasters is also documented in the literature (Fakhry et al., 2018). Although the studies mentioned above are conducted to explore the impact of different pandemics on stock markets, COVID-19 differs from those pandemics regarding its duration and long-term economic consequences. COVID-19 had a significant impact on economic activities and has particularly impacted financial markets (Bahrini & Filfilan, 2020). Noy and Shields (2019) stated that SARS resulted in short-term economic turmoil, and the economy resumed normalcy within a few weeks. In contrast, the first case of COVID-19 was reported on 31 December 2019 in Wuhan, China, and then WHO declared COVID-19 as a pandemic on 11 March 2020 (Cucinotta & Vanelli, 2020), and most of the countries are facing different waves of COVID-19.
The classical theory of finance fails to explain the movement in asset pricing. In contrast to the classical theory of finance, behavioural finance shows that investors are not always entirely rational (Barberis & Thaler, 2003). Irrational investors are prone to sentiments and act upon noise to make sub-optimal investment decisions (Black, 1986). A measure of sentiment captures investors’ expectations about the market (Naik & Padhi, 2016). Research in corporate finance (Aggarwal, 2019; Baker & Wurgler, 2006; Fisher & Statman, 2003; Papapostolou et al., 2014) documents that market sentiment plays a crucial role in investors’ decisions and market sentiment affects returns in the stock market. Investors derive their expectations about the future periods of the market from various news and events like disasters and pandemics (Sun et al., 2021). Not only in corporate finance, but the understanding sentiment is also crucial in understanding individuals (Hossain & Rahman, 2022; Sharma & Tiwari, 2022).
In agreement with the literature, we propose that COVID-19 has a significant impact on market sentiment and stock returns. First, studies on the impact of COVID-19 on stock markets have already been established in existing literature (Chowdhury et al., 2022; Liu et al., 2020b, 2022; Zhang et al., 2020). However, studies on the impact of the pandemic on the sentiments of investors in emerging economies are limited. Emerging economies are unique in terms of their income and growth rates (Hoskisson et al., 2017). Globalization has a different impact on emerging and advanced economies (Baek & Shi, 2016), and the response of the financial sector to COVID-19 has been different for emerging and advanced economies (Feyen et al., 2021). Hence the present study attempts to examine the impact of COVID-19 on market sentiment and stock returns in an emerging economy.
Second, existing research documents that leaders influence the audience during a pandemic (Haman, 2020), and CEO benevolence influences stakeholder sentiment during COVID-19 (Steinbach et al., 2021). Indian CEOs have unique traits in terms of leadership style (Vitale & Cull, 2018), religious beliefs (Baxamusa & Jalal, 2016), and emphasis on values (Gutierrez et al., 2012). Given the unique structure of emerging economies, the belief system of Indian CEOs, and the impact of the pandemic on emerging economies, this study adds to the literature on the impact of the pandemic on market sentiment and the financial market from a different context.
Third, a pandemic such as COVID-19 impacts stock market volatility, and country-level factors help to reduce volatility during the pandemic (Uddin et al., 2021). The existing studies have contradicting findings on the effect of the pandemic on financial markets in emerging and advanced economies. For example, a significant difference in the behaviour of the stock market in advanced and developing economies is observed by Setiawan et al. (2021) while Kostin et al. (2021) documented no difference in returns for the stated economies. Government policies such as quantitative easing have different results for emerging and advanced economies (Rebucci et al., 2022). A waves-wise analysis is required as different waves have different impacts on COVID-19 (Kim & Kwan, 2021; Zawbaa et al., 2022). The present study focuses on the impact of COVID-19 on market sentiment and stock returns using waves 1 and 2 of COVID-19 in India. The study adds to the literature that different points in the time of the pandemic have different impacts on financial markets. Specifically, we found that wave 1 of COVID-19 significantly affected market sentiment and stock returns while this was not the case during wave 2 of COVID-19. Our findings suggest gradual learning among investors from the first wave to the second wave of COVID-19.
The present study adds to the existing literature in three ways. First, this article contributes to studies that examine the stock market response to pandemics by comparing the impact of wave 1 and wave 2 of COVID-19 and providing empirical evidence for the Indian stock market that the timing of the pandemic also influences the impact on financial markets. Second, minimal studies on the relationship between COVID-19 and investor sentiment exist; this study argues that COVID-19 significantly affects investor sentiment during wave 1. The present analysis adds to the literature that investors gradually learn and react less during a long-lasting pandemic. Third, focusing on different investor time horizons during the pandemic, this study provides evidence of market sentiment and stock returns. The findings of this study indicate that the stock market reacted differently in the first and second waves of COVID-19. COVID-19 leads to market sentiment mainly in the short term during the first wave of COVID-19. During the second wave of the pandemic, there was no significant co-movement between investor sentiment proxies and COVID-19. The results of the study report significant negative abnormal returns during wave 1 of COVID-19. In contrast to this, the results of no evidence of significant abnormal returns are found during the second wave in India.
The remainder of the article is organized as follows: The second section presents related existing literature on COVID-19, market sentiment and financial markets. The third section depicts the research methodology of the study, while the fourth section presents the analysis. The fifth section presents concluding remarks and implications of the study.
Literature Review
Literature has been growing on the effects of COVID-19 on financial markets. We review the existing pool of literature from two perspectives: (a) the association between COVID-19 and market sentiments, and (b) the impact of COVID-19 on stock market performance.
COVID-19 and Market Sentiment
Many studies have found that stock markets are not efficient. Investors are not always rational and are prone to sentiments (Aboura, 2016; Dash & Maitra, 2018; Naik & Padhi, 2016). Due to the limit to arbitrage, rational investors are afraid to bet against these irrational traders (Chakraborty & Subramaniam, 2020; Long et al., 2015). Sentiments being a systematic risk, are priced in the stock market (Lee et al., 2002; Rupande et al., 2019). The present study focuses on India because, regardless of the dominance of institutional investors in emerging markets like India, markets remain informationally inefficient. Also, India is one of the countries that are worst hit by COVID-19. The factors that shape investor sentiment in the market are investors’ perception of news published and the occurrence of events such as weather, sports, disasters, diseases and pandemics (Raissi & Missaoui, 2015; Sun et al., 2021). Donadelli et al. (2017) show that infectious diseases impact investor sentiment. Hence, analyzing the linkage between the pandemic and investor sentiment may have enormous implications for regulators, market participants and academicians.
Literature provides several proxies to capture investor sentiment. Some studies use market-based implicit sentiment proxies (Baker et al., 2006; Brown & Cliff, 2004; Naik & Padhi, 2016) and combine these sentiment proxies using principal components analysis to form a composite sentiment index. Some studies focus on survey-based investor sentiment (Aboura, 2016; Chakraborty & Subramaniam, 2020; Liston & Huerta, 2012). Many studies use social media-based sentiment in the market or text media sentiment (Nogueira Reis & Pinho, 2020).
Previous literature explores the negative impact of major disasters and pandemic diseases on the stock market due to negative investor sentiment (Liston & Huerta, 2012; Yahya et al., 2021). Yahya et al. (2021) examined the impact of COVID-19 on investor sentiment using the panel data technique. They found that investors have a pessimistic sentiment on average during the pandemic. The correlation shows a significant negative association of sentiment in the market with new cases of COVID-19 and deaths due to COVID-19. At the same time, a positive correlation was found between recovered cases of COVID-19 and investor sentiment. Events like natural disasters have an impact on investor sentiment. Using event study methodology, a negative impact of the hurricane was found on investor sentiments in the event window (Liston & Huerta, 2012). Investor sentiment reacts more to current or effective COVID-19 cases in Europe, whereas, in the US, investor sentiment is less sensitive to confirmed cases of COVID-19 (Nogueira Reis & Pinho, 2020). Zhai et al. (2021) found that the closer the firms are to the epicentre of coronavirus in China, that is, Hubie Province, the more significant the adverse impact on investor sentiment.
COVID-19 and Stock Market Performance
Anh and Gan (2020) examined Vietnam firms and found that COVID-19 negatively impacted the stock returns, and in terms of sectoral impact, the financial sector was primarily impacted by COVID-19. They documented that the Vietnam stock market has reacted positively to the lockdown period because investors’ confidence improved due to the government’s response to COVID-19. Baek et al. (2020) investigated the United States (US) markets using the Markov Switching AR model and stated that COVID-19-related news, especially negative news, significantly affected the volatility of markets. Systematic risk is shown to vary among different sectors, and this is in agreement with various studies that argue that COVID-19 has affected a few sectors, such as tourism (Shen et al., 2020) and finance (Anh & Gan, 2020), more negatively. Brueckner and Vespignani (2021) examined the stock market performance of Australian firms during wave 1 of COVID-19 and found a positive impact of COVID-19 on the Australian market. They studied large firms and found that reduced competition is the reason for the positive impact of COVID-19 on the stock market. They reported that a shutdown in Australia harms the market as the shutdown costs the market.
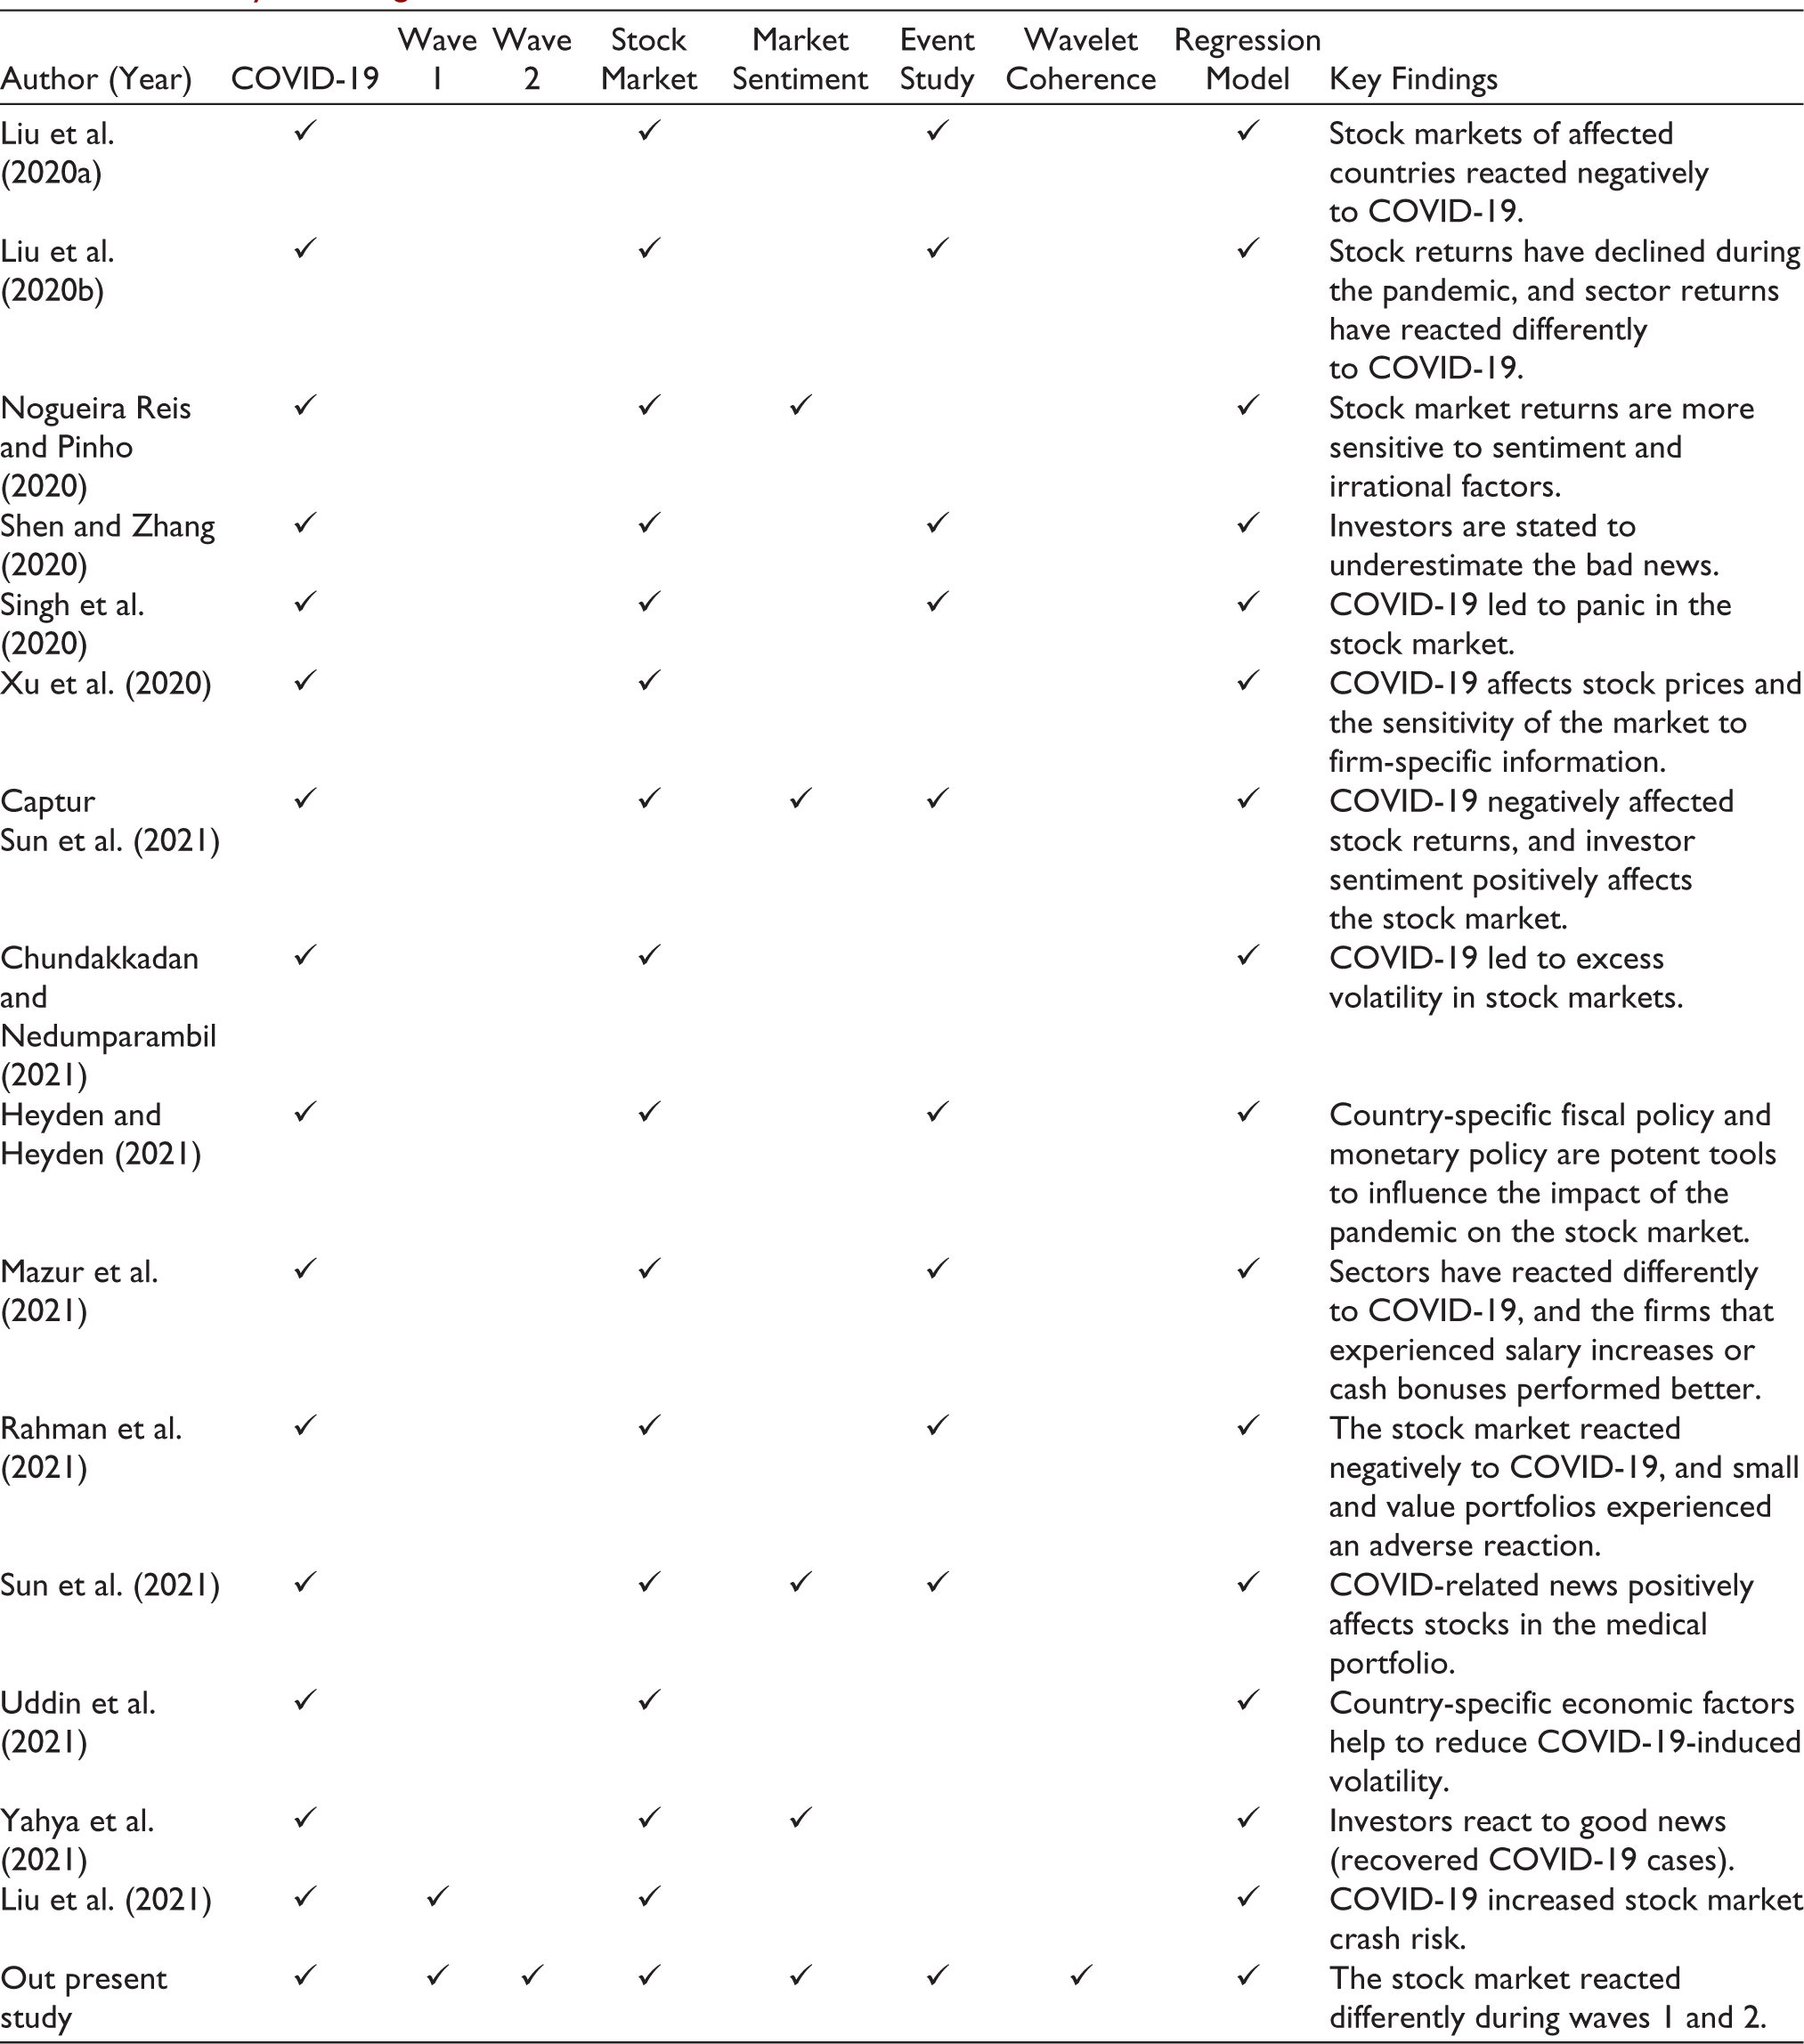
Shen et al. (2020) investigated the impact of COVID-19 on firm performance in China and found that COVID-19 has negatively impacted firm performance. The smaller firms are shown to experience a more negative impact, and few industries such as tourism and catering have experienced more adverse impacts of COVID-19. Hong et al. (2021) stated that COVID-19 has influenced return predictability, and during the pandemic, the market was inefficient, and traders and speculators gained from the inefficiency. They also documented that income and wealth inequality rises during a crisis due to more liquidity among individuals. Lin and Falk (2021) argued that the travel and leisure industry’s risk has significantly shifted during the first COVID-19 wave and stated that the industry’s composition in a country could change the impact of the pandemic on the firms in that country. They suggested the requirement of short-term measures for the firms affected by the pandemic. Takyi and Bentum-Ennin (2021) investigated 13 African countries during wave 1 to investigate the short-term impact of COVID-19 on the stock market and found that COVID-19 led to a significant reduction in stock market performance. They documented the evidence of the restrictive effects of COVID-19 on the African economy. Table 1 summarizes selected studies on COVID-19, market sentiment, and stock market returns and shows the contribution of our study, which focuses on waves 1 and 2.
Summary of Findings of Selected Studies.
Research Methodology
Sample Selection
The study is based on NIFTY 50 companies, an index on National Stock Exchange (NSE), and data collected from NSE and the Centre for Monitoring Indian Economy (CMIE) Prowess. The choice of NIFTY 50 is motivated by the data available on the proxies for measuring market sentiment. Specifically, the data for investors’ sentiment were collected from NSE, and data for stock returns, market returns and firm-specific variables were collected from CMIE Prowess. The data for COVID-19 (confirmed cases and deaths) were collected from Our World in Data. For the Wavelet coherence approach, we collected daily time series data for COVID-19 confirmed cases, and market sentiment data is collected from 31 January 2020 to 31 May 2021. Daily observations of new deaths reported due to COVID-19 are from 11 March 2020 to 31 May 2021. The final observations used in this study for wavelet coherence between new cases of COVID-19 and sentiment proxies are 331 (from 31 January 2020 to 31 May 2021) and for wavelet coherence between new deaths due to COVID-19 and sentiment proxies are 303 (from 11 March 2020 to 31 May 2021). Regression analysis on sample firms excluding firms from the banking and financial sector is run to test the abnormal returns.
Variable Definition
Wavelet coherence is used to study the co-movement of COVID-19 and market sentiment. We have measured investor sentiment depicted through market-related implicit sentiment proxies. From the literature, three proxies are used to capture investor sentiment: ADR (advances to declines ratio) (Brown & Cliff, 2004; Naik & Padhi, 2016), VIX (volatility index) (Dash & Maitra, 2018; Liston & Huerta, 2012), TV (trading volume) (Baker et al., 2006; Yahya et al., 2021). ADR is the ratio of the number of advancing issues to the number of declining issues. So a high (low) value of ADR will imply a bullish(bearish) trend in the market. Smales (2017) considers VIX as the investor fear gauge. The higher VIX, the greater the fear in the market. A high value of VIX indicates higher volatility in the market, representing a higher chance of downward movement. Trading volume depicts the liquidity of the market. Higher (lower) trading volumes imply optimism(pessimism) among investors. All the variables related to the market sentiment, event study and regression model are presented in Appendix 1.
Tools of Analysis
This section presents the tools of analysis to explore the co-movement between investor sentiment and COVID-19 at different investors’ time horizons using the wavelet coherence approach. In addition, to explore the distinct stock market reaction to waves 1 and 2 of COVID-19, an event analysis is employed, and this is followed by regression analysis to capture the relationship between abnormal returns and firm-specific characteristics.
Wavelet Coherence
A bivariate framework of wavelet coherence is used to capture the co-movement between market sentiment proxies and COVID-19. The application of the wavelet approach is rising in finance literature due to its advantage of capturing both the time domain and frequency domain. As a result, the co-movement between two-time series can be estimated more accurately (Tiwari et al., 2013). According to Torrence and Compo (1998), the wavelet coherence between two-time series is defined as:
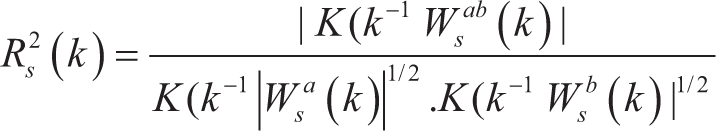
K is a smoothing operator written as a convolution in time and scale: K(W) = Kscale (Ktime (Ws)). Coherency is the same at all times and scales without smoothing.
Event Study
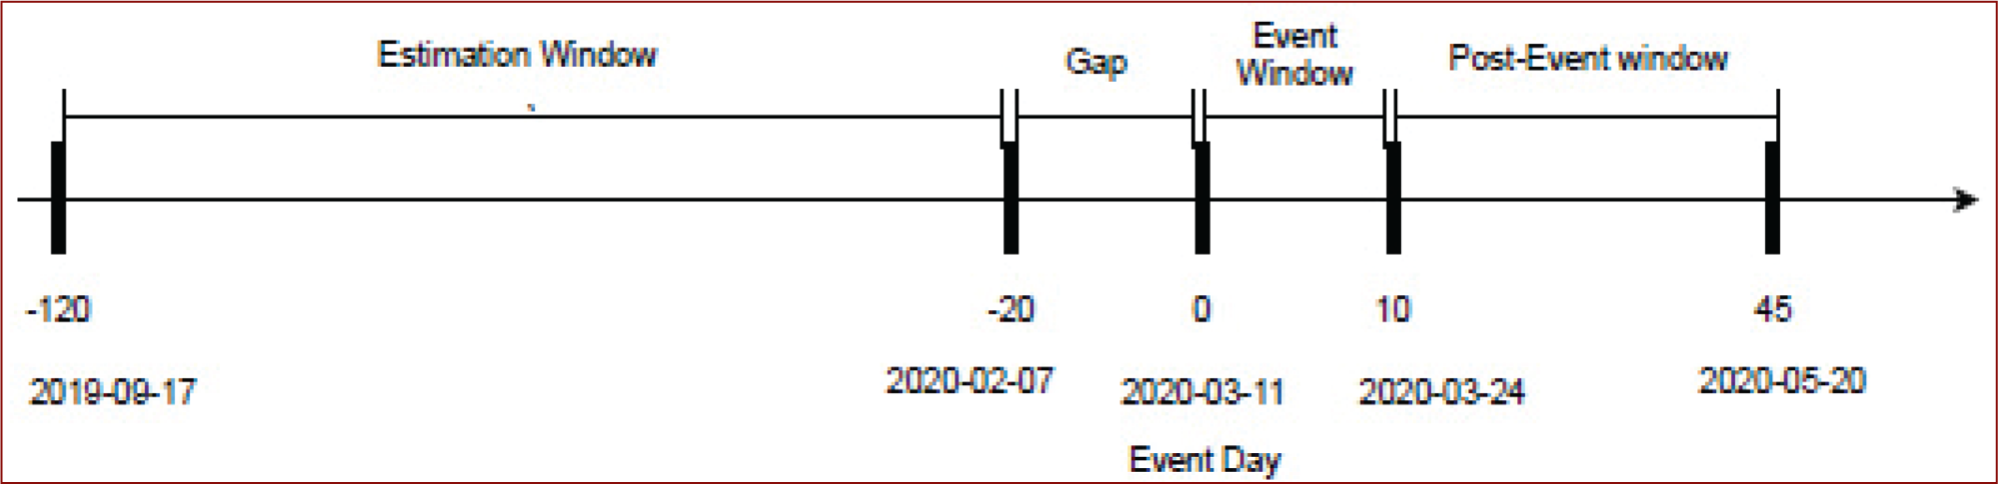
We have applied an event study (Liu et al., 2020b; Maneenop & Kotcharin, 2020; Singh et al., 2020) to identify abnormal returns in the stock market during COVID-19. 11 March 2020 is set as the event date for wave 1 as the first death in India due to COVID-19 took place on this date. For wave 2, 10 February 2021 is considered the event date based on India’s start of the second wave 1 . We have taken 100 days before the event as the estimation window and 10 days after the event as the event window. 10–45 days after the event date are taken as the post-event window. Furthermore, the chosen event window agrees with CapturSun et al. (2021), and we have also considered a 20-day gap between the event window and estimation window, which helps to capture actual abnormal returns. Figure 2 depicts the set-up of the event study for wave 1. The sample period for the estimation window is from 17 September 2019 to 7 February 2020. The sample period for the event window is from 11 March to 24 March 2020, and the sample period for the post-event window is from 25 March 2020 to 20 May 2020. For wave 2, only the event day is different (10 February 2021), and the rest of the set-up of Figure 2 remains the same. We have used EventStudyTools (Wolf et al., 2014) to analyze abnormal returns. Equations (2–4) present abnormal returns (AR) calculation for an event study. We applied the market model (Equation 2) as the expected return model to compute abnormal returns, and this choice The choice of the market model (Equation 2) as the expected return model to compute abnormal returns is in agreement with the literature (Alam et al., 2020; Alkhatib & Harasheh, 2018; Rai & Pandey, 2022). Our null hypothesis is that CAR is equal to 0, and t-statistics should be significantly positive if COVID-19 significantly impacts stock prices during waves 1 and 2. We applied Generalized Rank Z Test and Skewness Corrected T, nonparametric tests, as Campbell et al. (2010) stated the robustness of results using nonparametric tests in single-market samples. The choice of the nonparametric tests is also motivated due to the impact of firm-specific events on the market index (NIFTY 50), and the choice of applied statistical tests for event study agrees with Cowan (1992). After changing the length of the estimation window, results remain consistent, showing the results’ robustness.
Event Study Set-Up (Wave 1).


where,
Ri,
t
= Actual stock return RM
i, t =
Actual market reference return AR
i, t =
Abnormal returns AAR = Average abnormal return CAR = Cumulative abnormal return CAAR = Cumulative Average abnormal return
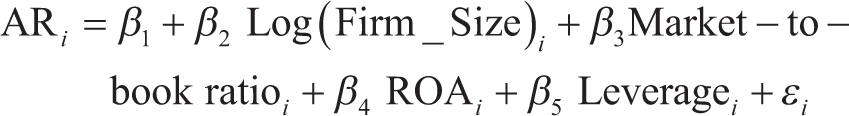
Regression Model
In addition to the event study, we performed an OLS regression analysis to capture the relationship between abnormal returns and firm-specific characteristics. The abnormal returns (AR) are regressed on firm-specific characteristics, and the regression model is presented in Equation 6. In agreement with literature from corporate finance, firm-specific characteristics data, namely firm size (Zuhroh, 2019), market-to-book ratio (Al-Awadhi et al., 2020; Heyden & Heyden, 2021), return on assets (ROA) (Chang et al., 2019; Menicucci, 2018), and leverage (Aharon & Yagil, 2019) are collected for both the waves of COVID-19.
Empirical Findings and Discussions
This section presents a comparative analysis of findings from wavelet coherence, event study, and regression model during waves 1 and 2 of COVID-19. Table 2 presents the summary statistics and shows a significant difference in market sentiment proxies and returns for waves 1 and 2 of COVID-19. Although market sentiment proxies have higher mean values in wave 2 compared to wave 1, in our subsequent analysis, we found no statistically significant association between market sentiment proxies and COVID-19 for wave 2.
Descriptive Statistics.
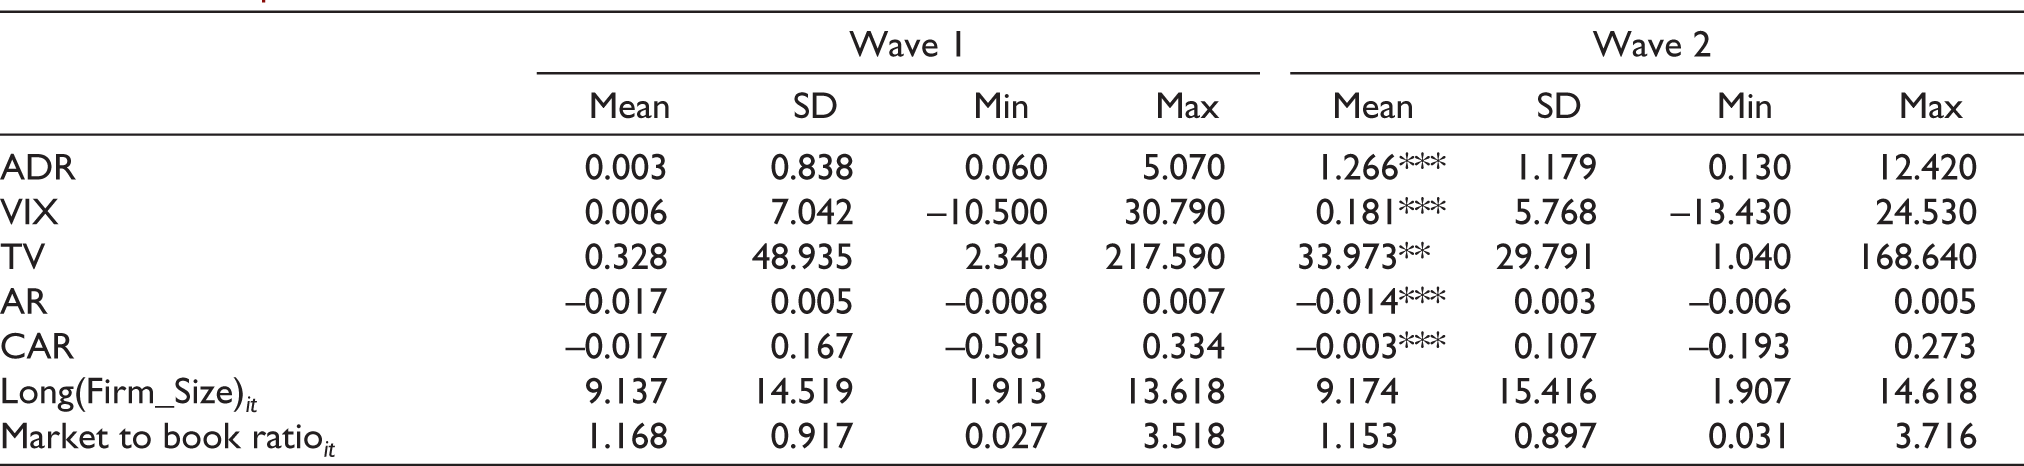
*** Indicates significance at 1%.
Wavelet Coherence Results
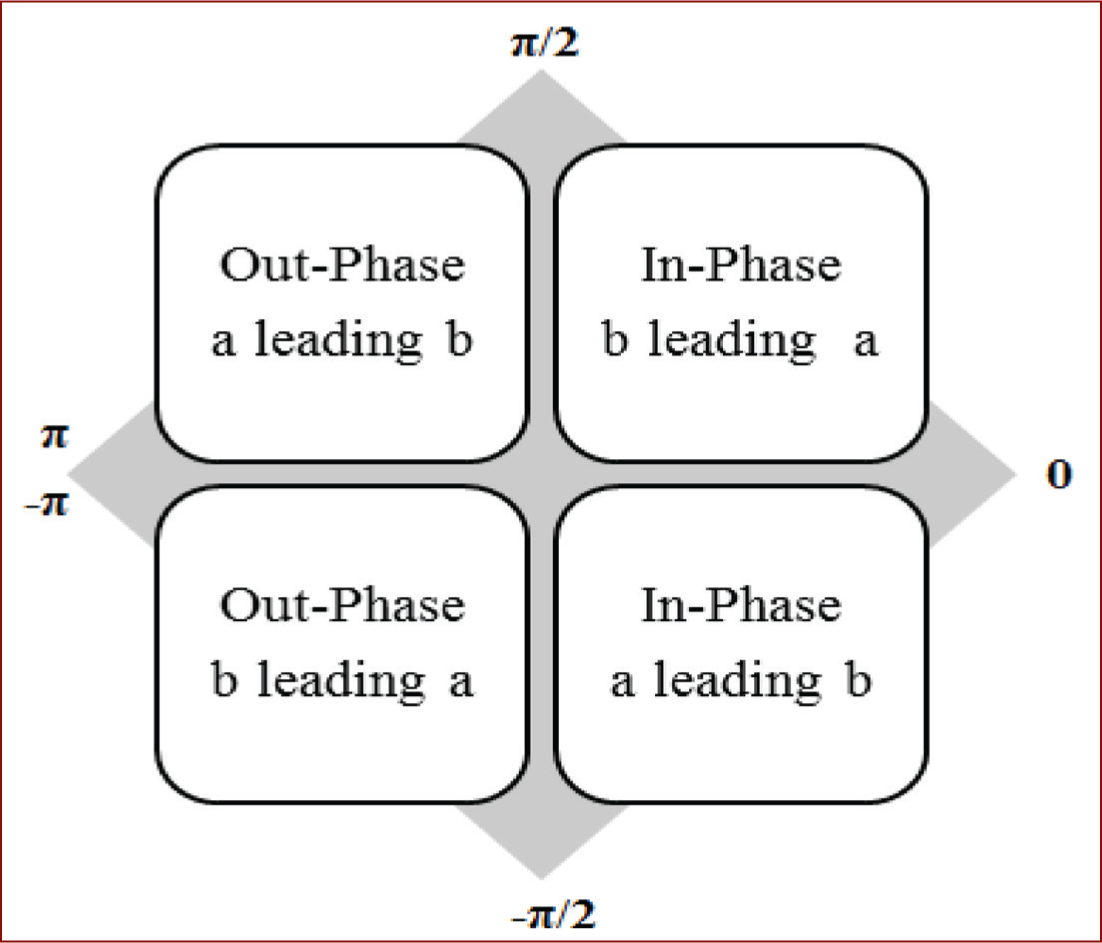
This section presents the Wavelet coherence approach’s results to capture the co-movement between investor sentiment proxies (VIX, ADR and TV) and COVID-19 (new cases of COVID-19, new deaths due to COVID-19) in both the time and frequency domain. The vertical axis of the wavelet coherency diagram shows frequency components ranging from 1 (1 day) to scale 64 (more than 64 days). The time component is depicted on the horizontal axis. The solid curved line shows the cone of significance. The colour bar on the right represents the level of correlation—blue colour depicting low co-movement and yellow colour depicting high co-movement.
New Cases of COVID-19 and Sentiment Proxies
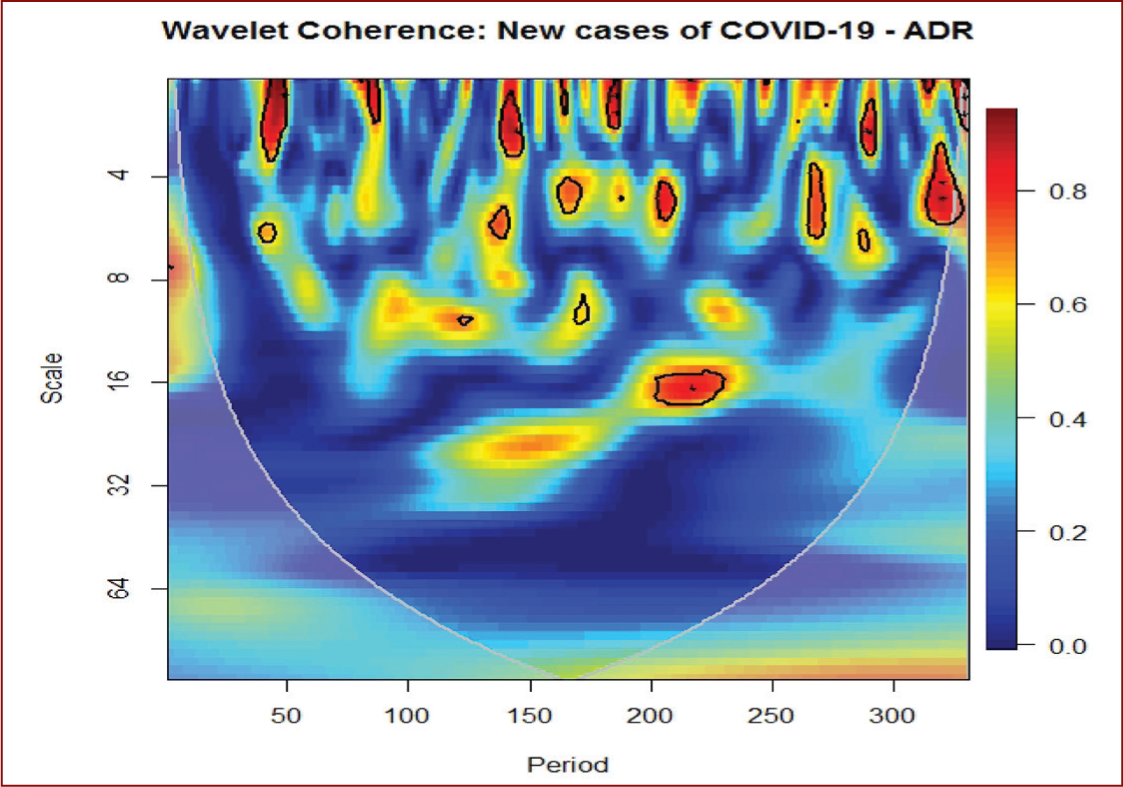
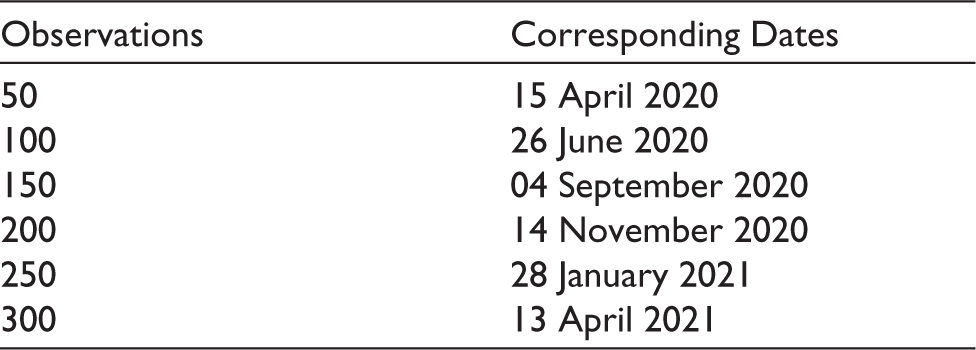
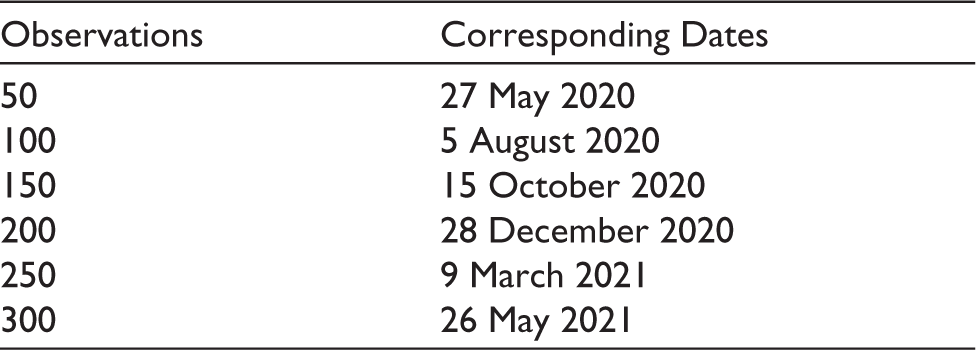
Wavelet coherency between newly confirmed cases of COVID-19 and three sentiment proxies, ADR (Figure 3), TV (Figure 4) and VIX (Figure 5) are depicted below. Corresponding dates to the observations on the horizontal axis in the wavelet coherence diagrams (Figures 3, 4 and 5) are mentioned in Table 3.
Wavelet Coherency (WTC) Between New Cases of COVID-19 and ADR. Black Color Contour Represents Significance at a 5% Level of Significance. The Color Code on the Right Side of the Diagram Depicts the Strength of Correlation.
Wavelet Coherency (WTC) Between New Cases of COVID-19 and TV. Black Color Contour Represents Significance at a 5% Level of Significance. The Color Code on the Right Side of the Diagram Depicts the Strength of Correlation.

Wavelet Coherency (WTC) Between New Cases of COVID-19 and VIX. Black Color Contour Represents Significance at a 5% Level of Significance. The Color Code on the Right Side of the Diagram Depicts the Strength of Correlation.

Wavelet Coherency Between New Cases of Covid-19 and ADR
Figure 3 depicts the wavelet coherency and phase difference between new cases of COVID-19 and ADR. Following significant coherence for a 0–4 day frequency cycle is observed.
From 26 March 2020 to mid-April 2020.
From 21 August 2020 to early September 2020.
End March 2021 to early April 2021.
These periods correspond to (a) the announcement of lockdown in the country, (b) the peak of the first wave of COVID-19 and (c) vaccination news. The first two periods show a negative co-movement in the short term. In contrast, the third period shows a positive co-movement between new cases of COVID-19 and ADR. Another significant negative co-movement is observed in early May 2021 to mid-May 2021 in the band of 3–6 days, that is, for the short term. This period corresponds to the peak of the second wave of COVID-19. Only one significant negative co-movement and coherence is found between ADR and new cases of COVID-19 in the band of 16–20 days, that is, for the medium term for January 2021. The co-movement between ADR and new cases of COVID-19 has been observed during the periods associated with both waves of the pandemic.
Wavelet Coherency (WTC) Between New Cases of COVID-19 and Trading Volume (TV)
Figure 4 shows wavelet coherency between new cases of COVID-19 and TV, one most significant negative co-movement for the 4–8 day frequency band from the end of August to mid-September 2020 observed. This period corresponds to the peak of the first wave of COVID-19. The arrows show an out-phase, that is, a negative relationship in the short term with new cases of COVID-19 leading to TV.
Wavelet Coherency Between New Cases of COVID-19 and VIX
The wavelet coherency between new cases of COVID-19 and VIX is presented in Figure 4. The period from early April 2020 to mid-May 2020 has the most significant and positive coherence and co-movement between new cases of COVID-19 and VIX in the band of 4–12 days, that is, for short and medium-term. The direction of the arrows shows new cases of COVID-19 leading to VIX. This period corresponds to the lockdown period and the rising curve of the first wave of COVID-19. With the increase in COVID-19 cases, we have seen a rise in VIX, which is the gauge of fear. VIX is also a measure of volatility. During this period, high volatility is also seen in the graph of market returns. Two more significant-high degrees of negative coherence and co-movement are observed between new cases of COVID-19 and VIX.
From early June 2020 to the end of June 2020 in the band of 4–6 days, that is, for the short term. The period corresponds to UNLOCK 1.0
From early November 2020 to early December 2020 in the band of 4–6 days, that is, for the short term, that is, corresponding to the tail of the first wave of COVID-19.
The coherence and co-movement between VIX and new cases of COVID-19 are seen during the time of the first wave of the pandemic. While during the period of the second wave, no co-movement is found between new cases of COVID-19 and VIX.
New Deaths Due to COVID-19 and Sentiment Proxies
Wavelet coherency between new deaths due to COVID-19 and three sentiment proxies, ADR (Figure 6), TV (Figure 7) and VIX (Figure 8), is depicted below. Corresponding dates to the observations on the horizontal axis in the wavelet coherence diagrams (Figures 6, 7 and 8) are mentioned in Table 4.
Wavelet Coherency (WTC) Between New Deaths Due to COVID-19 and ADR. Black Color Contour Represents Significance at a 5% Level of Significance. The Color Code on the Right Side of the Diagram Depicts the Strength of Correlation.

Wavelet Coherency (WTC) Between New Deaths Due to COVID-19 and TV. Black Color Contour Represents Significance at a 5% Level of Significance. The Color Code on the Right Side of the Diagram Depicts the Strength of Correlation.

Wavelet Coherency (WTC) Between New Deaths Due to COVID-19 and VIX. Black Color Contour Represents Significance at a 5% Level of Significance. The Color Code on the Right Side of the Diagram Depicts the Strength of Correlation.

Wavelet Coherency Between New Deaths Due to COVID-19 and ADR
In Figure 6, the three most significant high degrees of negative coherence between new deaths due to COVID-19 and ADR observed are as follows:
Mid-May 2020 to June end 2020 in the band of 10–20 days, that is, for the medium term. Mid-August 2020 to mid-September 2020 in the band of 6–10 days frequency, that is, for the short and medium-term. Mid-September 2020 to end October 2020 in the band of 0–6 days, that is, for the short term.
The possible reason for negative co-movement in the first two significant periods is the continuously increasing deaths in the initial period, which arose fear among investors. The third significant period mentioned above corresponds to the peak of the curve of deaths due to COVID-19. A small significant area depicting positive coherence and co-movement between new deaths due to COVID-19 and ADR can be observed from the last of May 2021 to early June 2021 in a very short-term period, that is, in the band of fewer than 4 days. ADR shows significant co-movement with new deaths of COVID-19 majorly during the first wave of COVID-19.
Wavelet Coherency Between New Deaths Due to COVID-19 and TV
Wavelet coherency in Figure 7, shows many significant areas of co-movement at a 5% level of significance, mainly in the short-term period and a few in the medium-term period, between new deaths due to COVID-19 and TV. However, the direction of the co-movement between trading volume and new deaths due to COVID-19 is not defined.
Wavelet Coherency Between New Deaths Due to COVID-19 and VIX
Wavelet coherency between new deaths due to COVID-19 and VIX is depicted in Figure 8. The most significant coherence and co-movement are seen in two periods:
From mid-April to mid-May 2020 Early June to early July 2020
The initial rise of new deaths due to COVID-19 led to an increase in the VIX market. Investors experience fear with the surge in new deaths during the first wave of COVID-19. No effect of COVID-19 has been seen on the VIX (also known as a gauge of fear) during the second wave.
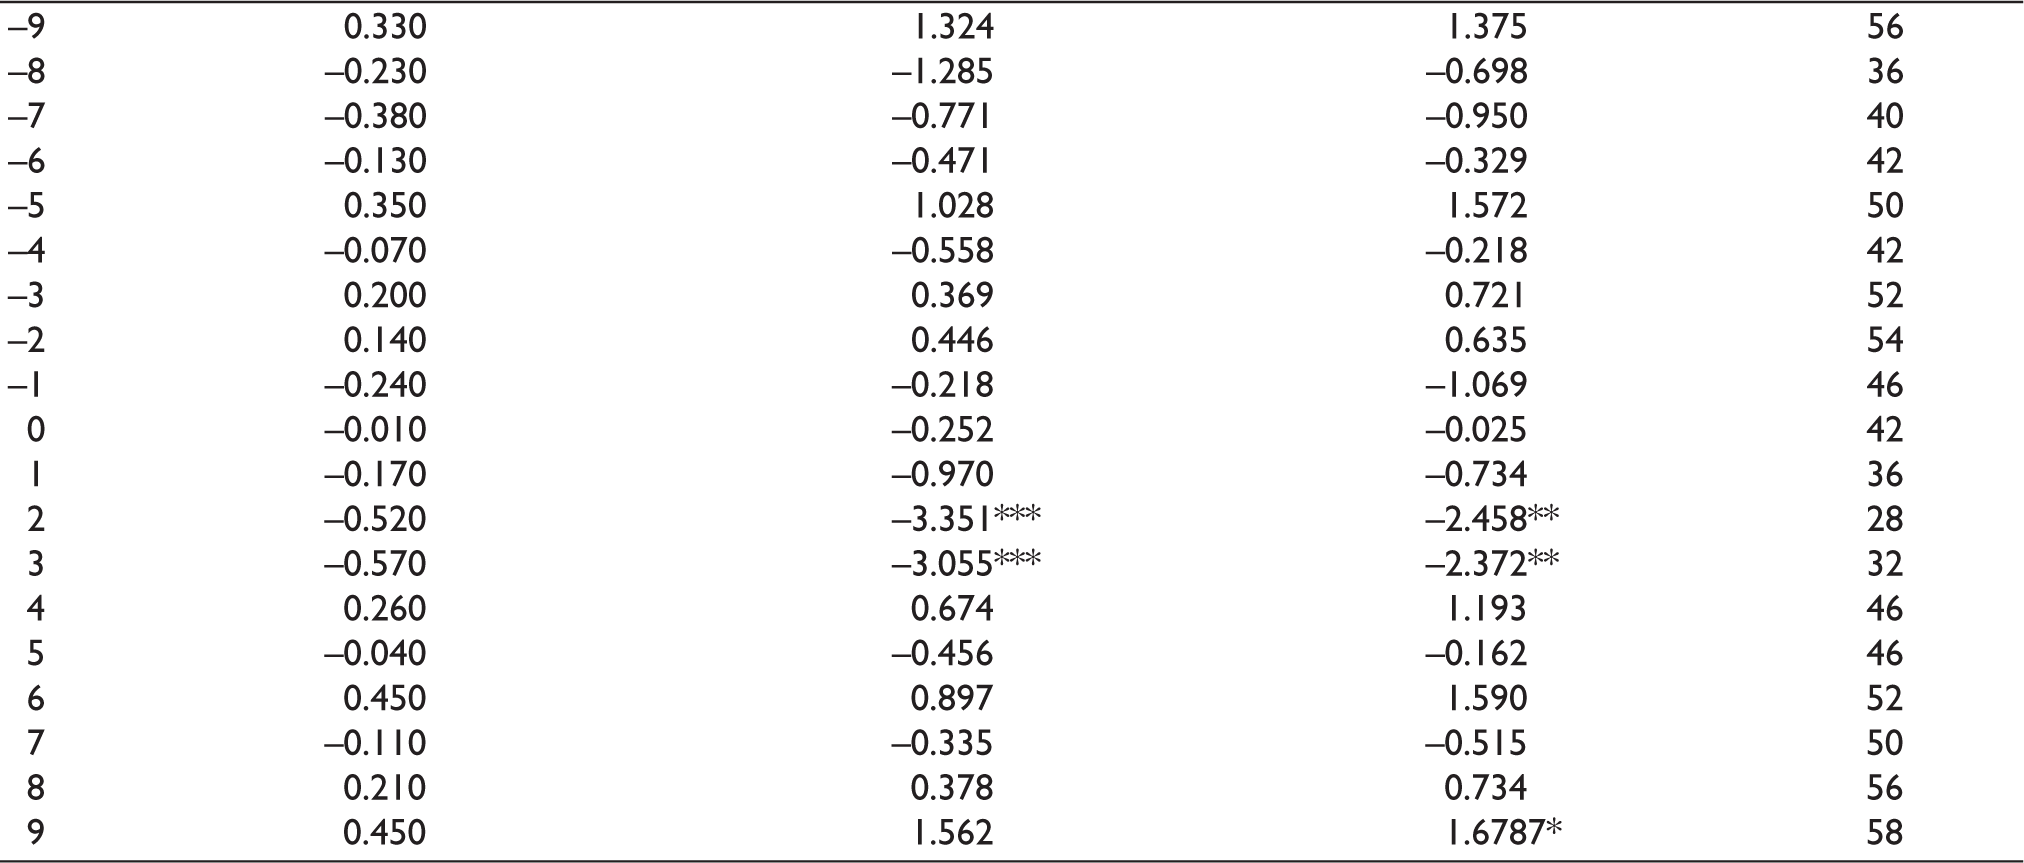
Event Study Results
Table 5 presents the mean abnormal returns, nonparametric tests and percentage of firms having positive abnormal returns. During wave 1, we found the mean abnormal returns on event day to be negatively and statistically significant according to Generalized Rank Z Test, and Skewness Corrected T. 15 of the 19 mean abnormal returns are insignificant according to the Skewness Corrected T, and 16 of the 19 mean abnormal returns are insignificant according to Generalized Rank Z Test. The mean abnormal returns were insignificant from the days −9 to −1 except for −5, and −4, and the mean abnormal returns are insignificant for all the post-event window days (days 1–9). This investigation suggests only a short-term market impact of COVID-19 on the Indian stock market. A strong and negative overreaction is noted during wave 1 when the first death due to COVID-19 was announced in India. The mean abnormal returns on event day show that markets are efficient enough in the semi-strong form of market efficiency as the market has reacted negatively on the event day. Mandal and Rao (2010) have provided evidence of the semi-strong form of market efficiency in India in the past using dividend initiation announcements and documented that markets overreact to any bad news.
Wave 1 and Wave 2 Mean Abnormal Returns.
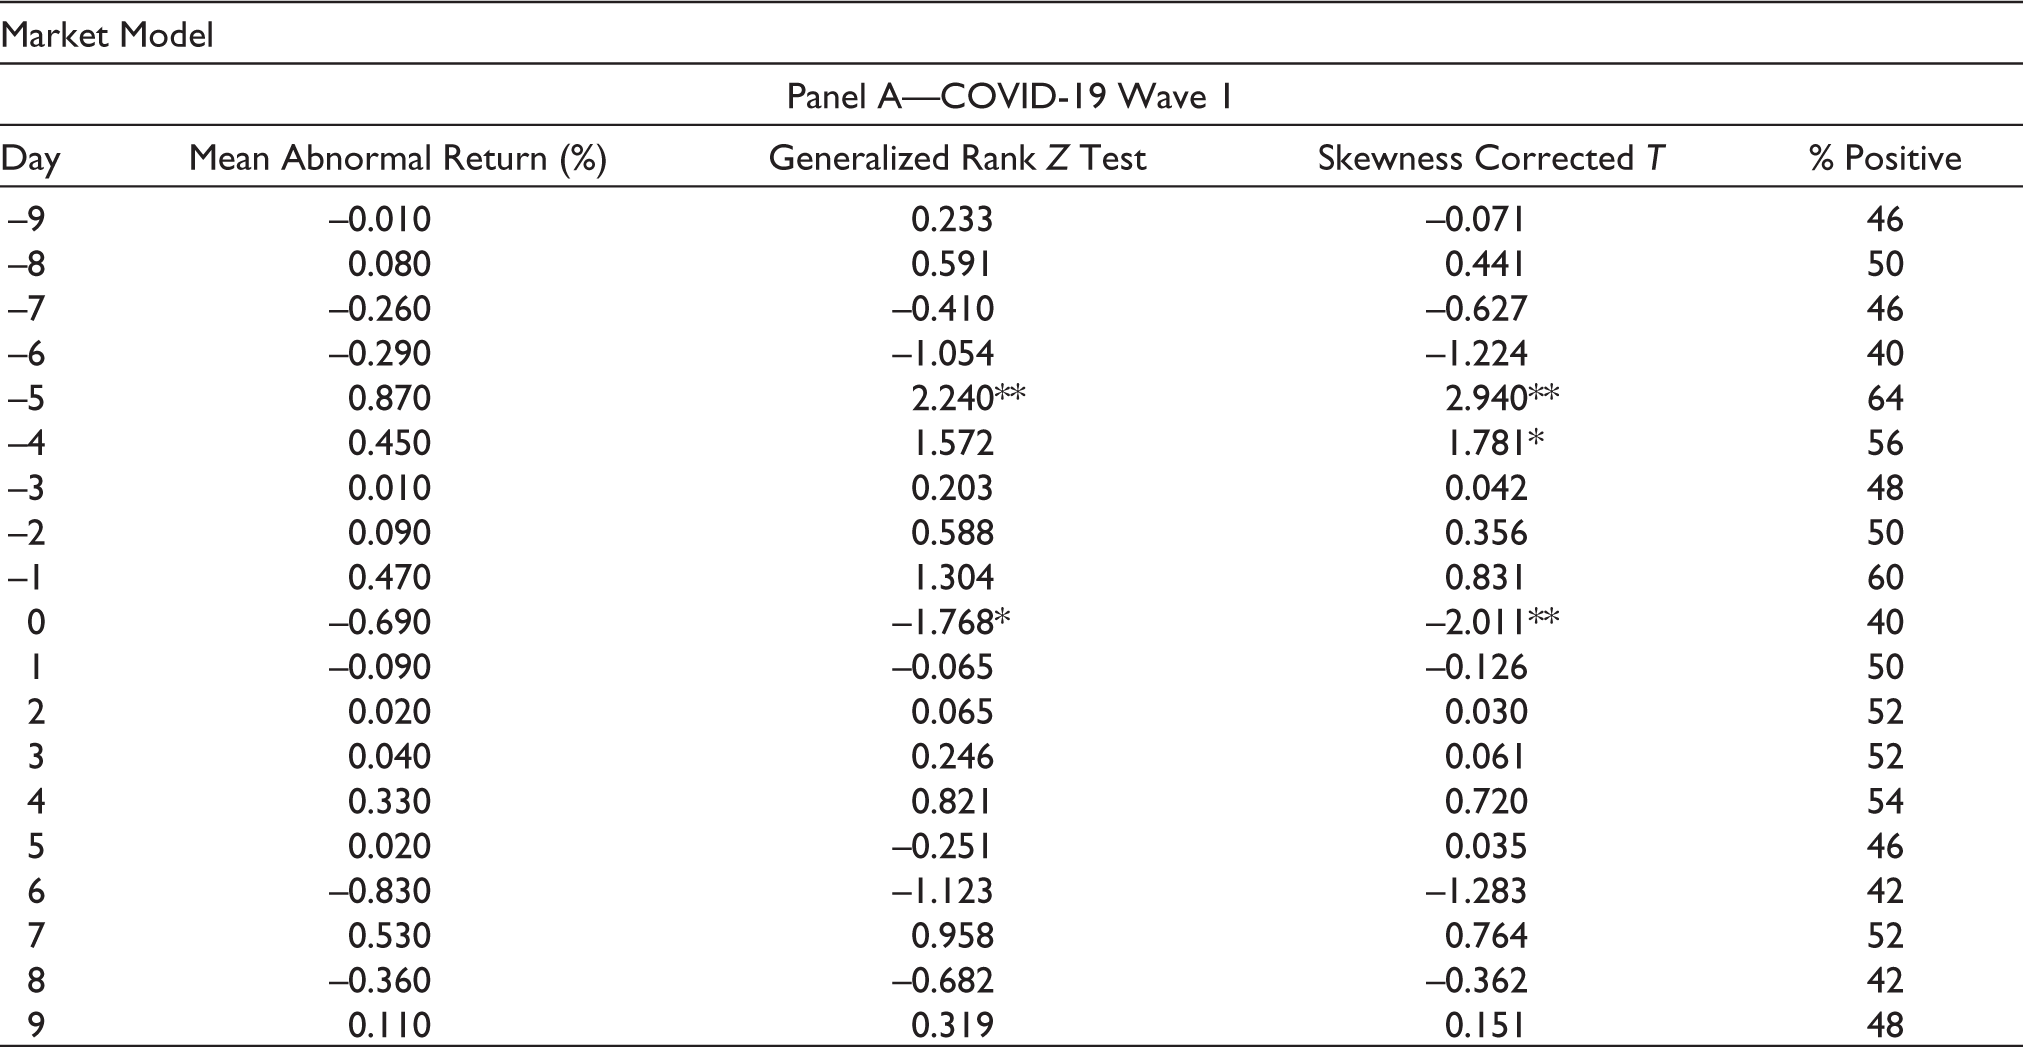
** Indicates significance at 5%.
*** Indicates significance at 1%.
Our evidence of negative mean abnormal returns on event day supports Mandal and Rao (2010) and shows that markets react similarly to negative news. Our results for wave 1 agree with CapturSun et al. (2021), who have also reported negative stock returns during the event window. Singh et al. (2020) reported significant abnormal returns on event day and stated that nations with close geographical or economic links to China experience negative abnormal returns during the event window. During wave 2, we did not find evidence of statistically significant mean abnormal return on the event day. 17 of the 19 mean abnormal returns are insignificant according to both Generalized Rank Z Test and Skewness Corrected T. The mean abnormal returns on days 2 and 3 are negatively and statistically significant according to both the test statistics. Investors are shown to react differently during waves 1 and 2, and these findings agree with Maneenop and Kotcharin (2020), who found similar behaviour that investors react differently in the global airline industry. During wave 2, the present study found an under-reaction of investors to the second wave 2 of COVID-19 in India.
Table 6 presents the results of cumulative average abnormal returns (CAAR) and test statistics. Panel A shows results during wave 1, and panel B depicts results during wave 2. CAAR is shown to be negatively and statistically significant on event day during wave 1, and CAAR is found to be insignificant on event day during wave 2. We reject the null hypothesis during wave 1 for CAAR and fail to reject the null hypothesis during wave 2. During wave 1, the results show that FMCG and consumer durable sectors experienced positive average abnormal returns while automobile, construction, energy, engineering, technology and financial sectors have experienced negative mean abnormal returns. During wave 2, consumer durables, engineering and technology sectors experienced positive abnormal returns, while automobile, construction, energy, financial, FMCG, and healthcare sectors experienced negative abnormal returns. Our findings of positive or negative abnormal returns for firms in India partially agree with Liu et al. (2020b), who have studied different sectors in the Chinese stock market. We found that COVID-19 is a fundamental cause for the market reaction during wave 1, and COVID-19 provided an opportunity for traders and speculators to create profitable opportunities.
Wave 1 and Wave 2 CAAR.
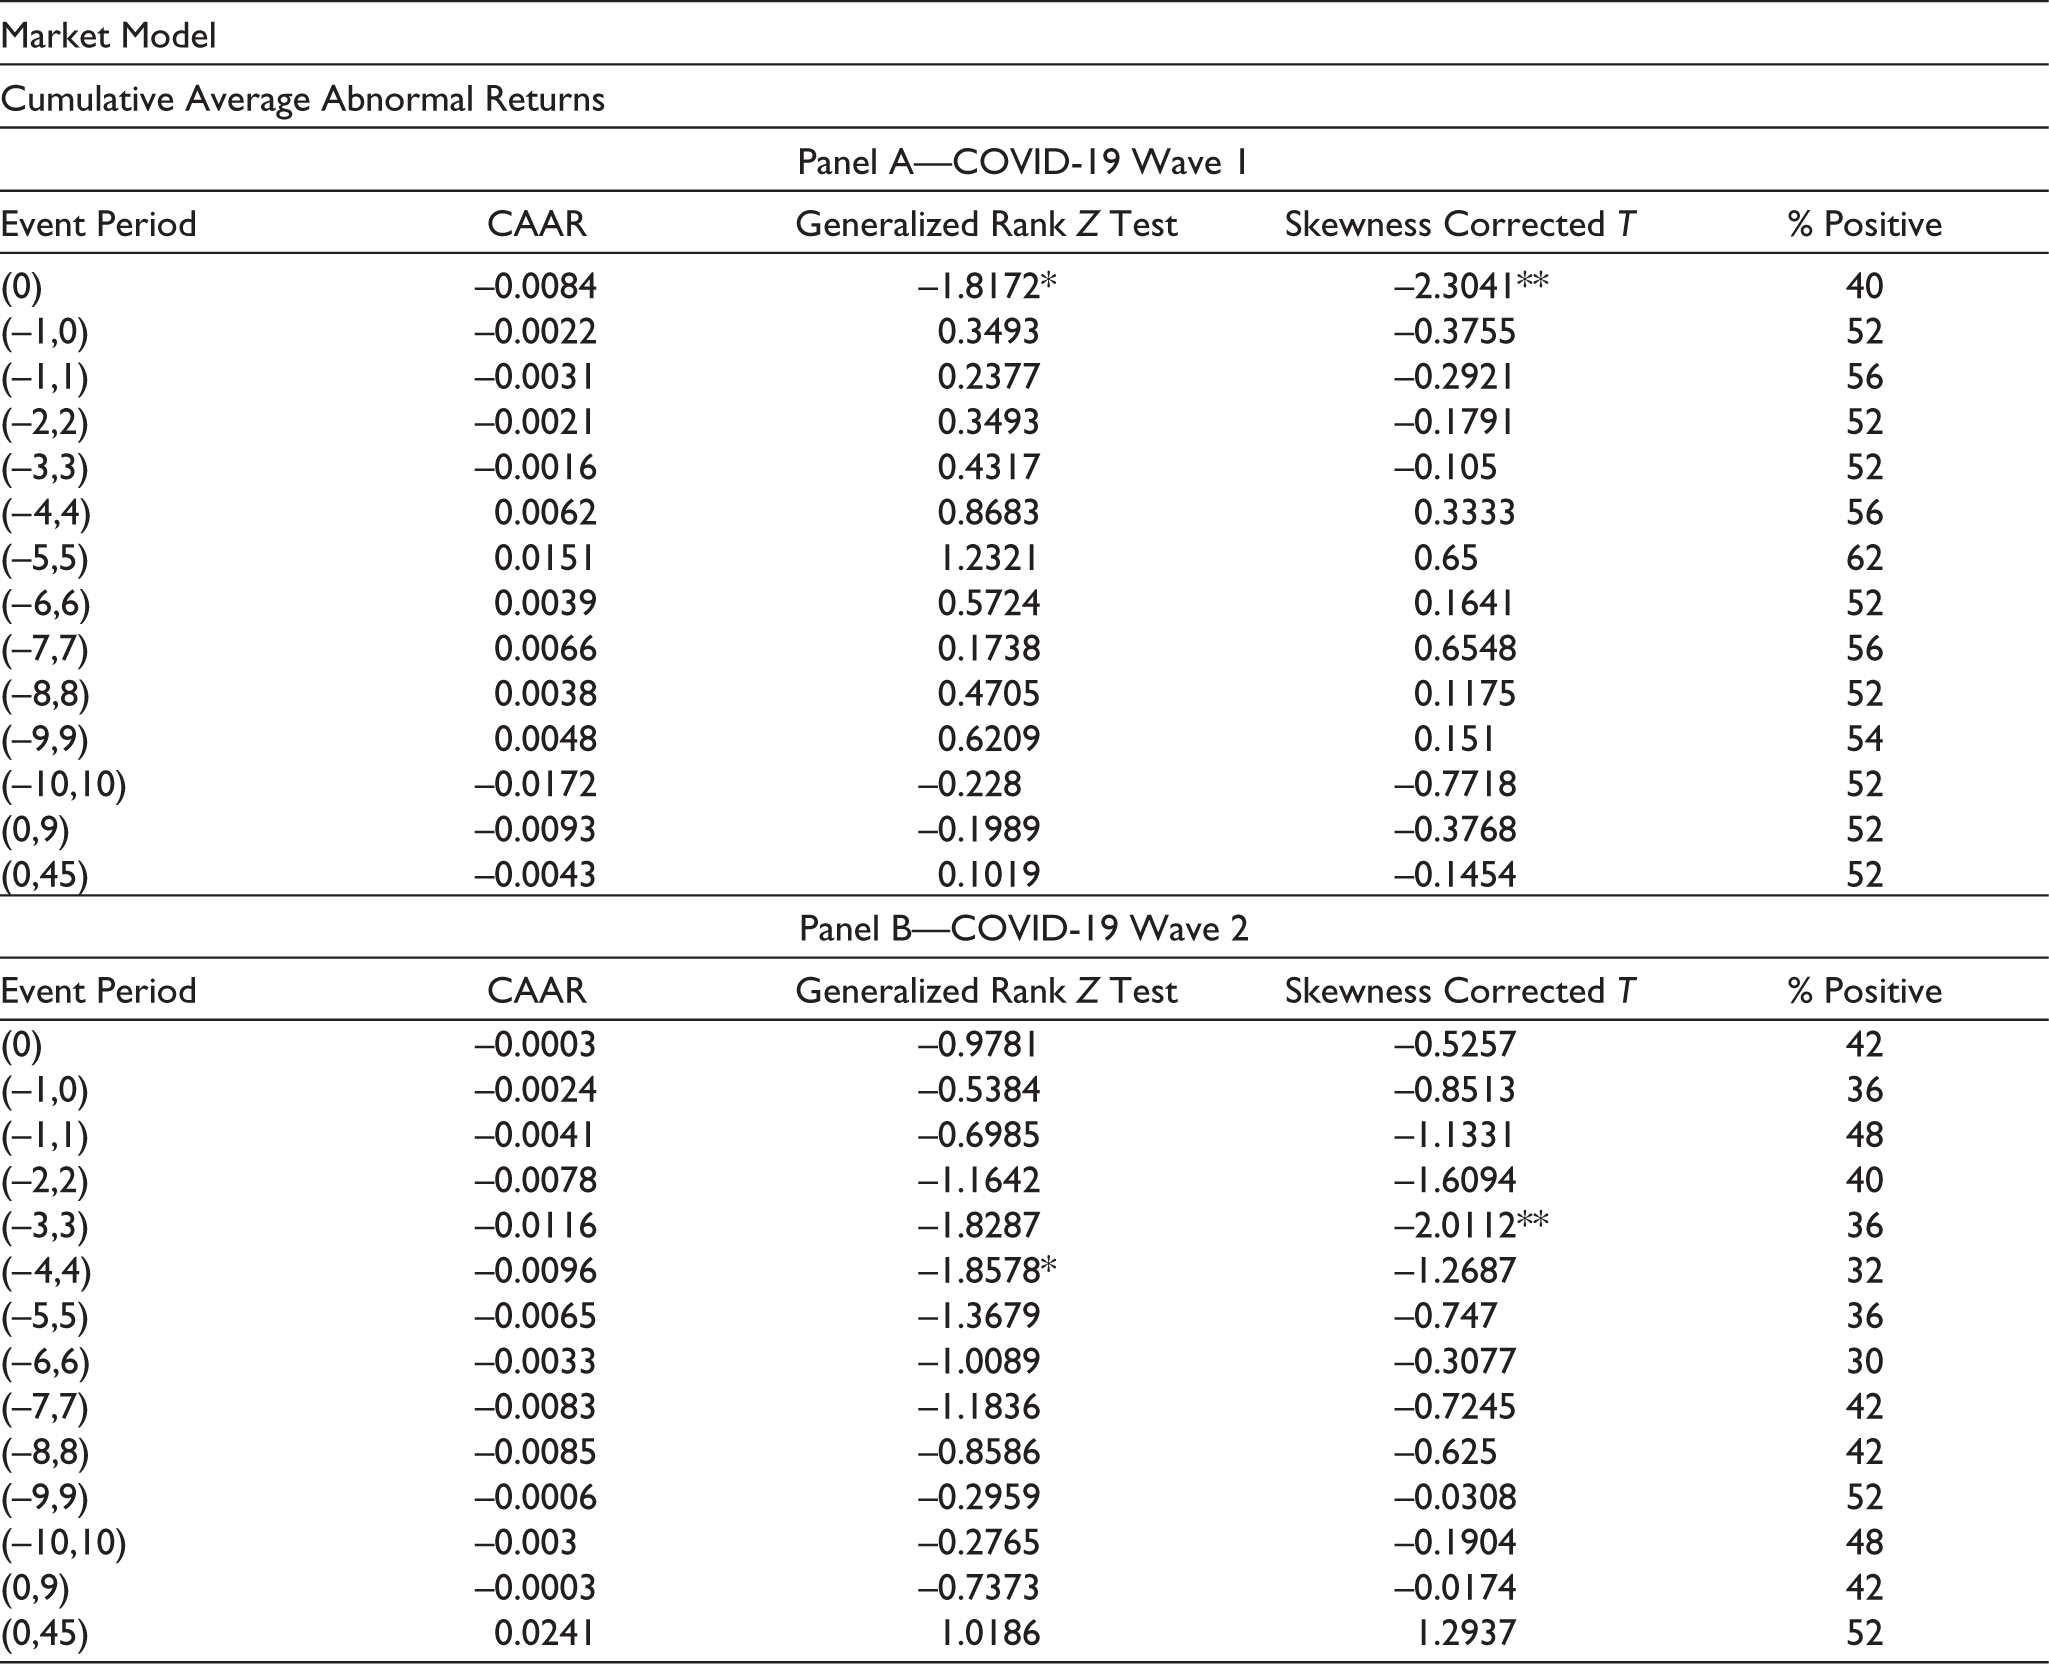
** Indicates significance at 5%.
Regression Model Results
Table 7 presents the sample firms’ regression results for waves 1 and 2. The study reports robust standard errors to deal with heterogeneity issues. To check for endogeneity in reported regression results, we performed the Hausman test and failed to reject the null hypothesis. Several studies have explored abnormal returns during event windows using regression models, like Lin and Falk (2021), which explored index returns, and systematic and idiosyncratic risk significantly explaining abnormal returns. CapturSun et al. (2021) who have investigated the impact of sentiment and characteristics of stocks such as price/earnings ratio, price to book ratio, and institutional shareholding ratio and found these variables statistically and significantly associated with returns. Liu et al. (2022) found COVID-19 confirmed cases, returns of security, returns of the market, and region (Asia) used as dummy variables to be significant for capturing abnormal returns. Singh et al. (2020) used confirmed cases of COVID-19, index returns, market returns, abnormal trading volume, and developing countries as a dummy variables to investigate abnormal returns. Xiong et al. (2020) stated that firm size, profitability, growth and leverage significantly influence the impact of COVID-19 on firms in terms of firm performance. Specifically, they documented that larger firms, better profitability, and higher leverage are less negatively impacted by COVID-19. Hence, we tested for the effect of firm-specific characteristics on the abnormal returns on event day because the literature has already documented the effect of confirmed cases of COVID-19, stock returns, market returns, and stock risks. ROA is found as positively and statistically significant during wave 1 for the sample firms, but no evidence has been found of the impact of any firm-specific characteristics on abnormal returns during wave 2. It shows that the abnormal returns during wave 1 are influenced mainly by COVID-19. The presented regression results are robust to different event windows, estimation windows and different statistical tests.
Regression Model Results.
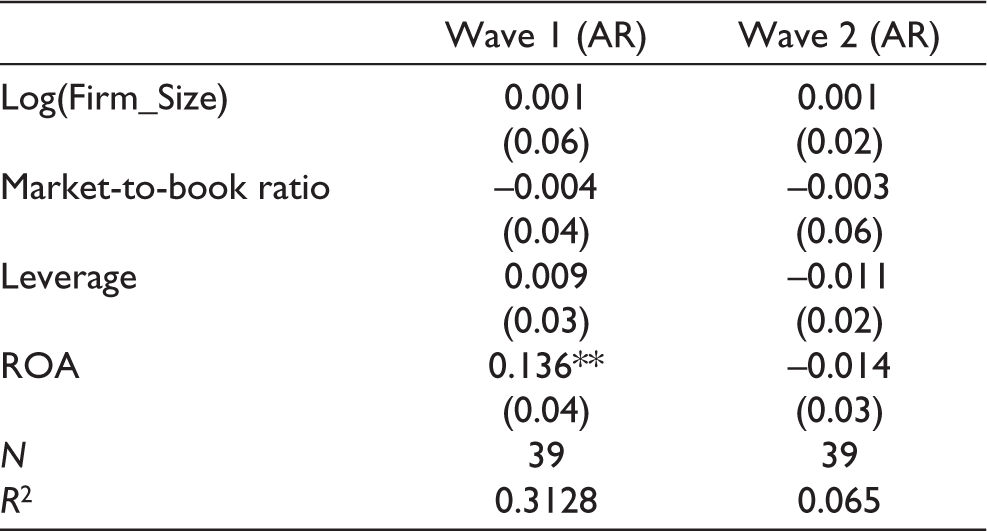
Robust standard errors are reported in the parenthesis.
Implications
The empirical results provide insights to the practitioners for diversification and asset allocation. As investors are prone to sentiments, it is advisable to monitor investor sentiment while making an investment decision. Studies on the impact of COVID-19 will help investors to understand the mechanism of the stock market toward black-swan events. This study can also be compared with previous pandemics, natural disasters, or terrorist attacks to see how the stock market reacts to different unanticipated events. Our results also indicate that policymakers should focus on programs promoting investors’ confidence during a crisis. One major limitation of the study is the focus on the large listed firm in India. Nevertheless, as Lin and Falk (2021) suggested, large firms depend on smaller firms through direct or indirect linkages; hence, our results provide appropriate representatives from the market. Future research avenues can extend the analysis to other countries and compare the results during wave 1 and wave 2 to provide more insights. Future studies can also extend the scope of research to study sector-specific abnormal returns and provide insights on sector-specific performance during the pandemic.
Conclusion
This article is the first to explore the effect of the COVID-19 outbreak on the stock market in India by focusing on waves 1 and 2. This article comprehensively discusses the impact of COVID-19 on market sentiment and stock market returns. Using daily data on new cases of COVID-19 and sentiment proxies from 31 January 2020 to 31 May 2021 and applying wavelet coherence methodology, we found co-movement between sentiment proxies and new cases of COVID-19. ADR and TV show an out-phase co-movement with new cases of COVID-19, whereas VIX shows an in-phase co-movement with new cases of COVID-19 during the first wave of COVID-19. COVID-19 impacts the sentiments of investors in short to medium horizons. Similar results were found in wavelet coherency between new deaths due to COVID-19 and several sentiment proxies. However, no major significant co-movement and coherency were observed between COVID-19 and sentiment during the second wave of COVID-19. We also performed event study analysis and divided our sample data for two event studies during waves 1 and 2 of COVID-19. We took 11 March 2020 and 10 February 2021 as the event days for waves 1 and 2, respectively. We found that during wave 1, 40% of firms experience positive abnormal returns. We found a significant negative abnormal return on the event day. Also, cumulative average abnormal returns on event day during wave 1 are statistically significant and negative on the event day. Results suggest that investors panicked during the initial onset of the COVID-19 wave. During wave 2, we found no significant abnormal returns or cumulative average abnormal returns. Investors have not reacted much to the second wave of coronavirus. Using regression analysis, the results show that ROA is significantly associated with abnormal returns, and other firm-specific variables such as firm size, market-to-book ratio, and leverage do not impact abnormal returns during wave 1 and wave 2 of COVID-19.
Footnotes
Declaration of Conflicting Interests
The authors declared no potential conflicts of interest with respect to the research, authorship, and/or publication of this article.
Funding
The authors received no financial support for the research, authorship, and/or publication of this article.
Appendix
Variables Description.
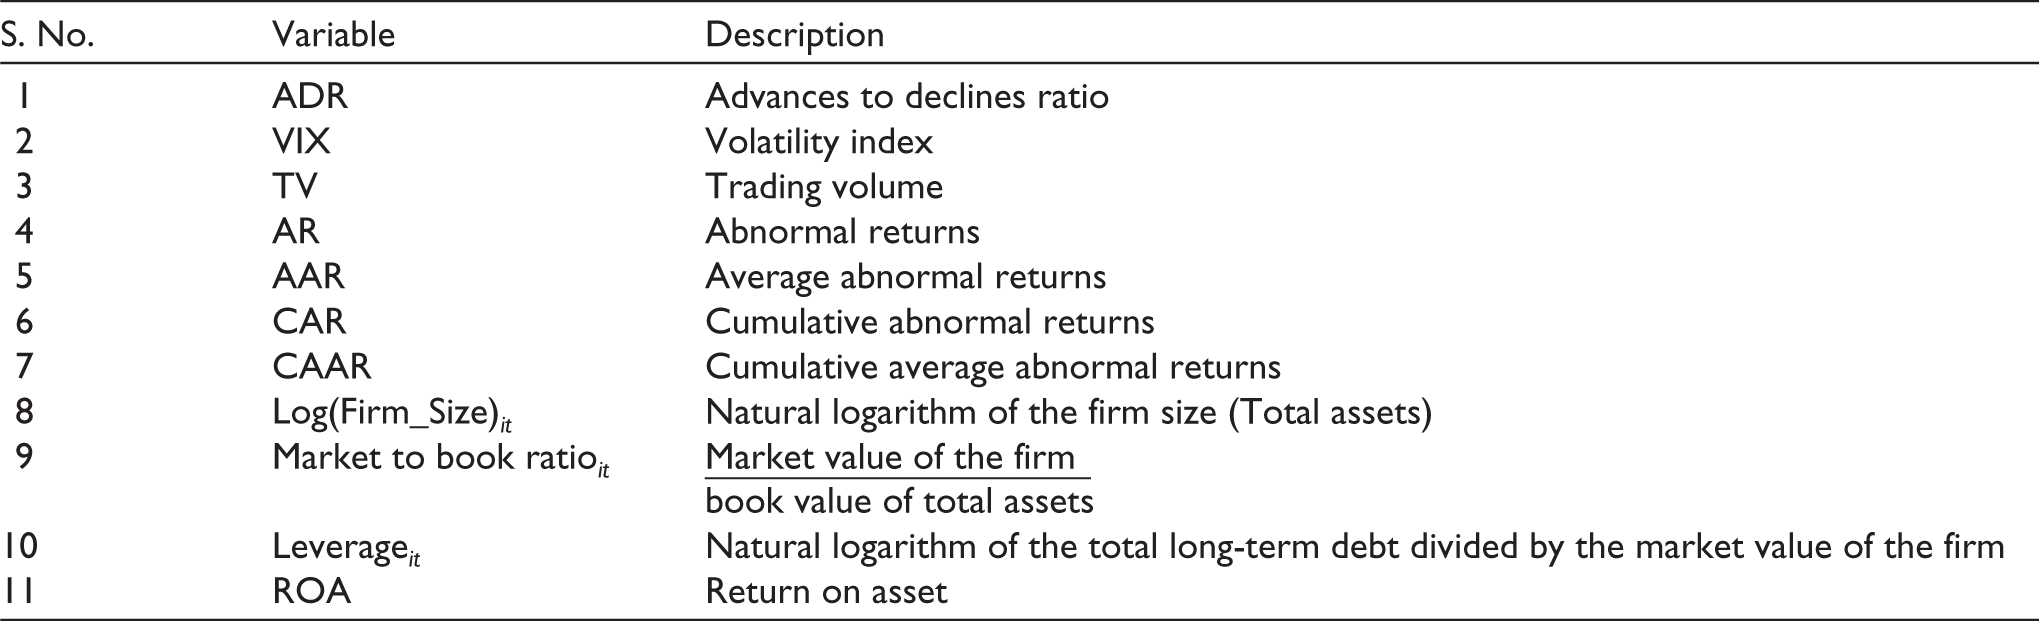
| S. No. | Variable | Description |
| 1 | ADR | Advances to declines ratio |
| 2 | VIX | Volatility index |
| 3 | TV | Trading volume |
| 4 | AR | Abnormal returns |
| 5 | AAR | Average abnormal returns |
| 6 | CAR | Cumulative abnormal returns |
| 7 | CAAR | Cumulative average abnormal returns |
| 8 | Log(Firm_Size) it | Natural logarithm of the firm size (Total assets) |
| 9 | Market to book ratio it | Market value of the firm book value of total assets |
| 10 | Leverage it | Natural logarithm of the total long-term debt divided by the market value of the firm |
| 11 | ROA | Return on asset |