




Abstract
Abstract
This paper formulates a model of the optimal export decision of private firms and then empirically studies the effect of firm size, R&D activities, competitiveness and trade policies on export performance of Indian private firms during the period 1975–1986. India practised restrictive trade and industrial policies and introduced partial liberalization of trade policies in the early 1980’s to encourage exports. The paper argues that the Cragg model is more appropriate to model firms’ export behaviours under India’s restrictive trade policies than the commonly used Tobit model. The evaluation of the export promotion and partial import liberalization policies of 1980 based on the Tobit model is found to be qualitatively quite different from the evaluation based on the Cragg model. The LR and LM specification tests reject the Tobit model against the Cragg model in all specifications.
Keywords
Introduction
Since its first Industrial Policy Resolution in 1948 until the early 1980s, India’s restrictive trade, technology and industrial policies severely affected its industrial development and led to poor export performance, foreign exchange crises and to eventual dismantling of these restrictions in 1991. India protected its industry from foreign competition by introducing high tariffs and quantitative restrictions on imports. India restricted its domestic competition by reserving a large number of goods for production by small-scale firms and by limiting the capacity expansion of existing firms. To encourage indigenous technology production, India gave fiscal incentives to firms to do in-house R&D, and severely discouraged import of technology by setting very low limits on royalty payments to foreigners, and by imposing high tariff and other non-tariff barriers to import capital goods, and by virtually banning direct foreign investment. The technology and industrial policies also created strong entry and exit barriers. The world export market, however, consists of efficient firms drawn from all over the world. To succeed in the world export market, a firm must continuously modernize its technology by either importing technology or doing in-house R&D. Due to the above restrictive trade and technology policies, Indian firms gradually lost their comparative advantage; by 1980, India lost its market shares in the export markets for most manufacturing products. 1
India also benefited from its inward looking trade and technology policies. See Desai (1984) for an account of some of the positive and negative achievements that could be attributed to India’s technology policies. See Srinivasan (1996) for a critical appraisal of India’s trade and industrial policies.
To correct these severe policy mistakes, the Indian government initiated limited import liberalization and export promotion policies in its 1980 Industrial Policy Statement. The main focus of these policies was to improve productivity growth and increase export earnings. Since the exporters had lost international competitiveness, being forced to use high-cost domestic inputs, they were granted the opportunity to import raw materials, machine components and capital goods on more liberal terms; limits on royalty payments of exporting firms were raised substantially upward, and sometimes they were also given cash benefits and duty exemptions on imports to make up for their use of high-cost domestic inputs. The exporting firms were allowed to import R&D related capital goods more easily and were given fiscal benefits to do in-house R&D.
The literature is sparse on the models of firm-level exports, incorporating imperfect market structures. Most theoretical models of trade that incorporate imperfect competition assume that firms within an industry are homogeneous in terms of technology or cost function. The focus of this literature has been to find conditions under which there is intra-industry trade and to study the welfare effects of various trade policies (see Helpman & Krugman, 1985). The firm-level empirical analyses of exports incorporating imperfect market structure are limited to developed countries. Among a few others, Glejser, Jacquemin and Petit (1980) tested the implications of imperfect market structure on export performance of Belgian firms, Wakelin (1998) studied the effect of firm R&D expenditures on export performance of British firms and Sterlacchini (1999) studied the effect of non-R&D type of innovative activities on exports of small Italian manufacturing firms.
The empirical literature on the firm-level export behaviour of less developed countries is even sparser. Among a few others, Roberts and Tybout (1997) and Clerides, Lach and Tybout (1998) carried out studies on Colombia, Mexico and Morocco. The firm-level studies on Indian exports include Kumar and Siddharthan (1994), Patibandala (1995) and Hassan and Raturi (2002) works. These studies mostly focus on the effect of firm size and R&D expenditures on export performance.
Most empirical studies, with the exceptions of Wakelin (1998) and Hassan and Raturi (2002), formulate export behaviour as a Probit or Tobit model, and none of these studies examine the role of competitiveness on export behaviour.
In this paper, I analyse how R&D activities influence export performance of private firms when they operate in an imperfect market structure induced by the above type of policies. I estimate the effect of competitiveness on a firm’s export decision. I, first, theoretically model the optimal export behaviour of private firms varying in technologies and operating in an imperfect market structure that resulted from Indian protective policies. I use this model to guide my econometric specifications. I argue that the Tobit model is not appropriate to analyse the effect on export decisions of the export promotion and import liberalization policies that were introduced in the 1980s. The Tobit model of firm-level exports assumes that any variable that increases the probability of positive export must also increase the average volume of export of the exporting firms. Given the nature of Indian policies, it is possible that a firm will like to attain the exporting status by exporting some positive amount so that it can take advantage of the benefits given to the exporters such as easier terms for importing technology, capital goods, raw materials, increase production capacity and will utilize tax incentives for doing in-house R&D. In other words, by attaining the exporting status, the firm will be able to adopt a better technology that lowers the cost of production, raising the profits from sales of goods in the domestic market and in the international market even if the firm ends up paying a set-up cost for this technology. After the above type of export promotion and import liberalization policies are introduced, a firm is more likely to enter the export market; but its export volume is likely to be small. The average exports of firms of a given firm size will be lower after the introduction of such policies. Similarly, the effect of R&D activities may differ for the probability of export and for the average volume of export of the exporting firms, given the type of incentives that were introduced for R&D activities of the exporting firms. The Cragg model is more flexible than the Tobit model as it assumes separate models for the decisions to export and the volume of exports. In the paper, I carry out the likelihood ratio (LR) test and the Lagrange multiplier (LM) test of the Tobit model against the Cragg model, and find that the Tobit model is rejected in all specifications. I then point out some of the major differences in the policy evaluations that could be drawn from these two models.
The rest of the paper is organized as follows: In the next section, I describe the theoretical model of the optimal export decisions of private firms. I examine the theoretical predictions of the model regarding the effects of firm size, productive efficiency and domestic and foreign competition on exports decisions. In the section ‘The Data Set’, I describe the panel data on a sample of 415 firms during the period 1975–1986 that I use in this study. This 12-years period is also suitable for assessing the effect of the partial import liberalization and the export promotion policies that India introduced in 1980. In section ‘Econometric Formulation and Empirical Findings’, I use the model of section ‘A Model of the Optimal Export Decision’ as a guidance to formulate the empirical specification of the Cragg model, carry out two specification testing of the Tobit model against the Cragg model and point out the type of wrong policy conclusions that may be drawn, if one uses the Tobit model instead of the Cragg model. In the last section, I have my concluding remarks.
A Model of the Optimal Export Decision
I develop a model of the optimal export decision of a private firm. To maximize profit, the firm decides the supply of its product for the domestic market, and it takes the international price of its product given and decides the volume of exports. I, first, adapt the standard model of firm behaviour to formulate a model of exports, which leads to the Tobit specification for its econometric estimation. I then extend the framework by incorporating the feature that export promotion policies can make it possible for a firm to use a better technology, lowering its cost of production and making export a viable profit-maximizing choice that was not cost effective before. This leads to the more flexible Cragg model specification for its econometric estimation. I use a numerical example to further illustrate the implications of the model for the optimal exports decisions. I then use the model to illustrate how the decision to export and the average volume of export are related to the type of domestic competition conditioned by various industrial policies, foreign competition conditioned by import tariffs, quotas and non-tariff barriers, and to technological backwardness fuelled by the restrictive technology import policies.
Market Structure
Given the protective environment created by the restrictive trade, technology and industrial policies, the Indian firms act as monopolists in the industry, each producing a product similar to others but differentiated by variety. Each firm takes as given, the output levels and prices of other firms, the tariff rates and the volume of imports of similar goods and acts as a monopolist in the residual market. The firm assumes that its actions in its own market do not influence other firms’ demand curves and their actions. Or in other words, each firm is very small, relative to the total size of the industry, but in its own market it acts as a monopolist. Thus, the firm takes the export price net of transport cost pw as given and decides the optimal level of export qe and the domestic supply qD. The supply to the domestic market determines the domestic price pD through the inverse demand curve (AR). All other firms in the industry act the same way, but they are heterogeneous with respect to their technology and installed capacity. More specifically, I assume a monopolistically competitive industrial structure in which the firms make their optimal decisions for supplies to the domestic market and exports for the international market. 2
An alternative formulation would be the oligopolistic market structure of the domestic market. There are, however, not enough empirical studies to ascertain which structure is relevant for Indian firms. It is likely that the monopolistic competition framework is more appropriate to model the industrial structure of lighter industries, and oligopolistic competition for heavier industries.
I assume that when the price is the same, the consumers prefer a foreign variety over a domestic variety of a good. So the domestic producers act in the residual market. In this residual market, each producer may try to grab as much market share as possible by advertising and creating consumer confidence in their product. I assume that these activities are either absent or all firms behave identically in this respect. 3
This is a simplifying assumption for our empirical analysis since I do not have information on such activities in my data set.

Production Technology
I represent the technology by cost function. I assume that the cost to produce a given level of output consists of a fixed cost, which depends on the installed capacity, and a variable cost, which is assumed to be increasing in the output level produced above the installed capacity. This leads to a U-shaped average cost curve, shown in Figure 1 as AC. The output level at which the AC is minimized depends on the installed capacity of the firm: The higher the level of installed capacity, the higher is the output level q at which the AC is minimized. Thus, installed capacity can be characterized by the horizontal position of the tip of the AC curve.
The Indian firms were restricted from importing foreign technology in every possible way: They were restricted in purchasing blueprints from abroad due to limits on royalty payments to foreigners and from importing capital goods with embodied foreign technology due to high tariff rates and other non-tariff barriers to such imports. I assume that given their licensed capacities, the firms obtained their technologies from various sources at various times. I also assume that the firms varied in their managements. These led to differences in their cost curves. Given their licensed capacities, I represent the variations in cost curves across firms by a parameter
I further assume that the firms from the rest of the world that are active in the world export market are perfectly competitive and have achieved the long-run cost curve corresponding to the best available technology in the world. Because of the limitations mentioned above, the unit cost of production is higher in India as compared to the cost of production of its peers in the world economy. Even then, it is possible for Indian firms in some industries to have lower unit cost of production as compared to their counterparts in the world market, as the Indian firms can utilize cheap labour and local materials as inputs. For these firms, exports will be profitable.
The Optimal Firm Behaviour
Assume that exporting of a product by any resident other than the monopolist is prohibitively costly or illegal. The optimal strategy of the monopolist to maximize its profit is to quantity discriminate in the two markets–supply q
D
for the domestic market and q
e
for the international market. Total output produced is.



Equation (2) is the standard textbook condition for profit maximization, MR = MC. But because of export decision, we have the additional condition of Equation (1), which says that MC = world price if there is positive export, and for the firms which do not export, pw < MC, that is, the export price is lower than the MC of production.
Notice that in case of positive exports, the first order conditions become
Thus, it is clear from the above that given pw and the cost function, which is characterized by the vector of parameters


The above is the Tobit model of the optimal exports, in which the same
Notice that given a market condition
The degree of competitiveness of a firm can be measured by the Lerner index, also known as the price–cost margin,
A Linear–Quadratic Example
Assume that that the average revenue function is linear and the average cost function is quadratic as follows: The AC function is given by




From the above, it is clear that if the market condition is fixed, the domestic supply and the domestic price will remain constant. A lower value of the parameter b will mean a higher cost efficiency, and a higher value of the parameter a will mean a higher level of installed capacity. From Equation (6), it is clear that the effect of a higher cost efficiency or a higher installed capacity, that is, with a south east shift of the cost curve—due to obtaining a better technology, cheaper raw materials from abroad or from the result of subsidized in-house R&D investments and government’s relaxation of the installed capacity limits of the exporters—will increase the volume of export. Furthermore, it is clear that the PCM of the exporting firms depends only on the intercept term of the demand function, but not on its slope term or any of its parameters of the cost function. A higher domestic competition, effected by relaxing the entry policy or by reducing the import tariff, will reduce the values of the parameters c and d. This will lower the magnitude of the PCM. Its effect on qD and hence on export volume will depend, however, on the relative magnitudes of the declines in the values of these parameters. If only c declines but not d, or d declines very little, then it is clear from Equations (5), (7) and (8) that the firm will supply less to the domestic market and more to the export market; the price in the domestic market will fall and PCM will also fall. If only d falls, the export amount will decline and domestic supply will increase, without affecting the domestic price. However, if the fall in d is relatively high, the firm might stop exporting and operate only in the domestic market as a monopolist, charging a higher domestic price and changing its production level as well (see the numerical example, row (5) Table 1).
Numerically computing 4
The numerical exercise is carried out in Maple 2000.

Numerically Computed Solutions for Different Parameter Values
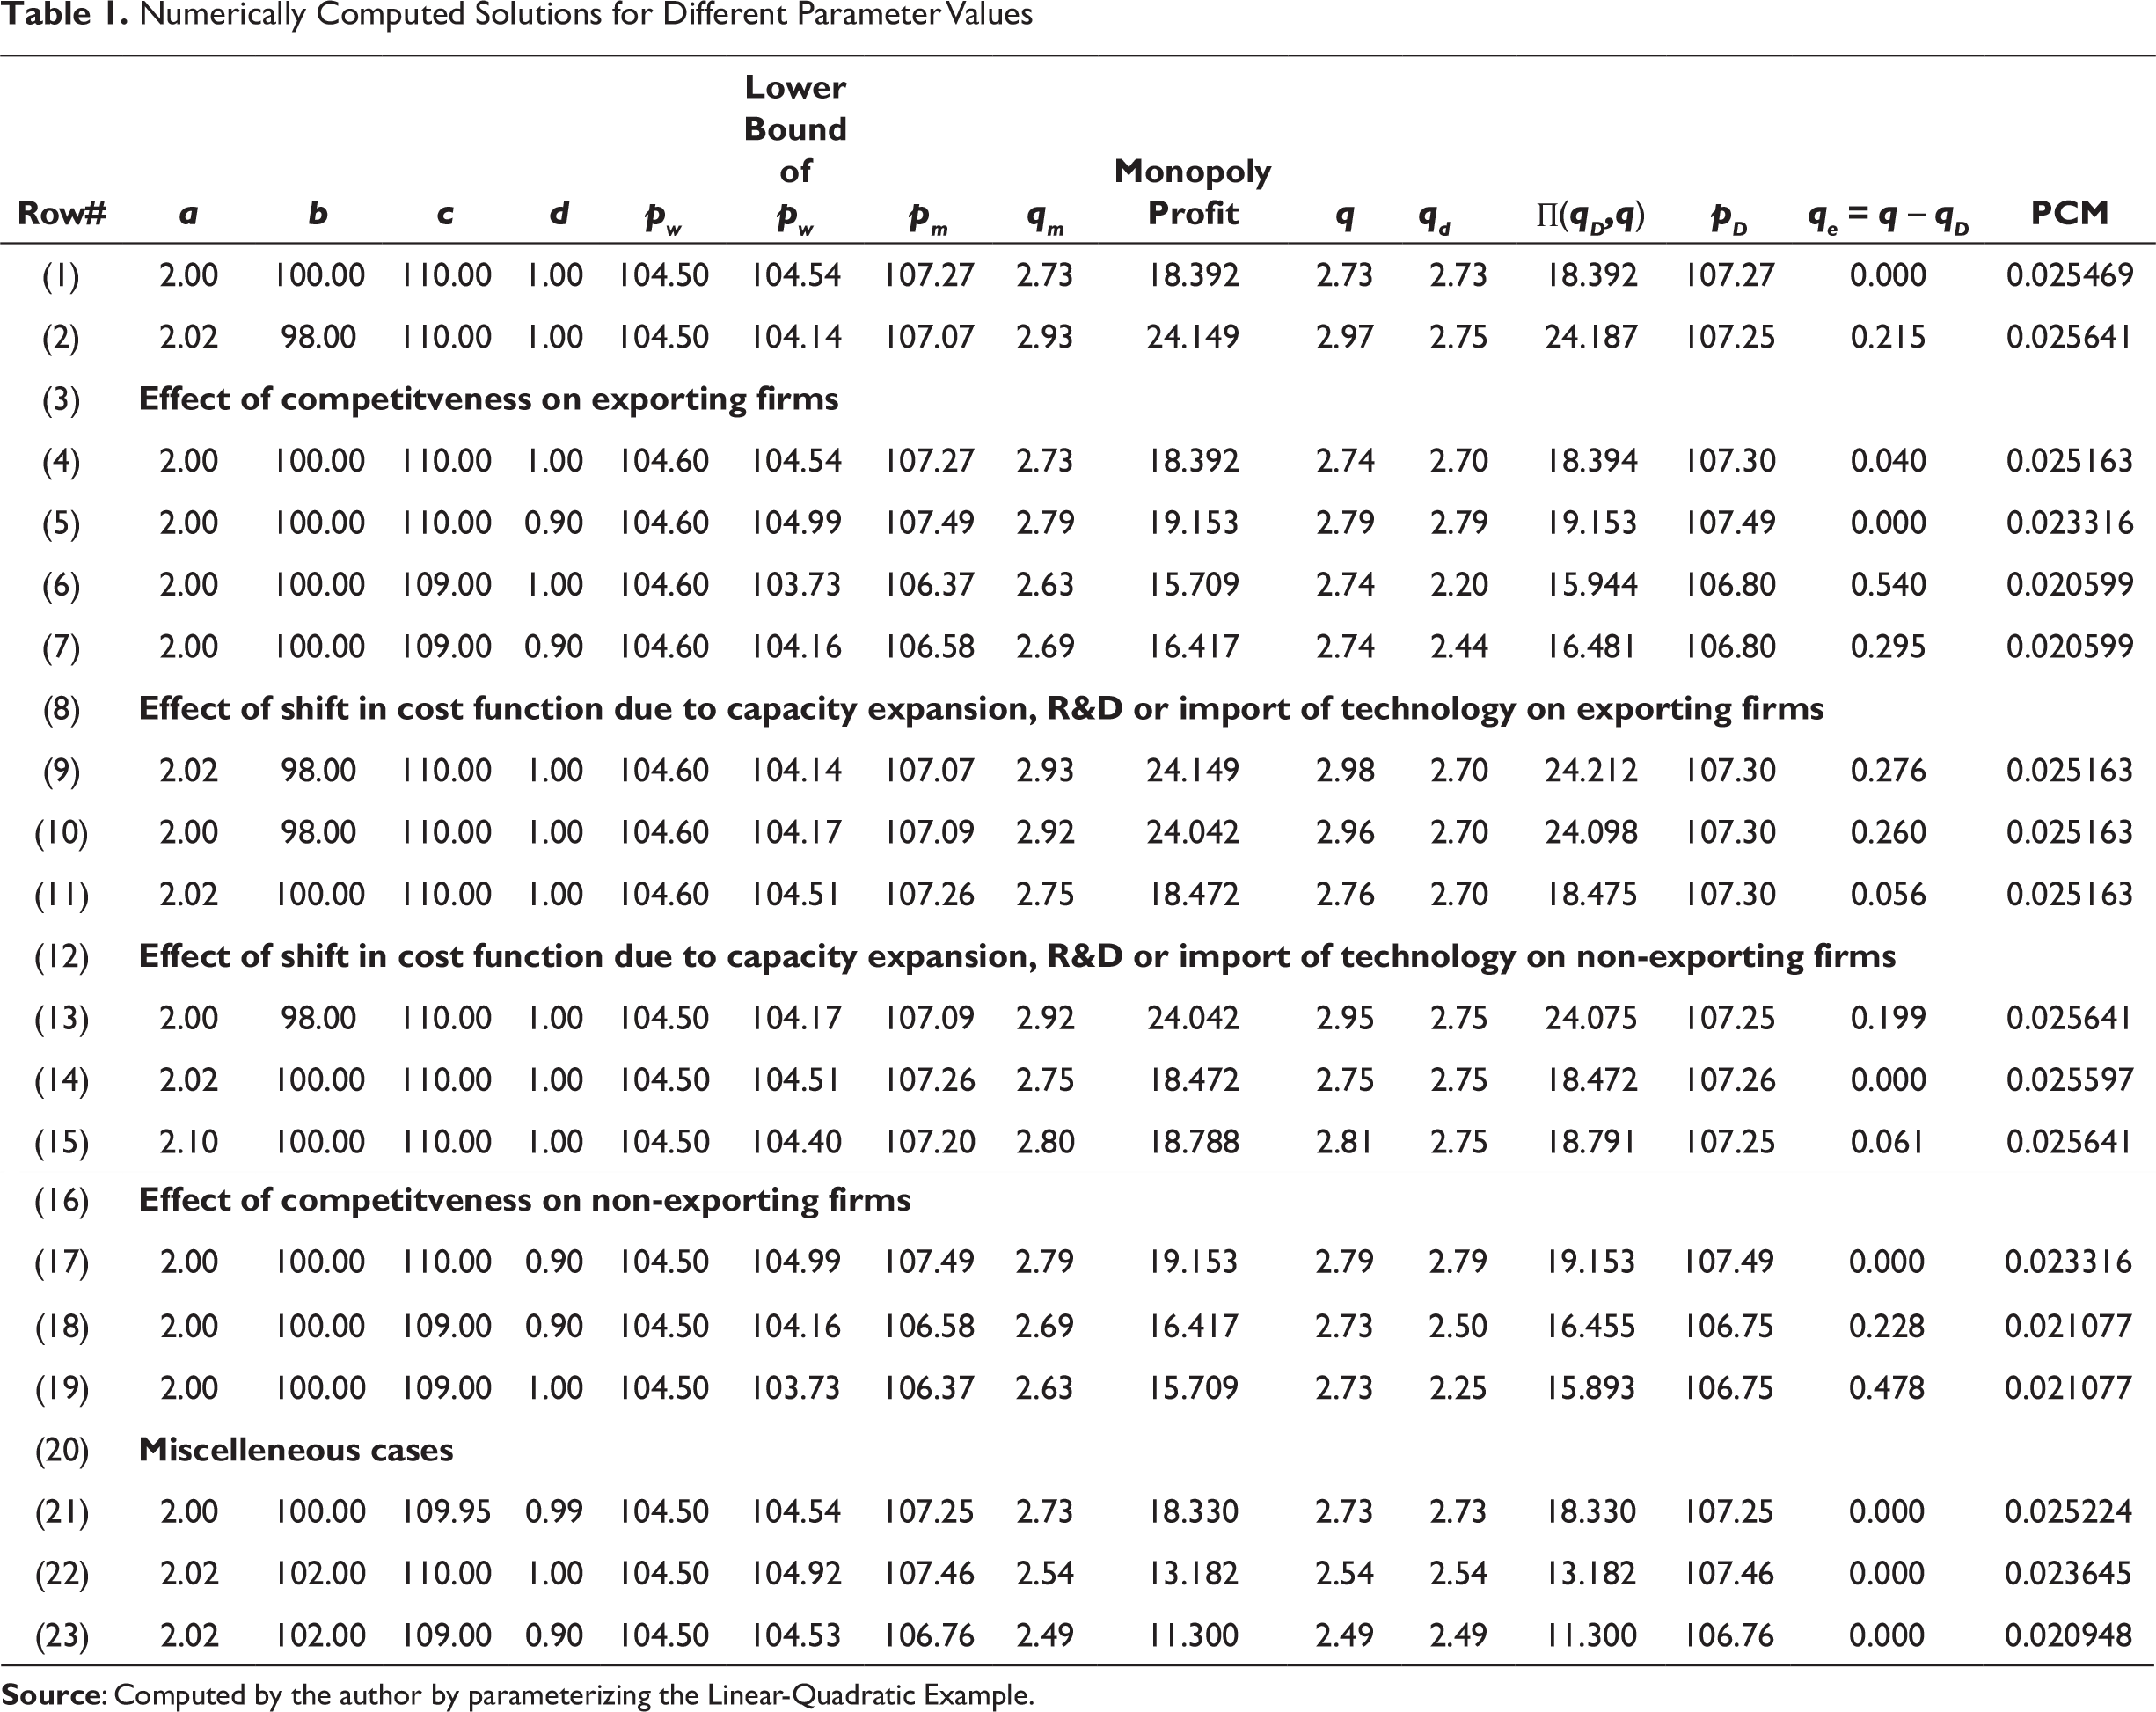
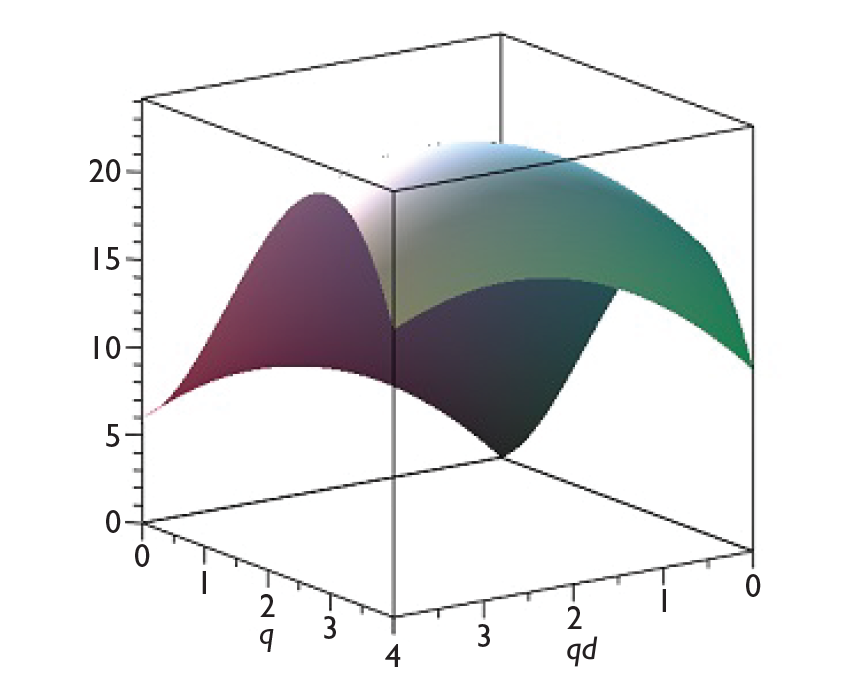
Let us first consider the baseline non-exporting firm (see row (1) of Table 1 and the solid curves in Figure 3). Given its technology and given the protected market condition, the firm’s optimal decision is not to export and act as a monopolist in the domestic market. It earns a profit
Let us consider now the baseline exporting firm (specified in row (3) of Table 1). A firm might not be able to take advantage of all the provisions of the export promotion policy. Suppose it utilizes the provision to increase its installed capacity limit from a = 2 to a = 2.02 (see row (11) in Table 1); or it utilizes the R&D subsidy provision of the policy to increase its R&D investments so that its productive efficiency level improves from b = 100 to b = 98 (see row (10) in Table 1). In both cases, we see that there will be higher exports.
Now let us examine the effects of higher competitiveness on export activities. Consider first the baseline non-exporting firm in row (1) of Table 1. From rows (17)–(19) in Table 1, it is clear that if the competitiveness makes the demand curve flatter without changing the intercept term, it may not have effect on its exporting decision. However, if it lowers the intercept term and makes the demand curve flatter by the magnitude shown in the parameter values in those rows, the firm will decide to export. As row (21) shows very small changes in the parameters c and b due to an increase in the competitiveness will not induce the firm to export. In all those examples, however, the PCM of the non-exporting firm becomes lower, the higher is the competitiveness.
Now consider the effect of a higher competitiveness on exports and the PCM of the baseline exporting firm (row (4) in Table 1). From the analytical solution of the PCM for the exporting firms in Equation (8) and from the numerical solutions in rows (4)–(7), it is clear that if a higher competitiveness reduces only the value of the parameter d, it does not affect the firm’s PCM; some exporting firms may stop exporting and supply only to the domestic market. If it reduces both the intercept and the slope of the demand curve, or only the intercept term of the demand curve, the PCM falls and the export volume rises in the cases we considered.
Extensions and Discussions
I have so far assumed that there are no extra costs or benefits associated with exporting activities. Exporting may involve extra sunk costs. For instance, a firm may have to invest in R&D to meet the product quality standard of the export market. In that case firms with R&D capabilities will have higher likelihood of exporting; see Roberts and Tybout (1997) for a model of optimal firm level export along this line. One firm’s R&D may create product and process innovations for the exporting markets, and other firms in the industry can benefit from such knowledge without investing in R&D. See Raut (1995) for evidence on R&D spillover in a different context. In this paper, I assumed R&D to be an exogenous variable and assumed that it does not create any externality. Exporting activity of one firm may reduce the information and networking cost associated with exporting of other firms in the same geographical area and in the same market. From this point of view, the presence of multinational enterprise (MNE) in an industry of a particular geographical area may influence the export decisions of local firms in the industry, see Aitken, Hanson and Harrison (1997) for a model along this line. While these effects are important, I have not pursed these aspects in this paper.
From the perspective of export promotion policy analysis, the above Tobit specification needs to be modified for various reasons. First, the export promotion policies that I mentioned in the introduction will allow a firm to import more efficient technologies, extend its capacity limit, import higher amounts of cheaper raw materials and to invest in R&D more cheaply, if it decides to export. All these will shift the cost curve of the firm to a south east direction and the firm may indeed find that becoming an exporter to avail all those facilities is a profitable decision.
For many reasons, the optimal size of exports that is given in Equation (4) (the Tobit model of exports) may be higher than the amount the firm will actually choose to export. For instance, a firm that is newly entering the export market will incur a higher cost of exporting its goods since it has to establish its supply chains, spend resources to establish consumer confidence in the world market and invest in R&D and quality control to maintain the international product standard. The size of the export of the newly exporting firm could be, therefore, lower than a firm with the same technology but that has been exporting for a while. Thus, the export promotion policy of the 1980’s may increase the probability of exports, but may have negative effect on the average volume of exports, at least for a few initial years. The Cragg model is more appropriate than the Tobit model for econometric analysis of the export promotion policy for these reasons, and other reasons further explained later.
The Data Set
Data on variables such as net sales, fixed assets, and wages and salaries were taken from various issues of Bombay Stock Exchange directory. Data on exports and imports of capital goods and raw materials came from annual reports of the individual companies that are registered with the Ministry of Corporate Affairs. The nominal variables were converted into real terms by using the wholesale price index numbers, which came from revised numbers for wholesale price indices, the Ministry of Commerce and Industry, the Government of India. The firms in this study are taken to be those that were registered with the Bombay Stock Exchange directory and the Ministry of Corporate Affairs and had paid-up capital of at least 50 lakhs. There were about 2500 firms registered with the Ministry of Corporate Affairs, out of which only about 900 firms were registered with the Bombay Stock Exchange directory. I had to further restrict the sample to firms having at least three consecutive years of data during the two periods to satisfy the data requirements for the econometric analysis, and I ended up with 415 firms in the sample. In this study, I define a firm to be exporting, if it had some amount of exports during the period 1975–1986. According to each firm’s primary output, I assigned a three-digit Standard Industrial Classification code taken from the Annual Survey of Industries (ASI) volumes published by Central Statistical Organization (CSO). Although it would be ideal to carry out an analysis at the two-digit industry level, due to paucity of data in certain industries, I regrouped the industries according to their technological complexities into two groups—light and heavy industries. The composition of each industry group and a few selected summary statistics of our variables are shown in Table 1.
The Industrial Classification of our Study

Econometric Formulation and Empirical Findings
From our model of the optimal export decision, it follows that the decisions to export and how much to export depend on the firm size, the cost factors represented by θc , the market demand conditions represented by θd and the export promotion policies. I take the logarithm of fixed capital as a measure of firm size. The cost parameter θc and the demand condition θd are not directly observed. In-house R&D investment and import of capital goods are assumed to be the main determinants of θc. It is often argued that barriers to import raw materials forced the Indian firms to use more expensive domestic raw materials, which increased the unit cost of production, and hence adversely affected export. I also included this as another determinant of θc to see if this type of import barriers affected export decisions adversely. Notice that θd depends on the tariff structure of the industries, the government policies mentioned earlier regarding entry and exit, and policies related to monopolies and restrictive trade practices (MRTP). The detailed information about these variables is not available, so I take PCM as a summary measure of these factors. I follow the general convention of the empirical industrial organization literature to estimate PCM by PCM = (total sales – total wages and salaries – raw materials)/total sales. I included a time dummy variable y_80s, defined as y_80s = 1, if year ≥ 1981 and y_80s = 0, otherwise. I included this dummy variable to see if after controlling for the firm size, technology θc and market condition θd , the firms showed favourable export performance after the export promotion policies were introduced in 1980.
Econometric Issues
Previous studies on Indian firm-level exports used a Tobit model. As I mentioned in the introduction, given the type of export promotion policies that India introduced in 1980, some of the regressors in our model will have different impact on the likelihood of exporting and on the amount of exports. For instance, since a firm is allowed to import raw materials, capital goods and R&D related capital more easily if it is an exporting firm, the firm would respond to such export promotion policies by exporting some amount, but the amount would not be higher than the average amount that the firms were exporting before such policies were introduced. That means, the dummy variable y_80s will have a positive effect on the probability of exporting, but a negative or no effect on the average export amount of a representative exporting firm. Since the Tobit model restricts both these effects to be in the same direction, the Tobit model will give biased estimates of the parameters and may lead to wrong policy conclusions. I will use the Cragg model which is more flexible than Tobit model and which nests Tobit model as a special case. In the next subsection, I will show empirical evidence of how policy evaluations could be very different when we use the Tobit model instead of the Cragg model.
More specifically, let Iit be an indicator variable taking value 1, if firm i in period t has positive export, and taking value 0 otherwise. Let yit denote the volume of export, and Xit denote a row vector of k explanatory variables for firm i in period t. The Cragg model assumes that the probability of a limit observation is driven by a Probit model 
Parameter Estimates from the Probit and Tobit Model of Export
The log-likelihood function for the Cragg model is not globally concave even when one re-parameterizes the Cragg model using Olsen’s transformation. Thus, it may not always be possible to compute the maximized log-likelihood function for testing purpose. For instance, when I used both firm size and square of firm size in my specifications, the numerical maximization of the log-likelihood did not converge under all the available algorithms in SAS. 5
The Tobit and Probit models, however, did not have this problem. This is the reason why I did not include square of the firm size.
The Empirical Findings
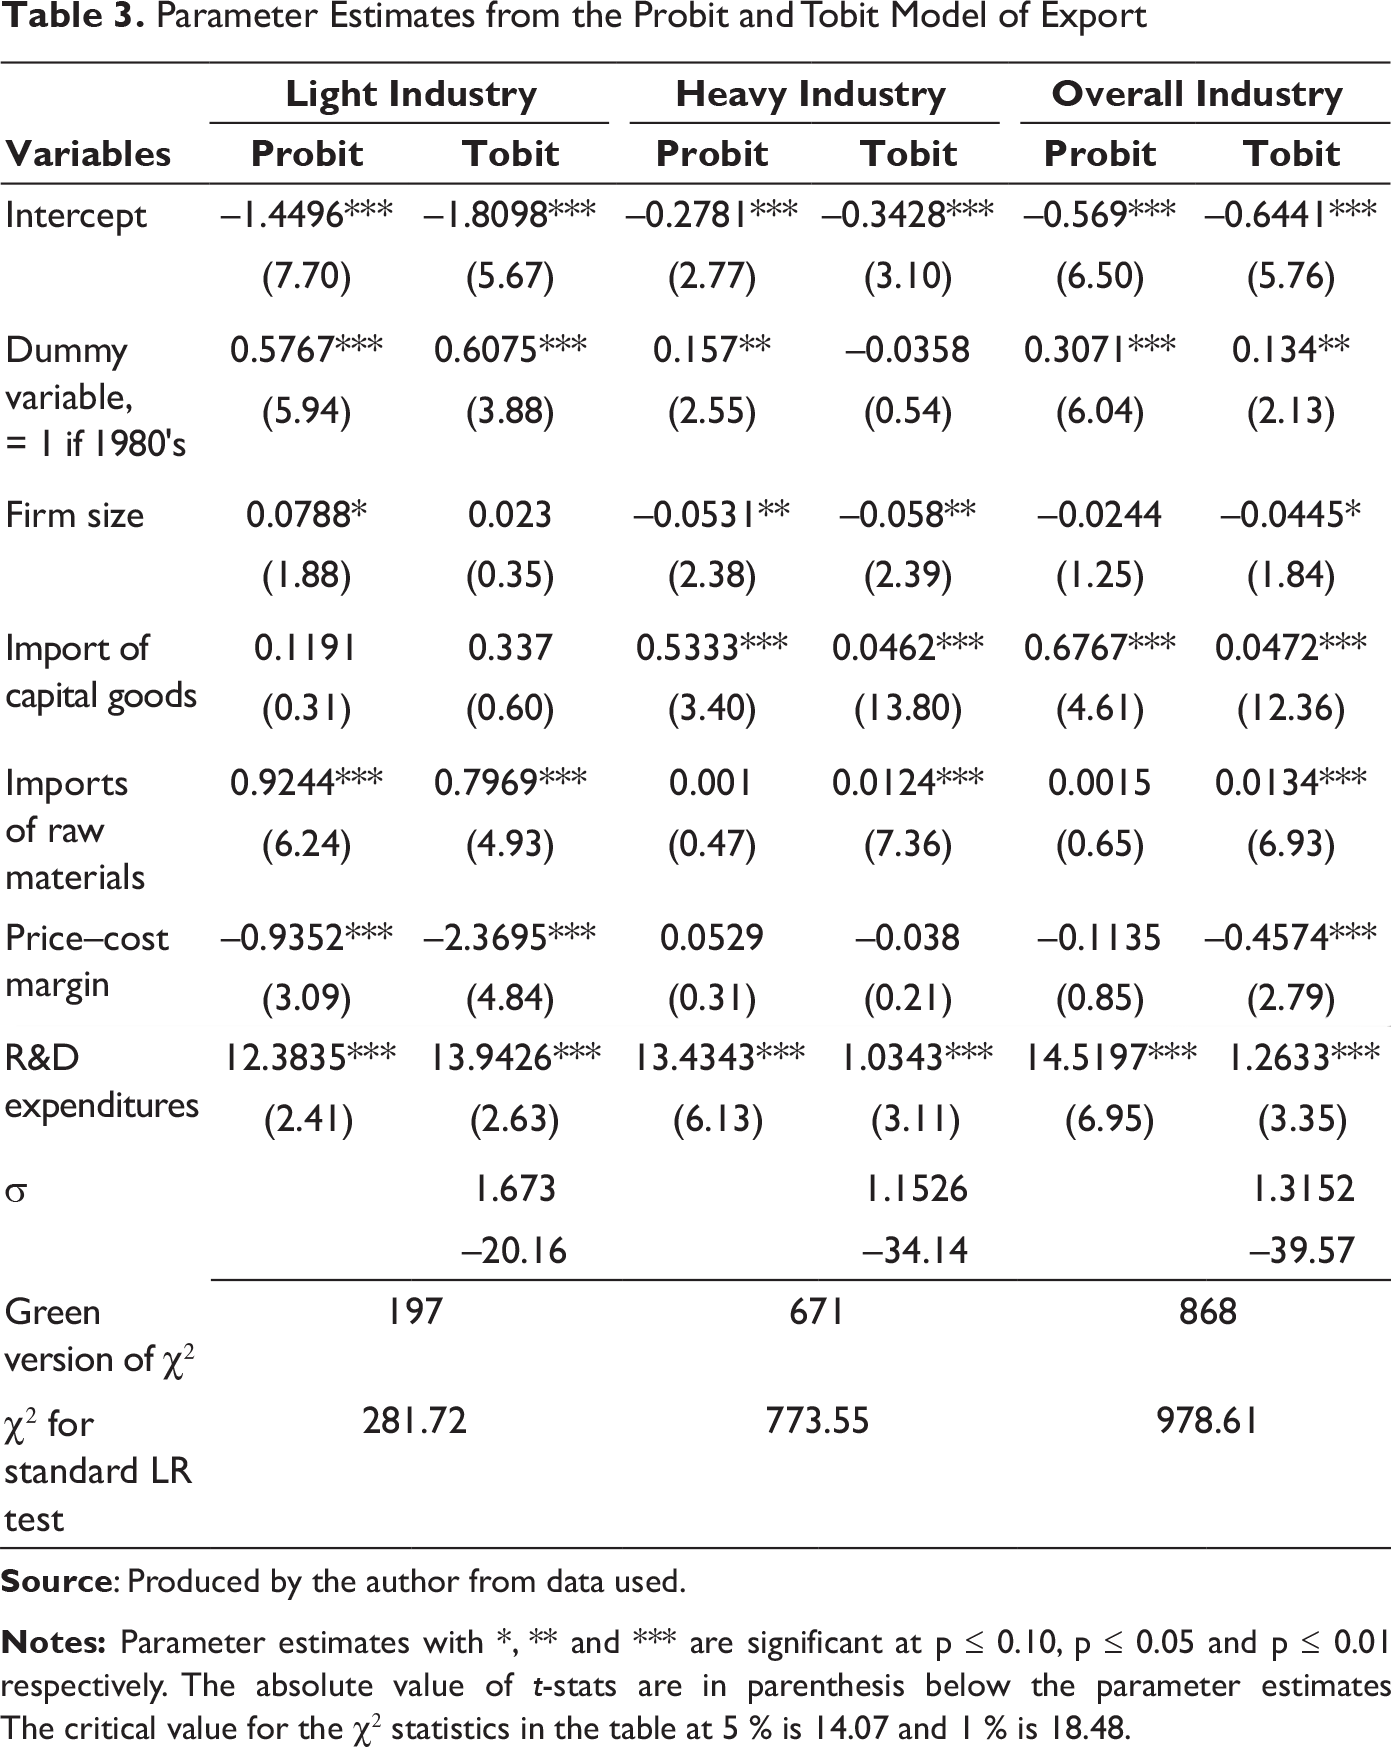
Notice that both the tests reject the Tobit model against the Cragg model for all of our industry groups. Even though the Tobit model is rejected against the Cragg model, I present the parameter estimates from the Tobit model in Table 3 for two reasons. First, we can compare the parameter estimates with a previous study by Kumar and Siddharthan (1994) who estimated a Tobit model of export. Second, we can see the qualitative differences in policy evaluations that may result from misspecification of the model.
The parameter estimates from Table 3 show that the R&D investment increased a firm’s likelihood to export and the propensity to export in all industries. Assuming capital good represents embodied technology, it appears that the import of technology is not an important determinant of exports in the technologically light industry, but it is an important determinant in the technologically heavy industry. These two facts together imply that in the light industry, the indigenously produced technology in the in-house R&D help exports. In the heavy industry, however, it appears that for exporting activities, import of technology and in-house R&D to adopt the technology to local condition help exports. This is broadly what was found by Kumar and Siddarthan (1994) using firm level data from 1987–1989 and using Tobit model. This pattern on sources of technology of these two industries are consistent with the pattern found in Raut (1988).
From the estimate of the coefficient of import of raw materials, it appears that the tariff and non-tariff import barriers that the Indian government imposed in the past did adversely hurt exports. Furthermore, from the parameter estimate of the dummy variable y_80s, it appears that the partial liberalization policies of 1980 had encouraged firms to have higher likelihood of engaging in exporting activities in all industries and also increased the propensity to export in the light industry. This effect is in addition to the effects through import of capital goods, raw materials and R&D activities that the partial liberalization policy of 1980 might have accomplished. Firm size is not an important detriment to export activities in the light industry, but it affected adversely both the likelihood of exporting and propensity of exporting for the firms in the heavy industry.
Estimates from the Cragg Model of Export

The parameter estimates from the Cragg model in Table 4 show that while the parameter estimates Β1 for the limit observations in the Cragg model are very similar to the estimates of the Β1 in the Probit model, the parameter estimates for the non-limit observations of the Cragg model are very different from the estimates from the Tobit model. For instance, notice that R&D expenditure cease to be a significant determinant of the propensity to export. Similarly, import of raw materials cease to be a significant determinant of export propensity in the light industry. The most striking difference between the Tobit and the Cragg models is the coefficient estimates for import of capital goods and y_80s. The effect of import of capital goods on export propensity is now significantly negative in the heavy industry, while it was significantly positive in the Tobit model. The effect of y_80s on export propensity is now significantly negative in both industries, while it was significantly positive or insignificant in the Tobit model. The effect of PCM is the only effect that is conformable in the two models.
The fact that y_80s and import of capital goods have positive effect on the probability of exporting but negative effect on the propensity to export leads to an important policy judgment: The partial liberalization and export promotion policy of 1980 created a peculiar export incentives of the type that while the firms were more likely to export some positive amount to quality as exporter so that they could import capital goods, raw materials and technology more easily, the export propensity of these firms were lower on the average than the export propensity of the original exporters. Thus, the export promotion and partial liberalization policies encouraged more firms to become exporters while dropping the average export propensity. This inference about the effect of liberalization and export promotion policies is qualitatively different from the inference based on estimates from the Tobit model. The other significant difference in inference is in the effect of R&D expenditure on export propensity.
Conclusions
In this paper, I have examined how competitiveness and cost effectiveness influenced exporting activities of Indian private firms during 1975–1985. I considered a theoretical model of optimal export decision within an imperfectly competitive industrial structure and used it for guiding the econometric analysis. I considered three factors that influenced cost effectiveness of Indian firms: in-house R&D expenditures, import of technology embedded in capital goods and import of raw materials. I carried this analysis separately for technologically light and technologically heavy industries. I also empirically evaluated if the partial liberalization and export promotion policies that were introduced in 1980 had significant positive effects on the likelihood of exporting and on the average volume of exports of the private firms.
I have argued that the commonly used Tobit model is not appropriate for modelling export activities; it may lead to incorrect policy evaluations. It is more appropriate to use the Cragg model. I carried out specification testing of the Tobit model against the Cragg model and found that the Tobit model was rejected for all specifications.
According to the Cragg model, the export promotion and partial liberalization policies of 1980 encouraged firms to become exporter so that they could qualify to import capital goods, raw materials and technology more easily and utilize subsidies for doing in-house R&D. These policies, however, lowered the average propensity to export. Furthermore, the in-house R&D expenditures had positive effect on probability of exporting, but not on the propensity to export. The import of embedded technology increased the probability of exporting, but had negative effect on the propensity to export. The Tobit model in this study as well as the study by Kumar and Siddharthan (1994), on the other hand, gave a misleading inference by estimating positive effects of R&D and import technology on the propensity to export. The only qualitatively robust inference across these two models is that a higher competitiveness leads to a higher likelihood and a higher propensity to export in the light industry. The findings of this paper also warn us to be cautious while using the Tobit estimates to judge the performance of export promotion and liberalization policies without carrying out a specification testing against another more flexible model.
Acknowledgements
I greatly benefitted from the comments of an anonymous referee of the journal. I completed the revision of this paper during my stay at the IIM Udaipur. I gratefully acknowledge their support. This paper is a revision of an earlier draft, Raut (2003).