
Abstract
We explain the relationship between energy intensity and productivity for the organized manufacturing sector of India. Using data from the secondary sources, we explain the relationships at aggregate, state and industry levels. The novelty of this paper lies in bringing in pollution loads in explaining inter-industry variations in energy intensity. Results of this study indicate that the organized manufacturing sector of India has gained energy efficiency and productivity. We found heterogeneity among Indian states in productivity growth and energy intensity. The results indicate that small states performed well whereas large states fall in the productivity paradox. The productivity dilemma hypothesis is validated at industry level analysis however, results are inconsistent to validate the decoupling growth hypothesis. Pollution loads as classified by Government of India, plays a vital role in explaining energy intensity variations across industries, which calls for better policies aiming at pollutive industries specifically to achieve sustainable growth for the manufacturing sector of the Indian economy.
Introduction
Arguments in favour of adaptation and mitigation using economic analysis have gained momentum due to increasing impacts of the Global Climate Change. Pollution and waste from industrial sectors are one of the significant factors contributing to the Global Climate Change. Hence, policies related to pollution control are one of the sustainable developmental goals in most of the advanced economies. These policies are also related to control the increasing demand for natural resources, through various price mechanisms. Research in these lines are documented in ‘industrial ecology’ which explains economic policies and empirical evidence on externalities from industrial sectors. One can observe that since the 1990s many developed economies such as Germany and Sweden; and a few developing economies such as China have given attention to the gain energy efficiency with technological change. China and India are the largest consumers of energy resources, after the USA, and expected to consume more. It is agreed in the Paris Agreement that $100 billion-per-year of funds will be provided to the developing countries by the developed countries to control emission. Therefore, energy efficiency gain becomes a prime goal in recent industrial policies (Doyle, 2007). However, as evident from Ryan (2018), gaining energy efficiency does not ensure a reduction in energy consumption. As an emerging economy, India is also participating in the international policy dialogues that are focused on energy efficiency and technological changes related to environmental issues. Hence, understanding energy consumption patterns of the Indian economy is vital. As the industrial sector of the Indian economy consumes a larger share of the commercial energy, it is important to focus on industrial energy consumption patterns and determinants. Given the competitiveness of the industrial sector of the Indian economy, productivity is also crucial. Therefore, explaining energy intensity and productivity for the industrial sector in India will add to the existing literature for better policy measures. To be globally competitive, therefore, Indian industries have to be both energy-efficient and productive.
Plenty of research is documented related to the productivity of manufacturing firms and industries for the Indian case. These research can broadly be divided into major three categories. When we observe the results of the first set of studies, we find that the productivity of Indian manufacturing firms declined over the years (Goldar, 1986; Reddy & Rao, 1962), whereas the second set of studies have concluded mostly contradictory results, due to different tools and techniques used in estimating productivity. For example, use of either gross value added (GVA; Dholakia & Dholakia, 1994) or gross output (Krishna & Mitra, 1998; Pradhan & Barik, 1998) in estimating total factor productivity (TFP) may result different outcomes. Therefore, it is difficult to conclude from the second sets of studies on the impact of new industrial policies in India, during the 1980s. The third phase of studies related to productivity, capture the impact of liberalization on TFP. Most of these studies use gross output (Das, 2004; Ray, 2002). During the third phase of studies on TFP, researchers also use recent empirical methods such as the Levinsohn and Petrin (2003) against/with the standard Cobb–Douglas (CD)/Translog production functions.
For example, Sahu and Sharma (2016) use Levinsohn and Petrin (2003) method in estimating TFP and relate with energy intensity at firm level, for the manufacturing firms in India. They report that most of the manufacturing firms exhibit positive growth in TFP and confirm a productivity dilemma 1 in case of the manufacturing firms in India. They concluded that industries, having higher productivity are found to be energy-efficient. Sen (2018) argued that under specific circumstances, unilateral cut in emissions might lead to the problem of Green Paradox, that is, if fuel price exceeds its marginal cost, it will continue to fall until the total stock is exhausted. Further, he concluded that binding commitments on the use of fossil fuels are mandatory, as against the unilateral policies. Laxity in environmental policy at any level is undesirable irrespective of countries, states or sectors. Therefore, price instruments have always been one of the major tools to control emission. In a similar attempt, Roy et al. (1999) estimated the inter-input substitutability for six energy-intensive manufacturing sector of India, and relate it with price instruments to show its effectiveness in reducing carbon emission.
Dasgupta and Roy (2015) used growth accounting approach to estimate technological progress of seven energy-intensive manufacturing industries and for the aggregate manufacturing sector in India. They find evidence of energy-saving bias from 1998–1999 to 2011–2012 in their analysis. They conclude that some of the industries can become capital intensive while making an attempt to control energy-demand due to factor input substitution, such as capital and material. Therefore, as Linn (2008) notes, energy efficiency gain can be achieved by reducing energy use via installation of advanced technologies. Therefore, technological advancement in manufacturing is required to combat with the negative impact of energy use. In line with the argument on technological advancements, Doms and Dunne (1995) showed that implementation of new technology is important to gain energy efficiency but at the cost of higher electricity consumption. They conclude that young firms are energy-efficient. Similarly, Sahu and Narayanan (2011) explained relationship between TFP and firm level energy intensity for the manufacturing firms in India. Their key findings suggest that, firm characteristics such as firm-age, export intensity and firm-size exhibit a positive relationship with TFP. On the other hand, R&D and embodied technology import intensities have a negative relation with productivity.
From the discussion above, we conclude that studies related to productivity and energy intensity have been attempted for the Indian context, however most of them focused at firm/unit level. As studies at aggregate and state level are scanty, this research fills gap in literature by analysing energy intensity and productivity at both aggregate and disaggregate levels for the Indian economy context. Most importantly, to our knowledge, this is the first research that links pollution loads at industry levels with energy intensity and productivity. We use data from the Annual Survey of Industries (ASI); European Union’s Joint Research Centre; and Ministry of Environment, Forest and Climate Change (MoEF&CC). We confine our analysis to the organize manufacturing sector.
2
Our objectives in this papers are to:
explain energy intensity, and to estimate TFP at both aggregate and disaggregate levels and determine factors influencing energy efficiency and relate energy intensity with pollution loads.
Based on the nature of data at aggregate and disaggregate levels, we depend on two different ways in estimating TFP, namely CD and Levinsohn and Petrin (2003) production functions. Growth in TFP are explained with energy intensity and pollution loads at industry levels. We conclude in favour of efficient use of resources for the manufacturing sector of India. From the policy viewpoint, we suggest different policies must be formulated based on the pollution loads and capital intensity to achieve energy efficiency for the manufacturing sector of Indian economy. The remainder of this paper is as follows. The second section explains data and methods employed, the third section explains empirical results at aggregate, state and industry levels. The fourth section concludes with possible policy implications for the manufacturing sector of India.
Data and Methods
For the empirical analysis, we use data from secondary sources from 1981–1982 to 2016–2017. The unit of analysis is at aggregate manufacturing, state level and industry level. Data in use are of the organized manufacturing sector under the Indian Factories Act of 1948. 3 We use Consumer Price Index (CPI) and Wholesale Price Index (WPI) series obtained from the Office of Economic Advisor, Ministry of Commerce and Industry, Government of India to deflate output and factor inputs to constant prices. 4 In the empirical set-up, we use output, labour, capital, energy and material to estimate TFP; and profit and pollution loads as the exogenous variables. Output is measured as GVA. GVA as a measure of output is considered to be robust as against gross output (Ahluwalia, 1991; Balakrishnan & Pushpangadan 1994, 1998; Goldar, 1986). Since ASI data consist of a large number of multi-product firms, it is difficult to use a double deflator, thereby we use single deflator for the factor inputs. In the case of input variables, we use total emoluments for labour; fixed capital for capital; fuels consumed for energy; and material consumed for material. Total emoluments are deflated by CPI (base year 2010–2011) and other inputs, that is, capital, energy and material are deflated using WPI series. For the aggregate analysis we use CO2 emission as a proxy of pollution, and the data are obtained from the World Development Indicators (WDI) for the Indian economy from 1981–2014. Data for 2015 are collected from Trends in Global CO2 Emission 2016 5 and for the year 2016, the data are collected from the UN-Development Report of 2016. Data used for both state and industry levels represents an unbalanced panel structure. Therefore, applying Ordinary Least Squares (OLS) may have problems such as simultaneity and selectivity bias in estimating productivity. Hence, we use Levinsohn and Petrin (2003) production function to estimate productivity and productivity growth 6 for the state and industry levels. However, for the aggregate level estimation of productivity, we use the standard CD production function.
Empirical Evidence at Disaggregate and Aggregate Levels
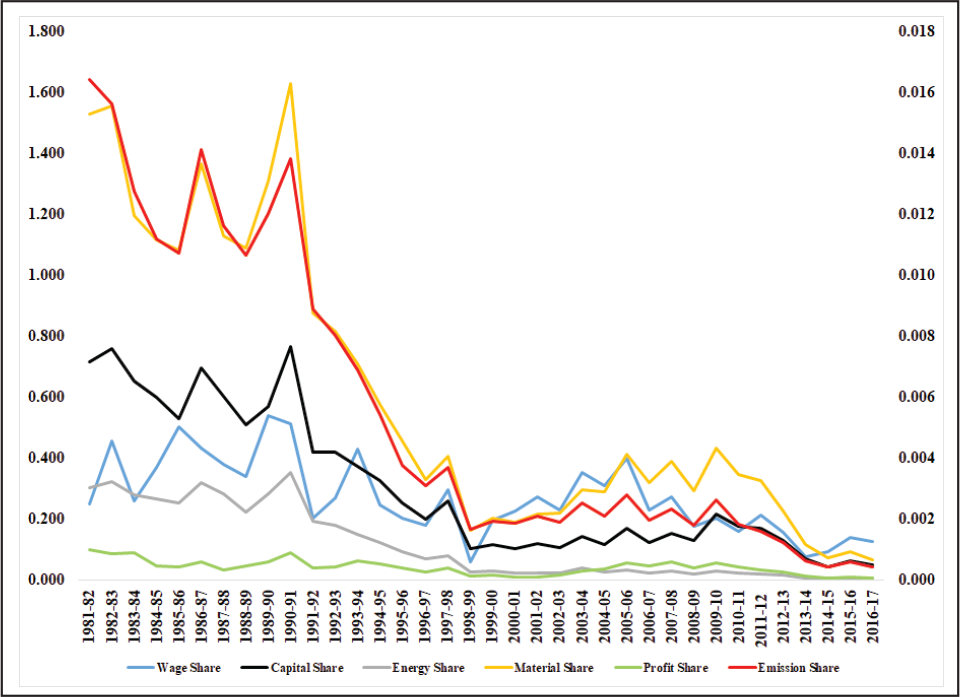
This section presents empirical findings at both aggregate and disaggregate levels for the Indian economy. The share of factor inputs to GVA, profit share and share of emission are presented in Figure 1. Share of emission to GVA is presented in the secondary axis of the figure. Following observations can be drawn from the figure. First, wage share has slowly reduced until the 1990s. However, from 2000, wage share increased until 2005-06 and further decreased till 2016. When we look at the capital and material share, we conclude a decreasing trend over time. Interestingly, overtime at the aggregate level, the Indian economy gained energy efficiency as presented in Figure 1. This gain in efficiency is due to strong energy policies in the Indian economy such as Consumer Protection Act of the 1990s; Energy Conservation Act of 2001; Ratified Kyoto Protocol of 2002; Clean Development Mechanism; Electricity Act of 2003; National Mission for Enhanced Energy Efficiency of 2010; and Perform, Achieve and Trade of 2012. Tang et al. (2015) indicate an inverse relationship between technological progress and emission at long-run. As productivity is one of the ways to measure technology progress, the relationship between energy intensity and productivity can also allow us to validate Tang et al. (2015).
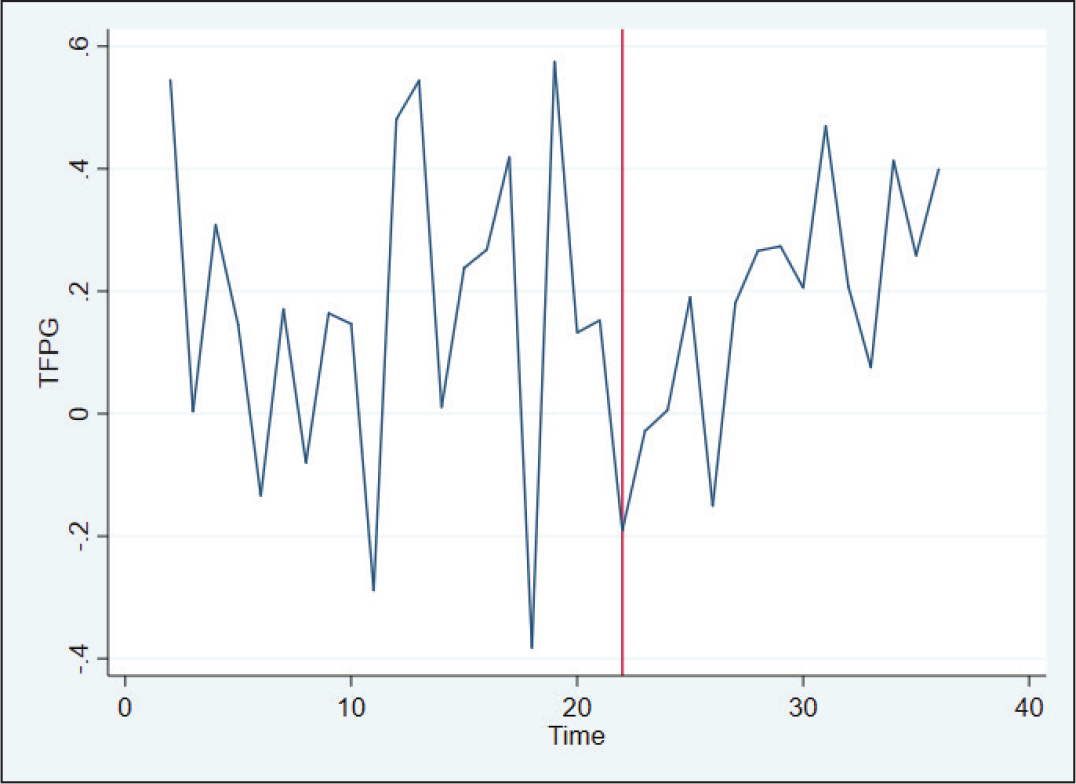
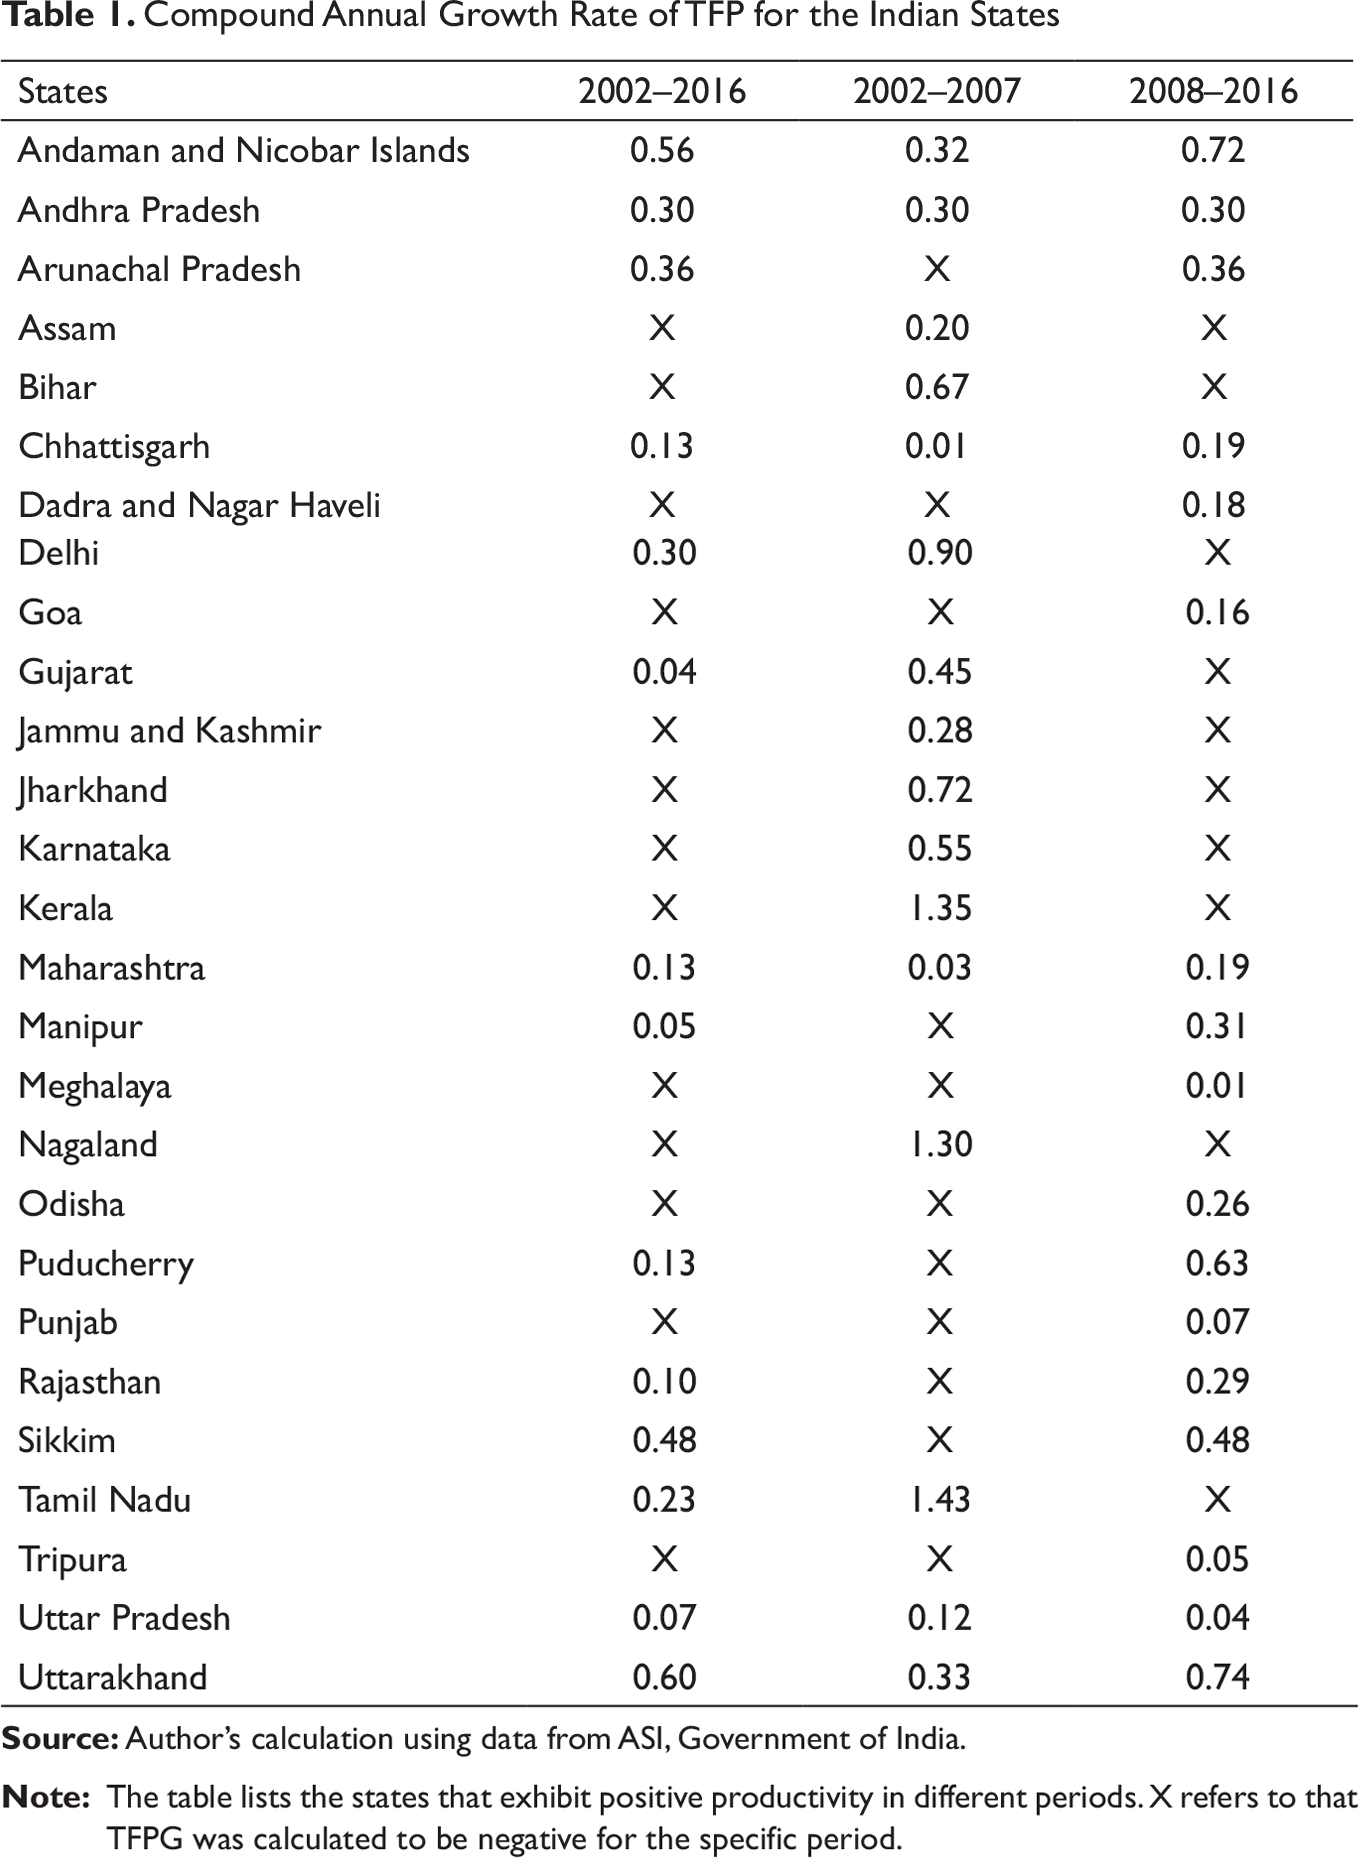
As stated earlier, the aggregate productivity is estimated using CD production function. Figure 2 presents the trend of TFP growth (TFPG) rates. Our results are similar to Topalova and Khandelwal (2011) and we also do not observe an increase in TFPG due to economic reform. The representation of TFPG in Figure 2 (either V or U shaped) allow us to test for the structural break of TFPG. We test for the structural break using Wald-test and find the test statistics to be statistically significant at 1 per cent level. The estimated structural break is found to be during the year 2002. As Goldar (2006) pointed out, economic measures such as reducing tariff rates may be the possible reason for the structural break in TFPG. Further, we analyse TFP and energy efficiency gains at the state 7 and industry levels. We have divided our sample into two phases (2002–2007 and 2008–2016) based on the macroeconomic shock of 2008. We also estimate for the full sample; hence we have three sub-sample analysis at state level. Levinsohn and Petrin (2003) 8 method of estimating TFP is used in this case to estimate TFP.
Compound Annual Growth Rate of TFP for the Indian States
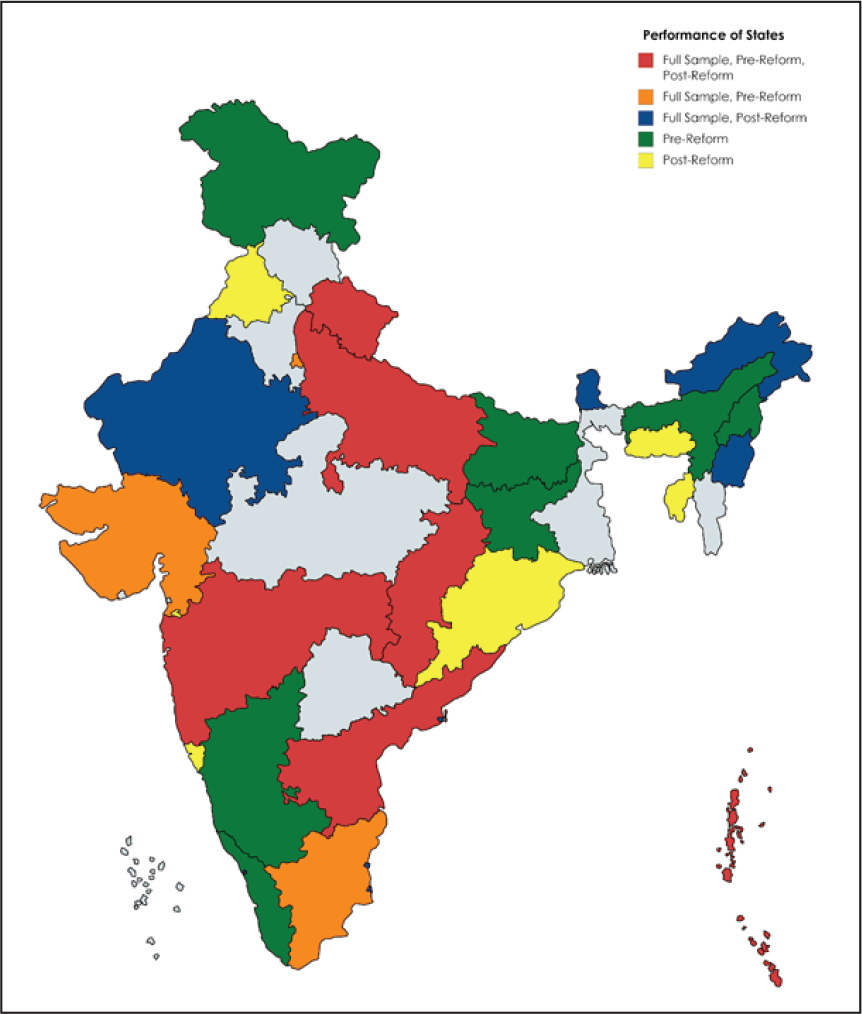
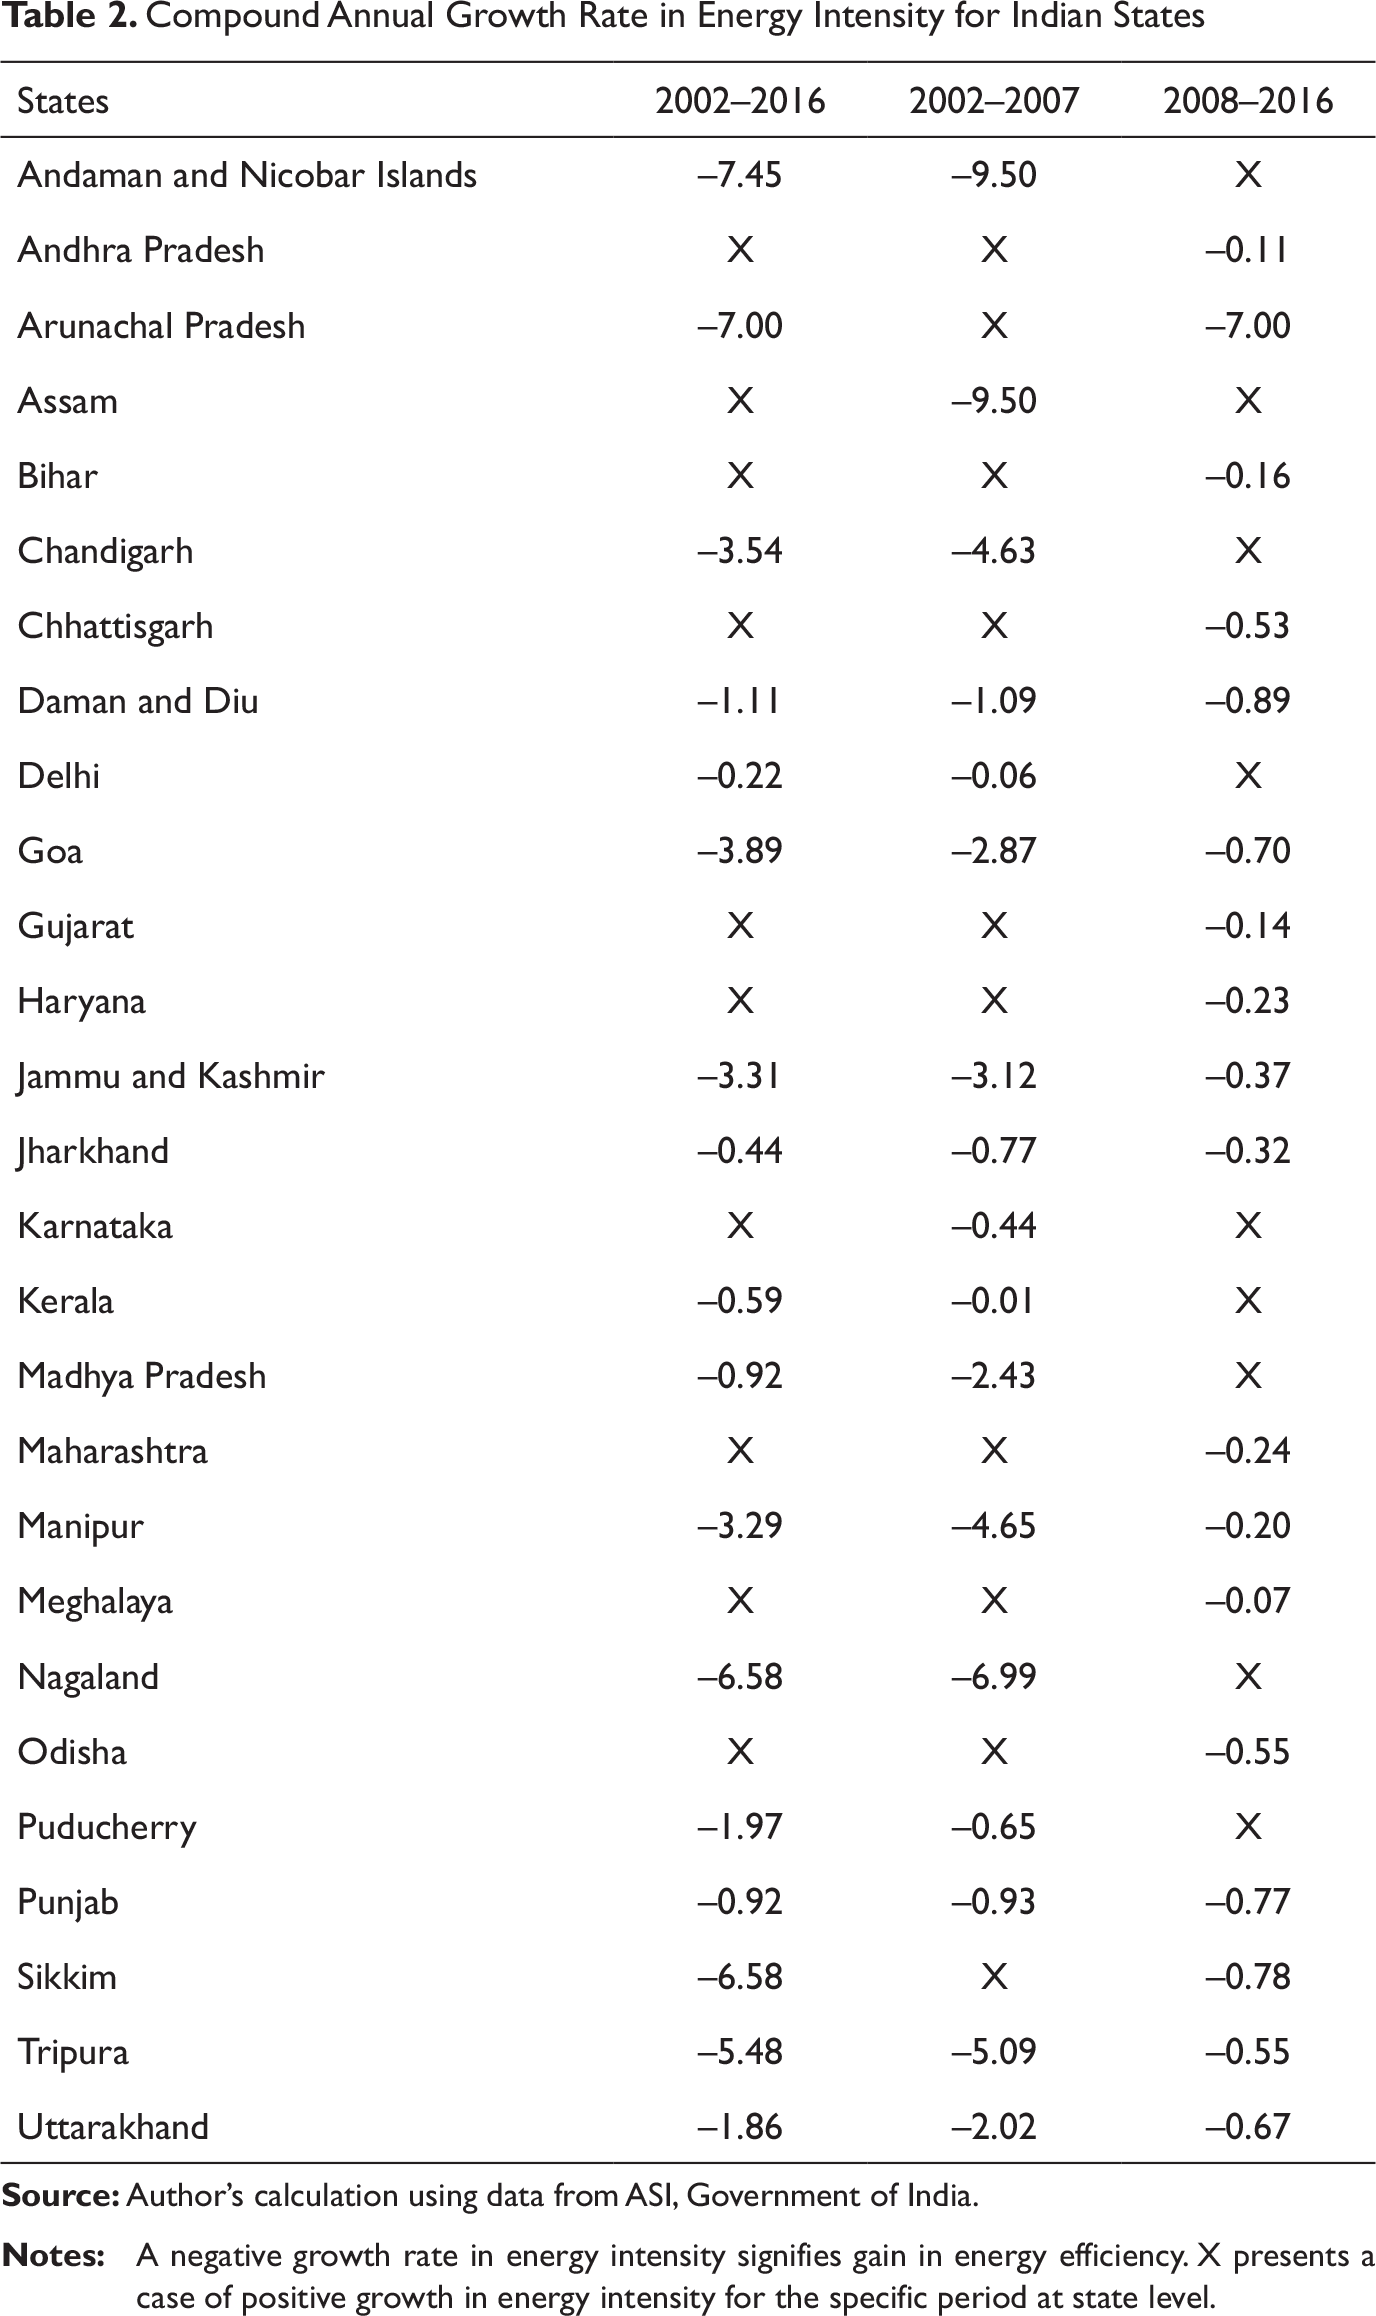
Further, we analyse trends in energy intensity at the state levels. Energy intensity at state level is defined as a ratio of energy consumption in monetary unit with GVA for the manufacturing sector of each state. Once energy intensity is calculated, we compute the compound annual average growth rates in energy intensity to represent energy efficiency gain. A negative growth rate of energy intensity indicates gain in energy efficiency. We present the case of energy efficiency gain at the state levels in Table 2. In terms of number of states, almost half of the Indian states have gained energy efficiency. In the post-reform period more states gained energy efficiency. At state levels, number of energy policies have been formulated along with the national-level energy policies in India. One important energy policy related to national action plan on climate change is the National Mission on Energy Efficiency of 2008. As stated, Indian states also formulated policies to gain energy efficiency such as the Chhattisgarh State Solar Energy Policy of 2012, Odisha Solar Policy of 2013. These policies might have positive impact in achieving energy efficiency at state levels. The compound annual growth rates of energy intensity (at average) for the energy-efficient states are –3.24, –3.22 and –1.11 per cent, respectively, for the three phases. The distribution of change in energy intensity at state levels also indicates possibility of energy efficiency gain for other states.
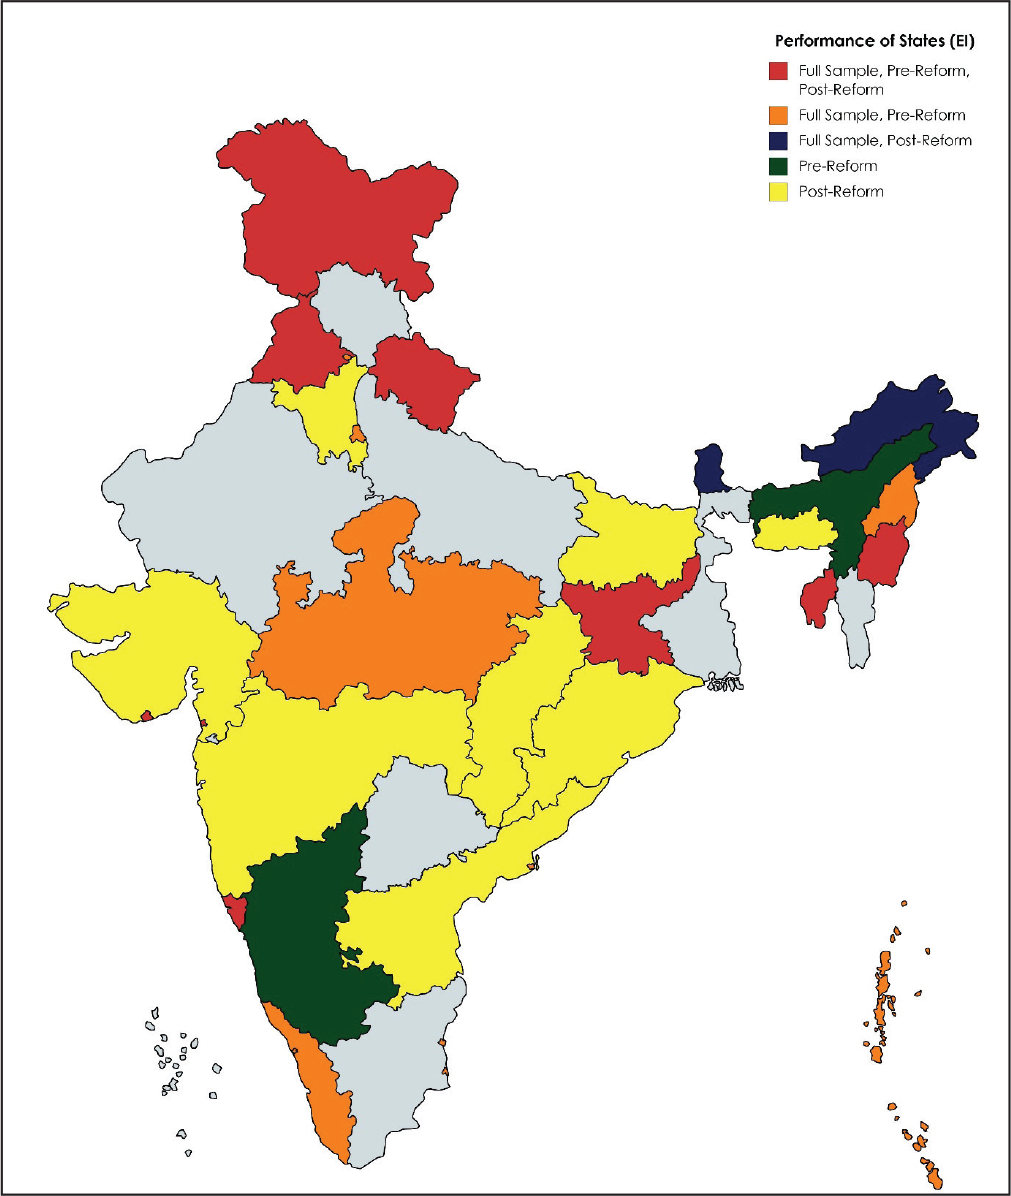
There are 27 states (including union territories) that have gained energy efficiency at least once in the phases that we consider for our analysis. Out of these energy-efficient states, 30 per cent have performed well throughout; 26 per cent have shown prudential results for full sample and pre-reform; 7 per cent have performed good in full sample and post-reform, and 7 per cent have performed well in only pre-reform; 30 per cent have performed well only in post-reform but the magnitude is not sufficient enough to secure a place in full sample as well. A pictorial presentation of change in energy intensity is presented in Figure 4. Once the data is understood at the aggregate and state level, we move forward to analyse energy intensity and productivity at industry levels. We use standard National Industrial Classification of 2008 at three digits for our analysis. In addition to explain energy intensity and productivity, we also explain the pollution loads for different industries at three digits. Data for the pollution loads are arrived at from the MoEF&CC, Government of India. 10
Compound Annual Growth Rate in Energy Intensity for Indian States
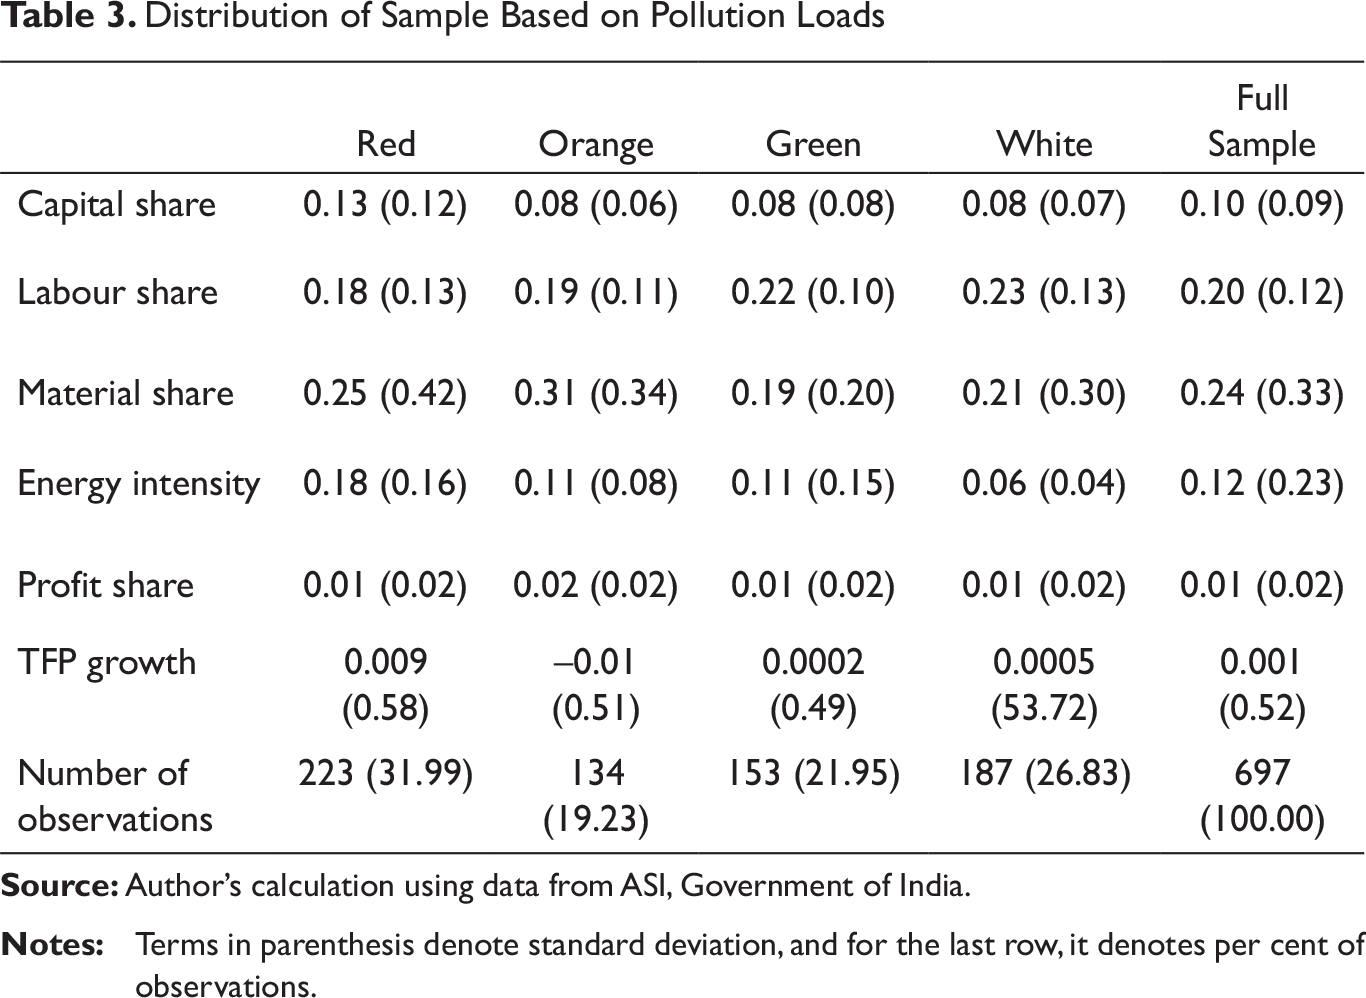
These data are coded with colours indicating pollutive and lesser pollutive industries. The index value for the colour codes ranges from 0 to 100. Industries are classified as pollutants if they have a higher index value of pollution loads. Industries included in the red categories are the most pollutive ones; followed by orange, green and white categories. These colour codes are prescribed based on an index which is a function of emissions (air pollutants), effluents (water pollutants), hazardous wastes generated and resource consumption. These data can be considered as a proxy for negative externalities such as pollution at industry levels. The pollution loads classification for the three-digit industrial classification are presented in Table 3. Sample consists of 697 industry-year observations from 2008–2016. Among which, 223 observations are classified as the red categories, 134 for the orange categories, 153 for the green categories and 187 are the white categories.
Our data structure represents a case of unbalanced panel data. To estimate TFP in this case, we use Levinsohn–Petrin (2003) technique. In line with the earlier arguments, the factor share at industry levels in Table 3, indicates that the red categories (pollutive) are capital intensives and capital intensity remains almost unchanged for other categories. However, we can see an opposite behaviour when wage shares are considered. Material consumption share has a mixed distribution with maximum share for the orange categories and less for the green categories of industries. This implies the pollutive industries are capital intensive and labour saving, whereas the least pollutive industries are labour intensive. Energy share or energy intensity has similar behaviour to capital share for the orange and green category industries. Therefore, the initial finding here is capital intensive industries tend to be energy intensive and labour saving, from pollution loads argument. This can also add to the theoretical argument of energy-capital as complementary factors of production. Similarly, we can also observe that the red category industries are productive compared to others. This result is in line with Tang et al. (2015).
Distribution of Sample Based on Pollution Loads
We estimate the following empirical model:

Where, EI: Energy intensity, TFP: Total factor productivity, GVA: Gross value added, PS: Profit share, CC: Colour codes (dummy variable).
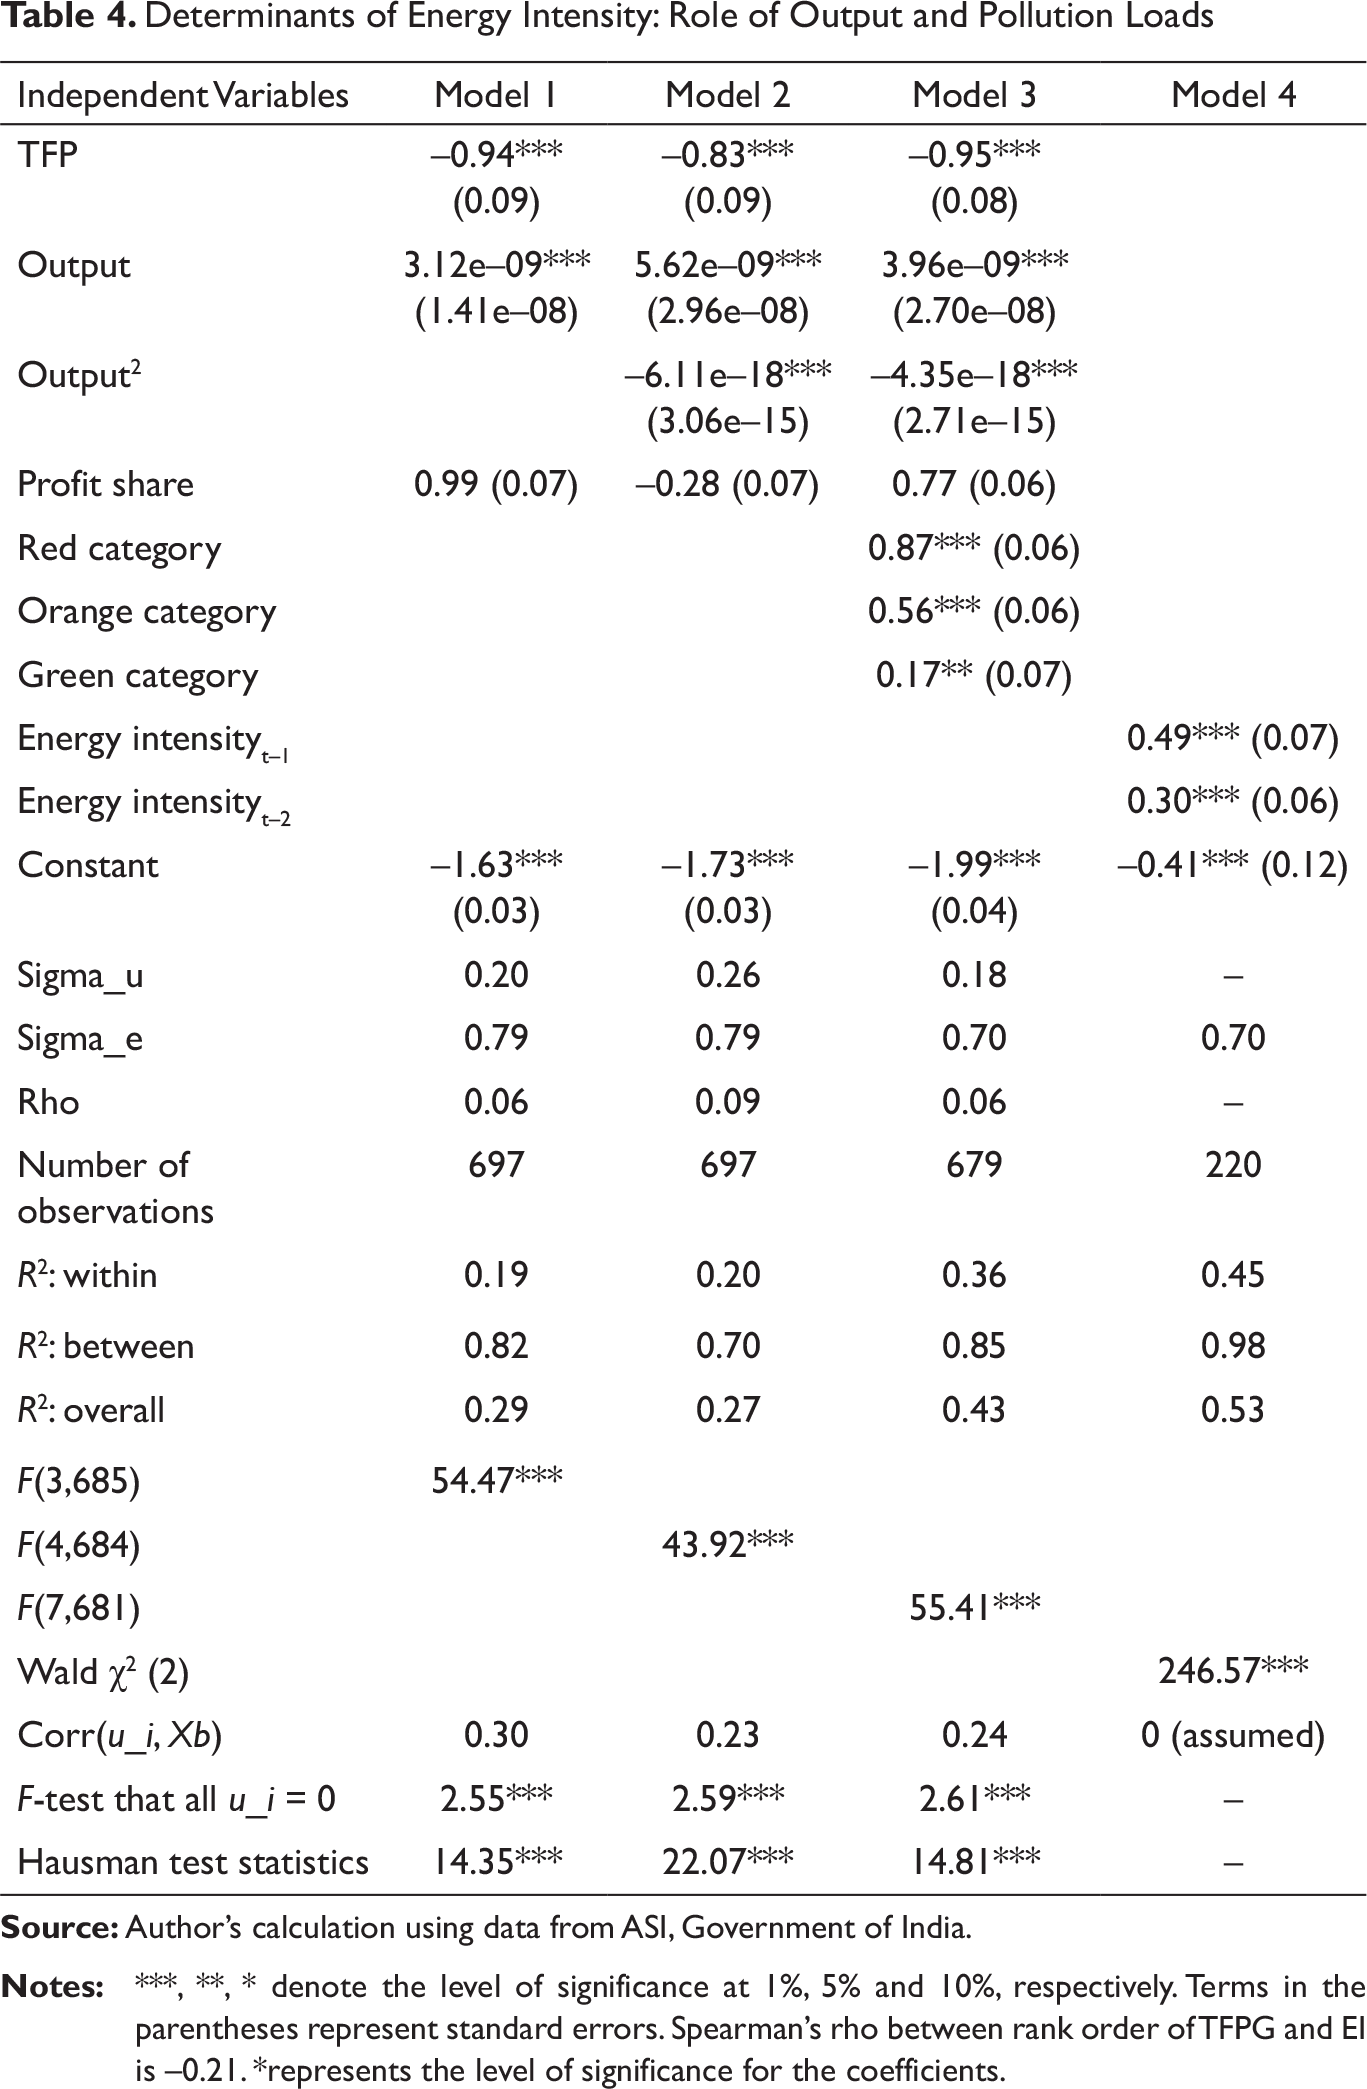
Our empirical analysis is based on panel data econometrics. We have estimated both fixed and random effects estimates. Based on the Hausman test statistics we conclude that the fixed effects estimates are efficient compared to the random effect estimates for the full sample. However, for the sub-sample estimates the random effect estimates are accepted over fixed effects estimates. The empirical results are presented in Tables 4 and 5, respectively. Table 4 explains four sub-models based on our earlier discussion. The first model explains the validity of decoupling growth from the viewpoint of energy intensity. The second model attempts to validate productivity dilemma hypothesis. The third model uses dummy variables for the pollution loads as added variables to check inter-industries variation explaining energy intensity for pollutive and least pollutive industries. And, the fourth model explains the energy efficiency gain for a period of two years at industry levels.
Consistently the relationship between energy intensity and productivity is negative and statistically significant for all three models indicating productive firms are energy-efficient. Hence, productivity as a proxy for technology helps Indian industries to reduce energy intensity. As evident from both Models 1 and 2, we confirm that industries in Indian economy face productivity dilemma rather a decoupling growth. The results for decoupling growth in the manufacturing industries are similar to the findings of Wang et al. (2018). As our results confirm a positive relationship between energy intensity and output, we conclude that Indian industries are not in line with the argument of decoupling growth. A similar result was obtained in Sahu and Sharma (2016) for the manufacturing firms at unit level. Rather the results of Model 2 confirm a non-linear inverted U shape relationship between energy intensity and output, representing a case of productivity dilemma. Our models do not explicitly confirm a relationship between energy intensity and profit share. With technological progress and energy efficiency gain, energy resources may be affordable, and producers realize economies of scale which is inline of the results presented for Model 1 and 2. Therefore, Indian industries are probably consuming more energy to increase output and this off-sets the impact of reduction in energy intensity as compared to increase in energy intensity due to growth in output.
Determinants of Energy Intensity: Role of Output and Pollution Loads
Determinants of Energy Intensity based on Pollution Loads
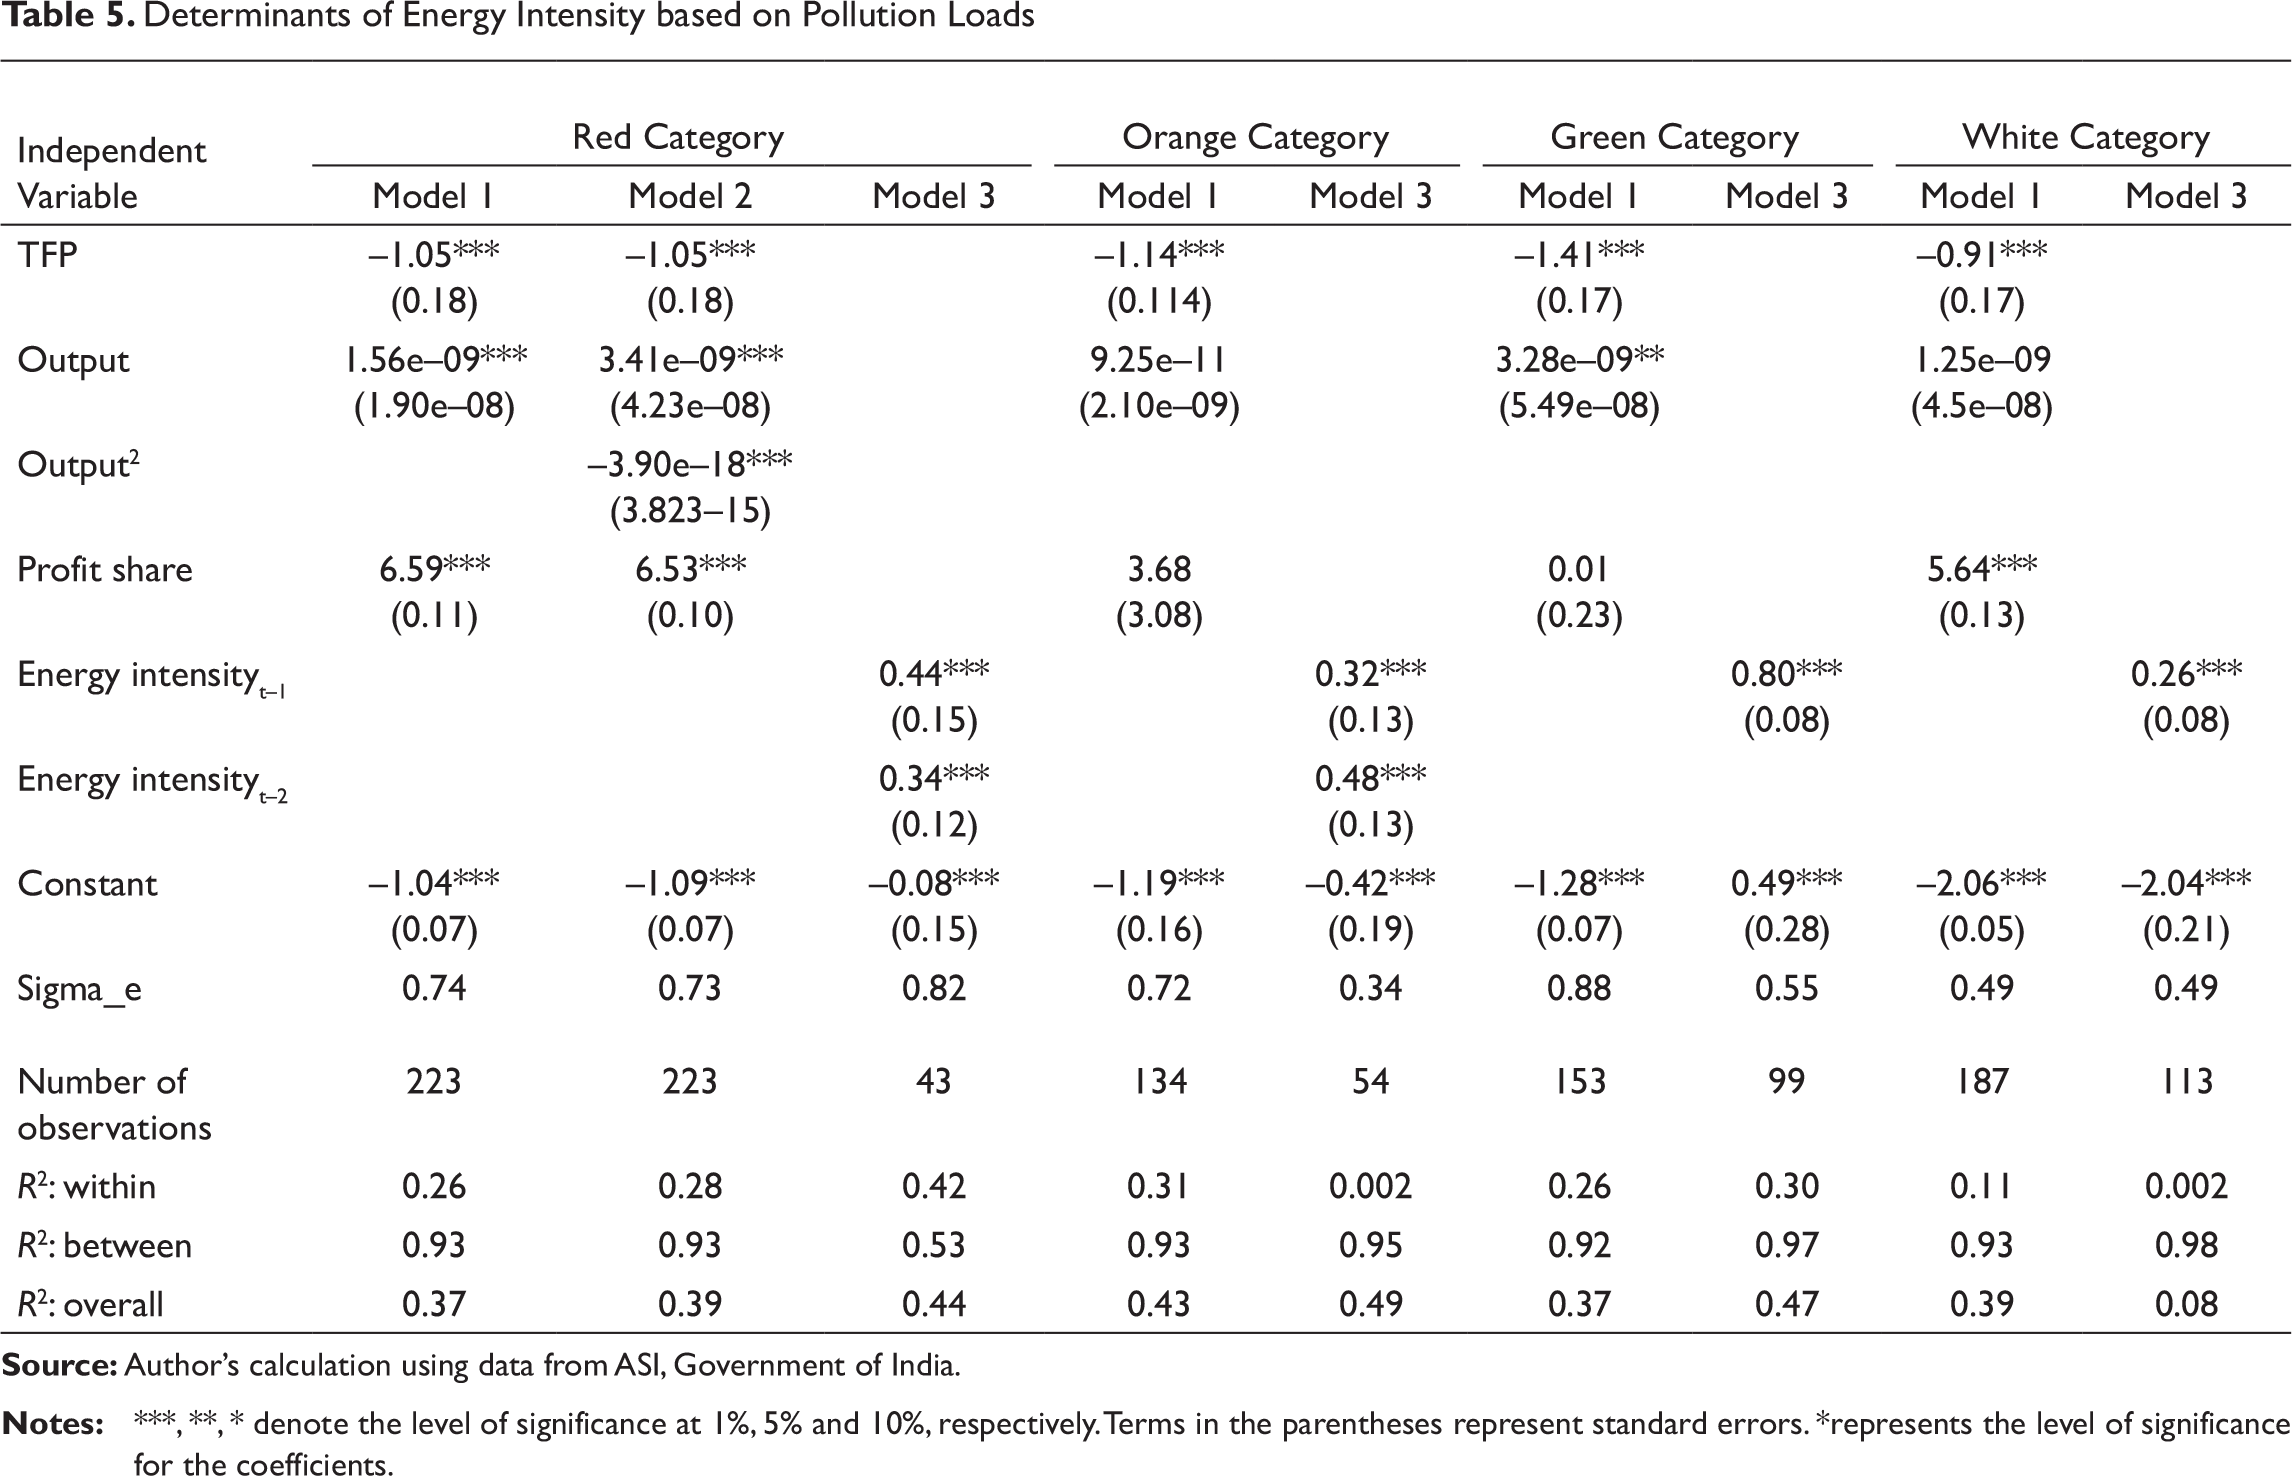
Similar to the results of Table 4, we estimate different models at sub-sample levels. Four sub-sample are created based on the pollution codes. The results indicate that red category industries (the pollutive) exhibit similar results as presented for the full sample. Therefore, capital intensive and pollutive industries validate productivity dilemma hypothesis and reject decoupling growth hypothesis. We confirm the findings of Tang et al. (2015) for the full sample and for the pollutive industries. An additional conclusion for the red category industries is related to the profit share. In this case, profitable firms tend to be energy intensive. All other categories of industries have an opposite result as compared to the red category industries. The green category firms do not reject the presence of decoupling growth hypothesis, however, for the orange and white category industries energy efficiency is achieved from increase in TFP only. The role of lag energy intensity remains unchanged for all categories industries expect the white category industries. Our results also indicate that as in case of the pollutive industries the least pollutive industries have positive relationship between energy intensity and profit share. In both cases, profitable industries tend to be energy intensives.
Conclusion
This study is one of the recent attempts to re-estimate TFP in explaining inter-industry variations in energy intensity. Using data from the secondary sources, we document variation in energy intensity at the aggregate, state and industry levels. We account for pollution through CO2 emissions at the aggregate manufacturing level. While addressing the industry level, we use pollution loads as proxy for pollution. Use of this information in explaining energy intensity variation is a noble approach of this paper. This classification based on pollution loads allow us to use sub-sample analysis to understand two important hypotheses related to energy consumption; the productivity dilemma hypothesis and decoupling growth hypothesis. From the productivity estimate, we conclude that there is an evidence of structural break in TFPG for the manufacturing industries in India, which is dated to be 2002. Except for few years, TFPG are positive in case of the manufacturing sector in India. This indicates that manufacturing sector in India are competitive. At aggregate level, we also find a negative trend in energy and emission share to GVA, which indicate that manufacturing industry in India are achieving efficiency in energy consumption and emitting less per output. This can be attributed to the national energy policies in achieving sustainable development goals. However, geographically large states registered lesser productivity after recession. On the energy efficiency front, not all states registered similar efficiency in energy consumption. One-third of Indian states in number performed positively in gaining energy efficiency. This calls for state-level interventions in making better energy policies in achieving energy efficiency. For example, the recent electric vehicle act can help states in reducing energy consumption in transport and related industries. Intra-industry variation can be observed in factor share and TFPG from the industry level analysis. While industries classified in orange category have negative growth in productivity; the red category industries have positive growth. This implies that the pollutive industries are productive compared to others. Empirically, we conclude that energy intensity has negative relationship with productivity, implying productive firms are energy-efficient. Therefore, role of states in making policies are equally important to foster productivity and energy efficiency at the aggregate level. Rejection of decoupling growth hypothesis raises a serious concern in achieving productivity and efficiency in energy use. Results of this study are encouraging enough to formulate future energy policy for the manufacturing sector in India.
Footnotes
Acknowledgements
We gratefully acknowledge the comments and suggestions from the participants of the 23rd Biennial Conference of the Association of Indian Economic and Financial Studies." We also acknowledge the constructive comments and suggestions from the anonymous reviewers. Usual disclaimers apply.
Declaration of Conflicting Interests
The authors declared no potential conflicts of interest with respect to the research, authorship and/or publication of this article.
Funding
The authors received no financial support for the research, authorship and/or publication of this article.