
Abstract
Introduction:
Fervourous investigation and dialogue surrounding the true number of SARS-CoV-2-related deaths and implied infection fatality rates in India have been ongoing throughout the pandemic, and especially pronounced during the nation’s devastating second wave. We aim to synthesize the existing literature on the true SARS-CoV-2 excess deaths and infection fatality rates (IFR) in India through a systematic search followed by viable meta-analysis. We then provide updated epidemiological model-based estimates of the wave 1, wave 2 and combined IFRs using an extension of the Susceptible-Exposed-Infected-Removed (SEIR) model, using data from 1 April 2020 to 30 June 2021.
Methods:
Following PRISMA guidelines, the databases PubMed, Embase, Global Index Medicus, as well as BioRxiv, MedRxiv and SSRN for preprints (accessed through iSearch), were searched on 3 July 2021 (with results verified through 15 August 2021). Altogether, using a two-step approach, 4,765 initial citations were screened, resulting in 37 citations included in the narrative review and 19 studies with 41datapoints included in the quantitative synthesis. Using a random effects model with DerSimonian-Laird estimation, we meta-analysed IFR1, which is defined as the ratio of the total number of observed reported deaths divided by the total number of estimated infections, and IFR2 (which accounts for death underreporting in the numerator of IFR1). For the latter, we provided lower and upper bounds based on the available range of estimates of death undercounting, often arising from an excess death calculation. The primary focus is to estimate pooled nationwide estimates of IFRs with the secondary goal of estimating pooled regional and state-specific estimates for SARS-CoV-2-related IFRs in India. We also tried to stratify our empirical results across the first and second waves. In tandem, we presented updated SEIR model estimates of IFRs for waves 1, 2, and combined across the waves with observed case and death count data from 1 April 2020 to 30 June 2021.
Results:
For India, countrywide, the underreporting factors (URF) for cases (sourced from serosurveys) range from 14.3 to 29.1 in the four nationwide serosurveys; URFs for deaths (sourced from excess deaths reports) range from 4.4 to 11.9 with cumulative excess deaths ranging from 1.79 to 4.9 million (as of June 2021). Nationwide pooled IFR1 and IFR2 estimates for India are 0.097% (95% confidence interval [CI]: 0.067–0.140) and 0.365% (95% CI: 0.264–0.504) to 0.485% (95% CI: 0.344–0.685), respectively, again noting that IFR2 changes as excess deaths estimates vary. Among the included studies in this meta-analysis, IFR1 generally appears to decrease over time from the earliest study end date to the latest study end date (from 4 June 2020 to 6 July 2021, IFR1 changed from 0.199 to 0.055%), whereas a similar trend is not as readily evident for IFR2 due to the wide variation in excess death estimates (from 4 June 2020 to 6 July 2021, IFR2 ranged from (0.290–1.316) to (0.241–0.651)%).
Nationwide SEIR model-based combined estimates for IFR1 and IFR2 are 0.101% (95% CI: 0.097–0.116) and 0.367% (95% CI: 0.358–0.383), respectively, which largely reconcile with the empirical findings and concur with the lower end of the excess death estimates. An advantage of such epidemiological models is the ability to produce daily estimates with updated data, with the disadvantage being that these estimates are subject to numerous assumptions, arduousness of validation and not directly using the available excess death data. Whether one uses empirical data or model-based estimation, it is evident that IFR2 is at least 3.6 times more than IFR1.
Conclusion:
When incorporating case and death underreporting, the meta-analysed cumulative infection fatality rate in India varied from 0.36 to 0.48%, with a case underreporting factor ranging from 25 to 30 and a death underreporting factor ranging from 4 to 12. This implies, by 30 June 2021, India may have seen nearly 900 million infections and 1.7–4.9 million deaths when the reported numbers stood at 30.4 million cases and 412 thousand deaths (Coronavirus in India) with an observed case fatality rate (CFR) of 1.35%. We reiterate the need for timely and disaggregated infection and fatality data to examine the burden of the virus by age and other demographics. Large degrees of nationwide and state-specific death undercounting reinforce the call to improve death reporting within India.
Introduction
The second wave of SARS-CoV-2 in India—a country broaching 1/5th of the world population, wrought a devastating toll of an astronomical 414,000 daily reported infections and 4,500 reported daily deaths from COVID-19 (Dong et al., 2020) at its peak in May 2021, leading to a collapse of healthcare infrastructure (Gettleman et al., 2021). Concerns have been raised regarding the inadequacy of the healthcare systems of adjacent countries in this region (Khalid & Ali, 2020), as well as tragically realized amidst recent surges of SARS-CoV-2 in some of these countries (Amnesty International, 2021). To contextualize the SARS-CoV-2 mortality burden within this region (as of 31 July 2021), cumulative reported deaths per million in descending order of gravity are as follows: Nepal 332, India 304, Sri Lanka 206, Bangladesh 124 and Pakistan 104 deaths per million (Our World Data, 2021).
It is now well-known that only a fraction of SARS-CoV-2 infections were captured, stemming from a large degree of covert infections, access, willingness and availability of testing and, sometimes, a desire to maintain public image (Pan, 2020; Zimmermann et al., 2021). Similarly, due to incomplete and lagged reporting, lack of medical certification and misclassification of the cause of deaths, not all COVID-19-related deaths have been captured correctly (Karlinsky & Kobak, 2021; WHO, SCORE dashboard; WHO, 2021). Infection fatality rates (IFR) are measured as the ratio of the total number of deaths to the total number of infections over a given period. Serological surveys,with rigorous sampling design and cogent analysis, can provide an estimate of the prevalence of antibodies (Ab) formed in response to a past natural infection, and thereby an estimate of the total number of infected cases in an unvaccinated study population, which forms the basis for the denominator of the IFR measure. With the introduction of vaccines, seropositivity could arise both from vaccines or from past infections, and thus such studies are less-informative about the denominator in an IFR calculation. Excess deaths estimates, as commonly understood to be the difference between the expected and the observed all-cause mortality for a specified time period, using the death data released during the pandemic period can give us an idea on the number of COVID-19 deaths we failed to report or the extent of death underreporting (CDC, 2021; Karlinsky & Kobak, 2021; WHO, 2021). Compartmental epidemiological models, including extended versions of the susceptible-exposed-infected-removed (SEIR) model and renewal process models can also estimate the total number of latent infections and deaths by making stringent assumptions needed to identify certain key parameters (Campbell & Gustafson, in press; Purkayastha et al., 2021a, 2021b).
From a global lens, several systematic reviews have examined this integral measure of SARS-CoV-2 mortality, the IFR, at various points of the pandemic. As of 16 June 2020, a systematic review and meta-analysis of 24 studies estimated a pooled worldwide IFR of 0.68% (95% CI: 0.53–0.82), while noting considerable heterogeneity among the included studies and being unable to adjust for age, comorbidities and other demographic factors (limited by the availability of data) (Meyerowitz-Katz & Merone, 2020).Other efforts to systematically investigate the infection fatality rates of SARS-CoV-2 include a review and meta-analysis of age-specific IFRs from 27 studies among OECD countries (as of 18 September 2020), which concluded that the IFR increases substantially with age, estimating an age-specific IFR of 0.002% among children aged <10 years, 0.01% among younger adults aged ≥25years, 0.4% among adults aged ≥55 years, 4.6% among adults aged ≥65years and up to 15% among adults aged ≥85years (Levin et al., 2020). Limited to non-developing countries, this review estimated that 90% of the variation in IFR estimates is explained by the age make-up of the underlying populations (Levin et al., 2020). Regarding reconciling SARS-CoV-2 seroprevalence, a key ingredient to obtaining IFR estimates, a systematic review and meta-analysis (as of 14 August 2020) of 47 studies (encompassing 23 countries worldwide) found a worldwide seroprevalence estimate of 3.38% (95% CI: 3.05–3.72) with a range of 0.37% (Malaysia) to 22.1% (Iran) among the included studies, and reported considerable overall heterogeneity among the included studies as well as regional variation in the effect size with 1.45% (95% CI: 0.95–1.84) for South America to 5.27% (95% CI: 3.97–6.57%) for Northern Europe (Rostami et al., 2021). India was not examined in these multi-country systematic reviews of SARS-CoV-2 IFR and seroprevalence, and nor were any of its neighbouring countries.
Concerning India and its neighbouring countries (i.e., Bangladesh, Nepal, Pakistan and Sri Lanka), certain features common in this region are distinct from the countries considered in the above reviews and thereby beckon a comprehensive investigation of the SARS-CoV-2 fatality within these countries. First, the age structures of these countries are relatively young in comparison to higher income countries (as of 2020, the estimated median age in years are the following: India 28.4, Bangladesh 27.6, Nepal 24.6 (Moher et al., 2009), Pakistan 22.8, Sri Lanka 34.0 vs. the UK 40.5, Italy 47.3, Germany 45.7 and the USA 38.3 ( United Nations, World Population Prospects)). Considering this difference in the population age composition, a meta-analysis of SARS-CoV-2 infection fatality rates and seroprevalence would aid in discerning the values of these measures specific to South-East Asia. We note that, at the time of this report, no systematic review has examined the existent studies on IFRs within the region encompassing and surrounding India.
Here, we perform a systematic review of existent literature on SARS-CoV-2 infection fatality rates (IFRs) in India and India’s neighbouring countries of Bangladesh, Nepal, Pakistan and Sri Lanka, as of 3 July 2021, with verification of search thoroughness extending to 15 August 2021. Due to the paucity of data and availability of relevant studies in the adjacent countries, and considering the intensity of the latest SARS-CoV-2 outbreak in India as detailed above, we focused on India for the quantitative synthesis. Through a meta-analysis of SARS-CoV-2 IFR estimates, we examined the nationwide, regional and state-specific estimates and heterogeneity over the course of the pandemic within India. As an alternative approach to empirical evidence synthesis and meta-analysis, we used an extended SEIR model to present updated estimates of SARS-CoV-2 infection fatality rates with data through 30 June 2021, as well as underreporting factors for cases and deaths, corresponding to the first and second waves, as well as cumulative, for COVID-19 in India. This article concludes with a discussion of takeaways from the systematic review and meta-analysis, as well as from the updated model-based results. We highlighted some immediate and future considerations regarding revising the death reporting system in India and why capturing deaths are important for the health and future of the living.
Methods
Terminology and Definitions
Below we provide the definitions, with formulas as needed, of the various terms used throughout this systematic review and meta-analysis.
Seroprevalence survey (i.e., serosurvey) in the context of SARS-CoV-2 are large-scale studies aimed at estimating the true prevalence of SARS-CoV-2 (i.e., the cumulative percent infected over a period of time) within the target population, utilizing serological testing for IgG or IgM antibody’s presence (Carter et al., 2020) scaled to the level of a geographic location (e.g., nationwide, statewide, citywide or districtwide), a community or a smaller group. Study designs of serosurveys commonly involve population-based sampling methods (e.g., multi-stage cluster sampling, probability proportionate to size, etc.) applied to obtain a randomly selected, representative sample.
Case Underreporting Factor (URF (C)) is defined as the estimated total cumulative infections divided by the reported (i.e., observed) cumulative cases at the indicated date.
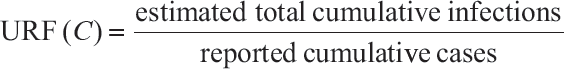
The numerator (estimated total cumulative infections) is estimated by the population of the target geographic region from which samples were selected, multiplied by the seroprevalence, as sourced from serosurveys. The population estimate is age-adjusted according to the age cut-off for the underlying study by multiplying the total population estimate of the study area by the proportion of the population in the age range included in the study sample.
Excess Deaths is defined as the absolute difference between the observed all-cause mortality in a specific time period and the expected all-cause mortality in the same period. When calculating excess deaths, the expected all-cause mortality is commonly projected using prior years of data, an average of prior years or an alternative benchmark, as it largely depends on the availability and continuity of all-cause mortality data within the location of study.

Death Underreporting Factor (URF(D)) is defined as the estimated total cumulative deaths divided by the reported (i.e., observed) cumulative deaths at the indicated date, as collected 14 days after the date indicated.
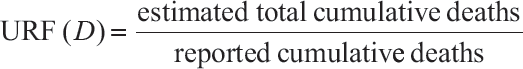
The numerator of the URF (D) (i.e., estimated total cumulative deaths) is the location and time period-specific excess deaths estimate (available at the time of this report), as sourced from media reports and studies on excess deaths. Using all-cause-mortality to calculate excess deaths over a long period has the limitation that the numerator often is not specific to COVID-19 disease. Some model-based studies have alternative ways of estimating this fraction using assumed values of COVID-19 fatality rates.
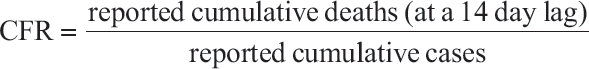
Case Fatality Rate (CFR) is defined as the reported (i.e., observed) cumulative deaths divided by the reported/observed cumulative cases. Reported cumulative deaths are routinely collected 14 days after the date indicated to allow for fatality delay between symptom onset and death. Whereas reported cumulative cases are collected on the date indicated, as a conservative approach to capturing the cumulative infections up to the date indicated. Further details on the intuition behind the assumption of a 14 day lag can be found in Supplementary Appendix F.
Infection Fatality Rate1 (IFR1) is defined as the reported (i.e., observed) cumulative deaths (collected 14 days after the indicated date) divided by the estimated total cumulative infections. In other words, IFR1 is an estimate of the true fatality rate for which the uncertainty in the denominator is adjusted but not the uncertainty in the numerator, namely, death undercounting is not accounted for.

In our meta-analysis, for studies without precalculated IFR1, the denominator (estimated total cumulative infections) is computed as the seroprevalence multiplied by the population estimate of the study location. Again, the population estimate is age-adjusted, according to the age inclusion criterion of the study design, by multiplying the population number by the percent of the population in the specified age range.
Infection Fatality Rate2 (IFR2) is defined as the estimated total cumulative deaths (14 days after the indicated date) divided by the estimated total cumulative infections. In other words, IFR2 is an estimate of the true fatality rate for which both the uncertainty in the denominator and the uncertainty in the numerator (i.e., death undercounting) are adjusted.

For studies without precalculated IFR2, the denominator (estimated total cumulative infections) is the same as the denominator in IFR1. The numerator (estimated total cumulative infections) is computed as the reported (i.e., observed) cumulative deaths (collected 14 days after the indicated date) multiplied by the death underreporting factor, as either model-derived or sourced directly from media reports and studies on excess deaths.
Identification of Studies for Systematic Review and Meta-analysis
The present systematic review and meta-analysis was conducted following the Preferred Reporting Items for Systematic Reviews and Meta-analyses (PRISMA) statement and guidelines (Moher et al. 2009; see Supplementary Appendix A for the completed PRISMA checklist). Two reviewers developed the search strategy with the expertise and guidance of information specialists from the University of Michigan Taubman Health Sciences Library. On 3 July 2021, we performed the search for relevant articles publicly disseminated from 1 January 2020 onwards and conducted irrespective of language within the databases, PubMed, Embase, World Health Organization’s database Global Index Medicus, as well as BioRxiv, MedRxiv and SSRN through iSearch, an interface that houses SARS-CoV-2-related reports curated by the National Institute of Health (a complete search strategy, including search terms, Boolean operators and applied filters, for each database is published in Supplementary Appendix B). Up until 15 August, we verified that no relevant studies were missed by manually combing through studies referenced in media reports, government press releases and any additional preprints or reports published after 3 July and through 15 August 2021.
For the narrative review, eligible studies included a nationwide, regional (e.g., state, union territory, city, district or slum designated area, etc.), or age/sex-specific measure of seroprevalence or infection fatality rate (IFR) for India or adjacent countries of Bangladesh, Nepal, Pakistan and Sri Lanka. Consistent with a systematic review that examines international infection fatality rates of SARS-CoV-2 among OECD countries (i.e., not developing countries) ( Levin et al., 2020 ), studies were excluded in the full-text screening (i) if the studies examined narrower sub-populations of the location of interest (e.g., healthcare workers, HIV positive adults or industrial workers, etc.), (ii) if the studies recruited participants from certain facilities (e.g., blood donors, dialysis centres), (iii) if the studies considered individuals at hospitals, urgent care centres, intensive care units (ICUs) or tertiary care centres, (iv) if the studies performed active recruitment of subjects (i.e., participants volunteered) and (v) if the studies limited their cohort to asymptomatic or symptomatic individuals. These criteria are used to identify studies, both with representative samples of the general population of interest and with measurements of the outcomes, that reflect seropositivity of SARS-CoV-2, regardless of virus manifestation (or irrespective of clinical presentation and presence of symptoms).
Summary of Data Sources for Nationwide Excess Deaths for India, as of June 2021, Used in Key Papers.

Two-step Screening and Data Abstraction
Citation titles and abstracts were screened independently by two reviewers to verify the inclusion and exclusion criteria. For articles not satisfying the exclusion criterion, the full text was accessed, and the two screeners separately reviewed the methods and results sections of these studies for final inclusion into this systematic review and meta-analysis. The two reviewers subsequently extracted data from the included articles on the following items: (a) study design, location and time period, as well as inclusion criteria, (b) sample size denoting the number of participants in the study, (c) descriptive statistics of the proportion of the study cohort male versus female and the mean age of the study cohort, (d) estimate of infection fatality ratio (IFR) or seroprevalence for SARS-CoV-2 and the corresponding 95% confidence intervals, when available and (e) any statistical sensitivity tests performed.
Statistical Meta-analysis
A detailed description of the meta-analysis framework is presented in Supplementary Appendix F. To perform the meta-analyses presented herein, the R package meta (Balduzzi et al., 2019) was utilized and the R package metafor (Viechtbauer, 2010) was employed to perform the included sensitivity analyses.
In preparation for the meta-analysis, we extracted the IFR or seroprevalence estimates, as well as the provided 95% CI, from each study corresponding to the study’s intended overall population. For seroprevalence studies without precalculated IFR1, we collected data on (a) COVID-19 confirmed fatalities from Coronavirus in India (
For the meta-analysis itself, we estimated three versions of SARS-CoV-2-pooled IFRs for each sub-analysis –namely (a) IFR1, (b) IFR2 with a lower limit of the reported estimates of URF (D) and (c) IFR2 with a higher limit of the reported estimates of URF (D). First, using a random effects model with inverse variance method and DerSimonian-Laird (DL) estimation, we estimated the nationwide SARS-CoV-2-pooled IFRs, as well as 95% confidence intervals, for India across all available national IFR data points (both precalculated and computed herein) included in this review. Next, a regional analysis of IFRs was performed considering India partitioned into the following regions: North, Northeast, East, South, West and Central. Regions with at least one available eligible study are examined. To compute the regional SARS-CoV-2-pooled IFRs, we first pooled the IFR estimates from statewide, citywide and districtwide studies associated with each state using the same random effects estimation approach. Then, the regional SARS-CoV-2-pooled IFRs were approximated with the statewide pooled IFR estimates, using the analogous random effects model with the inverse variance approach and DL estimator.
In both the nationwide and regional analyses, heterogeneity was assessed using the I statistic, where aI of 50–90% denotes substantial heterogeneity, and I ≥ 75%(and up to 100%) indicates considerable heterogeneity among the included studies, as recommended by Cochrane guidelines (Higgins et al., 2021). For the regional analysis, we interpreted the I with caution, as we expected variation in the true effect size among the included studies, as these studies cover varying states and IFRs have been found to vary by state (Purkayastha et al., 2021a).
To assess publication bias, we produced a funnel plot to examine the distribution of p-values and 95% confidence intervals, as well as performed the Egger’s and Begg’s tests to formally test for funnel plot asymmetry.To assess the risk of bias in the seroprevalence estimates across the included studies, we utilized the Joanna Briggs Institute (JBI) approach (Moola et al., 2020; Munn et al., 2015). Upon completing the series of questions for each study, the tool provided a rating of risk of bias (low/moderate/high) based on the sampling design and data collection methods. We answered each question according to the provided values (‘Yes’/ ‘No’/ ‘Unclear’/ ‘Not applicable’) and remarks were included with respect to the IFR estimates within the returned strata of the risk of bias.
Model-based Estimation of Fatality Rates in India During Wave 1, Wave 2 and Combined Over Waves from 1 April 2020 to 30 June 2021
The present study follows the same methodology as the previous versions (Purkayastha et al., 2021a). In brief, we employed a compartmental epidemiologic model, SEIR-fansy, to model the transmission dynamics of SARS-CoV-2. Accounting for the false negative rates of the SARS-CoV-2 antigen test type (e.g., RT-PCR and rapid antigen tests) observed in India, we included unascertained cases and deaths as a compartment. As depicted in Supplementary Appendix K, Figure S1, the population was further divided into 10 disjoint compartments: S (Susceptible), E (Exposed), T (Tested), U (Untested), P (Tested Positive), F (Tested False Negative), RR (Reported Recovered), RU (Unreported Recovered), DR (Reported Deaths) and DU (Unreported Deaths). A full description of the methodological framework is available in Supplementary Appendix K. Nine differential equations form the basis for imitating the spread of SARS-CoV-2. Parameters and 95% credible intervals (CrI) are estimated using Bayesian techniques by performing Metropolis–Hastings algorithm-based random sampling from the posterior distribution with a Gaussian proposal density.
Considering the inherent differences between the first and second waves of the pandemic (e.g., the strain on the healthcare infrastructure and the dearth of medical resources in wave 2), we examined the entailed epidemiological measures for wave 1 and wave 2 separately, with wave 1 as 1 April 2020 to 31 January 2021 and wave 2 as 1 February 2021 to 30 June 2021 (latest until this report). The start date of wave 2 of 1 February 2021 is reasoned as two weeks before the national effective reproduction number crossed unity on 14 February 2021 to allow for time between virus exposure and symptom onset. Daily infected cases, recovered cases and deaths were collected from Coronavirus in India (
Results
Search Results and Included Studies
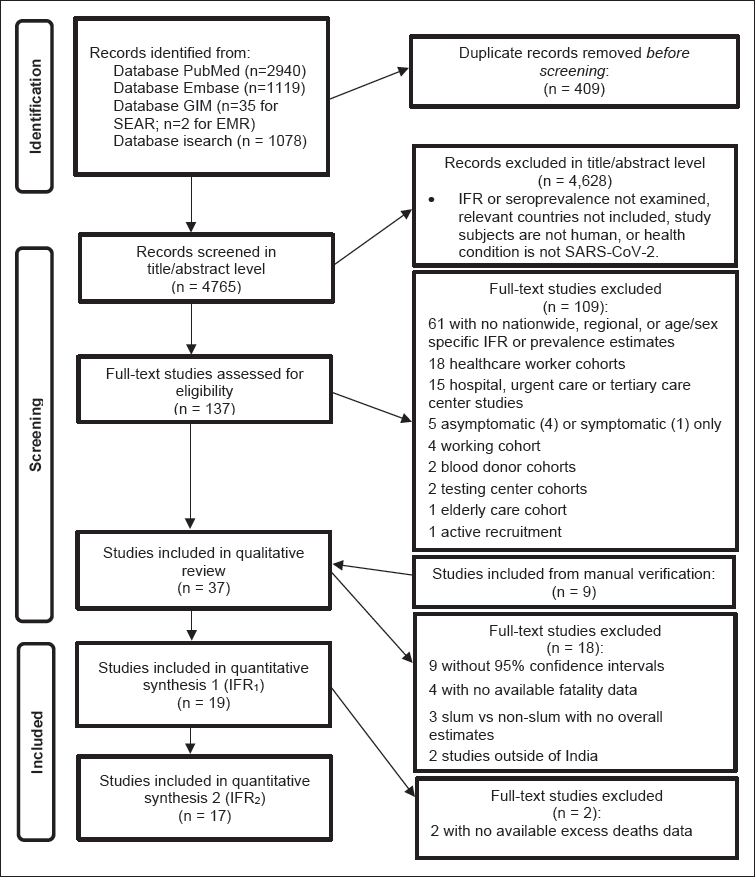
As shown in Figure 1 below, the search resulted in a total of 5,174 citations across the four search engines: PubMed (2,940), Embase (1,119), WHO Global Index Medicus (Southeast Asia Region: 35, Eastern Mediterranean Region: 2) and iSearch (1,078). After removing duplicate citations across databases, 4,765 articles were screened in the initial level of title/abstract, and we reviewed 137 articles in the second level of full-text screening. Of these studies, 61 studies were excluded as no seroprevalence, or infection fatality rate estimates were presented. Moreover, 18 studies were excluded as the cohort consisted of healthcare workers, 15 studies were excluded as the cohort consisted of patients from hospitals, urgent care units or tertiary care centres, five studies were excluded because the cohorts were limited to either asymptomatic (four studies) or symptomatic (one study) individuals, four studies were excluded as the cohort consisted of working individuals, two studies were excluded as the cohort consisted of blood donors, two studies were excluded as the cohort was sampled from testing centres, one study was excluded because the cohort consisted of members from elderly care centres and one study was excluded as the participants were actively recruited. Overall, across these sub-populations, 48 studies were collectively excluded for the reason of having narrow or non-representative samples, which in turn impedes the generalizability to a broader target population within the location of study.
Qualitative Review
Locations of Included Articles
Of the 37 articles included in the narrative review, 2/5 countries originally in the search (namely, India and Pakistan) were present in these articles. In other words, no eligible studies were available for Bangladesh, Nepal or Sri Lanka. The predominant country studied was India (35/37 included articles), with Pakistan being the other country (2/37 included articles). In the initial screening, nearly all citations were written in English with one citation written in French. In the full-text screening, all articles were written in English.
Study Designs, Populations and Objectives
As shown in Supplementary Appendix C Table 1, among the 37 included articles, 27/37 were serosurvey studies (25 serosurveys for India (Babu, 2020; Babu et al., 2021; Banerjee et al., 2020; George et al., 2021; Hindustan Times, 2021a; Inbaraj et al., 2021; Joshi et al., 2021; Kar et al., 2021; Khan et al., 2021; Kshatri et al., 2021a, 2021b; Malani et al., in press; Malani et al. 2021; Misra et al., in press; Mohanan et al., in press; Murhekar et al., 2020, 2021a 2021b; Prakash et al., 2021; Sakalle et al., 2021; Selvaraju et al., 2021; Sharma et al., in press; Tata Institute of Fundamental Research, 2021; Reporter, 2021; PIB, 2021), two serosurveys for Pakistan (Nisar et al., 2021; Haq et al., 2021) and 10/37 were other study designs (Banaji, 2021; Bhattacharyya et al., 2021; Banaji, in press; Bhaduri et al., in press; Bommer & Vollmer, 2020; Campbell & Gustafson, in press; Cai et al., 2021; Goli & James, in press; Hazra et al., in press; Purkayastha et al., 2021b), such as extended compartmental epidemiological model-based approaches.
The age distributions of the study populations reflect the younger populations in India and Pakistan with 6/11 studies (that reported the study age composition) having a mean age of ≤24 to <40 years and 5/11 studies with a mean age of ≤40 to <50 years (Supplementary Appendix C Table 1). Regarding the participation rates by gender, out of the 19 studies (that reported the study gender composition), 5 studies had a considerably larger proportion of male than female participants, whereas 3 studies had a heavier percentage of female than male participants (Supplementary Appendix C Table 1). The remaining 11/19 had a comparable percentage of male versus female participants.
A nationwide target population accounted for 10/37 studies, namely, eight for India (PIB, 2021; Bommer & Vollmer, 2020; Bhaduri et al., in press; Campbell & Gustafson, in press; Goli & James, in press; Murhekar et al., 2021; Murhekar et al., 2020, 2021a, 2021b; Purkayastha et al., 2021) and one for Pakistan (Haq et al., 2021). The predominant population of interest was cities with 19/37 studies focussing on municipal target populations and with the following counts of studies per city: six Delhi, India (Babu, 2020; Bhattacharyya et al., 2021; Hazra, in press; Hindustan Times, 2021a; Misra et al., in press; Sharma et al., in press); four Mumbai, India (Banaji, in press; Malani et al., 2021; Reporter, 2021; Tata Institute of Fundamental Research, 2021); one Ahmedabad, India (Prakash et al., 2021); two Bhubaneswar, India (Kshatri et al., 2021a, 2021b); two Chennai, India (Banaji, 2021; Selvaraju et al., 2021); one Indore, India (Sakalle et al., 2021); one Pimpri-Chinchwad, India (Banerjee et al., 2020); one Ujjain, India (Joshi et al., 2021); and one Karachi, Pakistan (Nisar et al., 2021). The next highest population of interest was state and union territories with 6/37 studies focussing on statewide generalizations and the following counts of studies per state or union territory: three Karnataka, India (Babu et al., 2021; Cai et al., 2021; Mohanan et al., in press); one Kashmir, India (Khan et al., 2021); one Puducherry, India (Kar et al., 2021); and one Tamil Nadu, India (Malani, in press). The prevalence of SARS-CoV-2 in slum dwellings was considered in 8/37 studies with the following counts of studies per slum area: three slum sections within Mumbai, India (Banaji, in press; Reporter, 2021; Tata Institute of Fundamental Research, 2021); one slum sections within Matunga, Chembur West and Dahisar wards in Mumbai, India (Malani et al. 2021); one Devarajeevana Halli (DJ Halli) slum in Bengaluru, India (George et al., 2021); one slum section within Pimpri-Chinchiwad, India (Banerjee et al., 2020) and two nationwide slum prevalence approximations from the 2nd and 3rd nationwide serosurveys for India (Murhekar et al., 2021a, 2021b). The seroprevalence of SARS-CoV-2 within rural districts versus urban was examined in 9/37 included studies and with the following counts per area: one Bangalore Rural District (with subdistricts—otherwise referred to as taluks of Devanahalli, Doddaballapura, Hoskote, Nelamangala)—India (Inbaraj et al., 2021); one Delhi, India (Misra et al., in press); one Karnataka, India (Mohanan et al., in press); one Kashmir, India (Khan et al., 2021); one Puducherry, India (Kar et al., 2021); one Tamil Nadu, India (Malani, in press); and three nationwide for India (PIB, 2021; Murhekar et al., 2021a, 2021b).
SARS-CoV-2 Surveillance Measurements and Levels of Granularity
As presenting either an IFR or seroprevalence estimate was an inclusion criterion, all 37 included studies estimated one or both of these measures. The breakdown of measures examined was as follows: 8/37 studies presented only IFR estimates without estimating seroprevalence, 15/37 studies presented only seroprevalence estimates without computing IFRs and 14/37 studies reported both estimated seroprevalence and IFRs. Among the included studies, seroprevalence was estimated at the following levels: overall region, subregion (e.g., district/ward), type of residence (e.g., urban/rural/slum/non-slum), age, sex, age–sex and for select comorbidities (e.g., diabetes and hypertension). In contrast, IFRs were estimated largely at the overall level with just two studies presenting age–sex stratified estimates (one serosurvey for Tamil Nadu (Malani, in press) and one other study design for Karnataka, Mumbai and Bihar migrants (Cai et al., 2021)).
Remarks on Excluded Articles
The prevailing reason for the exclusion of studies in the full-text screening was that the articles did not provide a concurrent prevalence estimate or an IFR (61/109). Of these 61 studies presenting other epidemiological measures, a large number examined CFRs. Additionally, a considerable number of studies (18/109) were excluded, which examined the subpopulation of healthcare workers and with the following counts of healthcare worker studies per country: India (16) and Pakistan (2). The third notable exclusion criterion was studies that examined hospital, urgent care or tertiary care centres (15/109), which resulted in the following counts of patient or hospitalized studies per country: India (11), Pakistan (2), Bangladesh (1) and Nepal (1). A complete list of studies excluded with reasoning is presented in Supplementary Appendix D, as well as a summary table synthesizing the total number of studies excluded per eligibility criterion by country (see Supplementary Appendix E).
Quantitative Summary for India: Meta-analysis of Infection Fatality Rates
Of the 37 eligible studies in the narrative review, 19 and 17 studies were included in the meta-analysis of IFR1 and IFR2, respectively. Supplementary Appendix G lists the studies that were not included in the meta-analysis and their respective reasons for exclusion. To summarize, the reasons for exclusion include: (a) did not provide a 95% confidence interval for the seroprevalence and/or IFR estimate, (b) fatality data were unavailable for the study location (e.g., city or select districts) from Coronavirus in India (
Summary of Nationwide Underreporting of Infections
Nationwide Seroprevalence and Case Underreporting Factors for India.
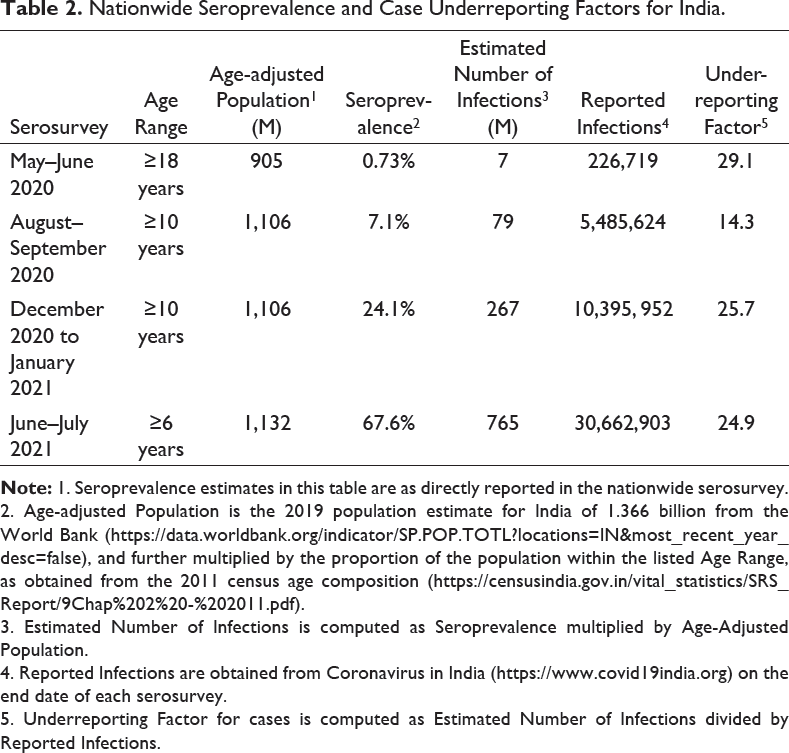
2. Age-adjusted Population is the 2019 population estimate for India of 1.366 billion from the World Bank (
3. Estimated Number of Infections is computed as Seroprevalence multiplied by Age-Adjusted Population.
4. Reported Infections are obtained from Coronavirus in India (
5. Underreporting Factor for cases is computed as Estimated Number of Infections divided by Reported Infections.
Key Findings
Estimated cumulative SARS-CoV-2 infections for India is 765 million, based on the 4th nationwide serosurvey (as of July 2021).
Underreporting factor for SARS-CoV-2 infections ranges from 14.3 to 29.1, across the four nationwide serosurveys in India.
Background on Nation- and State-level Excess Deaths
As shown in Table 3, five recent studies have provided nationwide excess deaths estimates for India, as of June 2021 (Anand et al., 2021; Deshmukh et al., in press; Guilmoto, 2021; Leffler et al., 2021; Ramachandran & Malani, in press). Of the three studies that examined excess deaths in India broken out by waves 1 and 2 (Anand et al., 2021; Deshmukh et al., in press; Leffler et al., 2021), excess deaths were generally found to be considerably higher in wave 2 than in wave 1, with the exception of the Anand et al. (2021) study, where excess deaths decreased from 3.4 (wave 1) to 1.5 million (wave 2). We note that this study considers the first wave as ending in March 2021, which extends into the second wave, as the national effective reproductive number crossed unity on 14 February 2021 in India. In turn, this may in part explain the higher excess deaths estimate for wave 1 comparable to the other two studies. The degree of nationwide death underreporting has remained high from waves 1 to 2, with the Wave 1 URF (D) ranging from 3.8 to 19.6 and the Wave 2 URF (D) ranging from 4.0 to 11.2 (Table 3). Up to June 2021, the cumulative excess death estimates across waves 1 and 2 for India ranged from 1.79 million (Leffler et al., 2021) to 4.9 million (Anand et al., 2021), suggesting a combined nationwide URF (D) of 4.4–11.9.
Nationwide Excess Deaths and Death Underreporting Factors for India in Waves 1, 2 and Combined.

2. Underreporting Factor is computed as Excess Deaths divided by COVID-19 Reported Deaths, unless otherwise noted.
3. Underreporting Factor (URF), as well as COVID-19 Reported Deaths, is directly reported in this study. Hence, the URF in this table is the precalculated estimate provided.
Statewide Excess Deaths and Death Underreporting Factors for India in Waves 1, 2 and Combined.

b. Underreporting Factor is computed as excess deaths divided by COVID-19 Reported Deaths, unless otherwise noted.
c Underreporting Factor (URF), as well as COVID-19 Reported Deaths, are directly reported in this study. Hence, the URF in this table is the precalculated estimate provided.
Key Findings
Cumulative excess deaths for India countrywide range from 1.79–4.9 million deaths, and so the nationwide death underreporting factors (URF (D)) range from 4.4–11.9, based on nationwide excess deaths studies (as of 30 June 2021).
For Wave 1, the nationwide URF (D) ranges from 3.8–19.6 with 595,000–3.4 million estimated excess deaths. For Wave 2, the nationwide URF (D) ranges from 4.0–11.6 with 1.06–2.77 million estimated excess deaths.
Key Findings
Cumulative regional death underreporting factors (URF (D)) range from 1.7 (Kerala) to 23.9 (Madhya Pradesh), across both waves.
For Wave 1, the statewide excess deaths range from –70,000 (Gujarat) to 134,000 (Bihar). For Wave 2, the statewide excess deaths range from 3,000 (Himachal Pradesh) to 192,000 (Madhya Pradesh).
Nationwide IFR1 and IFR2
Figure 2 presents the results of the nationwide meta-analysis of IFR1 for India. Using a random effects approach with DL estimation, the estimated nationwide pooled SARS-CoV-2 IFR1 for India is 0.097% (95% CI: 0.067–0.140). This suggests a nationwide SARS-CoV-2 fatality ratio of 97 deaths per 100,000 infections for India, when not accounting for underreporting of deaths. As seen in Figure 2, there is considerable variation in the time periods encompassed in the studies belying this overall estimate. The range of IFR1 (from the highest to the lowest) among the included studies is 0.199% (4 June 2020) to 0.055% (6 July 2021).
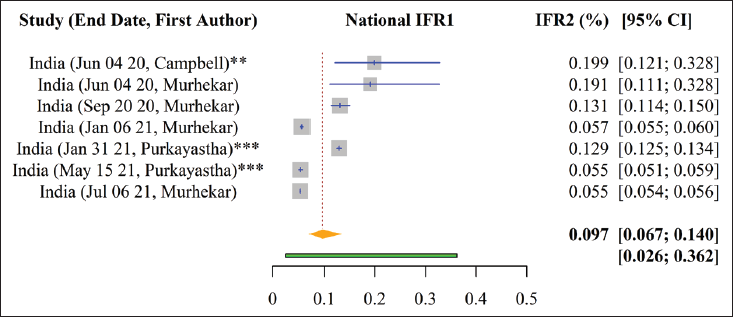
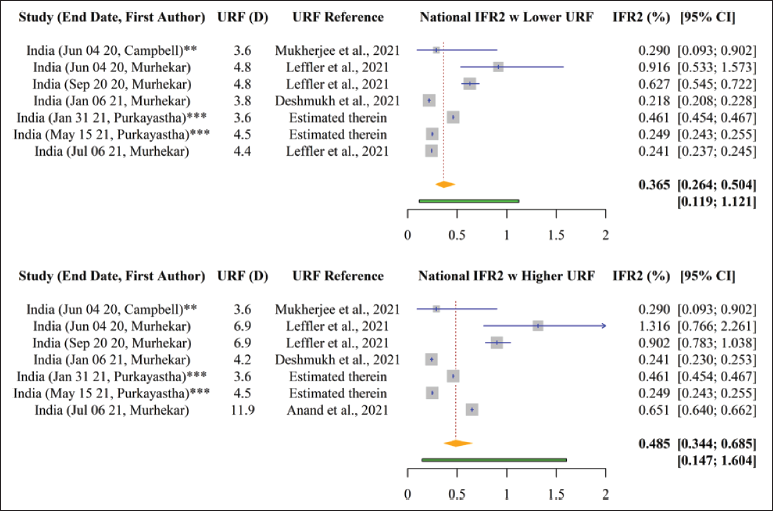
Figure 3 shows the results of the nationwide meta-analysis of IFR2 for India. Using a random effects approach with DL estimation, the estimated nationwide pooled SARS-CoV-2 IFR2 for India ranges from 0.365% (95% CI: 0.264–0.504) to 0.485% (95% CI: 0.344–0.685), when applying the lower and higher ends of the uncertainty bracket for death underreporting, respectively. This can be interpreted as a nationwide SARS-CoV-2 fatality ratio of 365–485 deaths per 100,000 infections for India, when further adjusting for underreporting of deaths.
A detailed forest plot of the nationwide seroprevalences of SARS-CoV-2 in India, as well as the accompanying 95% confidence interval, underlying the computed nationwide IFRs, as directly reported in the included studies, can be found in Supplementary Appendix H Figure 1.
Comparison of Nationwide CFR to IFR1 and IFR2 from Included Studies for Wave 1 and Across Waves.
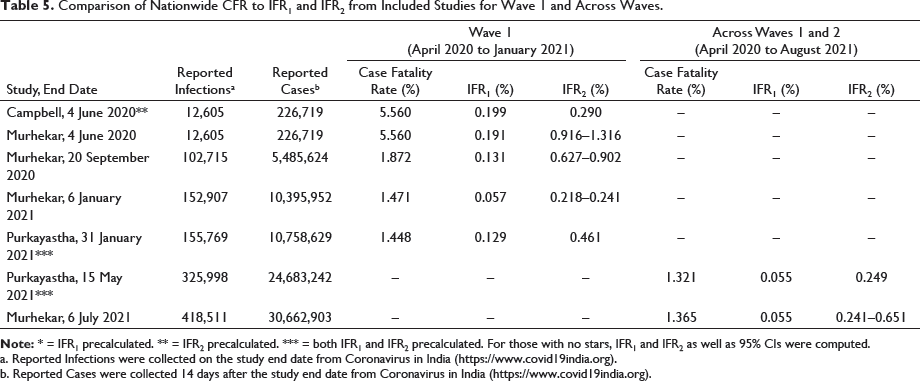
a. Reported Infections were collected on the study end date from Coronavirus in India (
b. Reported Cases were collected 14 days after the study end date from Coronavirus in India (
Key Findings
Nationwide pooled IFR1 and IFR2 estimates for India are 0.097% (95% confidence interval [CI]: 0.067–0.140) and 0.365% (95% CI: 0.264–0.504) to 0.485% (95% CI: 0.344–0.685), respectively, with IFR2 lower and upper values reflecting the range of excess deaths available at the time of this study.
Among the included studies in this meta-analysis, IFR1 largely decreased over time from the earliest to the latest study end date (i.e., from 4 June 2020 to 6 July 2021, IFR1 ranged from 0.199 to 0.055%). In contrast, this trend is not as apparent for IFR2 (from 4 June 2020 to 6 July 2021, IFR2 changed from (0.290–1.316) to (0.241–0.651) %).
Regional and Statewide IFR1 and IFR2 Detailed estimates of regional pooled IFR1 and IFR2 of SARS-CoV-2 in India and 95% confidence intervals (CI), as well as the statewide pooled IFR1 and IFR2 estimates input for each region, are presented in Figures 4 and 5, respectively. Using the same random effects model with DerSimonian-Laird estimation as in the nationwide analysis, the regional pooled IFR1 is estimated to be the following (as ordered from the highest to the lowest pooled effect size and reporting only regions with more than one state): East 0.136% (95% CI: 0.062–0.302), West 0.125% (95% CI: 0.052–0.303), North 0.109% (95% CI: 0.037–0.325) and South 0.062% (95% CI: 0.023–0.164) (Figure 4). Hence, East and West India have the largest estimated IFR1 of 0.136 and 0.125%, respectively, suggesting estimated infection fatality rates (when not adjusting for underreporting) for SARS-CoV-2 of 136 deaths per 100,000 persons and 125 deaths pers 100,000 persons in these regions, respectively. The estimate for the East is largely driven by the comparatively high statewide IFR1 estimate for West Bengal of 0.322% (95% CI: 0.290–0.357), whereas the estimate for the West is driven by Maharashtra (0.244%) (Figure 4). The lowest IFR1 estimate is for South India, that is, 0.062% (95% CI: 0.023–0.164), backed by Andhra Pradesh and Karnataka, which have the lowest statewide pooled IFR1 of 0.019% and 0.019%, respectively (Figure 4). Also, considering regions with 1 state, the pooled regional IFR1 estimates range from 0.062% for South to 0.174% for Central.
We also found that considerable heterogeneity exists even within each respective region in India. As examples, the statewide pooled IFR1 varies in the North from 0.043% (Jammu and Kashmir) to 0.362% (Punjab), in the South from 0.019% (Andhra Pradesh and Karnataka, respectively) to 0.162% (Puducherry) and in the West from 0.051% (Goa) to 0.244% (Maharashtra).

Using the same random effects model with DL estimation, the range of the regional pooled IFR2 is estimated to be the following (as ordered from the highest to the lowest pooled effect size and considering only regions with >1 state): North 0.477% (95% CI: 0.250–0.911) to 0.477% (95% CI: 0.250–0.911), West 0.396% (95% CI: 0.294–0.534) to 0.399% (95% CI: 0.297–0.535), East 0.304% (95% CI: 0.153–0.605) to 0.304% (95% CI: 0.153–0.605) and South 0.191% (95% CI: 0.165–0.223) to 0.205% (95% CI: 0.175–0.241) (Figure 5). Hence, North and West India have the largest estimated IFR2 of 0.477–0.477% and 0.396–0.399%, respectively, indicating estimated infection fatality rates (when adjusting for death underreporting) for SARS-CoV-2 of 477 deaths per 100,000 persons and 396–399 deaths per 100,000 persons in these regions, respectively. The Northern IFR2 estimate is largely driven by the comparatively high statewide IFR2 estimate for Punjab (1.010%), which has the second highest statewide pooled IFR2 (after Madhya Pradesh at 1.061%) of all states encompassed among the included studies, whereas the estimate for the West is driven by Gujarat (0.607%) (Figure 5). The lowest IFR2 estimate is again for South India, that is, 0.191–0.205% (among regions with >1 state), backed by Karnataka and Kerala, which have the lowest statewide pooled IFR2 of 0.067–0.083% and 0.144%, respectively (Figure 5). In sum, when considering regions with one state, pooled regional IFR2 estimates range from 0.168% for Northeast to 1.061% for Central.

A detailed forest plot of the state, city and district-specific seroprevalences of SARS-CoV-2 in India, as well as the accompanying 95% confidence interval, belying the computed regional and statewide IFRs, as directly reported in the included studies, can be found in Supplementary Appendix H Figure 1.
Key Findings
Regional pooled IFR1 estimates within India range from a low of 0.062% in the South to a high of 0.136% in the East. Regional pooled IFR2 estimates range from [0.191–0.205%] in the South to [0.477%] in the North.
Considerable within-region heterogeneity is also observed, as pooled state specific IFR1 and IFR2 estimates are evidenced to vary within regions.
We present a funnel plot of the standard error of the effect sizes of the included studies in Figure 6 as a standard method for examining publication bias. Although the results show asymmetry, in the context of seroprevalence proportions from serosurveys which comprise the bulk of the study designs, this does not necessarily indicate the presence of publication bias (Wang, 2018). Instead, we suspect that the asymmetry is due to heterogeneity in the actual effect sizes of the prevalence of SARS-CoV-2 among the populations captured by the included studies. A detailed assessment of publication bias is presented in Supplementary Appendix J. The results of the Joanna Briggs Institute (JBI) assessment for risk of bias within each included study can be found in Supplementary Appendix I.

Data files and code used to produce the above results are available on GitHub at the following repository:
Updated Model-based Estimates of Wave 1 and Wave 2 Fatalities
Since wave 1 is defined analogously, as in the latest report (Purkayastha et al., 2021a) and the underlying data are the same, the wave 1 estimates presented herein are unchanged. Briefly, when adjusting the denominator by the estimated case underreporting factor of 11.11 (95% CrI 10.71–11.47), the nationwide IFR1 estimate (defined as observed cumulative deaths/estimated total cumulative infections) for wave 1 was 0.129% (95% CrI 0.125–0.134). When further adjusting the numerator by the estimated death underreporting factor of 3.56 (95% CrI 3.48–3.64), we obtained a nationwide IFR2 estimate (i.e., estimated cumulative total deaths/estimated cumulative total infections) for wave 1 of 0.461% (95% CrI 0.455–0.468). The wave 1 IFR2 estimate is largely congruent to the estimated effect sizes from the latest nationwide serosurvey in India (PIB, 2021), in that it falls within the bounds of the computed IFR2 herein for the 4th nationwide serosurvey of 0.241–0.651%, when applying a death underreporting factor range of 4.4 (1.79 million excess deaths (Leffler et al., 2021) to 11.9 (4.9 million excess deaths; Anand et al., 2021)).
Since wave 2 data extended to 30 June 2021, using the same compartmental epidemiological model, we estimated case and death underreporting factors of 13.3 (95% CrI 11.4–14.6) and 3.46 (95% CrI 3.13–3.69), respectively. As such, the nationwide IFR1 estimate for wave 2 is 0.095% (95% CrI 0.086–0.109), which is slightly higher than the previously reported estimate of 0.032% (95% CrI 0.029-0.035) as of 15 May 2021 (i.e., near the peak of wave 2 in India) (Purkayastha et al., 2021a). The nationwide IFR2 estimate for wave 1 is 0.326% (95% CrI 0.316–0.342), which is higher than our latest reported estimate of 0.183% (95% CrI 0.180–0.186) as of 15 May 2021 (Purkayastha et al., 2021a). The current estimates of the IFR for wave 2 have increased in magnitude in comparison to past estimates due to having a time period that better reflects the trajectory of the second wave and data that encompass both the ascent and descent of cases and deaths. Moreover, the updated underreporting factors for cases and deaths are half the size of the previous underreporting factors for wave 2 (i.e., 26.73 (95% CrI 24.26–28.81) and 5.77 (95% CrI 5.34–6.15), respectively, as of 15 May) (Purkayastha et al., 2021a), and have largely converged in magnitude to the underreporting factors for wave 1.
Figure 7 contains estimated number of infections and deaths for waves 1 and 2 in India, as well as the case and death underreporting factors. State-level estimates of IFR1 and IFR2 for waves 1 and 2 are reported in Supplementary Appendix N Figure 2, which shows the between state variation in these measures for wave 1 and wave 2, respectively, for the 20 states with high cases-deaths within India.
Comparison of Observed and Estimated Case and Death Counts and Corresponding Underreporting Factors from Wave 1, Wave 2 and Both Combined.
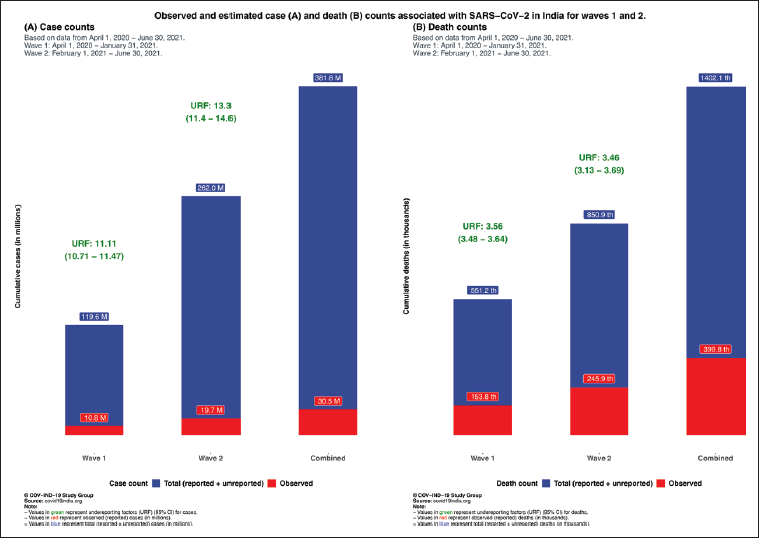
For Wave 1, nationwide SEIR model-based estimated total cumulative deaths is 551,000 and the estimated total cumulative infections is 119.6 million, whereas for Wave 2 the former is 852,000 and the latter is 262 million, with data from 1 April 2020 to 30 June 2021. For Wave 1, nationwide model-based IFR1 and IFR2 estimates are 0.129% (95% CrI 0.125–0.134) and 0.461% (95% CrI 0.455–0.468), respectively. For Wave 2, nationwide model-based IFR1 and IFR2 estimates are 0.095% (95% CrI 0.086–0.109) and 0.326% (95% CrI 0.316–0.342), respectively.Key Findings
Combined Estimates Across the Waves
As shown in Figure 7 above, the total number of cases (reported and unreported) and deaths (reported and unreported) in India across waves 1 and 2 is estimated to be 381.6 million and 1.4 million, respectively. Subsequently, the combined infection fatality rate (IFR) across both waves is estimated to be 0.101% for IFR1, and 0.367% for IFR2 (as previously defined). State-level case and death underreporting factors for India are included in Supplementary Appendix N Tables 1–3 and Figure 3.
We also included a state- and country-level comparison of the estimated case underreporting factors across both waves to the estimated case undercounting factors presented by ICSM in the 4th nationwide seroprevalence survey (as of 31 May 2021) for India (PIB, 2021; see Supplementary Appendix N Table 4). Briefly, the estimated case underreporting factors presented herein are lower at-large than the case undercounting factors announced for the 4th nationwide seroprevalence survey (PIB, 2021), with the exceptions of Andhra Pradesh, Chhattisgarh, Jammu and Kashmir and Kerala, where the case underreporting factors that we estimated are larger, as well as Maharashtra where the case underreporting factor is the same. As such, we presented the estimated case underreporting factors that are conservative with respect to the recent nationwide serosurvey under counting estimates. The true extent of the magnitude of infections absent in reported case counts is wagered to lie somewhere in between.
Discussion and Conclusions
Key Findings
As of 30 June 2021, nationwide URF (C) and URF (D) are estimated to be 12.5 and 3.5, respectively, by the SEIR model.
Nationwide SEIR model-based estimated total cumulative infections is 381.6 million and estimated total cumulative deaths is 1.4 million (as of 30 June 2021), whereas reported deaths were 412,000 and cases were at 30.4 million.
Nationwide model-based cumulative IFR1 and IFR2 estimates are 0.101% (95% CI: 0.097–0.116) and 0.367% (95% CI: 0.358–0.383), respectively.
The magnitude of these model-based estimates largely reconcile with the empirical findings. Across empirical data and model-based estimation, IFR2 is nearly 3.6 times the size of IFR1.
Neighbouring Countries
Comparison of Nationwide CFRs Among Countries in Review, as of July 2021.
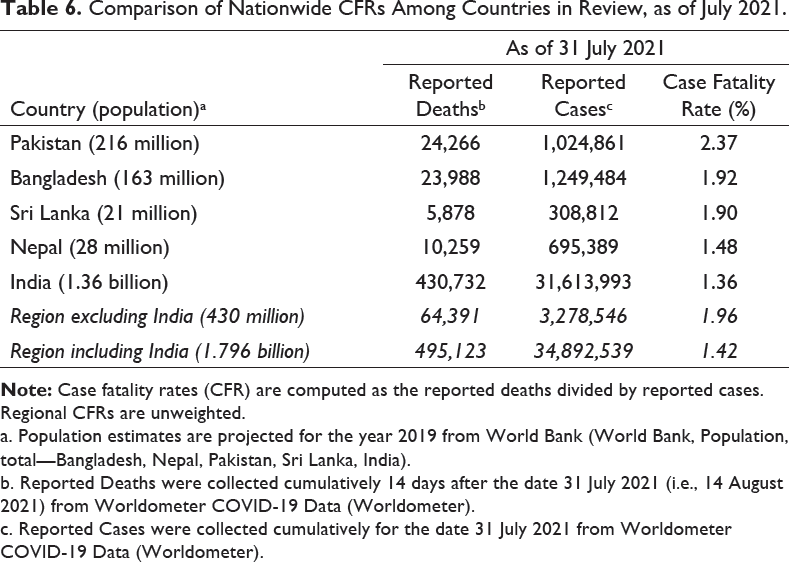
a. Population estimates are projected for the year 2019 from World Bank (World Bank, Population, total—Bangladesh, Nepal, Pakistan, Sri Lanka, India).
b. Reported Deaths were collected cumulatively 14 days after the date 31 July 2021 (i.e., 14 August 2021) from Worldometer COVID-19 Data (Worldometer).
c. Reported Cases were collected cumulatively for the date 31 July 2021 from Worldometer COVID-19 Data (Worldometer).
Summary on Fatality Rates in India
For India, there were enough eligible studies to perform a meta-analysis of infection fatality rates. A key result of the meta-analysis concerning the nationwide IFR estimates for India is that both the CFR (i.e., not accounting for infection nor death underreporting) and IFR1 (i.e., not accounting for death underreporting) have decreased overtime, whereas IFR2 appears to have remained the same, or even increased in some studies over time. In other words, when failing to take into account case and/or death underreporting (i.e., CFR and IFR1), the SARS-CoV-2 mortality rate falsely appears to be decreasing. However, when correctly adjusting for both underreporting of infections and deaths (i.e., IFR2), we do not observe that less deaths are resulting from the same number of infections through wave 2 compared to wave 1. This aligns with the catastrophic collapse of the healthcare system observed at-large in India during the second wave of the pandemic (Gettleman et al., 2021). In sum, use of either the CFR or IFR1 (not accounting for death underreporting) alone may be deceptively misleading, and IFR2 should also be utilized in public health programming and policy decision-making.
The narrative review of general population SARS-CoV-2 infection fatality rate or seroprevalence studies brought forth some trends concerning virus spread and fatality. In India, dense urban areas and slum dwellings have been found to have markedly higher prevalence estimates in comparison to non-slum or rural locations. In Mumbai, prevalence has been estimated to be 58.4% (95% CI: 56.8–59.9) in slums and 17.3% (95% CI: 16.0–18.7) in non-slums (Malani et al., 2021). In Bangalore, estimated prevalence of 57.9% (95% CI: 53.4–62.3) was found within a slum (George et al., 2021). Trends in the infection fatality rates (IFRs) are less obvious among the albeit limited number of slum population-focused seroprevalence studies in this region. A study in Mumbai found the IFR of SARS-CoV-2 in slums to be one-third the size of that in non-slums (i.e., 0.076% among slums versus 0.263% among non-slums (Malani et al., 2021)). Similarly, another study on a slum in Bengaluru estimated the IFR to be 2.94 deaths per 10,000 infections (or 0.029%) (George et al., 2021).
When estimating regional and statewide IFR estimates for India, the latest available studies for certain regions were during the outset of the pandemic (e.g., Central India with both input studies around August 2020). Such variation in study time periods highlights the need for updated seroprevalence studies in select regions. The findings from this regional meta-analysis also underscore the geographical differences in data collection/research spread across India. A large number of the included studies in this systematic review and meta-analysis were in the South and North, with substantially less coverage in the Central and Northeast regions. Moreover, no eligible serosurveys were available for the region of Northeast India (which includes the following states: Arunachal Pradesh, Assam, Manipur, Meghalaya, Mizoram, Nagaland, Sikkim and Tripura). This leads us to the limitations of the meta-analysis presented herein.
Limitations of Meta-analysis
We were not able to incorporate Bangladesh, Nepal, Pakistan or Sri Lanka in the meta-analysis presented in this article, as no eligible studies were available for these countries (apart from Pakistan, which had two included seroprevalence surveys), as previously discussed in the Results section. There were insufficient age- as well as sex-disaggregated IFRs for India (and for the neighbouring countries) to examine heterogeneity in IFR estimates by either demographic. Furthermore, although age and sex-disaggregated seroprevalence estimates were extracted from the included studies, disaggregated deaths and cases by these demographics are not available for India or for its states, cities or districts, at the time of this review. Additionally, there were insufficient data on excess deaths for select states (e.g., Jammu and Kashmir and Puducherry) that precluded our ability to compute IFR2 for studies encompassed in these states and, as such, we were unable to include these studies in the meta-analysis for the regional IFR2. Additionally, we caution that several included studies in the quantitative synthesis are in the process of being peer-reviewed, and so multiple underlying datapoints have not yet been verified.
Last, we note that global studies that examine India along with multiple other countries (as part of a country level global analysis) but do not explicitly refer to India in the title/abstract were not captured by our published search strategy. Therefore, a limitation of the meta-analysis is that these IFR estimates for India from global studies are not comprehensively reflected in the empirical results of IFRs, and similarly in the excess deaths synthesis. For example, a recent study by Rahmandad et al. (2021) that appears (exact estimates are not reported) to estimate, for India, a ratio of estimated to reported deaths on the log scale in the ballpark of 1.2–1.5 (i.e., 3.3–4.4 when exponentiated) and an IFR near 0.4–0.5% for India (as of 22 December 2020), as part of a global analysis of 92 nations, was not captured (no explicit reference to India in title/abstract). Hence, this is an example of model-based estimates not reflected in the empirical findings presented in this report.
Recommendations Moving Forward
Based on the empirical and model-based findings evidenced in this report, we provide some high-level recommendations, primarily, as it concerns India. To reiterate, investigations aimed at estimating the true extent of COVID-19 attributed deaths in India have relied on a myriad of data sources (Table 1). Such data sources do not come without their challenges (e.g., non-response bias and selection bias), and often lead to considerable variation in the ultimate results. For example, Ramachandran and Malani (in press) provided a higher estimate of excess deaths for India, that is, 5.21 million (compared to their 3.36 million excess deaths estimate) from January 2020 to June 2021, when further considering households that did not respond consecutively. Given that no current all-cause mortality data exist for India at the time of this report with the latest release in 2010–2013, linking data sources in this manner is a common alternative. We encourage the release of timely and disaggregated data on SARS-CoV-2 cases and deaths, as it is needed to assess stratified effects by age–sex–geography (Zimmermann et al., 2021). Despite geographic heterogeneity, the quality of case and death reporting remains a great concern for India and continues to mask the true fatality rate, as well as impede ongoing epidemiological investigations. In the absence of all-cause and disaggregated COVID-19 mortality data, tools (e.g., a personal digital health identifier) (Zimmermann et al., 2021) and fortified vital surveillance methods (e.g., monitoring inactive bank accounts) and practices (e.g., increased community engagement) (Zimmermann et al., 2021) are needed to facilitate and validate the use of the previously mentioned data sources and others. Strengthening the nationwide vital surveillance system in these ways would enable timely and pointed interventions from public health and government officials to ultimately prevent further overload of healthcare systems and loss of life. To put the excess deaths synthesis into context, the range of death underreporting factor for India, which is 4.4–11.9 (based on 1.79–11.9 million excess deaths from (Leffler et al., 2021; Anand et al., 2021, respectively), falls towards the higher end of the global death undercounting factor of 3.3 (95% CI: 2.1–4) estimated by The Economist (as of May 2021) (The Economist, 2021). This indicates that the extent of death underreporting, as it pertains to SARS-CoV-2, remains particularly acute for India as compared to that globally.
Why Death Matters?
From an economic perspective, why is it necessary to do these mortality calculations? Death matters because life matters—prolonging life is a goal, not merely a means to generate economic value. The widely used human development index (HDI) of the World Bank takes a multi-dimensional approach to measuring welfare. Material wellbeing (GDP) is only one of its three components; the others involve knowledge (literacy rate) and life (life expectancy at birth).
Nevertheless, for the purpose of cost–benefit analysis and economic evaluation of public health measures, it is useful to be able to assign a monetary value to every life lost or saved. Measuring the value of a life by lost earnings or productivity is deeply flawed—it would, for example, have the absurd implication that the lives of non-working individuals have no value at all. The most commonly used approach to estimating the value of a statistical life (VSL) adopts the revealed preference or willingness-to-pay (WTP) principle. Hedonic wage regressions estimate the compensating differential (Thaler & Rosen, 1976) in market wages for jobs that involve a higher probability of fatal accidents—a measure of how much income the average worker is willing to sacrifice in order to reduce mortality risk. Sacrificed earnings are then aggregated over the lifetime using present discounted values and scaled up to a probability of 1 to arrive at VSL.
There are several estimates of VSL from developed countries, 1 but studies on developing countries, including India, are few and far between. For our purposes, we used Majumder and Madheswaran (2018), who estimated VSL for an average male industrial worker in India to be ₹44.69 million (US$0.61 million at current exchange rates). 2 This may introduce upward as well as downward biases into our calculations. For example, people dying of COVID-19 are, on average, older than the industrial workforce, which implies the mortality cost presented below is an overestimate. On the other hand, wages are only one part of a worker’s economic contribution. A proper accounting of the social value of a life must also account for profits, rents and consumers’ surplus generated by the economic activity of that individual, as well as non-pecuniary benefits conferred on relatives, friends and acquaintances. These are not reflected in private WTP and are therefore a source of underestimating VSL. The calculations presented below are ballpark figures that will reflect reality closely if the above-mentioned biases largely cancel each other out.
Summary of Economic Cost Estimates Attributed to SARS-CoV-2 Death Toll in India, as of June 2021.
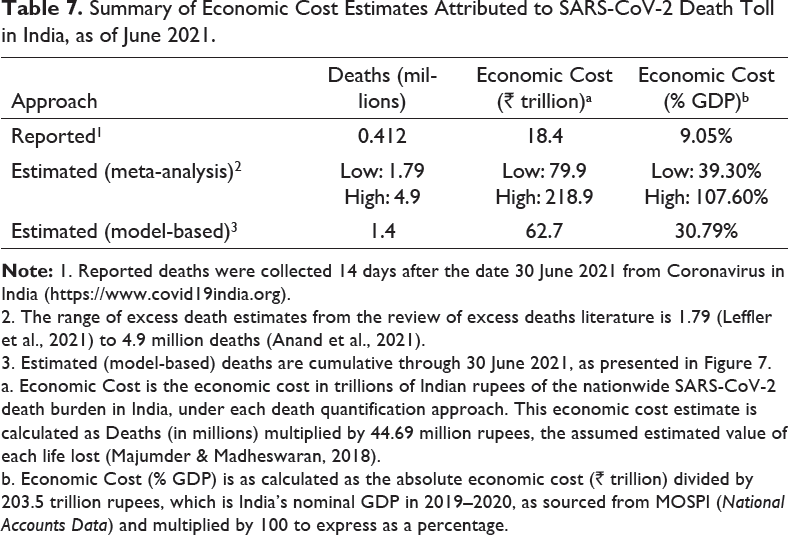
2. The range of excess death estimates from the review of excess deaths literature is 1.79 (Leffler et al., 2021) to 4.9 million deaths (Anand et al., 2021).
3. Estimated (model-based) deaths are cumulative through 30 June 2021, as presented in Figure 7.
a. Economic Cost is the economic cost in trillions of Indian rupees of the nationwide SARS-CoV-2 death burden in India, under each death quantification approach. This economic cost estimate is calculated as Deaths (in millions) multiplied by 44.69 million rupees, the assumed estimated value of each life lost (Majumder & Madheswaran, 2018).
b. Economic Cost (% GDP) is as calculated as the absolute economic cost (₹ trillion) divided by 203.5 trillion rupees, which is India’s nominal GDP in 2019–2020, as sourced from MOSPI (National Accounts Data) and multiplied by 100 to express as a percentage.
Other than national estimates of mortality and IFR, there is considerable value to measuring infections and deaths across gender, caste, income levels, regions, etc. These can be useful guides for policymakers, telling them where scarce healthcare resources and aid should be concentrated. The within-country heterogeneity in both the epidemiological and economic impact of the virus has been noted in studies from all parts of the world. Unfortunately, the absence of disaggregated data has tied the hands of researchers in India. Nevertheless, our meta-analysis uncovers substantial regional variations in IFR2, from a low of 0.191%–0.205% in the South to a high of 0.477% in the North. These differences are plausibly created by socio-economic factors (e.g., differences in the quality of governance and healthcare) rather than biological ones and provide policymakers the information necessary for welfare arbitrage and efficient resource allocation.
In closing, premature mortality is not only an indicator of health, but also of economic cost and productivity, as discussed above and as has been evidenced for other health conditions in India (Pearce et al., 2018). Furthermore, unforeseen death within a family or community may disturb the livelihood and income generation structure, thereby pervading the broader welfare of impacted individuals, although reverse causation may be present (Saikia & Ram, 2010). Apart from the health lens, premature mortality and infectious disease mortality’s consequences for economic stability and ensuing welfare policy further support the need for continued attention to assessing the mortality burden of COVID-19 within India.
Supplemental Material
Supplemental material for this article is available online.
Supplemental Material for SARS-CoV-2 Infection Fatality Rates in India: Systematic Review, Meta-analysis and Model-based Estimation by Lauren Zimmermann, Subarna Bhattacharya, Soumik Purkayastha, Ritoban Kundu, Ritwik Bhaduri, Parikshit Ghosh and Bhramar Mukherjee, in Studies in Microeconomics
Footnotes
Acknowledgements
The authors thank the librarians from the University of Michigan Taubman Health Sciences Library for their instruction on developing the search strategy for this systematic review.
Author Contributions
Declaration of Conflicting Interests
Funding
The authors disclosed receipt of the following financial support for the research, authorship and/or publication of this article: The research was sponsored by funding from the University of Michigan School of Public Health and Center for Precision Health Data Science.
Notes
References
Supplementary Material
Please find the following supplemental material available below.
For Open Access articles published under a Creative Commons License, all supplemental material carries the same license as the article it is associated with.
For non-Open Access articles published, all supplemental material carries a non-exclusive license, and permission requests for re-use of supplemental material or any part of supplemental material shall be sent directly to the copyright owner as specified in the copyright notice associated with the article.