
Abstract
Conventional sampling methodologies for citizens/households in urban research in India are constrained due to the lack of readily available, reliable sampling frames. Voter lists, for example, are riddled with errors and, as such may not be able to provide a robust sampling frame from which a representative sample can be drawn. The Jana–Brown Citizenship Index project consortium (Janaagraha, India; Brown University, USA) has conceptualized a unique research design that provides an alternative way on how to identify, categorize and sample households (and citizens within) in a city in a representative and meaningful way. The consortium consists of the Janaagraha Centre for Citizenship and Democracy, based in India, and the Brown Center for Contemporary South Asia, part of Brown University, USA. The methodology was designed to enable systematic data collection from citizens and households on aspects of citizenship, infrastructure and service delivery across different demographic sections of society. The article describes how (a) data on communities that are in the minority, such as Muslims, scheduled castes (SC) and scheduled tribes (ST), were used to categorize Polling Parts to allow for stratified random sampling using these strata, (b) geospatial tools such as QGIS and Google Earth were used to create base maps aligning to the established Polling Part unit, (c) the resulting maps were used to create listings of buildings, (d) how housing type categorizations were created (based on the structure/construction material/amenities, etc.) and comprised part of the building listing process, and (e) how the listings were used for sampling and to create population weights where necessary. This article describes these methodological approaches in the context of the project while highlighting advantages and challenges in application to urban research in India more generally.
Background
One of the most significant challenges that India faces in the twenty-first century is the governance of its cities. Primarily rural thus far, India will be increasingly urban in the coming years and decades. Cities are, moreover, centres of innovation, opportunity and growth. But their full potential can only be achieved if they are well governed. In any democracy, and especially in one as diverse as India’s, the quality of governance is inextricably tied to the quality of citizenship. With this problem in mind, Janaagraha Centre for Citizenship and Democracy (Janaagraha) and the Brown Center for Contemporary South Asia, at Brown University, USA, formed a partnership in 2011 and developed a research project exploring urban governance and citizenship. The project aims to gather systematic and robust data on the relationship between citizenship, basic services and infrastructure delivery in 17 cities across India.
The project methodology includes focus groups, key respondent interviews, and a large and comprehensive household survey in each city. Approaches in the methodology of the latter are the focus of this article. The methodological approach focuses on the systematic identification, categorization and sampling of households (and citizens within) in a city in such a way that helps in achieving a representative coverage of traditionally undercounted, informal settlements (slums) and groups which form a smaller proportion of the total city population (e.g., scheduled castes, scheduled tribes and Muslim citizens). So far, surveys have been administered in ten cities and analysed in eight 2 while preparations are underway for fieldwork in another seven 3 cities. The sample size in each city varies from 1,000 to 4,000, depending on the population size of the city.
Difficulties in Undertaking Urban Research
There is a growing consensus in the research community that conducting urban research in India is a challenge for multiple reasons. First and foremost, Panman (2019) argues that it becomes particularly challenging to research cities because there is no clear consensus on what we call ‘urban’ in the Global South. For example, there are two well-established, different definitions of ‘urban’ in India. One is the ‘administrative definition’, and the other is the ‘Census’ definition. According to the administrative definition, the default classification of a settlement is rural, and it becomes urban only if the state government converts it through requisite legal processes, including notification (Tandel et al., 2016). The second pertains to the Census definition of urban. Here, ‘urban’ includes all places with a municipality, corporation, cantonment board or notified town area committee. Additionally, the definition consists of all other places with at least 5,000 inhabitants, at least 400 people per square km, and at least 75% of the male main working population engaged in non-agricultural pursuits (Census of India, 2011). Thus, the administrative definition of urban is a subset of the census definition (Tandel et al., 2016).
The non-standardization of political and administrative boundaries in Indian cities adds an extra layer of complexity. When considering a study of governance, citizenship and service delivery, for example, it is desirable to orient sampling frames around particular boundaries of governance and administration to ensure coverage of citizens/households being served by the different units. However, urban local bodies, civic agencies and others use different geographic ways to split up the same city. For example, in Bengaluru, the urban local body (The Bruhat Bengaluru Mahanagara Palike, BBMP) divides the city into 198 wards, the electricity supply agency (Bangalore Electricity Supply Company Limited, BESCOM) divides the city into four zones and nine circles, 4 while the Bengaluru City Police has 108 police stations, and each station’s jurisdiction is divided into beats. There is no clear overlap in all these different break-ups.
Even when an area has been defined or selected as an anchor for sampling, finding reliable base sampling frames to draw a representative sample of citizens or households is another challenge. While citizen and household data on voter lists (given at the Polling Part unit) are publicly available and have been used for different research studies as sampling frames, there is a growing body of evidence to suggest the use of this data is limited in the urban context. A series of studies by Janaagraha highlights extensive quality issues with data on urban voter lists. For example, in Delhi (Janaagraha, 2015), 49% of citizens spoken to on the field were omitted from the voter list from the Polling Part where they were living, while 23% of citizens on the voter list were found to have shifted from their listed address, were disenfranchised, deceased or listed more than once. Likewise, an ID Insight working paper by Joshi et al. (2020) notes that voter lists may be more suitable as sampling frames in rural areas than urban ones. The informal nature of many settlements in urban India, as well as rapid urbanization and greater transience of citizens, may be contributing to this. In addition, a comprehensive voter list management study across 21 cities in India (Janaagraha, 2017) notes systemic issues with voter list management, including difficulties contacting Booth Level Officers (BLOs), who help citizens register/make amends to their listing, as well as training and resource gaps for BLOs and poor spatial information on geographic layouts of Polling Parts.
Another example of inaccuracies in sampling frames is those drawn from national databases like the Census, as highlighted by Panman (2019). These tend to get old given their infrequent occurrence. Particularly in light of cities which are growing very quickly, she notes that large areas are likely to be left out of the frame and therefore do not capture the accurate picture of the city.
Pooling in other data sources to make sampling frames, when they have been selected, more meaningful also poses challenges. To avoid systematic under-counting of certain informal settlements or to ensure coverage of groups of citizens who make up only a small proportion of the total population (e.g., scheduled tribes), or to identify other characteristics, it can be beneficial to pool other data sources to help with sampling decisions. However, different data sources use different units of data collection; likely as a result of the points noted above, that selecting areas for anchoring sampling frames is in itself a complex process. There is little room for a standardized approach and it is not always easy to recognize and attribute data to different administrative zones. For example, the lowest geographical unit at which the Census publishes information is the ward level. This may be hard to translate to a police zone if your survey required it. Speaking to a similar point, the way different data sources define particular characteristics will also impact sampling. For example, the Census of India categorizes slums into three categories: (a) notified slums, (b) recognized slums and (c) identified slums. The notified slums are the areas in a town or city notified as ‘Slum’ by the State, UT Administration or Local Government under any act including a ‘Slum Act’. The recognized slums on the other hand are areas that are merely recognized as slums and are not formally notified under any act. Identified slums are a compact area of at least 300 population or about 60–70 households of poorly built congested tenements, in an unhygienic environment usually with inadequate infrastructure and lacking in proper sanitary and drinking water facilities. These areas are identified personally by the Charge Officer (Census of India, 2011). The National Sample Survey, however, defines slums as a cluster of 20 or more households/tenements that are ‘poorly built, mostly temporary in nature, crowded together usually with inadequate sanitary and drinking water facilities in unhygienic conditions’ (NSSO, 2001), which is different from the Census.
Methodological Approach for the Jana–Brown Citizenship Index Project
For the purposes of the household surveys in the Jana–Brown Citizenship Index project, the Polling Part unit was chosen as the sampling frame anchor. Notwithstanding the fact that the project itself looks at aspects of service delivery which are administered in many geographical units as described earlier, Polling Parts are the smallest unit of administration and are identified and defined in all cities using the same methodology by the Election Commission of India. Furthermore, they can to some extent be geographically identified through information and maps on the electoral lists or landmarks within them like a polling station. It should be clarified that the Polling Part was used as an anchor for our sampling frames, but citizen information (like names/addresses/age) were not used from the voter list in our process. Instead, what follows below outlines the approach taken that while anchored to the Polling Part does not use the personal details on the list. Nonetheless, it allows for the systematic identification, categorization, and sampling of households (and citizens within) in a city in such a way that there is representative coverage of traditionally undercounted, informal settlements and groups which form a smaller proportion of the total city population (e.g., scheduled castes, scheduled tribes, and Muslim citizens). The approach additionally allows for the geospatial capture of settlement types.
Ensuring Accurate Representation of Communities that Are in the Minority such as Muslims, Scheduled Castes, and Scheduled Tribes, in a City Sample through a Stratified Sampling of Polling Parts
As per the sampling design for this project, in each city, Polling Parts were sampled first. These Polling Parts were then used to create the sampling frames to eventually sample households/citizens in each city. While the Polling Part unit was selected as the sampling frame anchor, this section addresses how these Polling Parts were selected to ensure adequate coverage in the sample of traditionally undercounted settlements and citizens. This includes informal settlements and groups of citizens which form a smaller proportion of the total city population and may be missed/under-counted through simple, random sampling of Polling Parts. In essence, scheduled castes, scheduled tribes, slum dwellers and Muslims for the purposes of this project. These population categories tend to be segregated from the mainstream and remain in clusters (Susewind, 2017) and conventional sampling frames tend to miss out on capturing them adequately. Representation from these minority communities in the project samples was imperative, however, as they are generally at the bottom when it comes to quality of citizenship and access to basic services. Multiple studies have shown that there exists residential segregation by caste and much higher segregation in terms of access to basic services (Sidhwani, 2015).
The approach taken was to stratify the sample by scheduled caste and scheduled tribe citizens and Muslims though not explicitly by socio-economic class. However, there are several studies such as by Ahmad (2012) and Chandran (2018) that highlight how growing urbanization in India is resulting in minorities and scheduled castes and tribes getting pushed to the margins of cities with living conditions that are poorer than the mainstream population and hence the coverage of citizens from lower socio-economic classes was also expected in this approach. Thus, to capture scheduled castes and tribes and Muslim citizens in the sample (but in a non-biased way), a process was applied of identifying Polling Parts that are dominated by these citizens and could then be sampled in a stratified, random manner.
Stratified simple random sampling helps in categorizing the total population parts into meaningful categories or strata and ensures that the final sample has representation from each stratum of the population in a systematic and non-biased way. For the purposes of this study, the total number of Polling Parts were divided uniquely into four different strata or groups as defined by a ‘2 × 2’ matrix as shown in Table 1.
Demographic Strata Curated as per the Project’s Research Design.
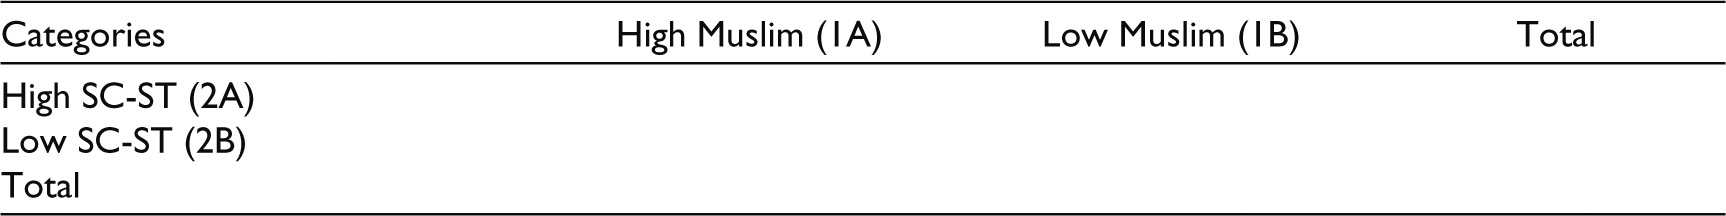
Each cell of this matrix should consist uniquely of the number of Polling Parts that capture the combination of population demographics of interest. For example, cell ‘1A-2A’ consists of Polling Parts that are both SC-ST and Muslim-dominated in terms of population. Cell ‘2A-1B’ consists of the total number of Polling Parts that are SC-ST population dominated but not Muslim-dominated. This way the total number of Polling Parts in a city is uniquely placed in each stratum of the matrix.
To divide the Polling Parts into the above-mentioned four unique categories, the proportion of citizens belonging to the SC-ST and Muslim populations in each Polling Part is needed. However, the population for the above-mentioned categories is not published anywhere at the level of Polling Parts. The lowest geographical unit at which the Census publishes information on the SC and ST population categories is the ‘ward’ level. In addition, the Census does not publish population data by religious categories at anything lower than the city level. However, to finish the above matrix for each city, the data for all four population demographics represented by the cells of the matrix needs to be matched at one common geographical unit.
Given the unavailability of the necessary data (SC-ST, Muslim population) at the Polling Part level, categorization was done at the ward level and all Polling Parts in that ward were categorized accordingly since Polling Parts are geographical subsections of wards. For example, if Ward 01 is identified as a high SC/ST-low Muslim, all Polling Parts in Ward 01 fall into the high SC/ST-low Muslim cell. Given below are the steps followed to do this.
Step 1: Identifying the SC-ST-Dominated Wards
The SC-ST population for each ward was taken from the city-level primary census abstract, 2011 Census. As a next step, the SC-ST population proportion to the total ward population was calculated. The wards were then classified into quartiles based on the proportion of the SC-ST population in each ward. As a final step, all wards whose SC-ST proportion is equal to or exceeds the third quartile were classified as high SC-ST wards, and those wards that fall below the third quartile were the low SC-ST wards. However, there were instances where it was not possible to use this method to identify the SC-ST dominated wards because the census was done in 2011 and the cities had delimited their wards at least once, due to elections since 2011 such as in Bhopal, Ajmer and Jalandhar. For these cities, the information from SC and ST proportions from the census could not be used as the number of wards listed in the census and those that existed during the survey did not match. In this case, we used the information on the wards that were reserved for SCs and STs in the recent local elections that took place. The information was sourced from the respective municipal corporations.
Step 2: Identifying Muslim-Dominated Wards
As mentioned above, population data on religious composition is unavailable at any unit lower than the city level. While some research studies have relied on identifying Muslim areas by looking at Muslim names on the voter list, as outlined above, the accuracy of citizen information on voter lists is limited. Across the life cycle of this project, different methodologies were used to identify Muslim-dominated wards:
According to Janaagraha’s own (2014) study in Bengaluru, ‘a proxy variable for “Muslim population density” was created by identifying all mosques, Urdu medium schools, and Muslim burial grounds in Bengaluru city through a Boolean internet search and a Google Map search and subsequently locating each mosque spatially on Polling Part maps. Second, a buffer zone was outlined with a radius of 1000 m around each mosque (a ‘Muslim zone’) for all Polling Parts. This buffer zone was a marker of the likelihood of a greater density of the Muslim population. Third, we computed the proportion of area that is Muslim zone in each Polling Part by dividing the Muslim zone buffer zone areas by the total Polling Part area. Importantly, if ‘Muslim Zone’ buffer zones overlapped, that is, there were several mosques in close proximity and thus the 1000-m radii overlay, this area was counted uniquely for each of the overlapping buffer zones. Fourth, we computed the average Muslim zone area within each ward, that is, we summed all Muslim zone areas within a ward and divided the total Muslim zone area by the number of Polling Parts in a ward. Finally, we applied the decision rule that if the average area was equal to or exceeded 50%, the ward was classified as a ‘Muslim ward’ (p. 10)’. Due to the time and resource intensity of this exercise in Bengaluru, in 2017 and 2019, when 10 more cities
5
were studied, local knowledge
6
was used following a standard process. In each city, the city municipal commissioners and revenue officers were visited with the relevant city’s ward map. They were then asked to mark the wards which according to them are Muslim-dominated. Wherever possible, the same process was then followed with cities’ other key respondents such as Muslim-elected corporators or other civil society practitioners to double-check and cross- verify the information. This way, wards that were ‘High-Muslim’ or ‘Low-Muslim’ were identified in each city. In 2021, due to the COVID-19 pandemic, travel to meet the relevant stakeholders was not possible, so for the pending seven cities,
7
a revised version of the Bengaluru methodology was applied using spatial tools such as QGIS and Google Earth. The latest ward shapefiles
8
of the project cities were identified. By superimposing a ward shape file of a city on a Google Earth platform it was possible to clearly see how each city is divided and which streets, main institutions, buildings, parks and households come under each city ward. Using this information, the project team manually counted three types of Muslim institutions (Mosques, graveyards and Madrasas) in each ward in each city. Once the numbers were documented, using the third quartile rule, wards with the number of Muslim institutions equal to or more than the third quartile value were considered Muslim dominated.
Step 3: Creating the 2 × 2 Matrix of Wards by Religious and Caste Composition for Each City
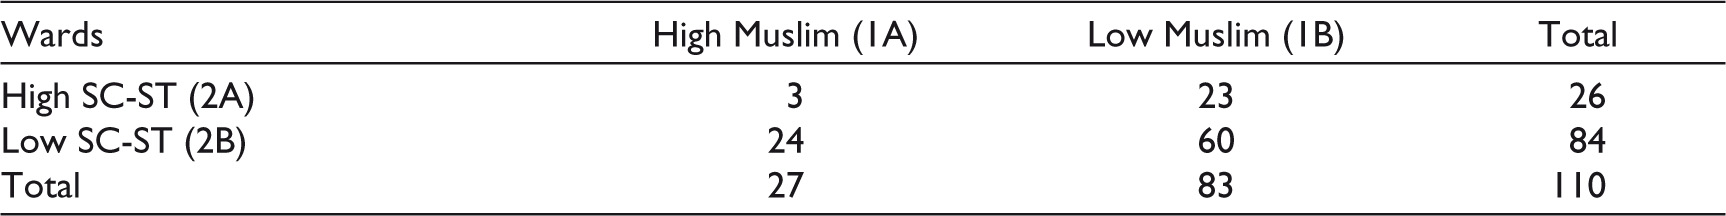
Using the list of wards categorized as high/low-SC and ST or high/low Muslim, the next step was to categorize the wards uniquely in a 2 × 2 grid. Table 2 shows an example of the matrix that was created for the city of Lucknow. There are a total of 110 wards in the city of Lucknow.
Distribution of Wards in Different Demographic Groups—Lucknow.
Step 4: Matching the Wards with Polling Parts
To create a similar matrix at the Polling Part level, it is important to know how Polling Parts are matched to each electoral ward in a city. There are two ways of establishing this matching depending on the information available:
Since the electoral unit for municipal elections is a ward, each ward is divided into Polling Parts, and information on which Polling Parts sit within each ward is directly available from the state election commission website.
9
Sometimes the municipal-level electoral lists are not available in the public domain.
10
In that case, the information provided in the voter lists that are uploaded by the office of the Chief Election Officer (CEO) can be used. These voter lists are available for the Polling Parts that are matched to the state assembly constituencies (ACs) and not to the wards in the city as they are meant to be used for state elections. So as a first step, there is a need to work out which ACs fall within the city limits as defined by the urban local body of that city.
11
Then, the voter list for those ACs can be downloaded. In each urban voter list, on the first page itself, the Polling Part number is given in the top right corner and the ward number is given in the middle right. This way it is possible to match the ward numbers with the Polling Part numbers for cities where municipal-level electoral lists are not available.
Step 5: Creating the Matrix at the Polling Part Level for Each City
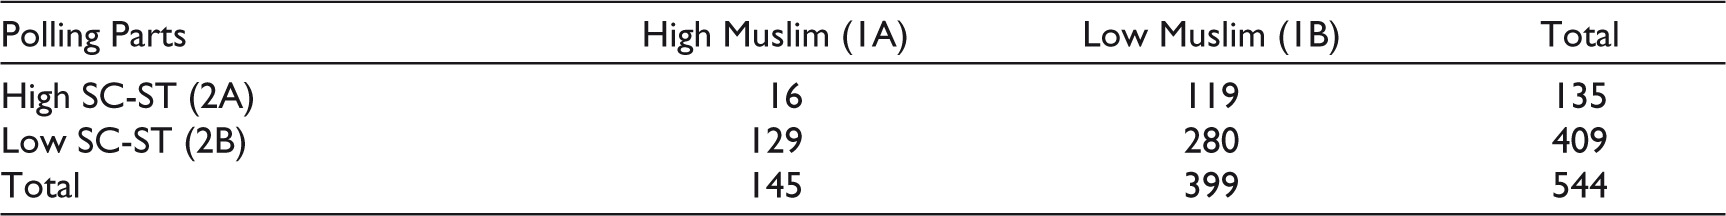
Now it is possible to create a similar matrix at the Polling Part level since, as mentioned earlier, as per the research design, all the Polling Parts that are matched to a ward of a particular cell of the ward 2 × 2 matrix, say, ‘high SC-ST, low Muslim’, are also categorized as such. For example, if there are four Polling Parts in ward number one of Lucknow, and this ward of Lucknow is categorized as ‘high SC-ST and low Muslim’ based on the information collected in the previous stage, all four Polling Parts would also be considered as ‘high-SC/ST and low-Muslim’. To continue the example of Lucknow, this way it was possible to distribute 544 Polling Parts of Lucknow uniquely into four cells of the 2 × 2 matrix as shown in Table 3.
Distribution of Polling Parts in Different Demographic Groups—Lucknow.
Step 6: Sampling Polling Parts in Each City
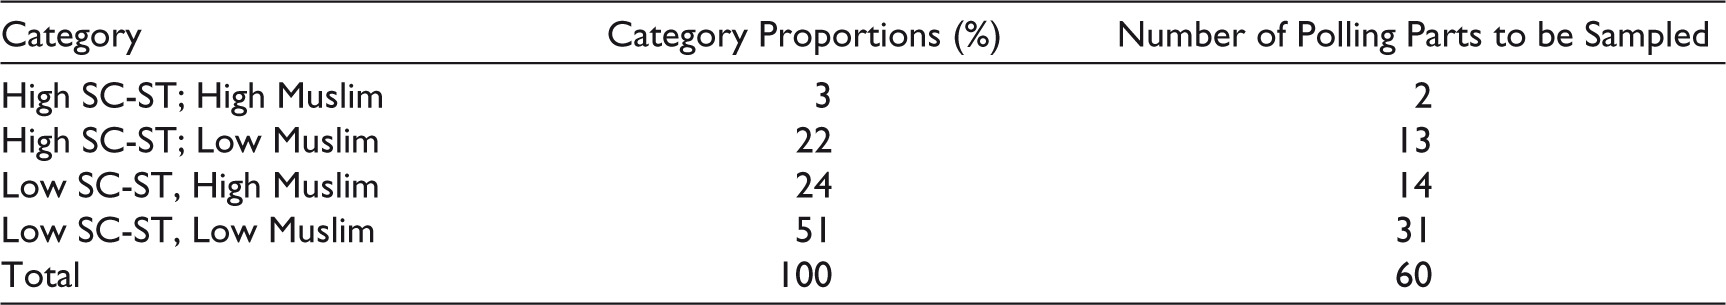
The final step was to sample the Polling Parts in each city in a stratified random way. Between 30 and 90 Polling Parts were sampled in each city on the basis of the population size. 12 For Lucknow, 60 Polling Parts had to be sampled and this was done from each cell of the matrix using a proportion-to-size approach. For example, cell ‘1A-2A’ has 16 Polling Parts and it is 3% of the total Polling Parts (544). Using the proportion-to-size approach, taking 3% of the total 60 Polling Parts means two Polling Parts were picked from the ‘high-SC/ST and high Muslim’ set of Polling Parts. Similarly, from each cell, Polling Parts were picked using the proportion-to-size approach in a random manner. Table 4 shows the number of Polling Parts sampled from each cell in Lucknow as an example.
Number of Polling Parts to be Sampled from Each Cell Based on the Proportion-to-Size Approach in Lucknow.
Creating a Sampling Frame to Sample Households
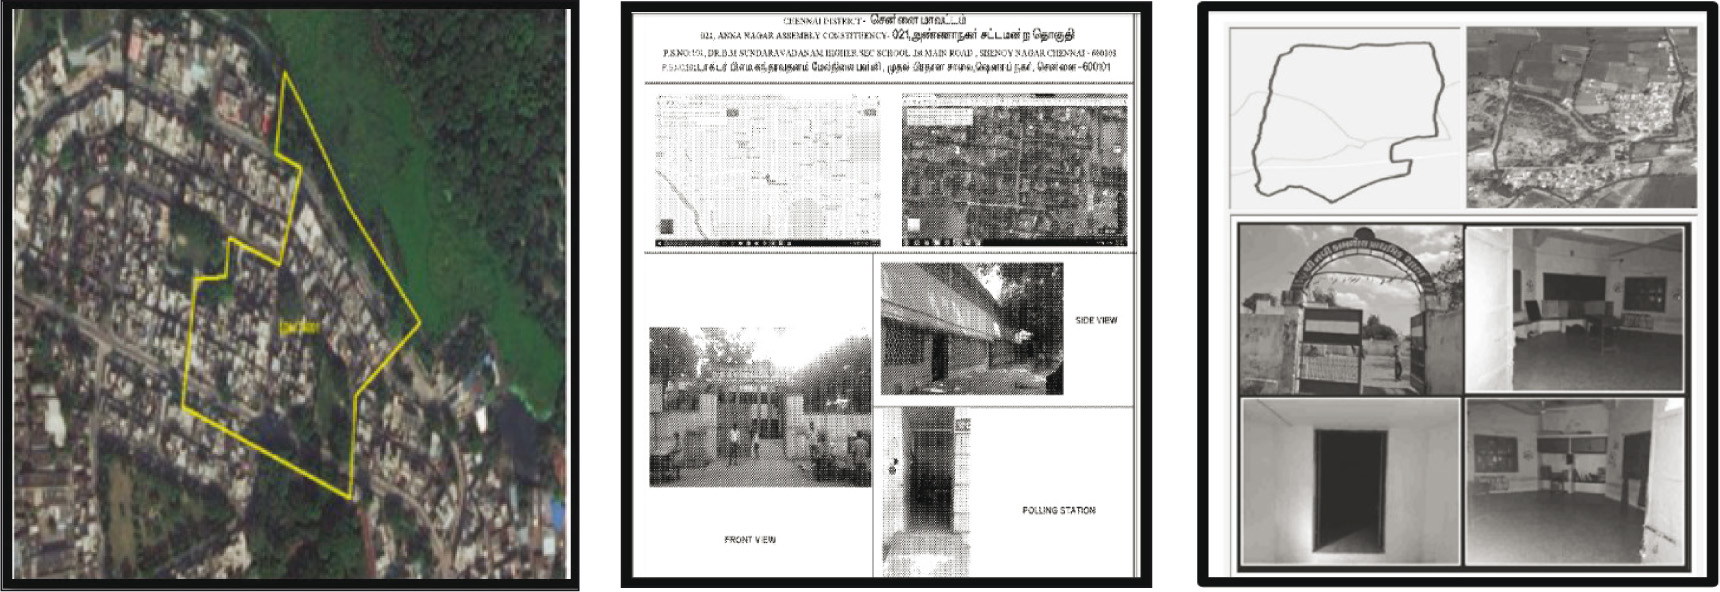
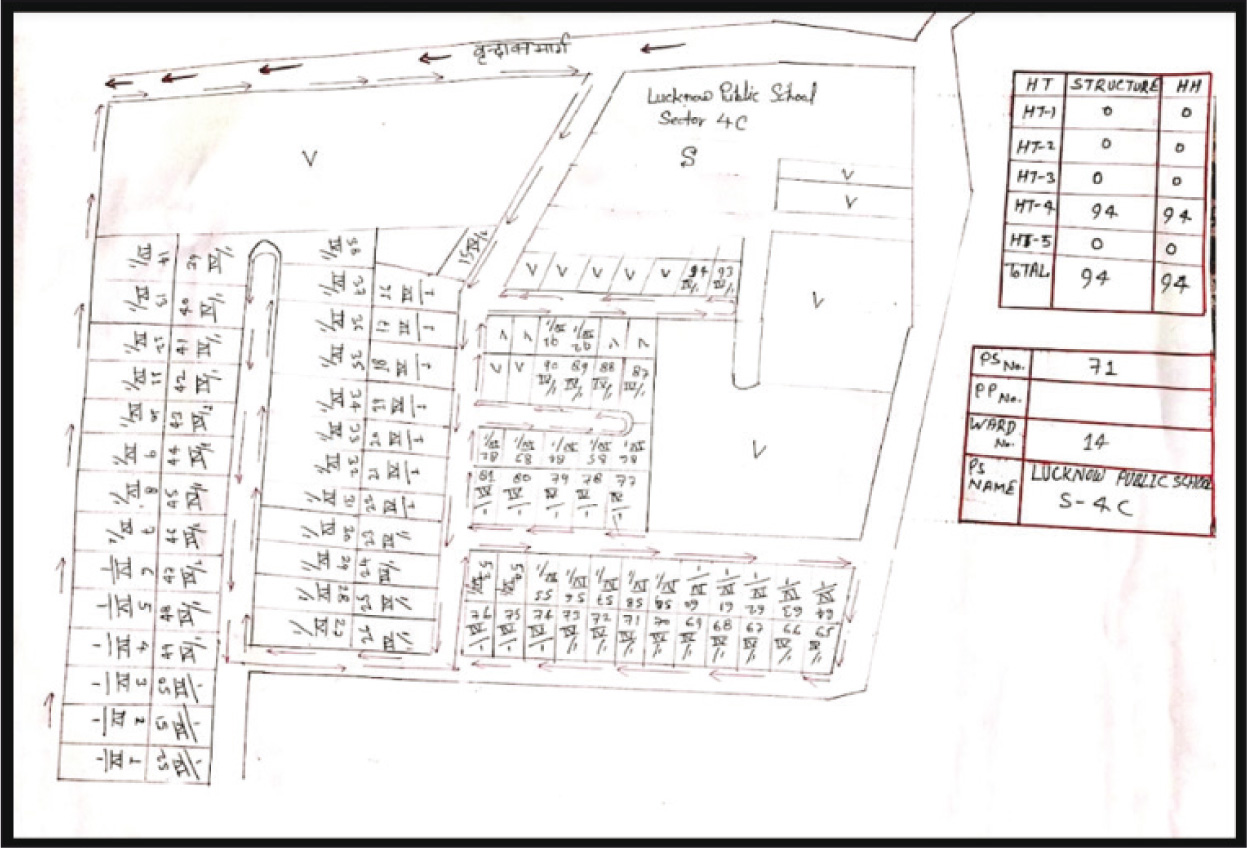
While anchoring our sampling on the Polling Part unit, citizen information on voter lists was not felt to be of sufficient quality to lend itself as a ready-made sampling frame. Instead, a listing approach (of buildings) was used, anchored on the Polling Part geographical unit. On the second page of each electoral list, a Polling Part map is meant to be provided. The Polling Part map is also called ‘Nazaria Naksha’, and it is meant to display the outer boundaries, inner streets and roads within which the constituents of a particular Polling Part reside.
As part of the listing process, ideally, the Polling Part map from each electoral list is taken and the boundaries and streets of Polling Parts are identified, following which a count of all non-commercial buildings is undertaken by street and each building is provided with a housing type tag. However, for the cities sampled in this project, the electoral maps were not of usable quality. Some were bad scans or did not show the outer boundaries clearly enough to allow for a listing process to be done with them. Figure 1 shows some images of the Polling Part maps and their limitations in use as sampling frames.
An alternate method was devised to create a proxy Polling Part map, using QGIS software. This was systematically applied to the sampled Polling Parts across cities. The steps used to create the maps are outlined below.
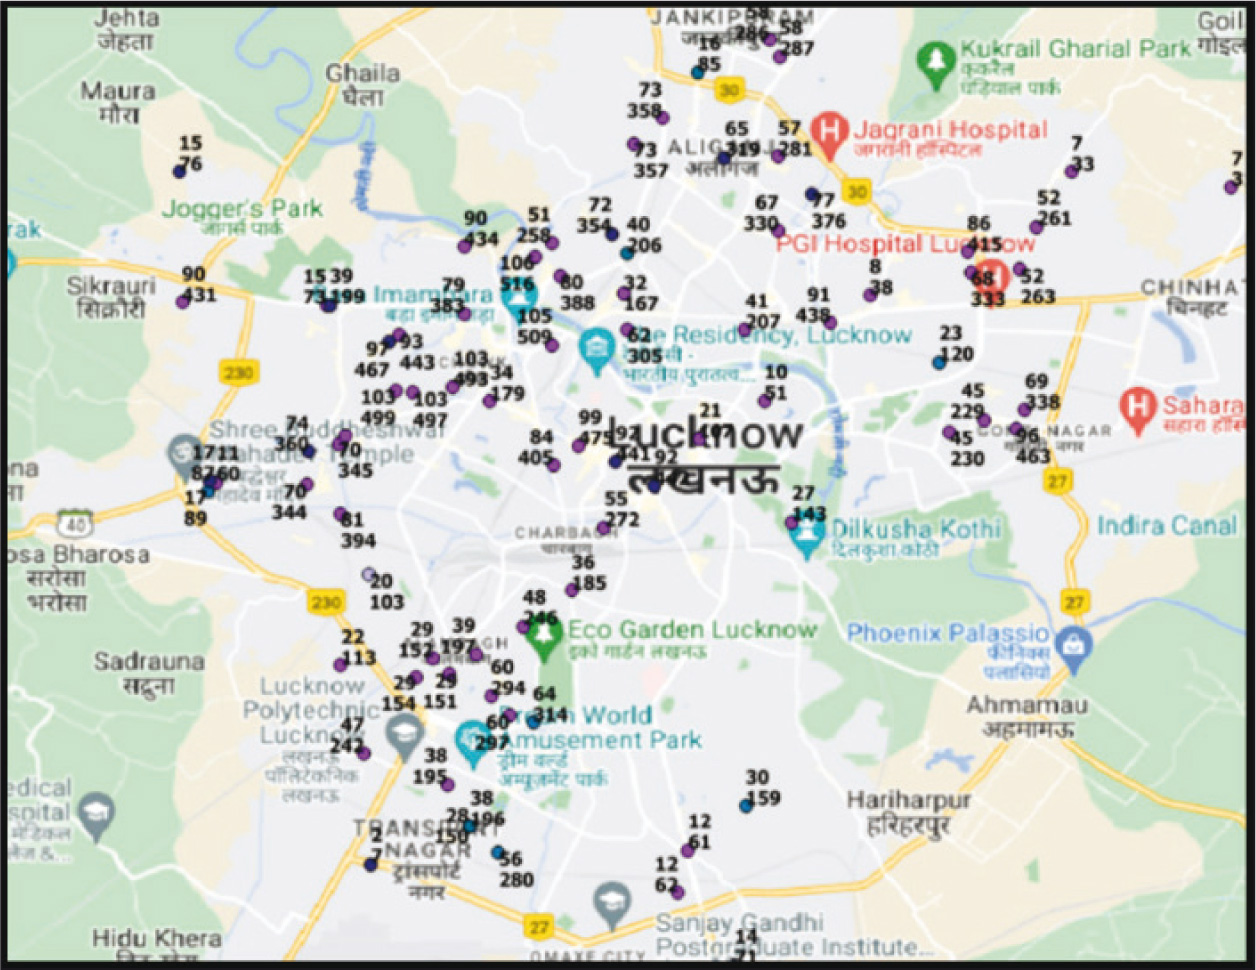
Step 1: Geo-tagging the Polling Stations on a Google Map and Uploading the Locations on QGIS Software
For each city, for the sampled Polling Parts, the addresses of the polling stations were collected. Each polling station was located on Google map and its latitude and longitudes were captured on an excel file. The excel file was then uploaded onto the QGIS software. Once the file is uploaded, the polling station locations show up as dots on the shape file for that city. Figure 2 is an example image of Lucknow polling stations.
Step 2: 100-Metre Radii Is Captured around Polling Stations.
A Polling Part generally covers 1,000–1,200 individuals and around 300 households. The proxy maps had to ensure the same. To that end, circles with different sized radii were drawn around the polling station centre to ascertain which would capture the right number of households and be the best proxy for the Polling Part. Circles with radii of 75 metres, 100 metres and 150 metres around each polling station were drawn. A pilot listing was done of these three different map sizes to ascertain the approximate number of households covered in each. Three different sized maps were piloted in three purposively selected locations in each city. It was found that the 100-metre radius sufficiently covered the required number of households and is consistent with the size of a Polling Part neighbourhood. Hence, a circle of 100-metre radius was then standardized across all cities. Once the circle was created, the shape file looked like the image given in Figure 3.
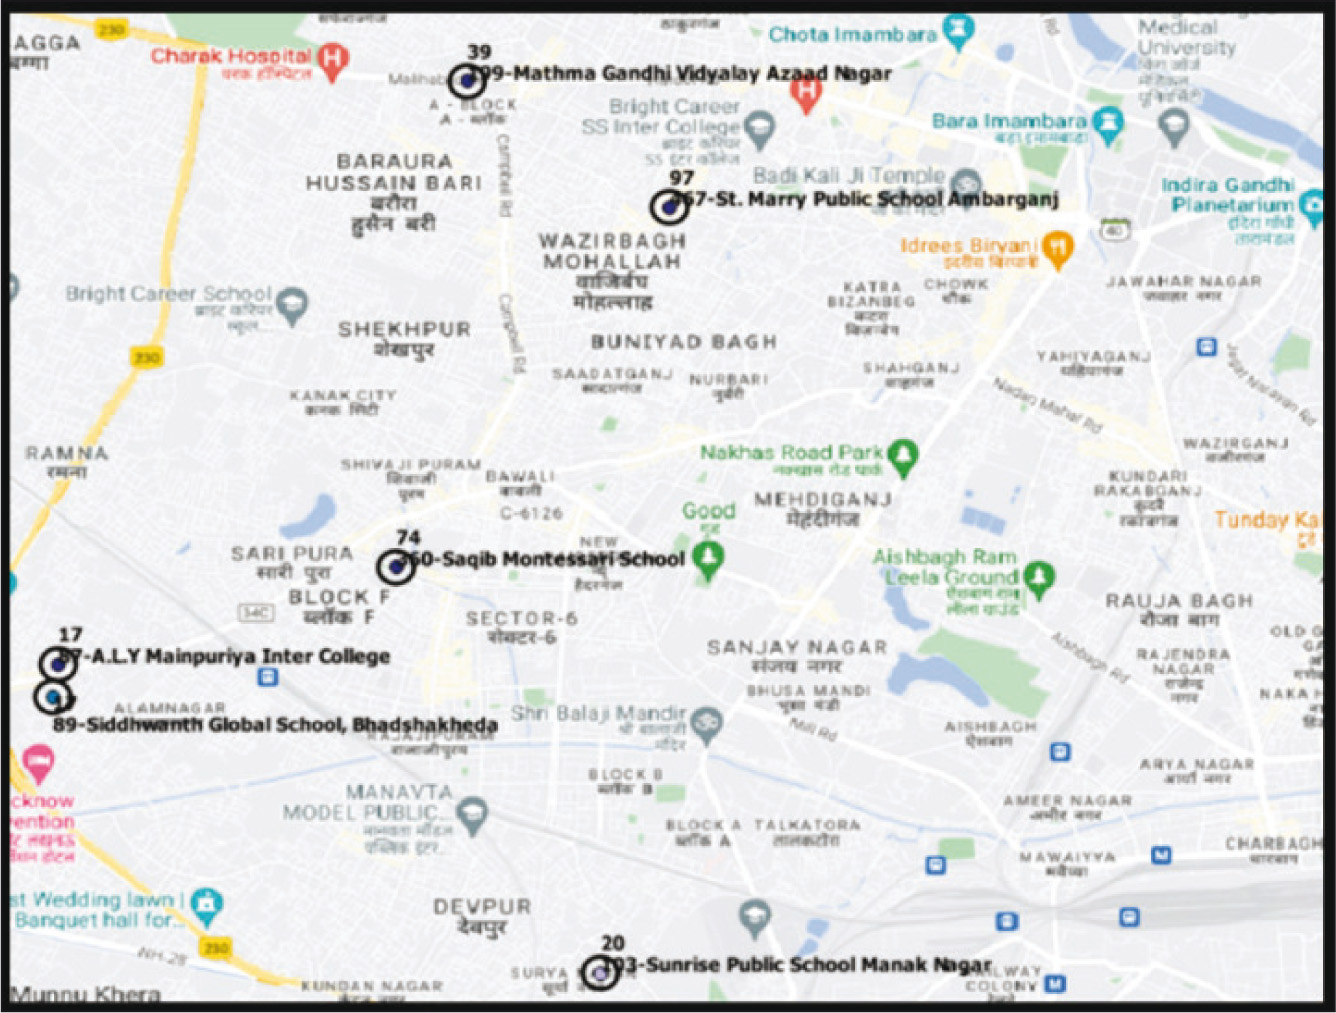
Step 3: Isolate each polling station circle separately and draw polygons to capture the outer streets
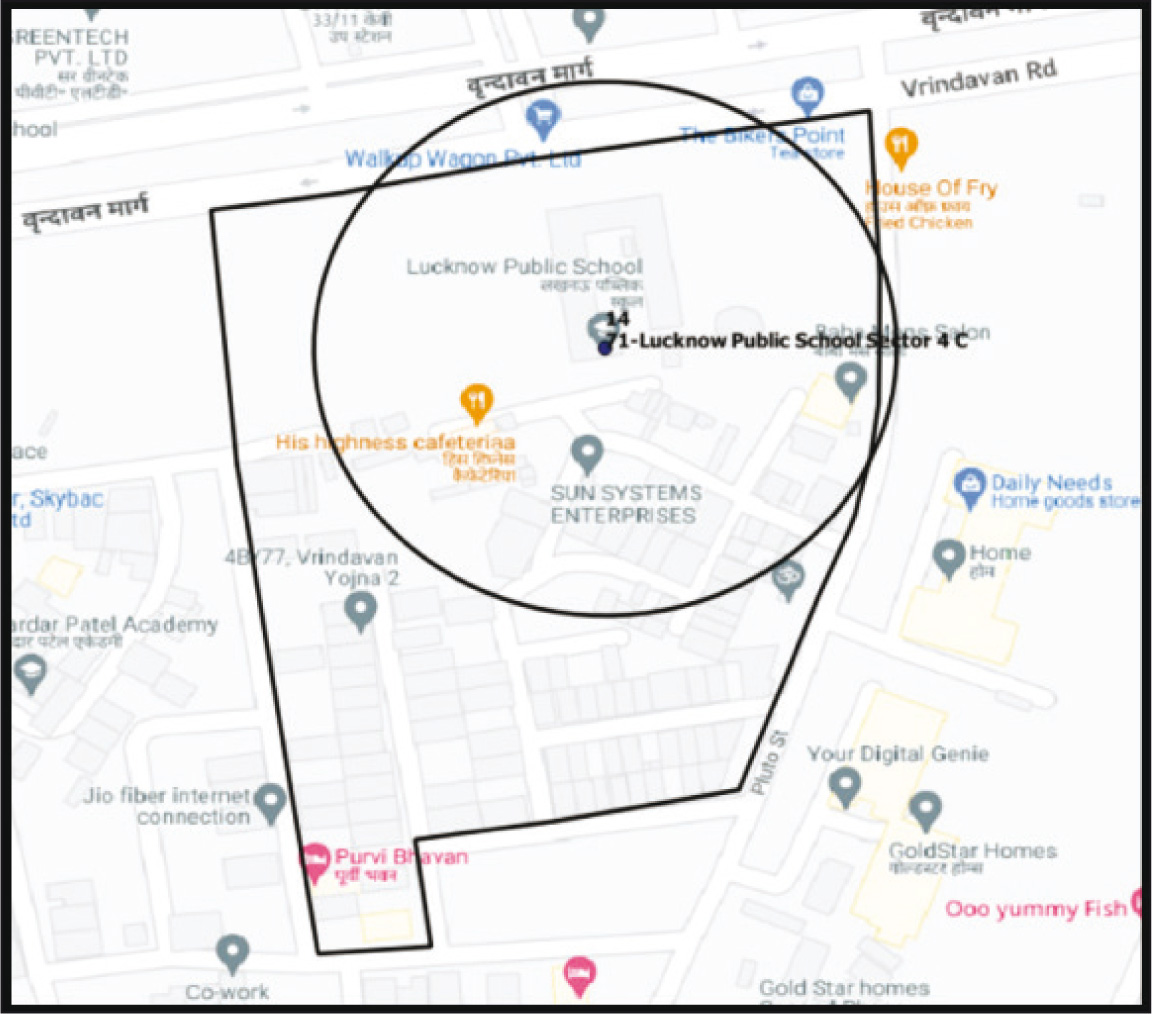
Once a circle with a radius of 100 metres was drawn around each polling station, the next step was to isolate each polling station circle separately and draw polygons around that circle to capture the outer streets/roads clearly. Capturing outer streets is especially important as this anchors the listing boundaries clearly and ensures maximum capture of buildings, something the circle cannot do. Polygons were formed by isolating the main roads closest to the circle edges (either inside or outside the circle). After drawing the polygons around the circles, the image would look like the example in Figure 4. The circle is also shown in this picture for reference.
Step 4: Building Listing
Once the street map was ready, using a random start location, the field team had to list all the buildings as per building type categories. Even though the process of creating a listing as a sampling frame is not new in the domain of sampling, having been used by national surveys such as the National Family and Health Surveys, 13 the parameters used to give each building a housing type tag were uniquely defined for this project. During the listing process, each building was independently identified as one of five types: (a) informal shack settlement, (b) informal slum housing, (c) lower-middle class, (d) upper-middle class and (f) upper class.
According to Janaagraha’s (2014) own study,
Conceptually, ‘Housing Type’ conveys a very different material dimension of the class than assets. Assets are for the most part procured on the market and directly reflect purchasing power, that is, income. Access to housing in India is driven by market forces but is also highly regulated and sometimes directly supplied by the state and also shaped by social networks. As such, in addition to disposable income, housing type will also reflect one’s location in both formal and informal networks of distribution, including access through state patronage, inherited position, strategic networks etc. In this sense, ‘housing type’ is a much noisier proxy for class but is also more likely to capture the actual dynamics of class practices in an Indian city. (p. 11)
The field team had to recognize those housing types 14 and plot them on the map. To decide on which household type tag would be applicable to what type of building, there was a pre-determined set of parameters based on factors such as construction material of the roof, construction material of the walls, overall quality of construction, number of rooms, the density of households, number of balconies, etc. 15 This process was a completely non-intrusive process as field staff were trained to just look at the outer structure of the buildings to determine the housing type category. 16
To start the listing process, a print copy of the satellite image along with the google street map of each Polling Part was shared with the field team. Using the right-hand rule (RHR), the team had to plot the building type along with the count of each type of building on top of the map. They also had to draw the same on a different sheet of paper to have more clarity. Figure 5 is an example of one of the listing maps. As can be seen, the street names are clearly mentioned along with the names of the outer roads. Each building is given a number and provided the housing type code. T5 stands for housing type 5, T4 stands for housing type 4 and so on. The serial number of the buildings from the starting point is mentioned in red. The arrows mark the path that the field investigator took to map the buildings. On the right-hand side, the total of each building/housing type is displayed. These maps then served as the sampling frames to sample the buildings where the surveys should take place. Where buildings had more than one household inside, using the right-hand rule, a household was selected. There was a random sampling of one adult per household to take the survey. The process of selecting a respondent within a household was systematic and similar to processes widely used in survey-based research. 17
Special Case: Mumbai Slums
More than 50% of Mumbai is in slums (Das et al., 2010). However, mapping the slum-dominated Polling Parts in Mumbai posed particular challenges. On Google Street View, the inside streets were not visible at all, and the satellite image only showed a cluster of roofs made of asbestos/aluminium sheets. Once the team visited such locations during pilots, they struggled to discern streets and boundaries since the paths were so convoluted and densely packed and there was often no clear way to tread nor map the buildings. Without a building listing, there was no sampling frame for these Polling Parts. It was therefore necessary to find a different way to randomly sample the households in these slum areas given mapping and listing of all the buildings and types was not possible. The following method was used to sample households in these slum locations.
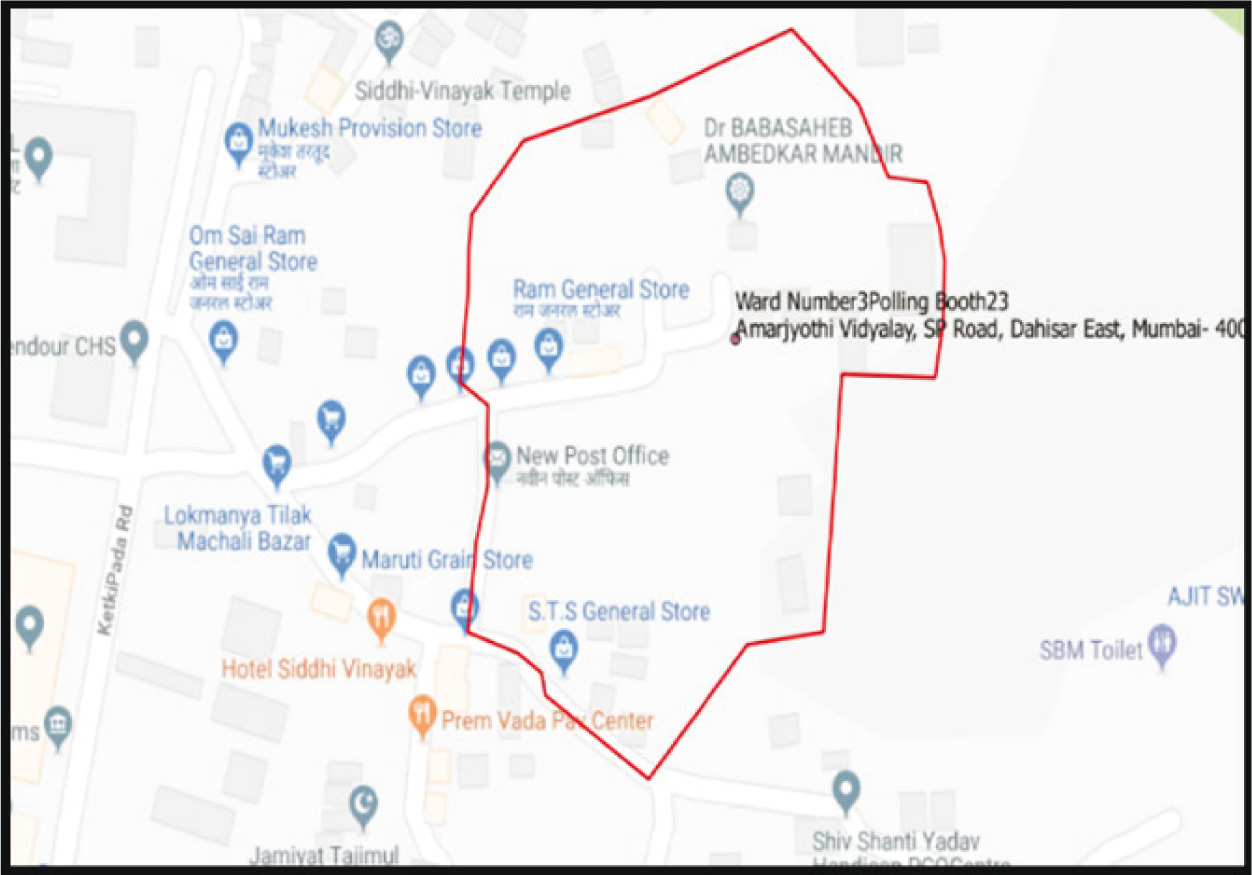
As a first step, the same method of creating an area map with a 100-metre radius and an overlaying polygon was used to create the base map. Figure 6 displays an example Google street image of a slum location in Mumbai while Figure 7 is the satellite image of the same slum location.
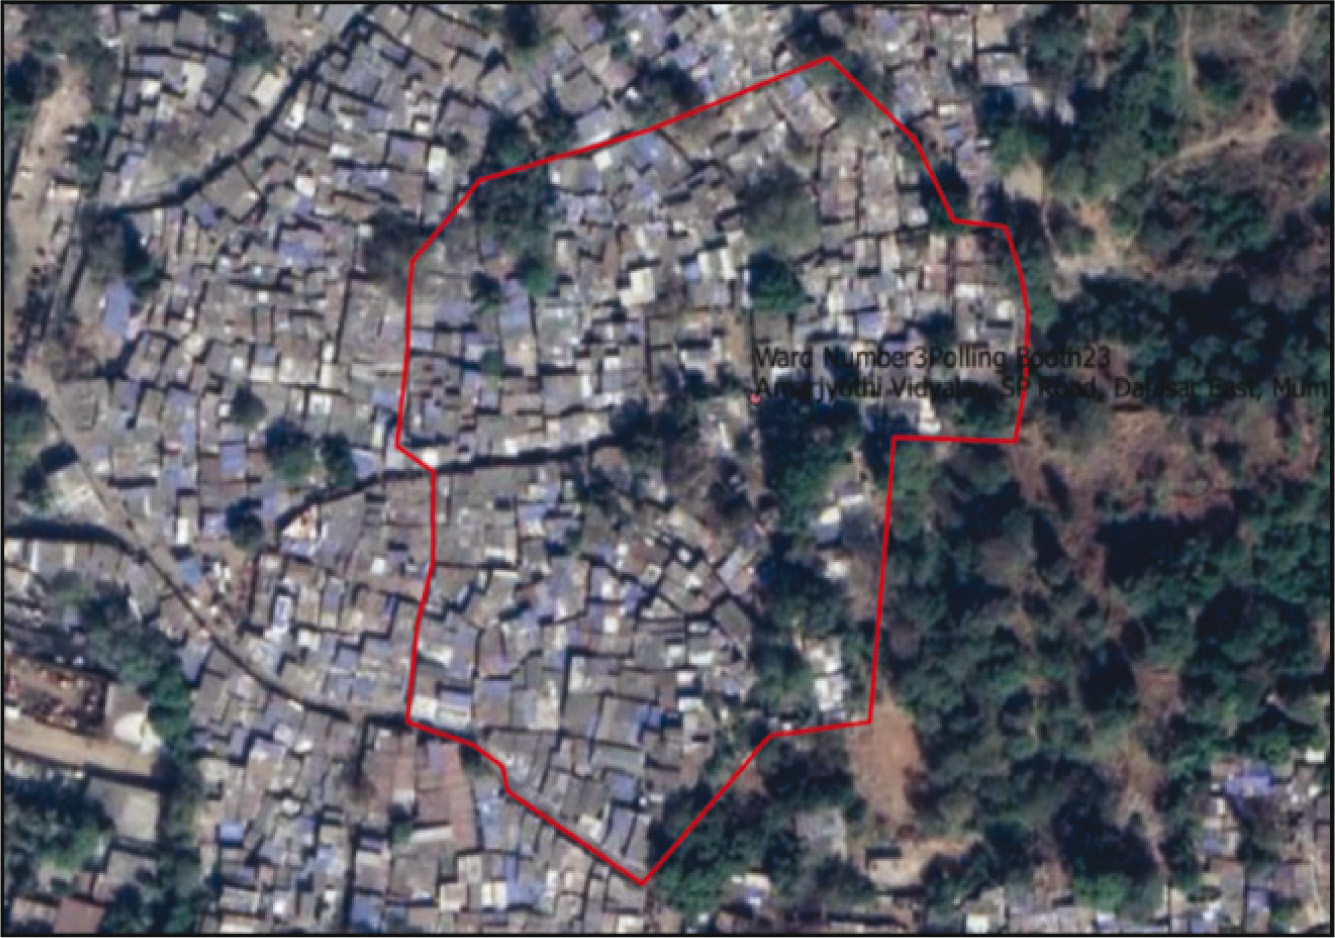
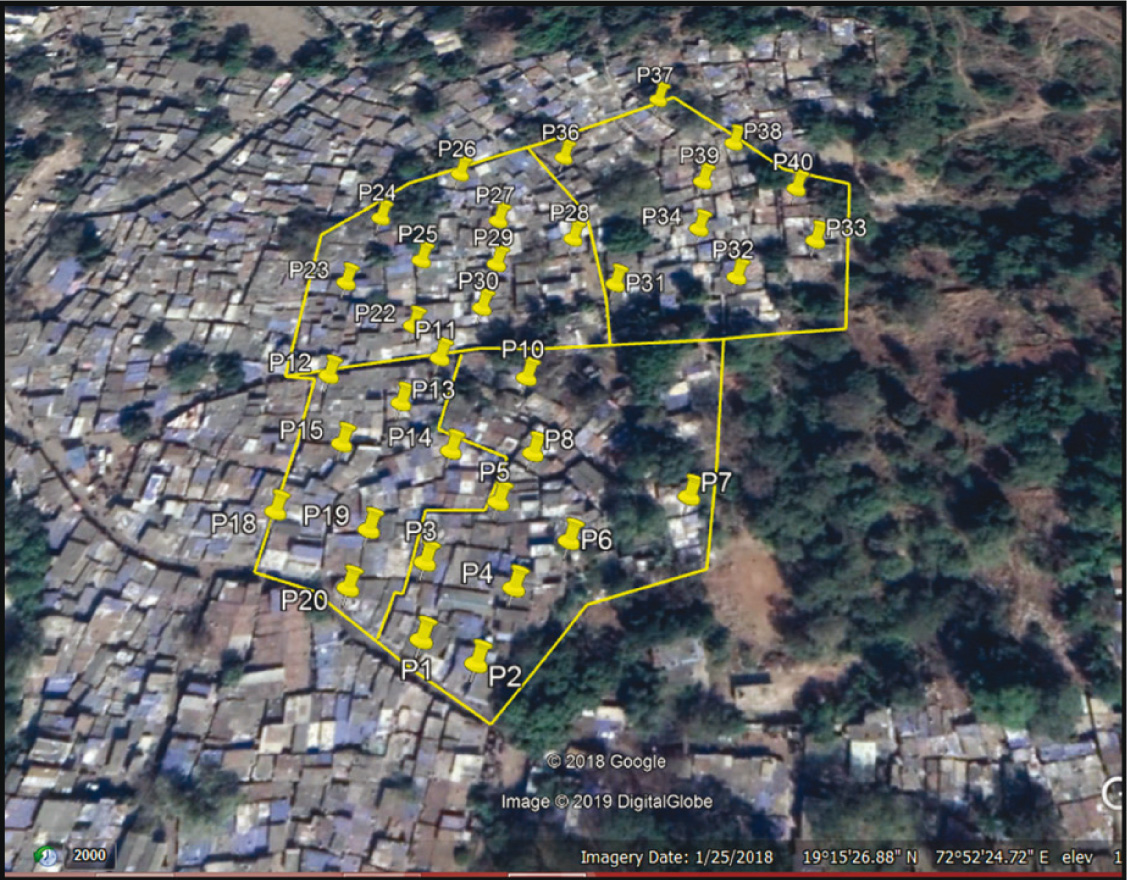
In these cases, a sampling frame was created by counting the roofs on the satellite image. The satellite image was divided into three or four equal parts depending on the size of the map. Once the map was divided into the required number of parts, the team randomly geo-tagged the number of roofs in each part of the map in a stratified manner. For example, if 30 interviews were to be achieved from this slum location, the number of interviews that had to be achieved in each part of the map had to be deduced in a stratified random manner. First, the proportion of roofs in each component to the total number of roofs in the map was established. Second, based on the proportion, the number of interviews (out of 30) to be conducted in each component was determined using the same proportion-to-size approach. Based on that, in each component of the map, the building from where the interview had to be conducted was tagged by tagging the roof of the building as can be seen in Figure 8.
Once the buildings/structures were geo-tagged, the latitude and longitude of these structures were shared with the field supervisors. The field team had to enter the latitude and longitude of a particular structure in the google map app and walk and locate it and conduct the interview there. In case they ended up right in the middle of the road, the field investigator was required to toss a coin and choose randomly to interview the house on the right or left. This method proved successful during the pilot, and it was used across the slum locations where the ground-listing was not feasible.
Use of Listing Data to Create City Weights
As well as ensuring a representative sample of the city, the Jana–Brown Citizenship Index project wanted to look at project components from the angle of particularly marginalized communities as mentioned. To that end, it was beneficial for the project to include booster samples of citizens from these communities. A booster sample of informal shack settlements was included in all cities, except Mumbai. 18 In addition, limitations on the proportion of the sample that came from middle-class housing types were put in place to avoid over-dominance of these in the sample. 19 In order to use all this data but still also paint a representative picture of the cities, the listing data from the sampling frames created, as outlined earlier, was used to create city-specific weights.
As mentioned, during the listing process, field surveyors undertook a mini census of sorts of each sampled Polling Part by listing all the buildings in order to create a sampling frame. As a result of this thorough and meticulously conducted exercise, data on the proportion of different types of buildings in each city was collected.
It was anticipated that reweighting along housing type would mitigate the effect of higher sample proportions for slum households along with the effect of capping the proportions of middle-class households in the overall sample. Given the relatively poorer economic condition of many individuals belonging to SC/ST groups, it was expected that weighting along housing type would also reduce bias introduced through higher sample proportions of this subpopulation. Thus, the listing process not only provided a proxy for socio-economic class but also allowed for neutralizing the impact that the inclusion of the booster sample and capping of middle-class housing in the sample would have had on the overall representativeness of the sample.
As mentioned, during the listing process, buildings were counted rather than individual households. To that end, there is a degree of error in how these proportions relate to the proportion of households of each housing type. This would be most likely the case in areas with many HT1s which are generally single household structures, especially when they appear in more heterogeneous neighbourhoods with apartment buildings (mostly HT3/4s). Such scenarios would generally undercount the proportion of HT3/4 households and overcount the proportion of HT1 households. However, it should be noted that only in Mumbai were there considerable proportions of HT1s (21%) compared with less than 2.5% in other project cities. On balance, at the city level, combining listings from many areas across the city, these differences should even out, though this requires further exploration, particularly in Mumbai.
Rake weighting (or iterative proportional fitting) was used to create weights that were unique to each city. For citizen data in the cities, each response was assigned a weight according to housing type, which was unique for each city according to the difference between the sample margins and the population distributions of the five housing types as determined by the listing data.
Comparison of Project’s Demographic Indicators with Other Sample and Population Figures
This section presents a comparison of data from some of the project’s key demographic indicators at the city level 20 , 21 22 with Census (2011) figures and the National Sample Survey Office (NSSO) 76th round-Drinking Water, Sanitation, Hygiene and Housing Condition (2018) figures. The Census is a comprehensive picture of the entire country, and NSSO is a similar large-scale sample survey with the 76th round survey, focusing on themes similar to JBCI, such as quality of drinking water, sanitation, hygiene and housing conditions. The 76th NSSO round was also undertaken around the same time as the latest round of JBCI data collection (i.e., 2018–2019). It should be noted that the two surveys fulfil different aims than the JBCI surveys and were undertaken at considerably different time intervals, with Census being considerably more dated.
Proportion of Slums
Table 5 shows the project sample as well as Census and NSSO proportions for the slum population for different cities. The project definition of slums is based on housing-type properties and is made up of informal shack dwellings (HT1) and informal slum households (HT2). The Census of India categorizes slums into three categories: (a) notified slums, (b) recognized slums and (c) identified slums with different characteristics pertaining to each as mentioned earlier. NSSO, on the other hand, defines slums as a cluster of 20 or more households/tenements that are ‘poorly built, mostly temporary in nature, crowded together usually with inadequate sanitary and drinking water facilities in unhygienic conditions’ (NSSO, 2001).
Comparison of Proportion of Slums: Sample (Jana–Brown Citizenship Index), Census 2011, and NSSO 76th Round (2018–2019).
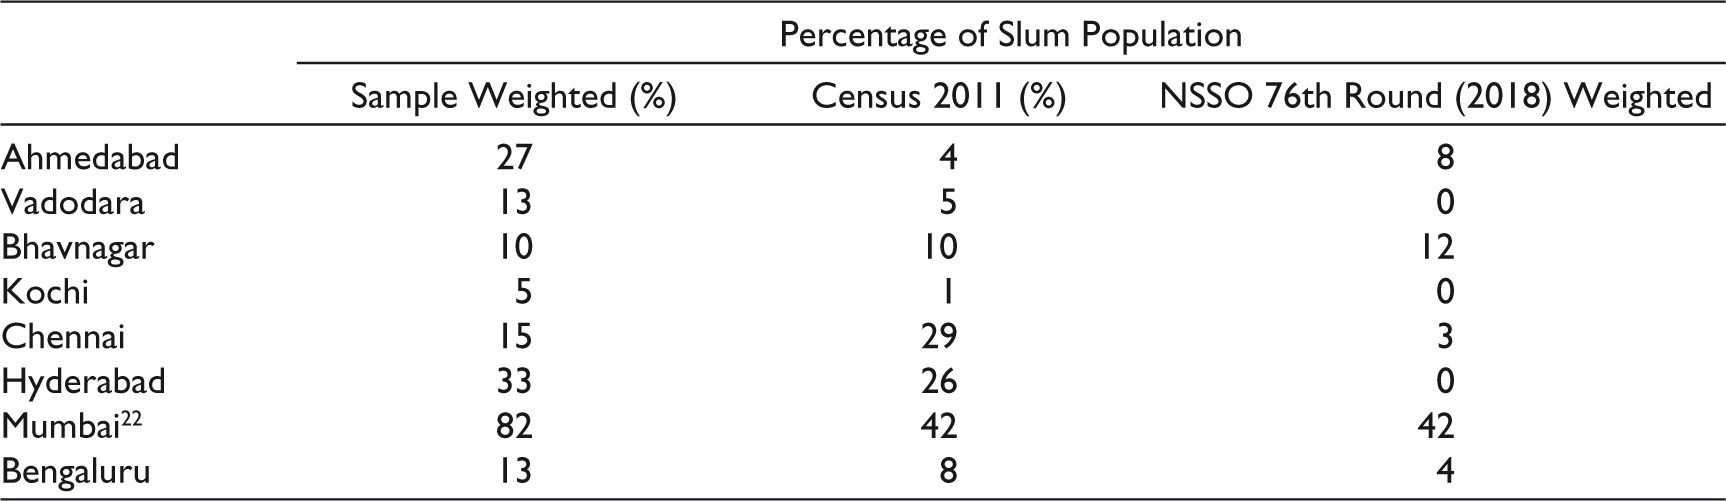
As can be seen, the project sample was able to capture a considerable proportion of slums and is higher than both census figures and NSSO figures for all cities except Chennai (when compared with the Census) and is equal to the Census proportion for Bhavnagar as noted by the Census, though lower than what NSSO reports for this city. It is possible that the project approach captures slums with a higher degree of informality than the Census or NSSO does, for example, single settlements with slum-like features.
Proportion of SC-ST Population
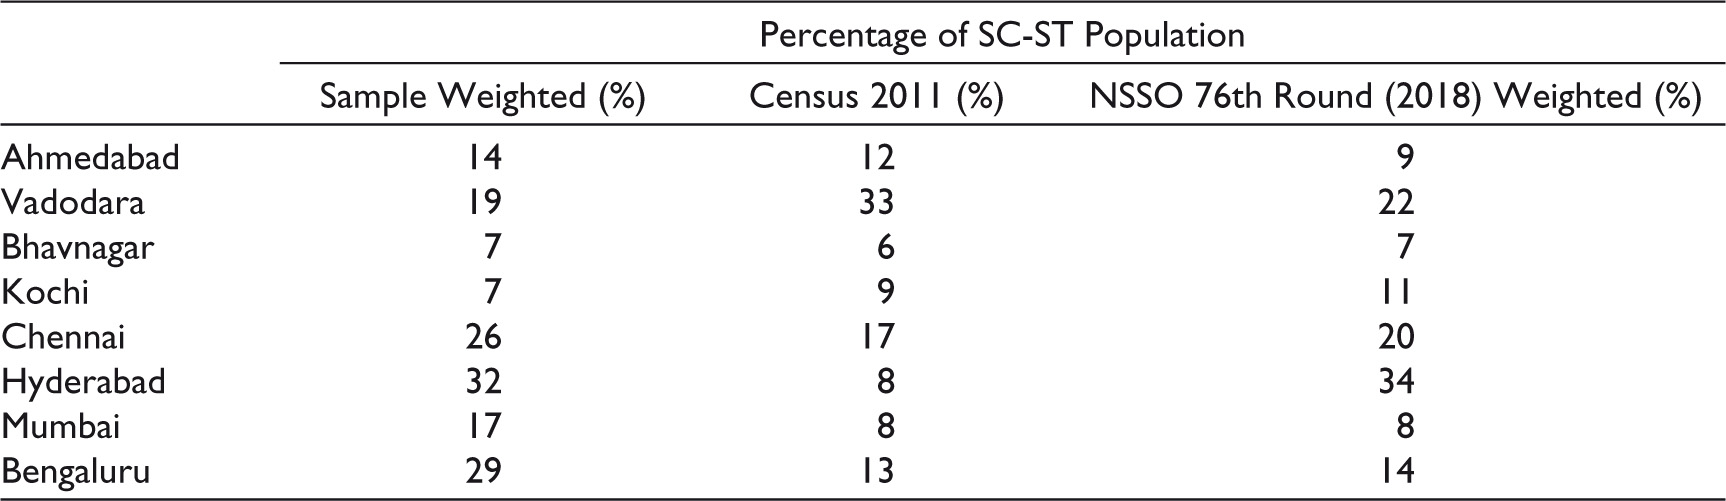
Table 6 shows the project sample, Census, and NSSO 76th round proportions for the SC-ST population in different cities. When compared with Census, in all cities except Vadodara and Kochi, the project sample captured a larger proportion of SC-ST citizens. In Kochi, this difference was just 2%. There is a similar trend when comparing the project sample with the NSSO figures. In several cities, the project sample proportions are larger than NSSO proportions, though there are minimal differences in Bhavnagar, Vadodara, Kochi and Hyderabad. Given that much research shows that SCs and STs often live in poorer conditions, the larger proportions in some cities may relate to the project approach identifying a greater proportion of slum settlements, as noted above.
Comparison of Proportion of SC-ST Citizens: Sample (Jana–Brown Citizenship Index), Census 2011 and NSSO 76th Round (2018–2019).
Proportion of the Muslim Population
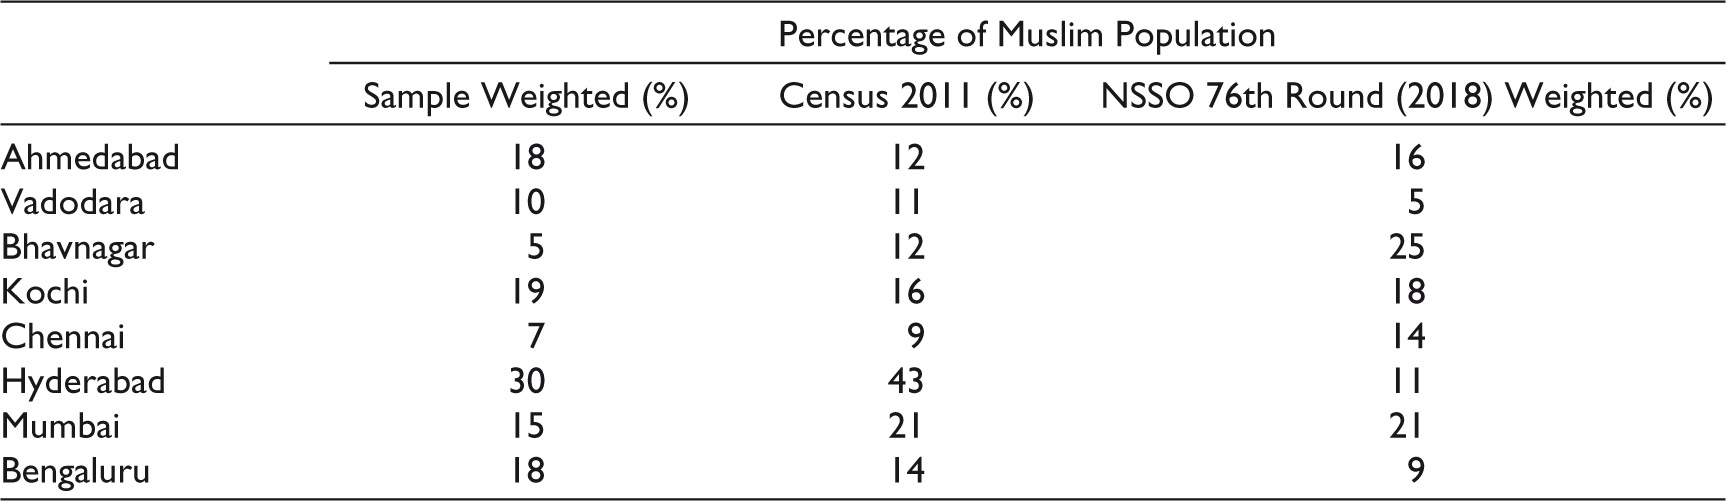
Table 7 shows the project sample, Census and NSSO proportions for the Muslim population in different cities. When compared to Census, the project sample approach led to a lower proportion of Muslim citizens being sampled at the city level in five out of eight cities listed, though in two of these cities the proportions were relatively similar. In all these five cities, a ‘local knowledge’ approach was used for the identification of Muslim-dominated wards. Given this is less systematic than the aforementioned methodologies, it is likely to have led to varying degrees of success in sampling Muslim citizens. However, when we compared the figures with NSSO, the project sample showed a larger sample of Muslims in five out of eight project cities. The success of the ‘local knowledge’ methodology depends on the credibility of the sources which is difficult to discern at face value when the sources are people. Given these findings and the fact that a larger proportion of Muslims was sampled in the more systematic Bengaluru methodology, it is an adjusted version of the latter, that is being used going forward for the identification of Muslim-dominated wards for future cities of study.
Comparison of Proportion of Muslims: Sample (Jana–Brown Citizenship Index), Census 2011 and NSSO 76th Round (2018–2019).
Concluding Remarks
Conducting urban research in India poses a series of unique challenges. This article has outlined particular issues in establishing robust sampling frames and has presented a series of methodological approaches which speak to ways these can be constructed, particularly from the point of view of capturing traditionally undercounted, informal settlements and groups which form a smaller proportion of the total city population (e.g., scheduled castes and scheduled tribes and Muslim citizens). This includes an approach that brings together information from other data sources to classify wards (and in turn, also Polling Parts) to allow for stratified random sampling of Polling Parts. It also outlines how proxy base maps for Polling Parts can be created in the absence of clear maps/defined boundaries, with a special case for creating sampling frames in Polling Parts with very dense and convoluted settlements.
The methodology also outlines an alternative method of capturing class, using a classification of housing types rather than the more traditionally used approach of assets, expenditure or income. This is a very different material approach to class than traditionally used and does not only reflect purchasing power but reflects something that can be shaped by market forces, supplied by the state and/or shaped by social networks. It can also be collected independently by a field team, without direct engagement with citizens. This classification, placed in the listing framework, provides a geospatial view of settlements. Additionally, the article explains how this has also been used to calculate city-level weights that can be used to inform analyses at this level, even while it will be beneficial to explore the differential impact of listing only buildings as compared with additionally counting the households within them.
Overall, the methodology has been successful in arriving at samples with a representative proportion of slum populations and SC-ST citizens. The coverage of Muslim citizens is more variable. A more systematic approach of counting Muslim institutions and comparing proportions to identify Muslim-dominated areas would perhaps lead to more adequate coverage of Muslim citizens than the use of local knowledge.
This article offers alternate ways of creating sampling frames while conducting urban survey research that circumvents issues or challenges researchers may face while conducting research in the urban India context. While the methodology may be equally applicable and valid for rural areas, the need for the same may not exist with more accurate voter lists existing in rural areas. While not debated here explicitly, the time and resource cost of undertaking many aspects of the described methodologies are substantial. Consideration of this needs to be offset with the need, purpose, scale and resources available for any research undertaking.
Footnotes
Acknowledgements
The Authors of this paper would like to acknowledge and thank Professor Patrick Heller and Professor Ashutosh Varshney from Brown University, Professor Siddharth Swaminathan from Azim Premji University and Ebony Bertorelli as co-creators of this methodology.
Declaration of Conflicting Interests
The authors declared no potential conflicts of interest with respect to the research, authorship and/or publication of this article.
Funding
The authors received no financial support for the authorship and/or publication of this article.