
Abstract
This study examines the level and determinants of households’ vulnerability to food insecurity using feasible generalised least square method. Data were collected using structured questionnaires from a random sample of 574 households. Descriptive results indicated that the incidence, depth and severity of food insecurity were 68, 31 and 18 per cent, respectively, while mean vulnerability to food insecurity was 73.34 per cent. The mean level of vulnerability to food insecurity at Chencha (humid), Demba Gofa (semi-arid) and Kamba (arid) districts were 77, 55 and 84 per cent, respectively. In addition, the mean kilocalorie deficiency gap in the study areas was 682 Kcal per adult equivalent per day, while the mean kilocalorie deficiency gaps which would be needed to lift households out of food insecurity were 462, 440 and 506 Kcal per adult equivalent per day at Chencha (humid), Demba Gofa (semi-arid) and Kamba (arid) districts, respectively. Regression results revealed that the age of household head, family size, safety net programmes, distance from healthcare and death of household members significantly increase households’ vulnerability to food insecurity. But farm income, irrigation use and credit use significantly decrease households’ vulnerability to food insecurity. The government needs to provide credit, viable off-farm employment, small-scale irrigation services and road infrastructure to rural poor to reduce vulnerability to food insecurity. Population control and family planning would also increase resource and consumption per capita and will lead to lower vulnerability.
Introduction
We are living in a world where about 842 million people are food insecure, and the majority of food insecure people live in developing countries (FAO, 2016). Sub-Saharan Africa has the highest prevalence of undernourishment among developing regions. For instance, the percentage of undernourished people were 11.3, 13.5 and 24.8 per cent in the world, developing countries and sub-Saharan African countries, respectively, in 2014 (WFP, 2015). As part of sub-Saharan Africa, Ethiopia faces daunting poverty and food insecurity challenges that have been worsening over time (FAO, 2016). For instance, Ethiopia was ranked as the first food-insecured country among the sub-Saharan African countries with about 21.6 million undernourished people in 2016. In addition, Ethiopia is ranked 173rd among 189 countries with Human Development Index of 0.47 which is lower than the mean Human Development Index for sub-Saharan African countries (UNDP, 2018).
Despite the colossal effort that has been made by the Ethiopian government so as to reduce the prevalence of food insecurity and the vulnerability to food insecurity, both the chronic and transitory food insecurity have continued at the household level and millions of people are still vulnerable to food insecurity and poverty due to man-made and natural factors (Temesgen et al., 2016). In response to this persistent food insecurity, Ethiopian government launched a productive safety net programme (PSNP) in 2005 in some chronically food-insecured districts. Though the main objective of this programme is to build the resilience of households to food insecurity via asset accumulation, water and soil conservation, road construction, and natural resource conservation, the number of users of productive safety net programme have been escalating through time in Ethiopia. For instance, the number of productive safety net users in Ethiopia were 4.5, 7.6 and 8.3 million people in 2005, 2012 and 2016 respectively (World Bank, 2018).
Other evidences (FAO, 2016; Fentaw et al., 2013) also indicate that the level of food insecurity and poverty are higher in Ethiopia in general and rural Ethiopia in particular. This is due to the fact that the level of food insecurity and poverty in Ethiopia depend on the performance of agricultural sector since the livelihoods of more than 75 per cent of the population depend on agricultural production (World Bank, 2018). Thus, rural population are more vulnerable to food insecurity and poverty than urban population. For instance, 83.5 per cent of the total population of Ethiopia is multidimensionally poor while 22.3 per cent of the total population is living below income poverty line in 2016 (UNDP, 2018). But the same source indicated that about 91.8 per cent of the rural and 36.8 per cent of the urban population in Ethiopia are multidimensionally poor in 2016. Regarding income poverty, the percentage of population below income poverty line in rural areas in 2000 was 45.4 per cent while it was 36.9 per cent in urban areas in Ethiopia. However, this number decreased to 25.6 and 14.8 per cent respectively in 2016 (CSA, 2018). Thus, despite the declining trends of absolute poverty in both rural and urban areas over time, the gap between rural and urban poverty has remained persistent in Ethiopia.
In addition, the high prevalence of food insecurity in rural areas compared to urban areas in Ethiopia mainly depends on the combinations of man-made and natural factors. The natural factors include rainfall variability, land degradation, population density, climate change, low levels of rural investment, limited agricultural input, drought, pest and flooding (Temesgen et al., 2016). On the other hand, the man-made factors that influence food insecurity in rural Ethiopia include lack of access to land, credit, infrastructure and technologies (Abraham et al., 2017). Since agricultural sector is vulnerable to different shocks and risks compared to the non-agricultural sectors, the rural population of Ethiopia move continuously in and out of food insecurity and poverty. This implies that food insecurity is better understood as dynamic concept rather than static in nature and the dynamic nature of food insecurity in rural Ethiopia is due to the fact that the livelihoods of the population depend on agriculture, which is rainfall dependent and highly erratic (Jaleta et al., 2018).
Food security is a broader concept and it comprises of four pillars: food availability, food accessibility, food utilisation and stability (Abraham et al., 2017; Jemal, 2014. Although there has been a mounting awareness about the merit of ex-ante analysis of food insecurity over ex-post analysis of food insecurity, empirical evidences on dynamic analysis of food insecurity in Ethiopia in general and in southern Ethiopia in particular have been undocumented. So it is essential to just look at not only the current incidence of food insecurity but also individuals, households and communities that are more at risk of suffering in the near future. Since people move in and out of food insecurity over time, being food insecure today does not necessarily imply a probability of being so in the future (Thabane, 2015). Hence, there is a need to move from a mere analysis of the current incidence of food insecurity to a forward-looking future incidence of food insecurity to capture the dynamic nature of food security (Thabane, 2015; Tibebu & Sisay, 2017).
Therefore, it is important to identify households who are currently food insecure but who are more likely to be food secure in the near future or those households who are currently food secure but who are more likely to be food insecure in the near future in order to design and implement inclusive food security policies and strategies. In other words, ex-ante analysis of food insecurity is more important than ex-post analysis of food insecurity. Hence, though the analysis of vulnerability to food insecurity or ex-ante analysis of food insecurity has paramount importance for better intervention, previous studies have focused on the ex-post analysis of food insecurity and vulnerability to poverty (Agidew & Singh, 2018; Motbainor et al., 2016). This study aimed to document evidence on the level and determinants of household vulnerability to food insecurity using vulnerability as expected poverty (VEP) approach.
Southern Nations Nationalities Peoples Region (SNNPR) State is one of the nine regional state in Ethiopia. Food insecurity in SNNPR State has also remained a complex problem in which lack of access, availability, quality and stability of food supply still play an important role in influencing the food security status of the population (Melkamu, 2011). According to Ethiopian Central Statistical Authority (2016), 24 and 59 per cent of the population were poor and food insecure in SNNPR State respectively. Though there are some studies on the level and determinants of food insecurity in Ethiopia (Bogale, 2012; Temegen et al., 2015), evidences on the level and determinants of vulnerability to food insecurity have been undocumented. Hence, this study is designed to measure the level of vulnerability to food insecurity and examine the determinants of vulnerability to food insecurity in southern Ethiopia. The remaining part of this article is organised as follow. The second section presents the concept of vulnerability to food insecurity. The third section deals with study area and methods while the fourth section deals with the results and discussion. The last section presents the conclusion of the study.
Concept, Theoretical and Empirical Literatures
Concept of Vulnerability
Food security was defined for the first time as the availability of adequate food at the global and national levels by United Nation in 1970 (WFP, 2015). This macro-level definition of food security only refers to the supply sides of food security by disregarding the demand side of food security. But since 1980, food access dimension of food security has got wider attention and food security was defined as access by all people at all times to enough food for an active and healthy life (Word Bank, 1986). Still, this definition of food security does not include one dimension of food security—food utilisation. Finally, a comprehensive definition of food security was given by Food and Agriculture Organisation (FAO) and food security is defined as the situation when all people, at all times, have physical and economic access to sufficient, safe and nutritious food that meets their dietary needs and food preferences for an active and healthy life (FAO, 1996).
The word vulnerability has different definitions and implications in different disciplines (Getachew, 2018). For instance, vulnerability is associated with natural hazard, environmental change and future negative impact on welfare in disaster management, ecological geography and food insecurity or poverty literature respectively (Getachew, 2018; Mequanent et al., 2015). In economic literatures, the concept of vulnerability to poverty was first used by Chaudhuri (2001) and defined as the probability of the household to fall or stay below the poverty line in future (Ozughalu, 2016; Sharaunga et al., 2015). Similarly, vulnerability to food insecurity is defined as the likelihood of household to fall or remain below the minimum kilocalorie per day per adult equivalent of 2,200 in the future (Bogale, 2012). Hence, food insecurity deals with static analysis while vulnerability to food insecurity deals with the dynamic analysis of welfare (Ozughalu 2016).
Regarding the measurement of vulnerability, there are three methods of quantifying vulnerability to food insecurity—vulnerability as expected poverty (VEP), vulnerability as low expected utility (VEU), and vulnerability as uninsured exposure to risk (VER) (Chaudhuri 2001). Among these, vulnerability as expected poverty focuses on the likelihood of households to fall or remain below the minimum threshold of welfare in the near future (Chaudhuri 2001; Chaudhuri et al., 2002). However, vulnerability as low expected utility measures vulnerability as the difference between the utility that household would derive from the consumption of a particular bundle with certainty and the expected utility of consumption (Bogale, 2012). Still vulnerability as uninsured exposure to risk measures vulnerability as the extent to which a given shock imposes a welfare loss owing to the absence of better risk management tools (Gelaw & Sileshi 2013). The quantification of all the three approaches are based on expected mean and variance of the consumption or income of household. But vulnerability as expected poverty can be measured using both cross sectional and panel data while the other two approaches need long panel data (Chaudhuri et al., 2002). Therefore, due to data limitation, this study used vulnerability as expected poverty so as to quantify the level of vulnerability to food insecurity.
Theoretical Literature
Though there are different theories of food insecurity, they are classified in two three—the food availability decline (FAD) theory, the food entitlement decline (FED) theory and the political economy theory of food security (Kwadwo et al., 2013). These theories of food insecurity explain the determinants of the four dimensions of food security: food availability, food access, food utilisation and food stability (Jemal, 2014). The food availability decline theory of food security explains the factors that affect the supply side of food security while the food entitlement decline theory explains the factors that affect the demand side of food security. But the political economy theory of food security blames the relationship between government and people as determinants of food security (Girum, 2016).
According to the food availability decline theory, food security is caused by the lack of access to productive assets which are used to produce goods and services (Amsalu & Wendimu, 2014). This theory assumes that drought, floods, crop failures, population growth and other demographic factors are the determinants of food security. This theory is also related to the Malthusian theory of population which assumes that rapid population growth decreases resource and consumption per capita, and leads to food insecurity (Kwadwo et al., 2013). But the food availability decline theory is criticised for its focus only on supply side factors.
The food entitlement decline theory of food security shifts the causes of food insecurity from supply side factors to demand side factors (Sen, 1981). This theory claims that food security depends on household access to food. According to the food entitlement decline theory, food insecurity is affected by factors that affect the purchase of households. This by itself implies that food availability at national level does not guarantee food security at household level. But still the food entitlement decline theory of food security is criticised on the ground that some people with ample entitlement may prefer to go food insecure at certain times rather than selling their assets fearing of future crisis (Adugna & Wagayehu, 2012).
In addition, the political economy theory of food security states that food availability and food access alone do not guarantee food security and rather, due attention should be given to state reconstruction, good governance and accountability (Arega, 2013). This theory predicts that the relationship between the society and the government actors is important to ensure food security in addition to managing the demand and supply of food security.
Empirical Literature
Study conducted by Ayele et al. (2018) on prevalence and associated factors for rural household’s food insecurity in northern Ethiopia using a sample of 504 rural households and multivariable partial proportional odds model found that about 74.4 per cent of households in east Gojjam zone was food insecure. In addition, this study indicated that land size, family size, irrigation use and number of livestock are the main determinants of food security in the study areas. In addition, study conducted by Abegaz (2017) on determinants of food security in Ethiopia using Ethiopian rural household survey for the periods of 2004 and 2009 found that 64.36 and 59.72 per cent of rural households were food insecure in Ethiopia. In addition, the study indicated that climate variables are the main determinants of food insecurity in Ethiopia.
Similarly, study conducted by Agidew & Singh (2018) on determinants of food insecurity in the rural farm households in South Wollo zone of Ethiopia using a sample of 215 households and logistic regression found that about 79.1 per cent of households were food insecured, and age of household head, land size, recurrent drought, shortage of rainfall and land degradation are the determining factors of food insecurity. In addition, study conducted by Sisha, (2018) on household level food insecurity assessment in Ethiopia using panel data and a sample of 5000 households indicated that mean years of schooling of household members, access to service centres, assets and availability of credit services positively affect household food security, whereas dependency ratio and shocks increase the odds of a household to be food insecured. Study conducted by Kakota et al. (2015) on determinants of household vulnerability to food insecurity in Malawi using two stage least square technique of estimation found that gender of household head, income, household size, land size and access to climate information are determinants of food insecurity.
Some studies (Gelaw & Sileshi, 2013; Sharaunga et al., 2015) assessed vulnerability to poverty using vulnerability as expected poverty and its determinants using different econometric methods. Access to productive resources and availability of adaption strategies are important factors influencing vulnerability to poverty and food insecurity (Sharaunga et al., 2015). In addition, studies conducted by Azeem et al. (2017) on determinants of vulnerability to food insecurity using vulnerability as expected poverty approach indicate that age of household head, income, household size, remittance, use of credit, education level of household head, sex of household head and agroecological zones are main influencing factors of households’ vulnerability to food insecurity.
Materials and Methods
Description of the Study Areas
Southern Nations Nationalities Peoples Regional (SNNPR) State is located in the southern part of Ethiopia and it is bordered by Kenya in the south, Republic of South Sudan in the south west, Gambella Regional State in the north west and Oromia Regional State on the north and east. Astronomically, SNNPR State roughly lies between 4°.43 and 8°.58 north latitude and 34°.88 and 39°.14 east longitude. In addition to this, the SNNR State accounts for 10 per cent of the total land areas and 20 per cent of the total population of Ethiopia. The total land area of SNNPR State is 112,323.19 sq. km, while the total population of the SNNPR State is 19.4 million people (CSA, 2018). Administratively, SNNPR State is classified in to 15 zones, 125 districts, 3561 rural kebeles and 90 town centres. Hawassa is the capital city of SNNPR state. From all the nine Ethiopian regions, SNNPR State is known for its ethnic and cultural diversity. While more than 80 ethnic groups are found in Ethiopia, about 56 ethnic groups live in SNNPR State.
In SNNPR State, the elevation ranges from 376 to 4,207 m above sea level. Mount Guge is the highest elevation in the region which is found in Gamo Gofa zone. Nearly 56 per cent of the total land areas of the region are found below 1,500 m of elevation and characterised mainly as hot low land or Kolla. The remaining 44 per cent of the total land areas of the region are found in the temperate climatic zone. The mean annual rainfall in SNNPR State ranges from 500 to 2200 millimetres while the mean annual temperature of SNNPR State ranges from 15 to 30 degree centigrade (CSA, 2018).
Gamo Gofa zone is one of the 15 zones in SNNPR State. According to CSA (2018) population projection, the total population of Gamo Gofa zone was 2,043,668, of which 334,639 people live in urban areas while 1,709,029 people live in rural areas. There are five indigenous ethnic groups in this zone with distinct languages and cultural base. Gamo Gofa zone has a total area of 12,581.4 sq. km and administratively consists of 15 rural districts. Arba Minch town is the administrative and trading centre of Gamo Gofa zone, located at 505 km from Addis Ababa and 275 km south west of Hawassa.
Data Sources, Sampling Techniques and Sample Size
To achieve the stated objectives, primary data were collected from a sample of 574 households via structured questionnaires. Besides, focus group discussions were held with key informants from each sample kebele and some district officials to back the data obtained via questionnaires. To complement our primary data sources, some general information about the SNNPR State were gathered from secondary sources which are both from published and unpublished documents.
Multistage sampling technique was used to choose sample districts, kebeles and households. In the first stage, three sample districts were selected from 15 districts in the Gamo Gofa zone, Southern Ethiopia, using purposive sampling method in order to retain the variations in socio-economic and ecological zones. Accordingly, Chencha, Demba Gofa and Kamba districts were selected from humid, semi-arid and arid areas respectively. There are 34, 38, and 45 rural kebeles in Demba Gofa, Kamba and Chencha districts, respectively. In the second stage, depending on the distribution of kebeles in each sample district, four rural kebeles from Chencha district, three rural kebeles from Demba Gofa district and four rural kebeles from Kamba district were randomly selected for this study. There are 18,274, 29,832 and 20,340 total households in Demba Gofa, Kamba and Chencha districts respectively (CSA, 2018). In the third stage, a representative sample of 574 households were randomly selected using the proportionate probability sampling approach which depends on the respective size of sample districts and kebeles. In Ethiopia, the term kebele is usually used to refer to a peasant association and is considered as the lowest administrative unit in Ethiopia.
There are different techniques of sample size determination in empirical research such as census for small sample size, published table for a given level of precision, variability in the population and confidence level, and use of formula (Israel, 1992). The same author indicated that if the population is less than or equal to 200, the use of census is the appropriate technique of sampling. In addition, published table will also be used if the variable of interest in the population is assumed to be normally distributed. However, several previous studies commonly and widely used different formula in order to determine the appropriate sample size. In this study, the Cochran (1963) formula was used to determine the appropriate sample size by assuming the maximum variability of 0.5, the level of precision of 0.05 and the confidence level of 0.95.
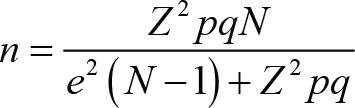
where is the sample size, is the standard normal distribution which assumes value of 1.96, is the desired level of precision, is the estimated proportion of an attribute present in the population with the value of 0.5 and is the size of the total population from which the sample is drawn. Given the total households of 68,446 from the three Districts, the value of 0.5, the value of 1.96 and the level of precision of , the sample size which is determined by the above Cochran formula is . On the other hand, given this level of variability in the population, level of precision, the level of confidence and the total population of 68,446, the sample size for this study was 397 using the published table method and 398 using Yamane Taro formula. Since each formula gives the minimum sample size for the study under consideration, this study increased the total sample size in to 574 sample households by considering the resource, time and the likelihood of non-response. Thus, a total of 574 sample households were selected from Chencha, Kamba and Demba Gofa districts. Thus, proportionately 160, 236 and 178 sample households were selected from Demba Gofa, Kamba and Chencha districts, respectively.
Methods of Data Analysis
To analyse the primary data collected from sample households, this study employed mean test, analysis of variance, percentage, frequency, logistic regression and feasible generalised least square technique of estimation. In addition, this study used Foster, Greer and Thorbecke (FGT) food insecurity index in the computation of the incidence, depth and severity of food insecurity in the study areas. Accordingly, the FGT food insecurity index was used to compute three food insecurity indices: the headcount index, the food insecurity gap and the severity of food insecurity. The head count index measures the proportion of households below the food insecurity line and it is given by the following equation:

where is the head count index, is the number of households with kilocalories per adult equivalent per day below the food insecurity line, is the number of households in the sample. Households are deemed to be food insecure if their kilocalories per adult equivalent per day are less than 2,200 Kcal per adult equivalent per day. Thus, food insecurity line is the minimum kilocalorie per adult equivalent per day which is equal to 2,200 Kcal in this study. In addition, the food insecurity gap index can account for the degree or intensity of food insecurity by taking the mean of the deviation of kilocalorie consumption per adult equivalent per day as follow:

where is the food insecurity gap, is the number of households below the food insecurity line, and is the food insecurity line which equals to 2,200 Kcal per adult equivalent per day. However, this index is silent about the distribution of the kilocalorie consumption of food insecure households. Nonetheless, the square of food insecurity gap which measures the severity of food insecurity accounts for the distribution of the kilocalorie consumption below the food insecurity line and given as:

where is the severity of food insecurity, is the number of households below food insecurity line, is the food insecurity line and is the number of all the households in the sample. The analysis of vulnerability in this study used the newly developed method of vulnerability analysis by Chaudhuri (2001). In modelling vulnerability to food insecurity, this method involves the regression of food consumption measured in kilocalorie on the households’ observable characteristics. After estimating heteroscedasticity free consumption model, projection of future consumption is made to compute vulnerability to food insecurity. The analytical methodology is similar to Christiaensen and Boisvert (2000) in that food consumption is approximated by kilocalorie consumption.
To project future consumption, the consumption model was estimated by regressing kilocalorie per adult equivalent per day on different observed characteristics. Since the residuals that will be generated by this estimation may correlate to each other, the model is unable to capture all the systematic variability of the dependent variable. To address this issue, the residual data from the original consumption model was estimated using the weighted least square method of estimation. This estimation of the residual model via weighted least square method will give the estimates of the residual variance. Finally, the estimate of the variance of the residuals is used to compute the probabilities that kilocalorie consumption, which we assume as normally distributed, may be lower than an acceptable threshold. Suppose that the log of kilocalorie per adult equivalent per day of each household, is a function of a vector of some observed and unobserved characteristics and given as follow:

where is the kilocalorie per adult equivalent per day of the household at a point of time, is a vector of covariates, and are the parameters of the model, and is the disturbance term. Since consumption function is heteroscedastic (Gujarati, 2003), the mean value of the error term in Equation (4) is zero while its variance may not be constant. Therefore, the variance of the disturbance term violates the assumption of ordinary least square method of estimation and the solution is to use feasible generalised least square method of estimation. Thus, the residual model of the original consumption equation is given as follows:

where is the square of the estimated residual from Equation (4) which varies from household to household, is a vector of independent variables of the residual model, is the disturbance term of the residual model, is a vector of coefficients of the residual model and is a constant term. To obtain consistent estimate of in Equation (4), feasible generalised least square method is used and the following steps are involved. First, Equation (4) was estimated via ordinary least square estimation and the residual was obtained. Second, the squared residual was regressed on all covariates and the disturbance term. From this second estimation, the variance of the error term was estimated and used to avoid the problem of heteroscedasticity from Equation (5) as follows.
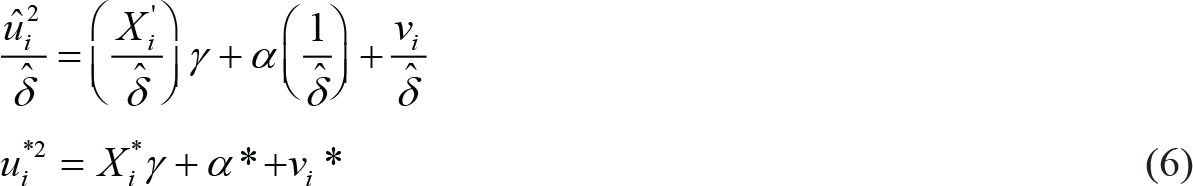
The variance obtained from Equation (6) was used to correct the Equation (4) for heteroscedasticity and the homoscedastic consumption function is specified as follow in Equation (7).
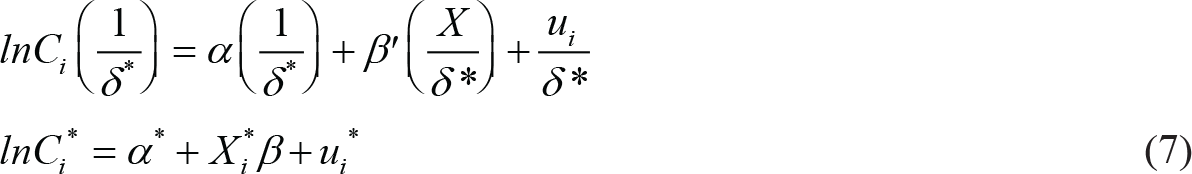
Equation (7) is estimated using ordinary least square technique of estimation and the resulting estimates are unbiased, consistent and efficient. Then, the expected kilocalorie per adult equivalent per day for each household is generated by using Equation (7). The expected kilocalorie per adult equivalent per day thus generated is compared to the minimum kilocalories of 2,200 per day per adult equivalent (FAO, 2010). Households with predicted kilocalorie per adult equivalent per day of less than 2,200 Kcal are classified as food insecure while those households with kilocalorie per adult equivalent per day greater or equal to 2,200 are classified as a food secure. In addition, the sample households are divided into two—food secured and food-insecured households. A dummy dependent variable was generated by giving 1 for food insecure households and 0 for food secure households in the study area. Next, the logistic regression model was estimated to generate vulnerability as the expected probability of being food insecured in the future.

After estimation of Equation (8) using logistic regression, probability was estimated for each household which measures the probability that each household is falling below the minimum kilocalorie per adult equivalent per day (2,200 Kcal). Thus, vulnerability to food insecurity or ex-ante food insecurity is computed in this way and the value of vulnerability to food insecurity for each household lies between 0 and 1. If , the household will consume in the future with certainty at least the minimum amount of kilocalorie per adult equivalent per day which is prescribed by the threshold. If , the household will consume fewer kilocalorie per adult equivalent per day in the future than the one which is prescribed by the threshold. In this study, 0.5 was used as cut off to classify households as vulnerable and non-vulnerable following FAO (2010). Finally, the researcher estimated the determinants of vulnerability to food insecurity by giving 1 for households with and 0 for households with . Since the dependent variable is dichotomous, the following logit model is specified and estimated.

Where G is a function taking on values strictly between 0 and 1. By taking the natural logarithm of the odds ratio of being vulnerable to food insecurity, the following model is specified to assess the determinants of vulnerability to food insecurity in the study areas.

Finally, the empirical logit model is specified as follow by including some covariates as determinants of vulnerability to food insecurity based on theoretical and empirical literatures.
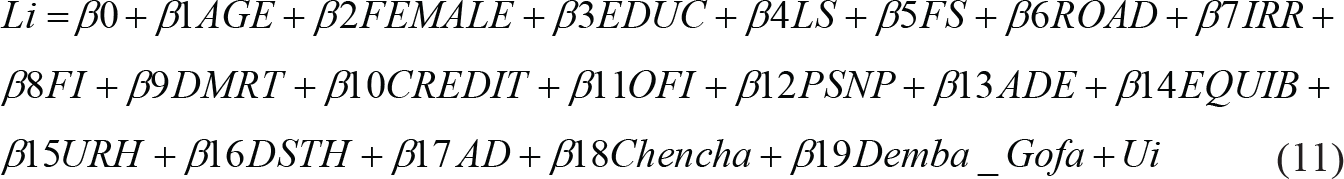
Description of Variables and Hypotheses
Age of head of household (AGE): It is a continuous variable which is measured in years. Some previous studies (Ahmed et al., 2018; Jemal, 2014; Tsegaye, 2017) used age of head of household as one covariate and they found that age of head of household and the level of food insecurity are positively correlated. That means, younger head of household is more resilient to food insecurity than older household head. Thus, in this study age is hypothesised to affect vulnerability to food insecurity positively.
Sex of household head (FEMALE): It is a nominal variable with two categories male and female. This variable is coded in such a way that it assumes value of 1 for female headed household and 0 otherwise. Many studies conducted on food insecurity at household level indicated that female headed households have lower probability of food security compared to their male counterparts (Agidew & Singh, 2018; Mebratu, 2015; Mequanent et al., 2015). Thus, this study hypothesises positive relationship between sex of household head and the level of food insecurity in the study areas.
Education level of household head (EDUC): This variable is a continuous variable which is measured in years of schooling. Education is a human capital which increases the productivity of a person (Yilebes, 2017). Several previous studies also showed that education and food insecurity are negatively related (Amsalu & Wendimu, 2014). Thus, a negative relationship between education level of household head and the level of food insecurity is hypothesised in this study.
Land size (LS): It is a continuous variable which is measured in hectare. In rural areas, land is the most decisive factor of production which determines the resilience or vulnerability of a household to food insecurity. Different previous studies also indicated that land size and food insecurity are negatively correlated (Kwadwo et al., 2013; Seid & Biruk, 2018). Thus, this study hypothesises a negative relationship between land size and the level of food insecurity in the study areas.
Family size (FS): This variable is also a continuous variable which is measured by the number of household members. As the number of children increases, both the resource per capita and the consumption per capita decrease. Some evidences from literature also confirmed that family size and the food insecurity are positively correlated (Kwadwo et al., 2013; Tsegaye, 2017). Therefore, a positive relationship between family size and the level of food insecurity is hypothesised in this study.
Distance from road (ROAD): It is a continuous variable which measures the distance from the home of the household to all season road in kilometre. This variable may affect food insecurity via its effect on household access to input and output markets. Many studies found that distance from all season road in kilometres and food insecurity are positively related (Fekede et al., 2016; Getachew et al., 2018; Girum, 2016). Thus, a positive relationship between distance from all season road and the level of food insecurity is hypothesised in this study.
Irrigation use (IRR): It is a dummy variable for irrigation use which assumes value of 1 for irrigation users and 0 otherwise. Access to irrigation water is one key determinant of productivity and food availability at household level. Some studies on food security found that irrigation participation and food insecurity are negatively correlated (Shishay, 2014; Teklay et al., 2013). Hence, this study hypothesises negative relationship between irrigation use and food insecurity.
Farm income (FI): This variable is a continuous variable which measures the monetary value of all farm output in Ethiopian Birr. Farm income positively affects the food availability and the food access dimensions of food security and reduces vulnerability to food insecurity. Evidences from previous studies also showed that farm income and food insecurity are negatively related (Ejigayhu, 2011). Thus, a negative relationship between farm income and the level of food insecurity is hypothesised in this study.
Off farm income (OFI): This is a continuous variable which is measured in Ethiopian Birr. Off farm income is one of an important financial capital which reduces vulnerability to food insecurity of rural households (Indris & Adam, 2013). This study also hypothesised an inverse relationship between off farm income and the level of food insecurity.
Credit use (CREDIT): It is a dummy variable which assumes value of 1 for credit users and 0 for non-users. This variable may reduce food insecurity by affecting the access dimension of food security. Previous studies indicated negative relationship between credit use and the level of food insecurity of households (Malla et al., 2017). This study also hypothesised a negative relationship between credit uses and food insecurity.
Distance from market (DMRT): This variable is a continuous variable which measures the distance from the home of household to local market in kilometres and some studies found a positive association between this variable and food insecurity (Adugna & Wagayehu, 2012; Amsalu & Wendimu, 2014). Thus, this study hypothesised a positive relationship between food insecurity and distance from market.
Participation in Safety Net Programme (PSNP): It is a dummy variable which takes value of 1 for users and 0 for non-users of safety net programme. Previous studies found negative relationship between participation in safety net programme and the level of household food insecurity (Guyu & Muluneh, 2017; Sisay et al., 2018.
Death of animals (DA): This is a dummy variable to capture the existence of a shock to the household which takes value of 1 for household who experienced death of animal in the past one year and 0 otherwise. Studies conducted by Tagese and Berhanu (2015) and Teklay et al. (2013) found that shocks like death of household member, crop failure and death of animals have positive and significant effect on household food insecurity. This study also hypothesised a positive relationship between food vulnerability to food insecurity and death of animals.
Descriptive Statistics of Sample Households by Districts
Results and Discussion
Socio-economic Characteristics of Sample Households
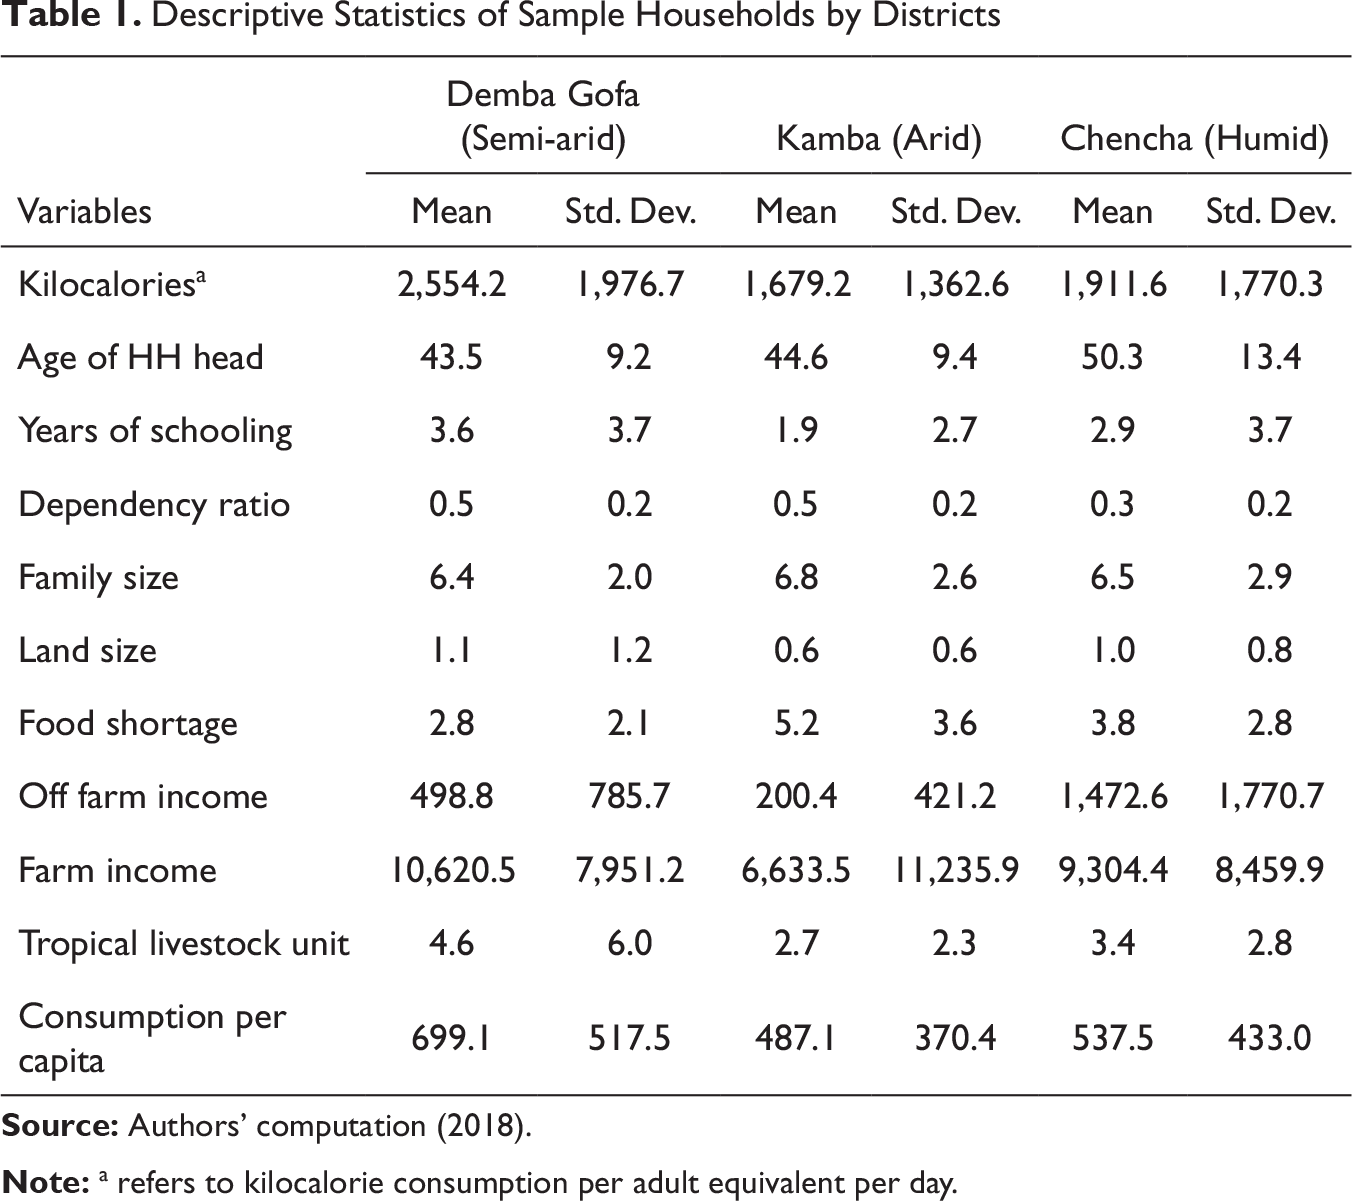
Data from a sample of 574 rural households were collected and analysed using both descriptive and econometric methods to attain the specific objectives of this study. As indicated in Table 1, the mean kilocalorie per adult equivalent per day at Chencha, Kamba and Demba Gofa districts were 1,911.6, 1,679.2 and 2,554.4, respectively. This indicates that the mean kilocalorie per adult equivalent per day at Demba Gofa district was higher than the other two sample districts. Similarly, the mean consumption per adult equivalent per month in Ethiopian Birr at Demba Gofa district (699.1) was higher than the mean consumption per adult equivalent per month at Chencha district (537.5) and Kamba district (487.126). In addition, as evidenced from Table 1, the mean monthly income from off-farm activities in Ethiopian Birr at Chencha district (1,472.6) was higher than the mean monthly income from off-farm activities at Kamba district (200.4) and Demba Gofa district (498.8).
This is because rural households at Chencha district are mainly engaged in weaving activities as they live with Dorze people who are the creators as well as teachers of weaving in the area. Evidences in Table 1 also indicated that households faced food shortages on average for 3.8, 3.6 and 2.8 months in the preceding one year at Chencha, Kamba and Demba Gofa districts respectively. In the same vein, the mean number of livestock in tropical livestock unit at Chencha, Kamba and Demba Gofa districts were 3.4, 2.7 and 4.6, respectively.
Level of Food Insecurity and Vulnerability in the Study Areas
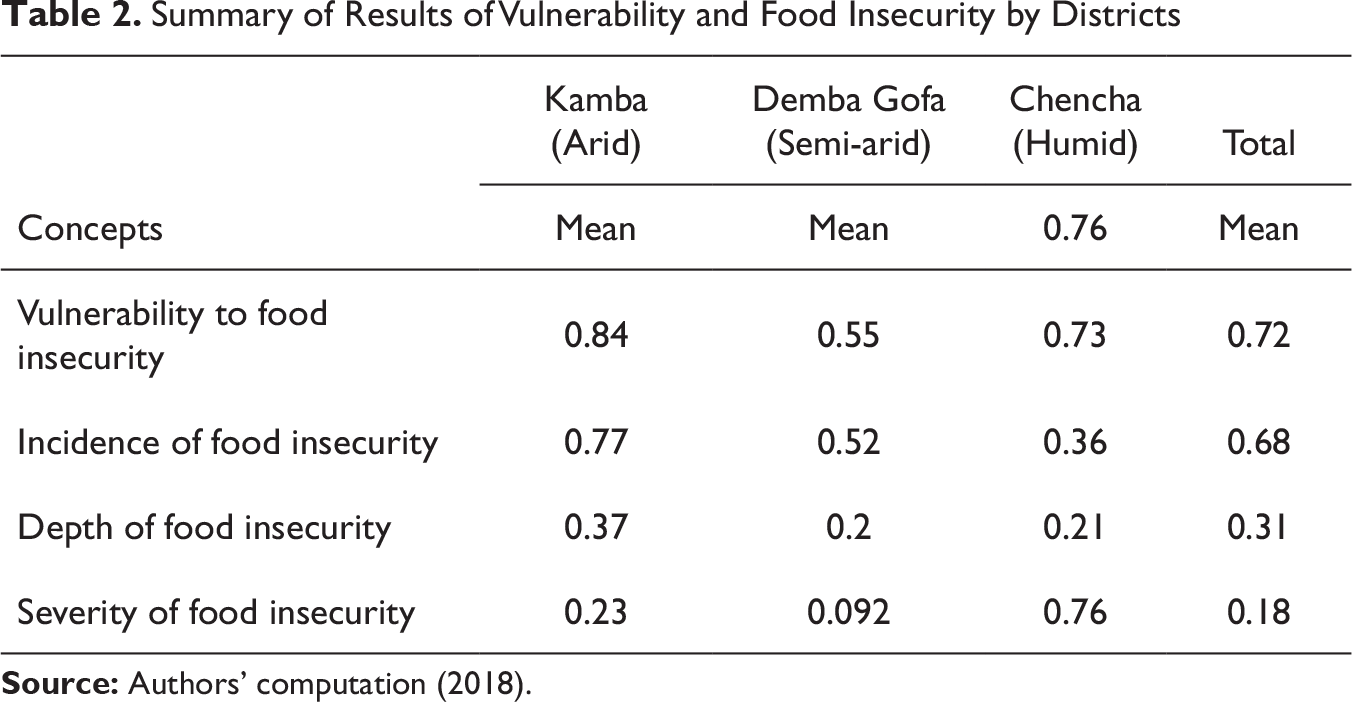
The results in Table 2 indicated that the incidence of food insecurity was 68 per cent with the depth and severity of food insecurity being 31 per cent and 18 per cent respectively in the study areas. But the mean vulnerability to food insecurity in the study areas was 72 per cent as indicated in Table 2. Added to this, the study found that the incidence, depth and severity of food insecurity at Chencha district were 73, 36 and 21 per cent, respectively, while the incidence, depth and severity of food insecurity at Demba Gofa district were 52, 20 and 9.2 per cent, respectively. In the same vein, the incidence, depth and severity of food insecurity at Kamba district were 77, 37 and 23 per cent, respectively. Results in Table 2 also showed that the mean vulnerability to food insecurity at Kamba district was 84 per cent which is higher than the mean vulnerability to food insecurity at Chencha district (76%) and Demba Gofa district (55%). Thus, this descriptive data analysis revealed that rural households in Kamba district were more vulnerable to food insecurity than rural households in Demba Gofa and Chencha districts.
Summary of Results of Vulnerability and Food Insecurity by Districts
Distribution of Rural Sample Households by Vulnerability to Food Insecurity
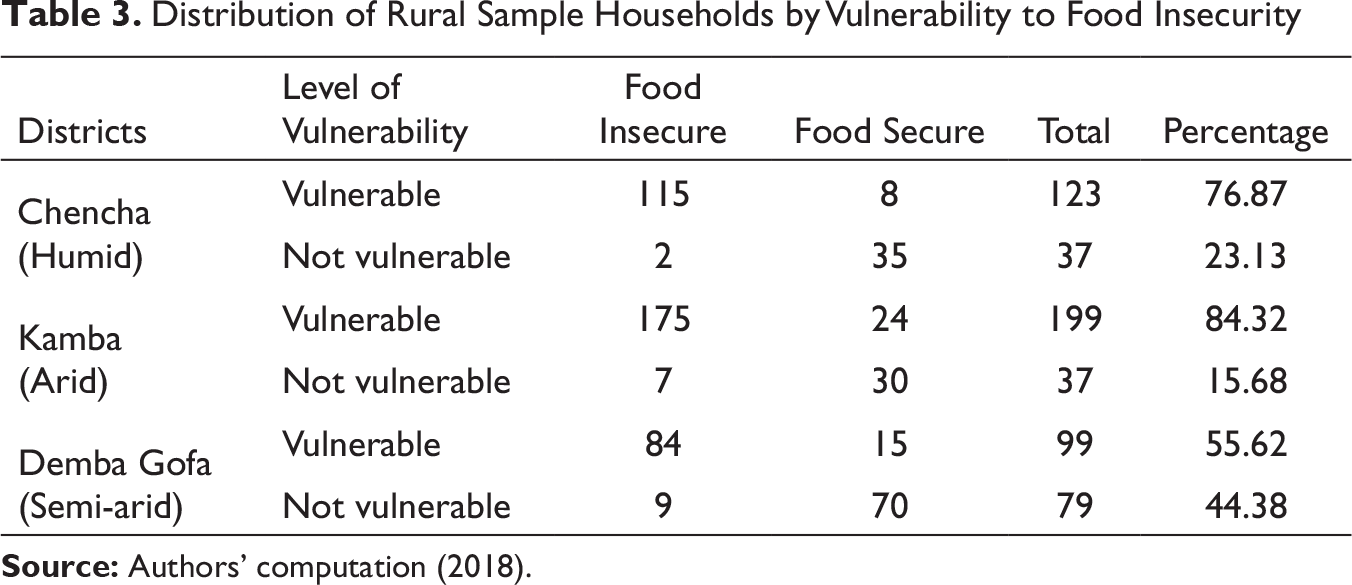
Regarding vulnerability to food insecurity, the rural households in the study areas were classified as vulnerable and non-vulnerable households depending on the predicted future kilocalorie per adult equivalent per day. After obtaining the kilocalorie per adult equivalent per day, the study estimated the feasible generalised least square model to account for heteroscedasticity in the consumption data and predicted the future kilocalorie per adult equivalent per day. Those households with predicted future kilocalorie per adult equivalent per day which are less than the minimum kilocalorie requirement per adult equivalent per day are vulnerable to food insecurity whereas those households with predicted future kilocalorie per adult equivalent per day which are greater than the minimum calorie requirement per adult equivalent per day are not vulnerable.
As indicated in Table 3, vulnerability to food insecurity is more widespread in the study areas than food insecurity. Table 3 revealed that from a total of 182 currently food-secured households, about 47 (8.2%) of households were vulnerable to food insecurity. In addition, from a total of 392 currently food-insecure households, about 18 (3.1%) of households were not vulnerable to food insecurity in the study areas as indicated in Table 3. It might seem not surprising that about 135 (23.5%) of currently food secured households are not considered to be vulnerable in the study areas. This means that these households are currently food secure and they are considered to have a relatively low chance of being food insecure in the next period.
Mean Difference Tests Using ANOVA and T-Test
As can be evidenced from Table 4, the mean age of household head, family size, dependency ratio, adult equivalent, distance from all-season roads and distance from the market were higher for vulnerable households than non-vulnerable households in the study areas. On the other hand, the mean kilocalorie per adult equivalent per day, years of schooling of household head, tropical livestock unit and monthly consumption expenditure per adult equivalent were higher for non-vulnerable households than vulnerable households, and the differences are statistically significant. This implies that vulnerability to rural food insecurity increases with an increase in the age of household head, family size, and distance from roads and nearby markets.
Hence, the mean age of vulnerable sample household head was greater than the mean age of non-vulnerable households and the mean difference is statistically significant at 1 per cent level of significance. That means, older households are more likely to be vulnerable when it is compared to younger households. This is because as the age of household head increases, active household members may leave the household due to marriage or rural out-migration.
Similarly, rural households will benefit from crop and livestock production via market participation and market participation by itself depends on the distance from all-season roads and nearby markets. So, as the distance from roads and local markets increase, households’ participation in input and output market decrease and these increase the vulnerability of rural households to food insecurity.
Results of Mean Difference Test Using T-test for Sample Households
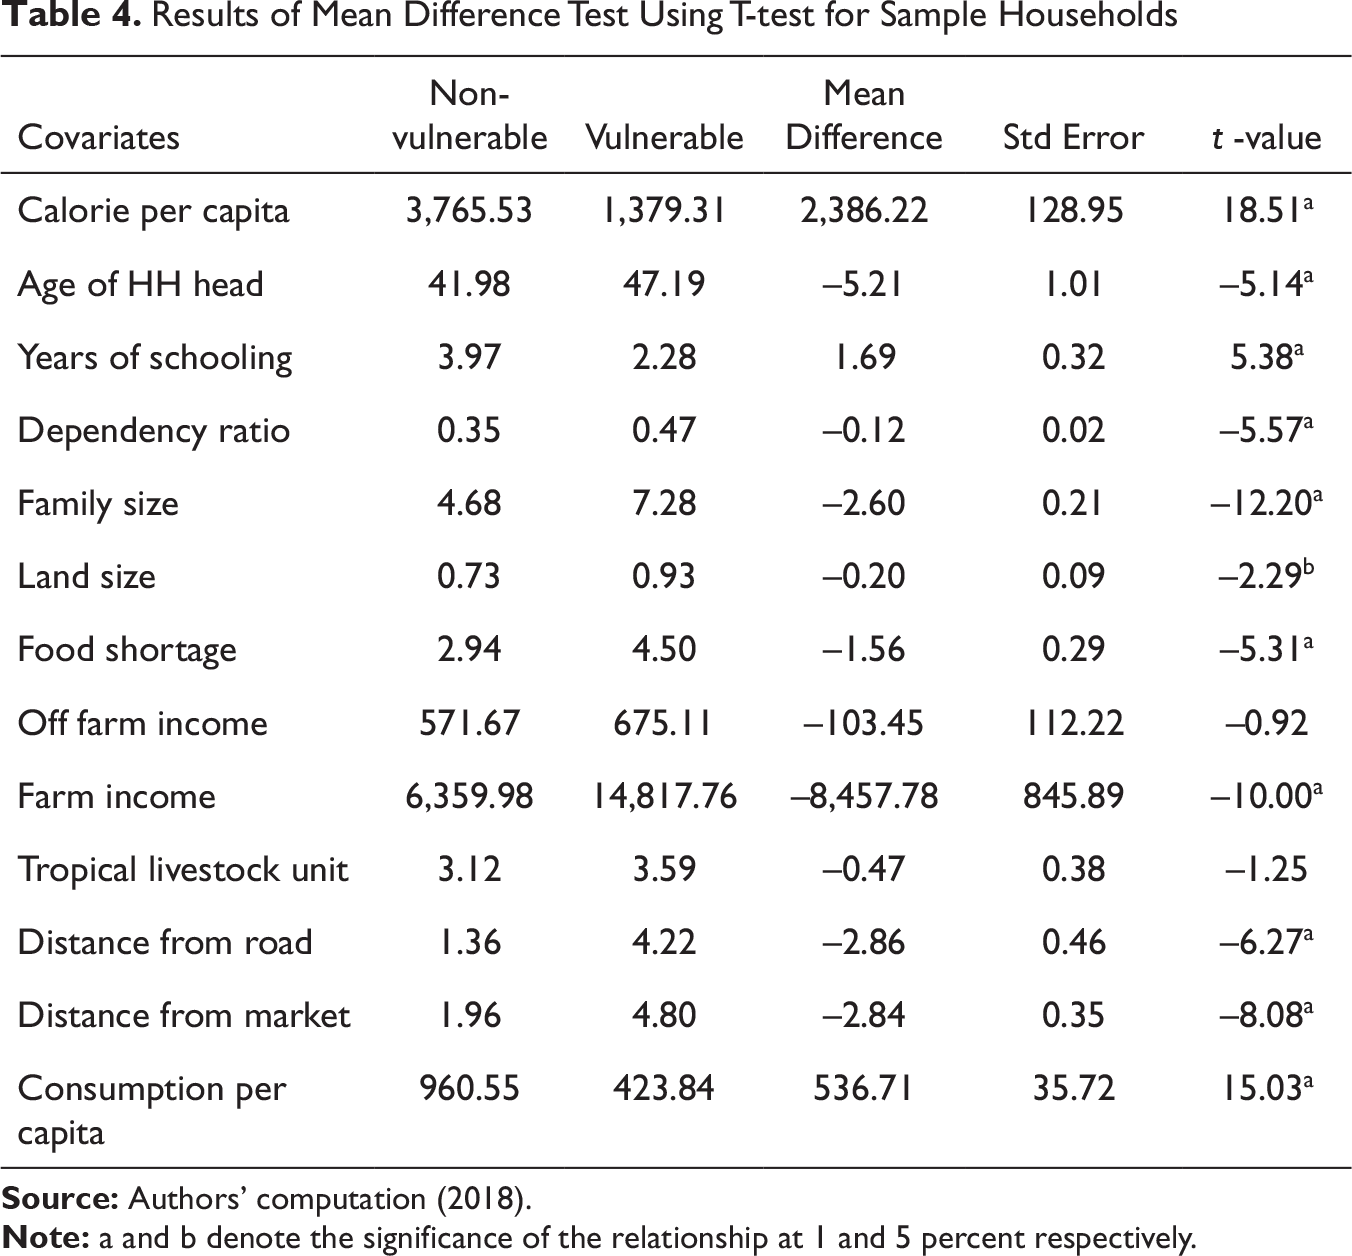
Note: a and b denote the significance of the relationship at 1 and 5 percent respectively.
Results of Mean Difference Test Using ANOVA for Kilocalorie by Districts

The probability of the third F statistics in Table 5 which is less than 5 per cent indicated that the mean kilocalories per adult equivalent per day at the three districts were statistically significantly and different from each other. In addition to this, the probability of the second F statistics which is still less than 5 per cent showed that the grand mean of a kilocalorie per adult equivalent per day is statistically significantly and different from zero.
Results of Mean Difference Test Using ANOVA for Expenditure by Districts
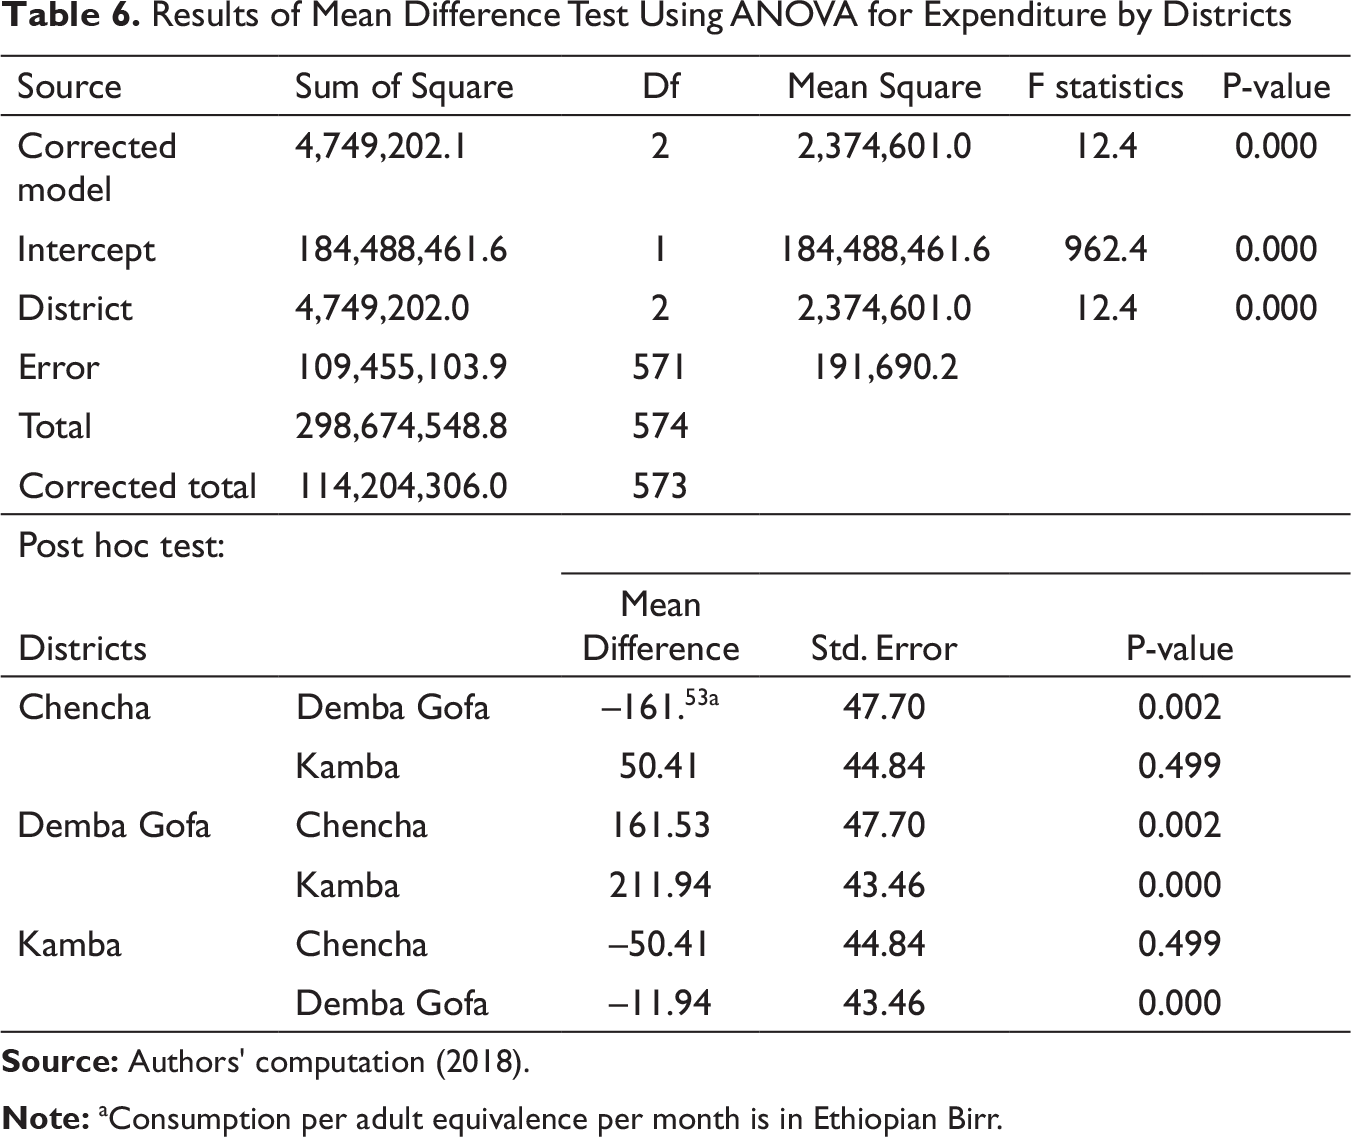
As evidenced from Table 6, there exists a significant mean difference of consumption expenditure per adult equivalent per month in Ethiopian Birr for the three districts. The probability value of the third F statistics in Table 6 is less than 5 per cent and this indicated that the mean consumption expenditures per adult equivalent per month at the three districts are different from each other. Since the analysis of variance does not tell us the statistical significance of the mean difference between the pairs of districts, the post hoc test was used to check whether there exists a significant mean difference between the two pairs of districts in the study areas. Regarding the statistical significance of the mean difference of consumption expenditure per adult equivalent per month in Ethiopian Birr between the pairs of districts, the result in Table 6 indicated that the mean consumption per adult equivalent per month in Ethiopian Birr of households at Demba Gofa district is significantly higher than the mean consumption per adult equivalent per month in Ethiopian Birr of households from Chencha and Kamba districts at 1 per cent level of significance.
Results of Logistic Regression
In this study, feasible generalised least square estimation technique was used to predict future kilocalorie per adult equivalent per day. Next, households were classified as food secure and food insecure based on this predicted future kilocalorie per adult equivalent per day. Then, logit model was estimated and the level of vulnerability to food insecurity was predicted for each sample household. Finally, sample households were classified as vulnerable and non-vulnerable households based on predicted probability of being food insecure in the future. Households were classified as vulnerable to food insecurity if the probability is 0.5 and higher while households were classified as non-vulnerable to food insecurity if the probability is less than 0.5.
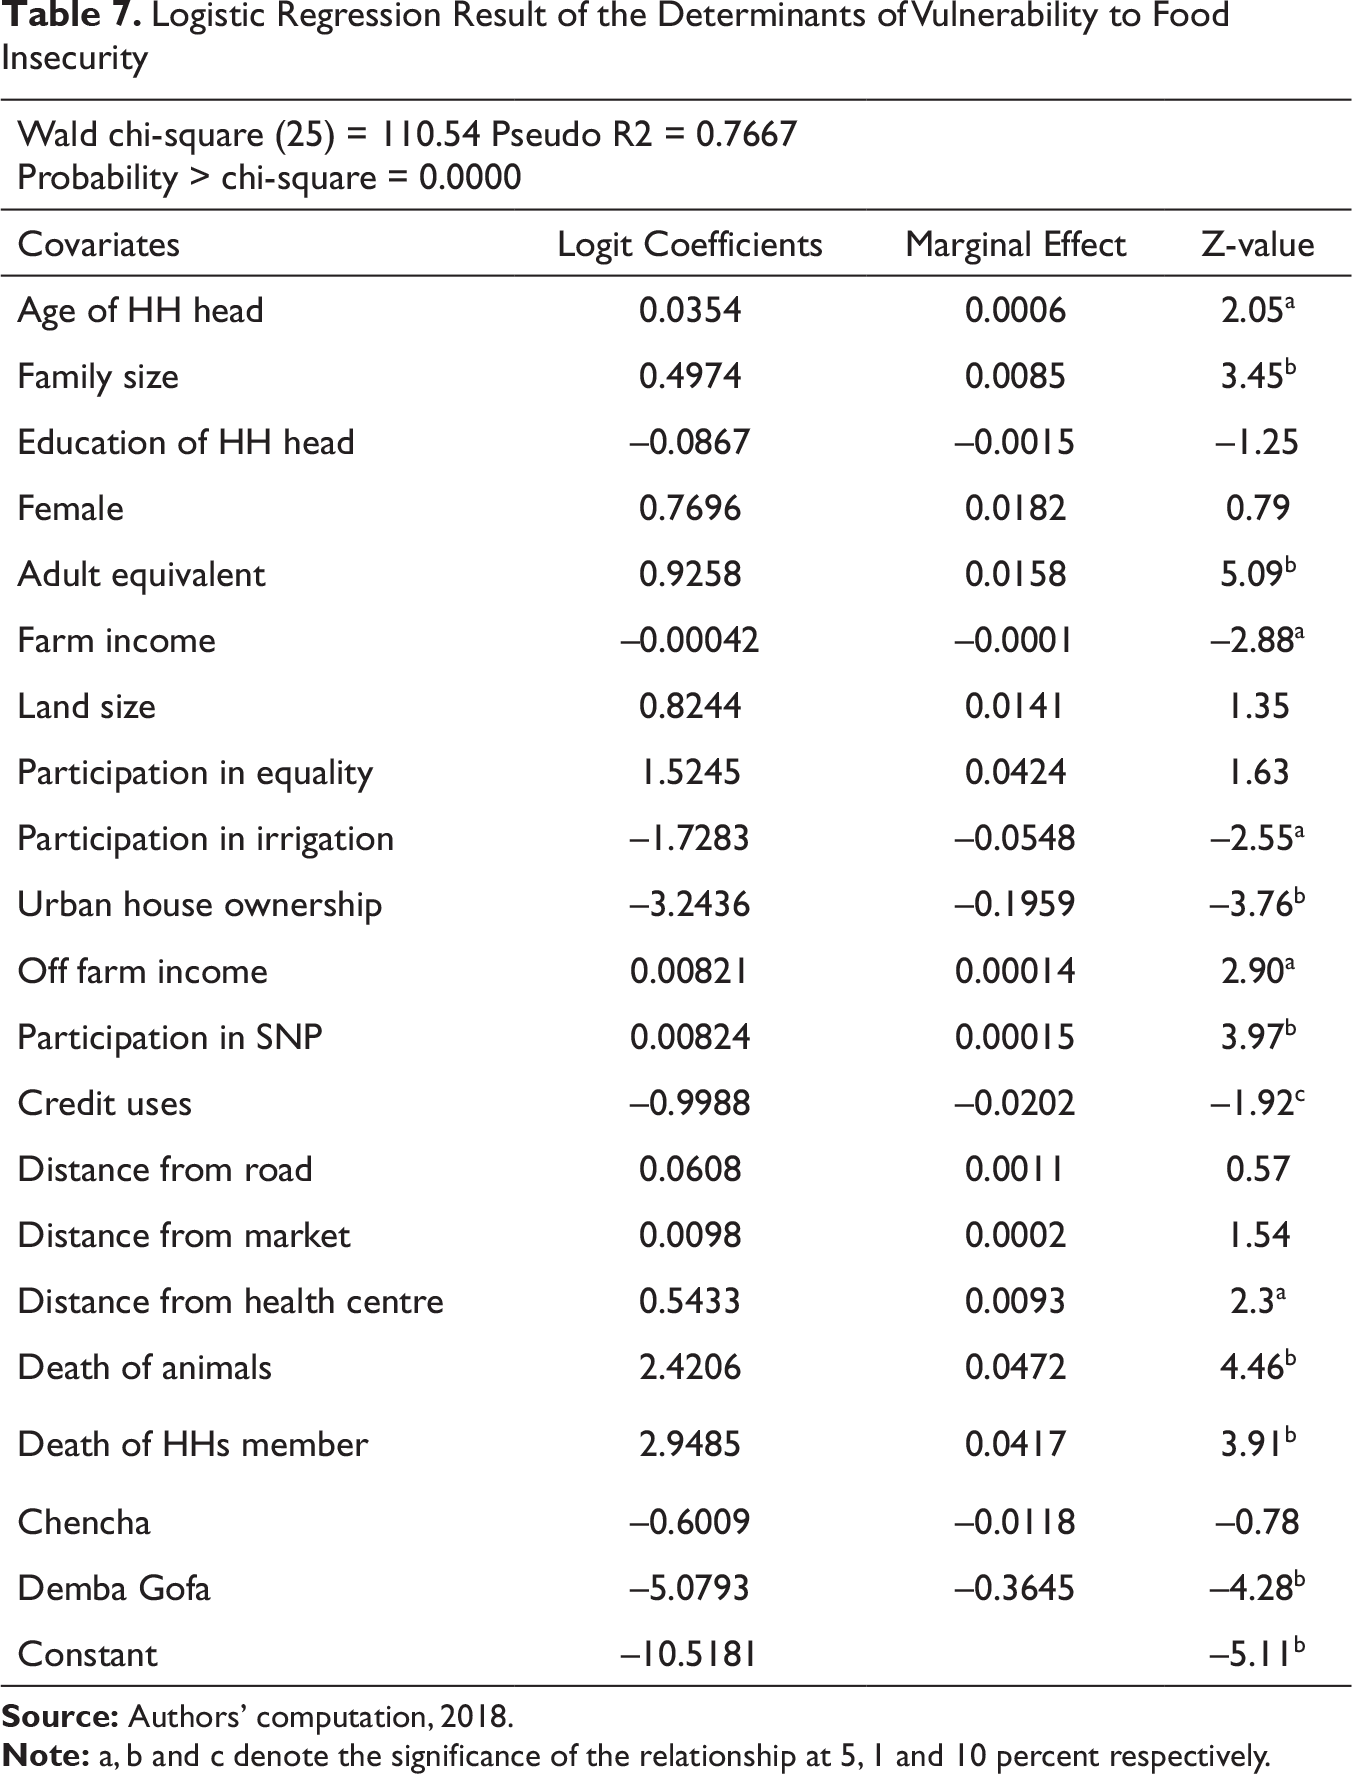
To examine the possible determinants of vulnerability to food insecurity in the study areas, the dependent variable was vulnerability which assumes value of 1 if the household is vulnerable and 0 otherwise. Since the dependent variable is dichotomous, our preferred model to examine the determinants of vulnerability to food insecurity in this study is the logit model and the estimation results are presented in Table 7. Based on the analysis of theoretical and empirical literatures on the determinants of vulnerability to food insecurity, some variables were included as covariates in the estimation of the logit model. Result of the Wald test showed that at least one independent variable affect vulnerability to food insecurity since the probability of Wald statistics is less than 5 per cent. Though it is not dependable in maximum likelihood estimation, the pseudo , which is another overall test of significance, is also 76.67 per cent as indicated in Table 7.
As presented in Table 7, age of household head, family size, adult equivalent, off-farm income, participation in safety net programmes, distance from the health centre in kilometres, death of household members and death of animals statistically significantly increase vulnerability to food insecurity of rural households. However, farm income, participation in irrigation use, credit uses and area dummy for Demba Gofa district reduce statistically significantly the vulnerability to food insecurity of rural households as presented in Table 7. Age of household head carried a significant positive sign and this due to the fact that as the age of household head increases, some productive household members may leave their family due to education, marriage and other reasons. Studies conducted by Ahmed et al. (2018), Jemal (2014) and Tsegaye (2017) also found similar result.
The coefficient of family size is positive and statistically significant at 1 per cent level of significant. This implies that as family size increases, on average, vulnerability to food insecurity increases. This may be due to the fact that the larger the family size, the lower the resource and consumption per capita in rural areas. This result is in agreement with the food availability theory of migration which predicts that as family size increases, food availability decreases and this by itself will lead to lower resilience to food insecurity. In addition, this result is in agreement with studies conducted by Tsegaye (2017) and Kwadwo et al. (2013).
Logistic Regression Result of the Determinants of Vulnerability to Food Insecurity
Similarly, farm income of household and vulnerability to food insecurity are negatively and statistically significantly correlated as can be seen from Table 7. Food availability theory of food security predicts that farm income increases food availability at household level and decreases household food insecurity. In addition, the food entitlement theory of food security also states that farm income increases the access dimension of food security and reduces household food insecurity. Study conducted by (Ejigayhu, 2011) found negative and significant relationship between farm income and food insecurity.
Regarding the coefficient of credit use, it is negative and statistically significant at 10 per cent level of significance. This may be due to the fact that access to credit or credit use may affect both the food availability and food access dimensions of food security, thereby will reduce vulnerability of households to food insecurity. On the supply side, access to credit may increase agricultural investment by rural household and this by itself will lead to higher agricultural productivity and food supply. Study conducted by (Malla et al., 2017) obtained negative and significant association between credit use and food insecurity.
Unexpected shocks to rural households like the death of animals and death of household mem, also increase the probability of being food in secure in the future as indicated in Table 7 and the relationships are statistically significant at 1 per cent level of significance. This may be due to fact that such unexpected shocks may reduce both food availability and food access dimensions of rural households. Therefore, unexpected death of animals and household members will increase the probability of being food insecure in the future by decreasing income sources of households.
Quite unexpectedly, the coefficients of participation in safety net programme and off-farm income are positive and statistically significant at 1 per cent level of significance. This may be due to the fact that most of the participants in off-farm activities are food insecure in the study areas. For instance, from a total sample of 574 respondents in this study, 268 (47%) of respondents reported that they participate in off-farm activities. From 268 off-farm participants, 164 (61%) of the households are vulnerable to food insecurity. Regarding, participation in the safety net programme, participants may use the money obtained via the programme for unproductive activities rather than using the money for asset building.
In line with the descriptive results, households from Demba Gofa district are less vulnerable to food insecurity compared to households from Kamba district as the coefficient of the place dummy for Demba Gofa district is negative and statistically significant at 1 per cent level of significant. As indicated in Table 7, the vulnerability to food insecurity of households from Demba Gofa district is lower than the vulnerability to food insecurity of households from Kamba district, on average, by 36.45 per cent. At last, the diagnostic test results of the above model also revealed that there is no multicollinearity and model misspecification.
Conclusions
This study aimed at examining the level and determinants of households’ vulnerability to food insecurity in Southern Ethiopia using sample of 574 households and feasible generalised least square technique of estimation. Despite the existence of many empirical studies on ex-post analysis of food insecurity, evidences on ex-ante analysis of food insecurity are undocumented in Ethiopia in general and Southern Ethiopia in particular. Descriptive results indicated that the incidence, depth and severity of food insecurity were 68, 31 and 18 per cent respectively while vulnerability to food insecurity was 73.34 per cent in the study areas. The incidence, depth and severity of food insecurity were 73, 36 and 21 per cent respectively in Chencha (humid) district while the incidence, depth and severity of food insecurity were 77, 37 and 23 per cent respectively in Kamba (arid) district. In the same way the incidence, depth and severity of food insecurity were 52, 20 and 9.2 per cent, respectively in Demba Gofa (semi-arid) district. The mean level of vulnerability to food insecurity at Chencha, Kamba and Demba Gofa districts were 77, 84 and 55 per cent, respectively. The mean kilocalorie per adult equivalent per day at Chencha (humid), Kamba (arid) and Demba Gofa (semi-arid) districts were 1,911.6, 1,679.2, and 2,554.2, respectively. Similarly, the mean kilocalorie deficiency gap in the study areas was 682 Kcal per adult equivalent per day. More specifically, mean level of calorie deficiency gaps which would be needed to list households out of food insecurity were 506, 462 and 440 Kcal per adult equivalent per day at Kamba, Chencha and Demba Gofa districts, respectively.
Therefore, this study suggested that vulnerability to food insecurity is more widespread than food insecurity in Sothern Ethiopia. Specifically, both ex-ante food insecurity and the ex-post food insecurity are more spread in Kamba (arid) district. Though Kamba district is known by its irrigation potential compared to other districts in Gamo Gofa zone, the district is still characterised by high level of current and future incidences of food insecurity due to the absence of irrigation infrastructures in the area. In addition, from a total of 182 currently food secure sample households, about 47 (8.2%) of sample households were vulnerable to food insecurity while from a total of 392 currently food insecure sample households, about 18 (3%) of sample households are not vulnerable to food insecurity in the study area. Results of logistic regression revealed that the age of household head, family size, off-farm income, participation in safety net programme, distance from health centre, and death of household members significantly increase households’ vulnerability to food insecurity. But farm income, irrigation use, and credit use significantly decrease households’ vulnerability to food insecurity.
Hence, the government may help rural households to gather more resources and reduce vulnerability to food insecurity via better access to credit, infrastructure, irrigation uses, and population control. Hence, to reduce the vulnerability of rural households to food insecurity, the government needs to provide credit, viable off farm employment, small scale irrigation services and road networks to rural poor. In addition, government would better improve access to land by rural landless households through improved land markets. Population control via female education and family planning would increase both resource per capita and consumption per capita and will lead to lower food insecurity in rural areas.
Footnotes
Acknowledgements
First, we want to express our gratitude to Arba Minch University for its financial and logistic supports to complete this. Second, we also extend our thanks to Melkamu Mada (PhD) and Mesfin Menza (PhD) for their valuable and constructive comments on this article. Finally, we want to extend our gratitude to data collectors at Chencha, Kamba and Gemba Gofa districts for their time and efforts to provide us with dependable data.
Declaration of Conflicting Interests
The authors declared no potential conflicts of interest with respect to the research and publication of this article.
Funding
The authors received financial support to conduct this research only from Arba Minch University.