
Abstract
Purpose:
Given limited measurement of intersectional microaggressions among those who identify as lesbian, gay, bisexual, transgender, queer, or additional sexual or gender minority (LGBTQ+) identities and as people of color (POC), this study tested whether differences exist in the factor structure of the LGBT People of Color Microaggression Scale (LGBT-PCMS) between Latina/o/x and non-Latina/o/x POC groups.
Methods:
Using Amazon’s Mechanical Turk, a sample of 491 LGBTQ+ Latina/o/x people and non-Latina/o/x POC (mean age = 29.66 ± 7.60) completed an online survey in December 2018, assessing psychosocial variables, intersectional minority stress measured via the LGBT-PCMS, and perceived stress. Hierarchical confirmatory factor analyses (CFA) assessed the fit of the LGBT-PCMS, with its three subscales specified as first-order latent factors and intersectional minority stress as a second-order latent factor. Invariance testing compared a second-order factor structure of the LGBT-PCMS between LGBTQ+ Latina/o/x people (n = 244) and LGBTQ+ non-Latina/o/x POC (n = 247) groups. Structural equation modeling was used to examine convergent validity with the perceived stress subscales.
Results:
Findings from the second-order CFA showed that the LGBT-PCMS demonstrated acceptable fit across the full sample, LGBTQ+ Latina/o/x people, and LGBTQ+ non-Latina/o/x POC. Full invariance was demonstrated between LGBTQ+ Latina/o/x people and LGBTQ+ non-Latina/o/x POC groups. No link between the LGBT-PCMS and perceived stress subscales emerged.
Conclusion:
The LGBT-PCMS was indistinguishable between LGBTQ+ Latina/o/x people and LGBTQ+ non-Latina/o/x POC, supporting that the LGBT-PCMS can be used as a single measure of intersectional minority stress or separate subscales.
Keywords
Introduction
With the extension of the minority stress model to lesbian, gay, bisexual, transgender, queer, or additional sexual or gender minority (LGBTQ+) individuals who also identify as people of color (POC), research on LGBTQ+ POC health disparities has grown substantially.1–7 This work emphasizes intersectional minority stress (IMS), 6 with scholars calling for its measurement in health research and greater attention to these experiences among LGBTQ+ POC.8–10 The Williams Institute estimates 2.3 million LGBTQ+ Latina/o/x individuals in the U.S., 11 a number projected to rise with increasing LGBTQ+ identification in this population.12,13 As a distinct group, LGBTQ+ Latina/o/x people face heightened marginalization and rising hate crimes,14,15 contributing to adverse health outcomes.16,17
As a social determinant of health, racial/ethnic discrimination plays a critical role in the relationship between stress and health for LGBTQ+ Latina/o/x people. They experience unique forms of subtle racial/ethnic discrimination, including assumptions about intelligence, pathologizing of cultural values/communication, treatment as second-class citizens, stereotypes about shared experiences, and invalidations due to accents. 18 This also includes more blatant discrimination, such as being treated as not “American enough,” being exoticized/sexually fetishized, and assumptions of criminality/criminal behavior. 19
Second, racialized anti-Latina/o/x sentiments and anti-immigrant policies create unique sources of stress for Latina/o/x people by directly targeting who they are. 20 Although not new, 21 the inhumane immigration enforcement under the 47th presidential administration further brings to light the unique sociopolitical stressors that shape the lived realities and health of Latina/o/x people. To this end, these unique experiences of racial/ethnic discrimination could impact them differently compared with non-Latina/o/x POC. 22
LGBTQ+ Latina/o/x people face an even more distinct blend of IMS compared with non-LGBTQ+ Latina/o/x people. Their sociocultural experiences are intertwined with racial/ethnic discrimination from the dominant groups and from their LGBTQ+ peers; their socialization as a Latina/o/x person, including gender norm expectations (e.g., expectations of masculine behavior and the subordination of women and femininity due to cultural values of machismo/caballerismo and marianismo); negative perceptions of LGBTQ+ identities within their Latina/o/x communities; and shame that can arise from anti-LGBTQ+ religious messaging from their Latina/o/x communities and familial upbringing. 23 Acculturation, trauma, and immigration can also significantly shape the ways in which LGBTQ+ Latina/o/x individuals experience IMS.24,25
Although sociocultural factors likely shape IMS among LGBTQ+ Latina/o/x individuals compared with non-Latina/o/x POC, no studies examine how these factors affect measurement, limiting the development of tailored IMS scales. 26 Despite this, the LGBT People of Color Microaggressions Scale (LGBT-PCMS) is increasingly used in Latina/o/x samples.27–33 The LGBT-PCMS captures nuanced psychosocial experiences among LGBTQ+ POC,27,34 yet its application lacks consistency: some studies sum its three subscales,28,29,32,35 whereas others model IMS as a latent construct.24,30,36 Evidence on its factor structure is also mixed, with some supporting a three-factor model 37 and others not. 38 This inconsistency hinders comparability and limits clear conclusions about the measure’s structure in research with LGBTQ+ Latina/o/x populations.28–33,35
Few studies examine measurement invariance (MI) of the LGBT-PCMS among LGBTQ+ Latina/o/x versus non-Latina/o/x groups. Although not designed for adolescents, Caba et al. found the racism subscale fully invariant by race/ethnicity among youth aged 13–17. 39 They reported partial invariance for the heterosexism in communities of color and LGBT relationship racism subscales. Huynh et al. observed partial invariance by race/ethnicity among LGBTQ+ POC adults. 38 In testing the LGBTQ+ PCMS-2, they found overall invariance across race/ethnicity, although some fit indices were suboptimal. 38
Despite representing 20% of LGBTQ+ individuals, 11 no studies test MI of the LGBT-PCMS comparing Latina/o/x individuals with non-Latina/o/x POC. Caba et al.’s sample included many Latina/o/x participants but focused on adolescents, 39 whereas Huynh et al.’s adult Latina/o/x sample was small, including in the LGBTQ+ PCMS-2.38,40 We argue that Latina/o/x populations experience distinct IMS shaped by racialized socialization, 23 potentially affecting measurement.
Objectives/Purpose
There is uncertainty regarding how the LGBT-PCMS measures IMS for LGBTQ+ Latina/o/x and LGBTQ+ non-Latina/o/x POC groups. The first aim of our study was to examine whether there is MI for the LGBT-PCMS between LGBTQ+ Latina/o/x people and LGBTQ+ non-Latina/o/x POC (see Fig. 1). Our second aim was to examine the convergent validity between IMS and measures of general perceived stress.
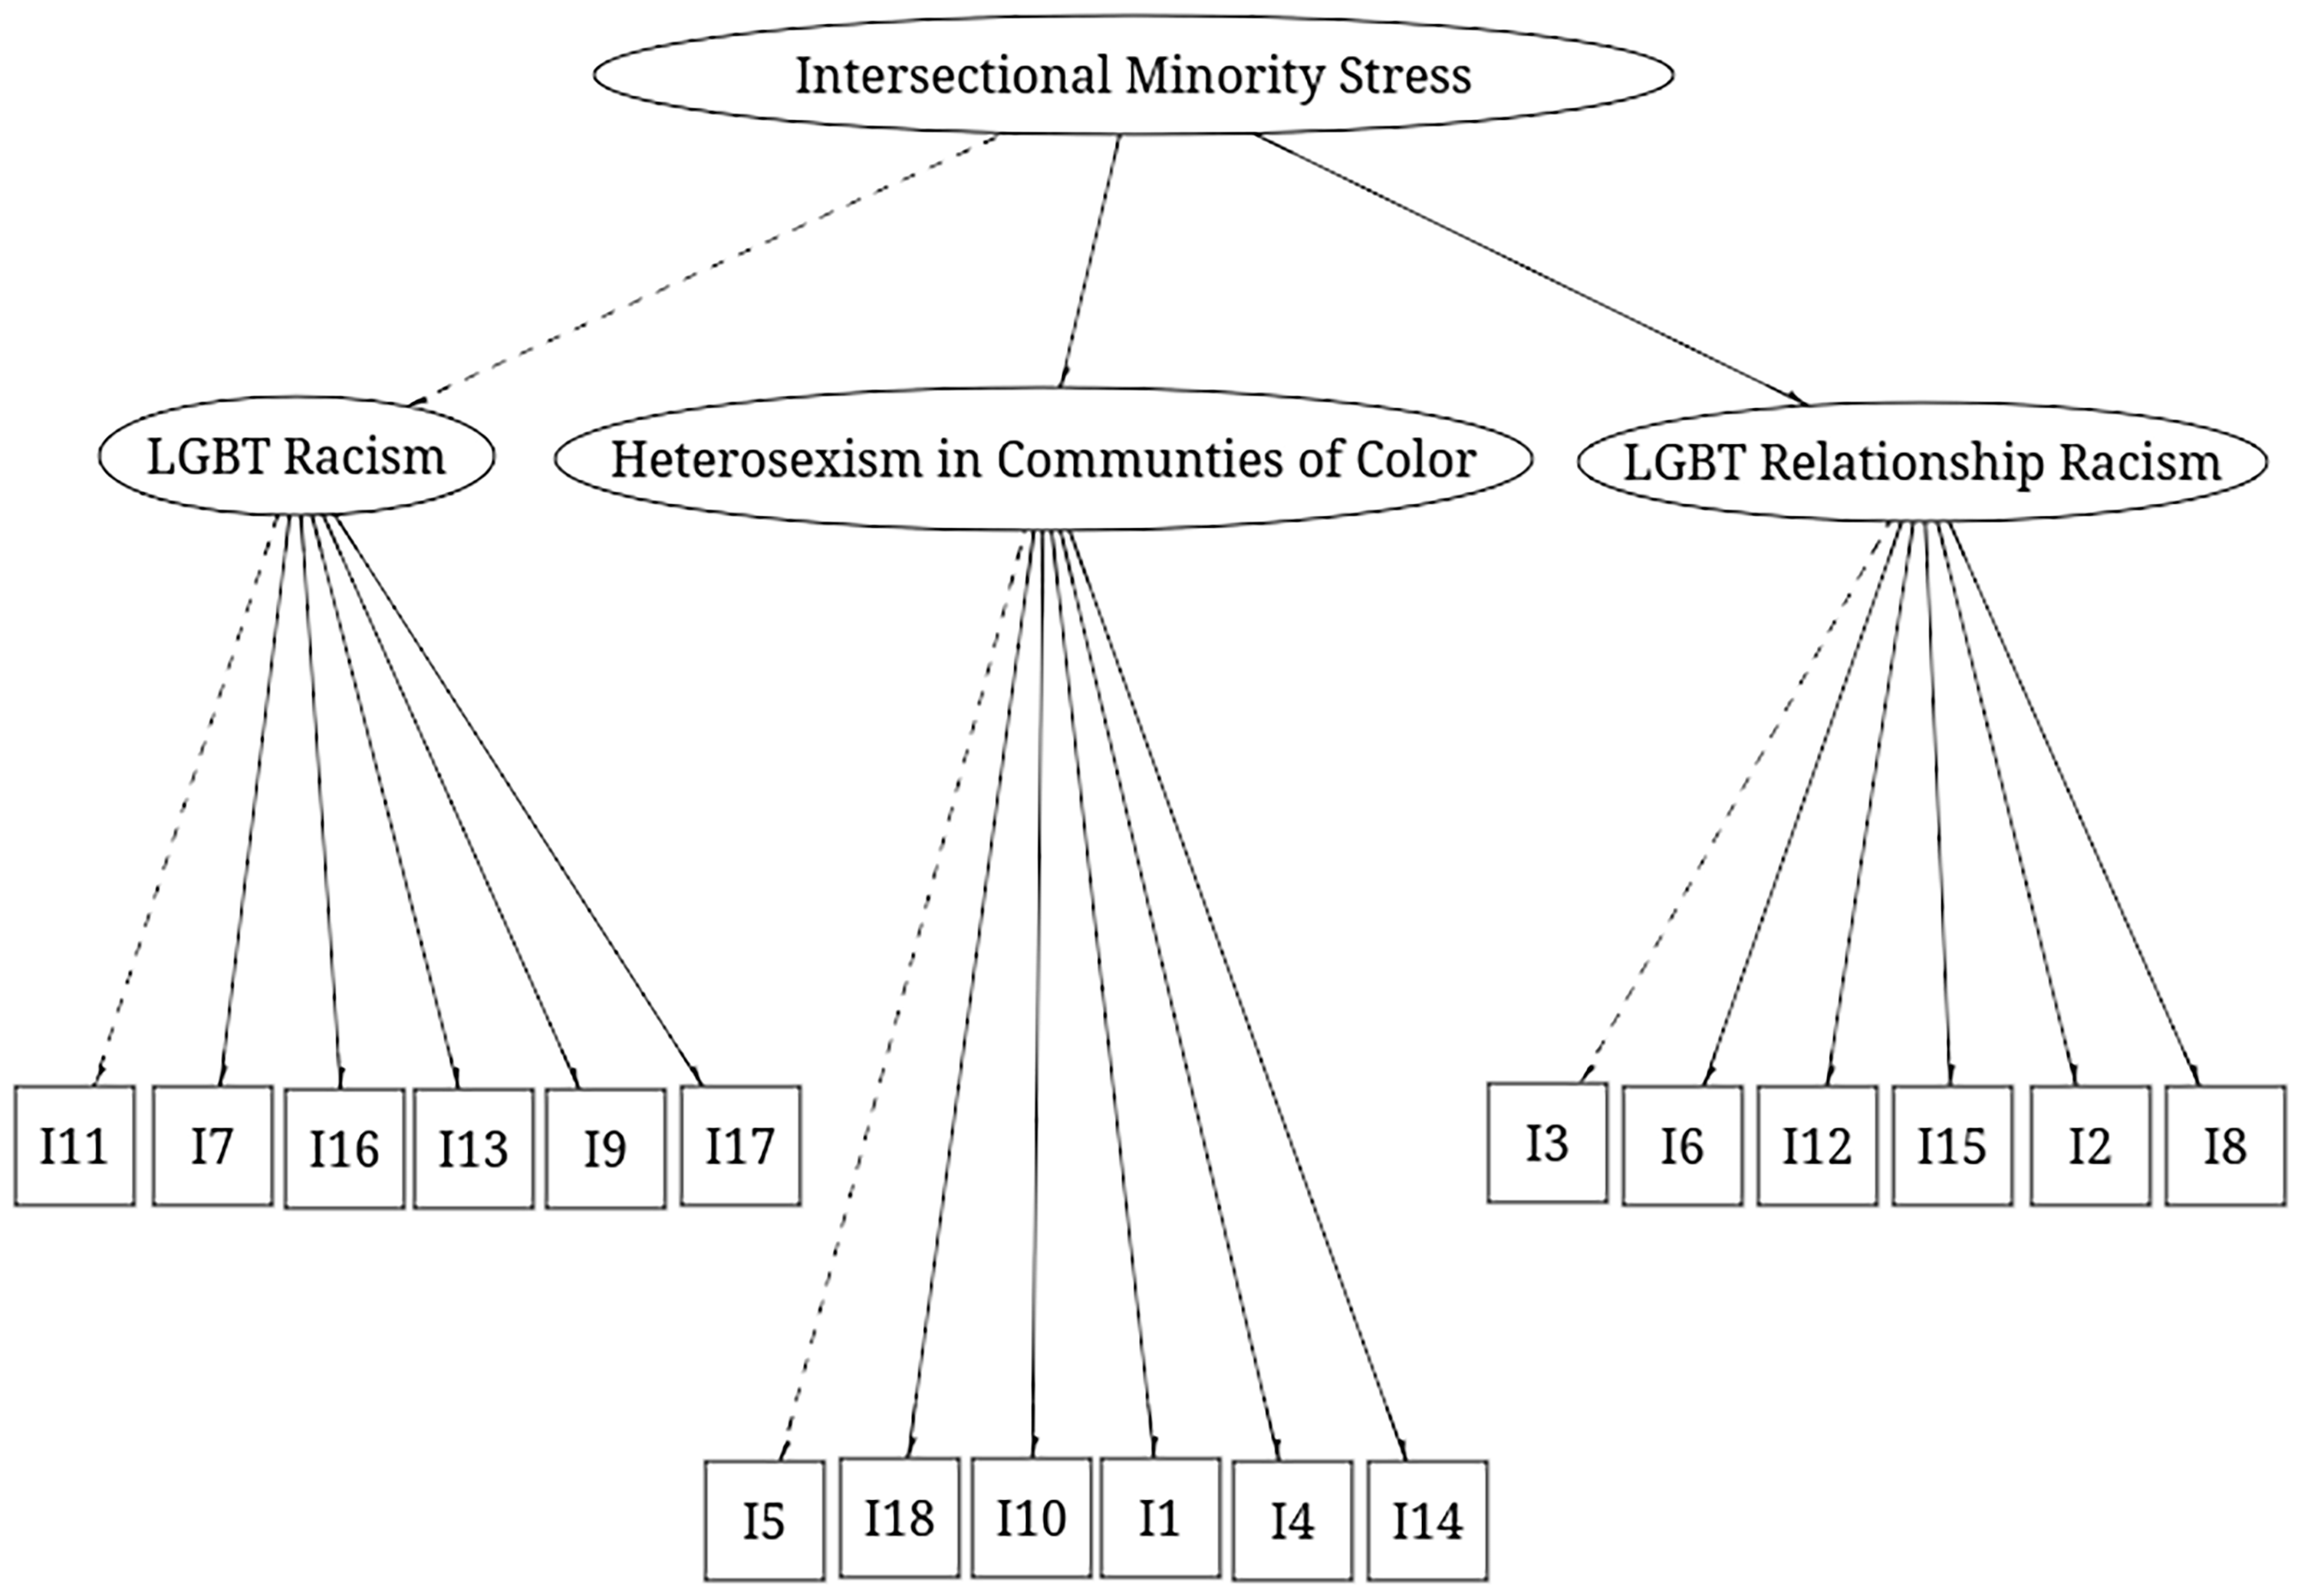
Hierarchical Confirmatory Factor Analysis Modeled for the lesbian, gay, bisexual, transgender, queer, or additional sexual or gender minority Latina/o/x and non-Latina/o/x People of Color Samples and Measurement Invariance Testing. I, item number which corresponds with item number in Table 2. Dashed lines indicate marker indicators.
Methods
Participants
Participants were recruited in December 2018 using Amazon Mechanical Turk (MTurk). After consenting to participate, we asked participants to answer two screening questions to ensure they identified as LGBTQ+ Latina/o/x or LGBTQ + non-Latina/o/x POC; if they answered no to either question, they were directed to the end of the survey. Their race, ethnicity, sexual orientation, and gender identities were further confirmed when they answered questions after the demographics. Our final sample was comprised of 491 LGBTQ+ Latina/o/x persons and LGBTQ+ non-Latina/o/x POC aged 18–69 years (mean = 29.66, standard deviation = 7.60) after removing nine participants.
Procedure
Informed consent was obtained before the survey. After completion, participants were directed to MTurk for compensation of $0.10, consistent with other studies that require a similar amount of time. 41 To filter bots, only participants with a task completion rate of 95% or higher were allowed to take the survey, as this yields better data quality. 42 This study was reviewed and approved on November 29th, 2018 by the Institutional Review Board of the University of La Verne (Protocol #: 2018-94-CAS), where the second author held a previous academic appointment.
Measures
Demographic information. Participants filled out demographic information. This included relationship status, current human immunodeficiency virus (HIV) status, residential environment, ethnicity, race, sexual orientation, and gender identity (see Table 1).
Demographic Characteristics of the Full Sample (N = 491)
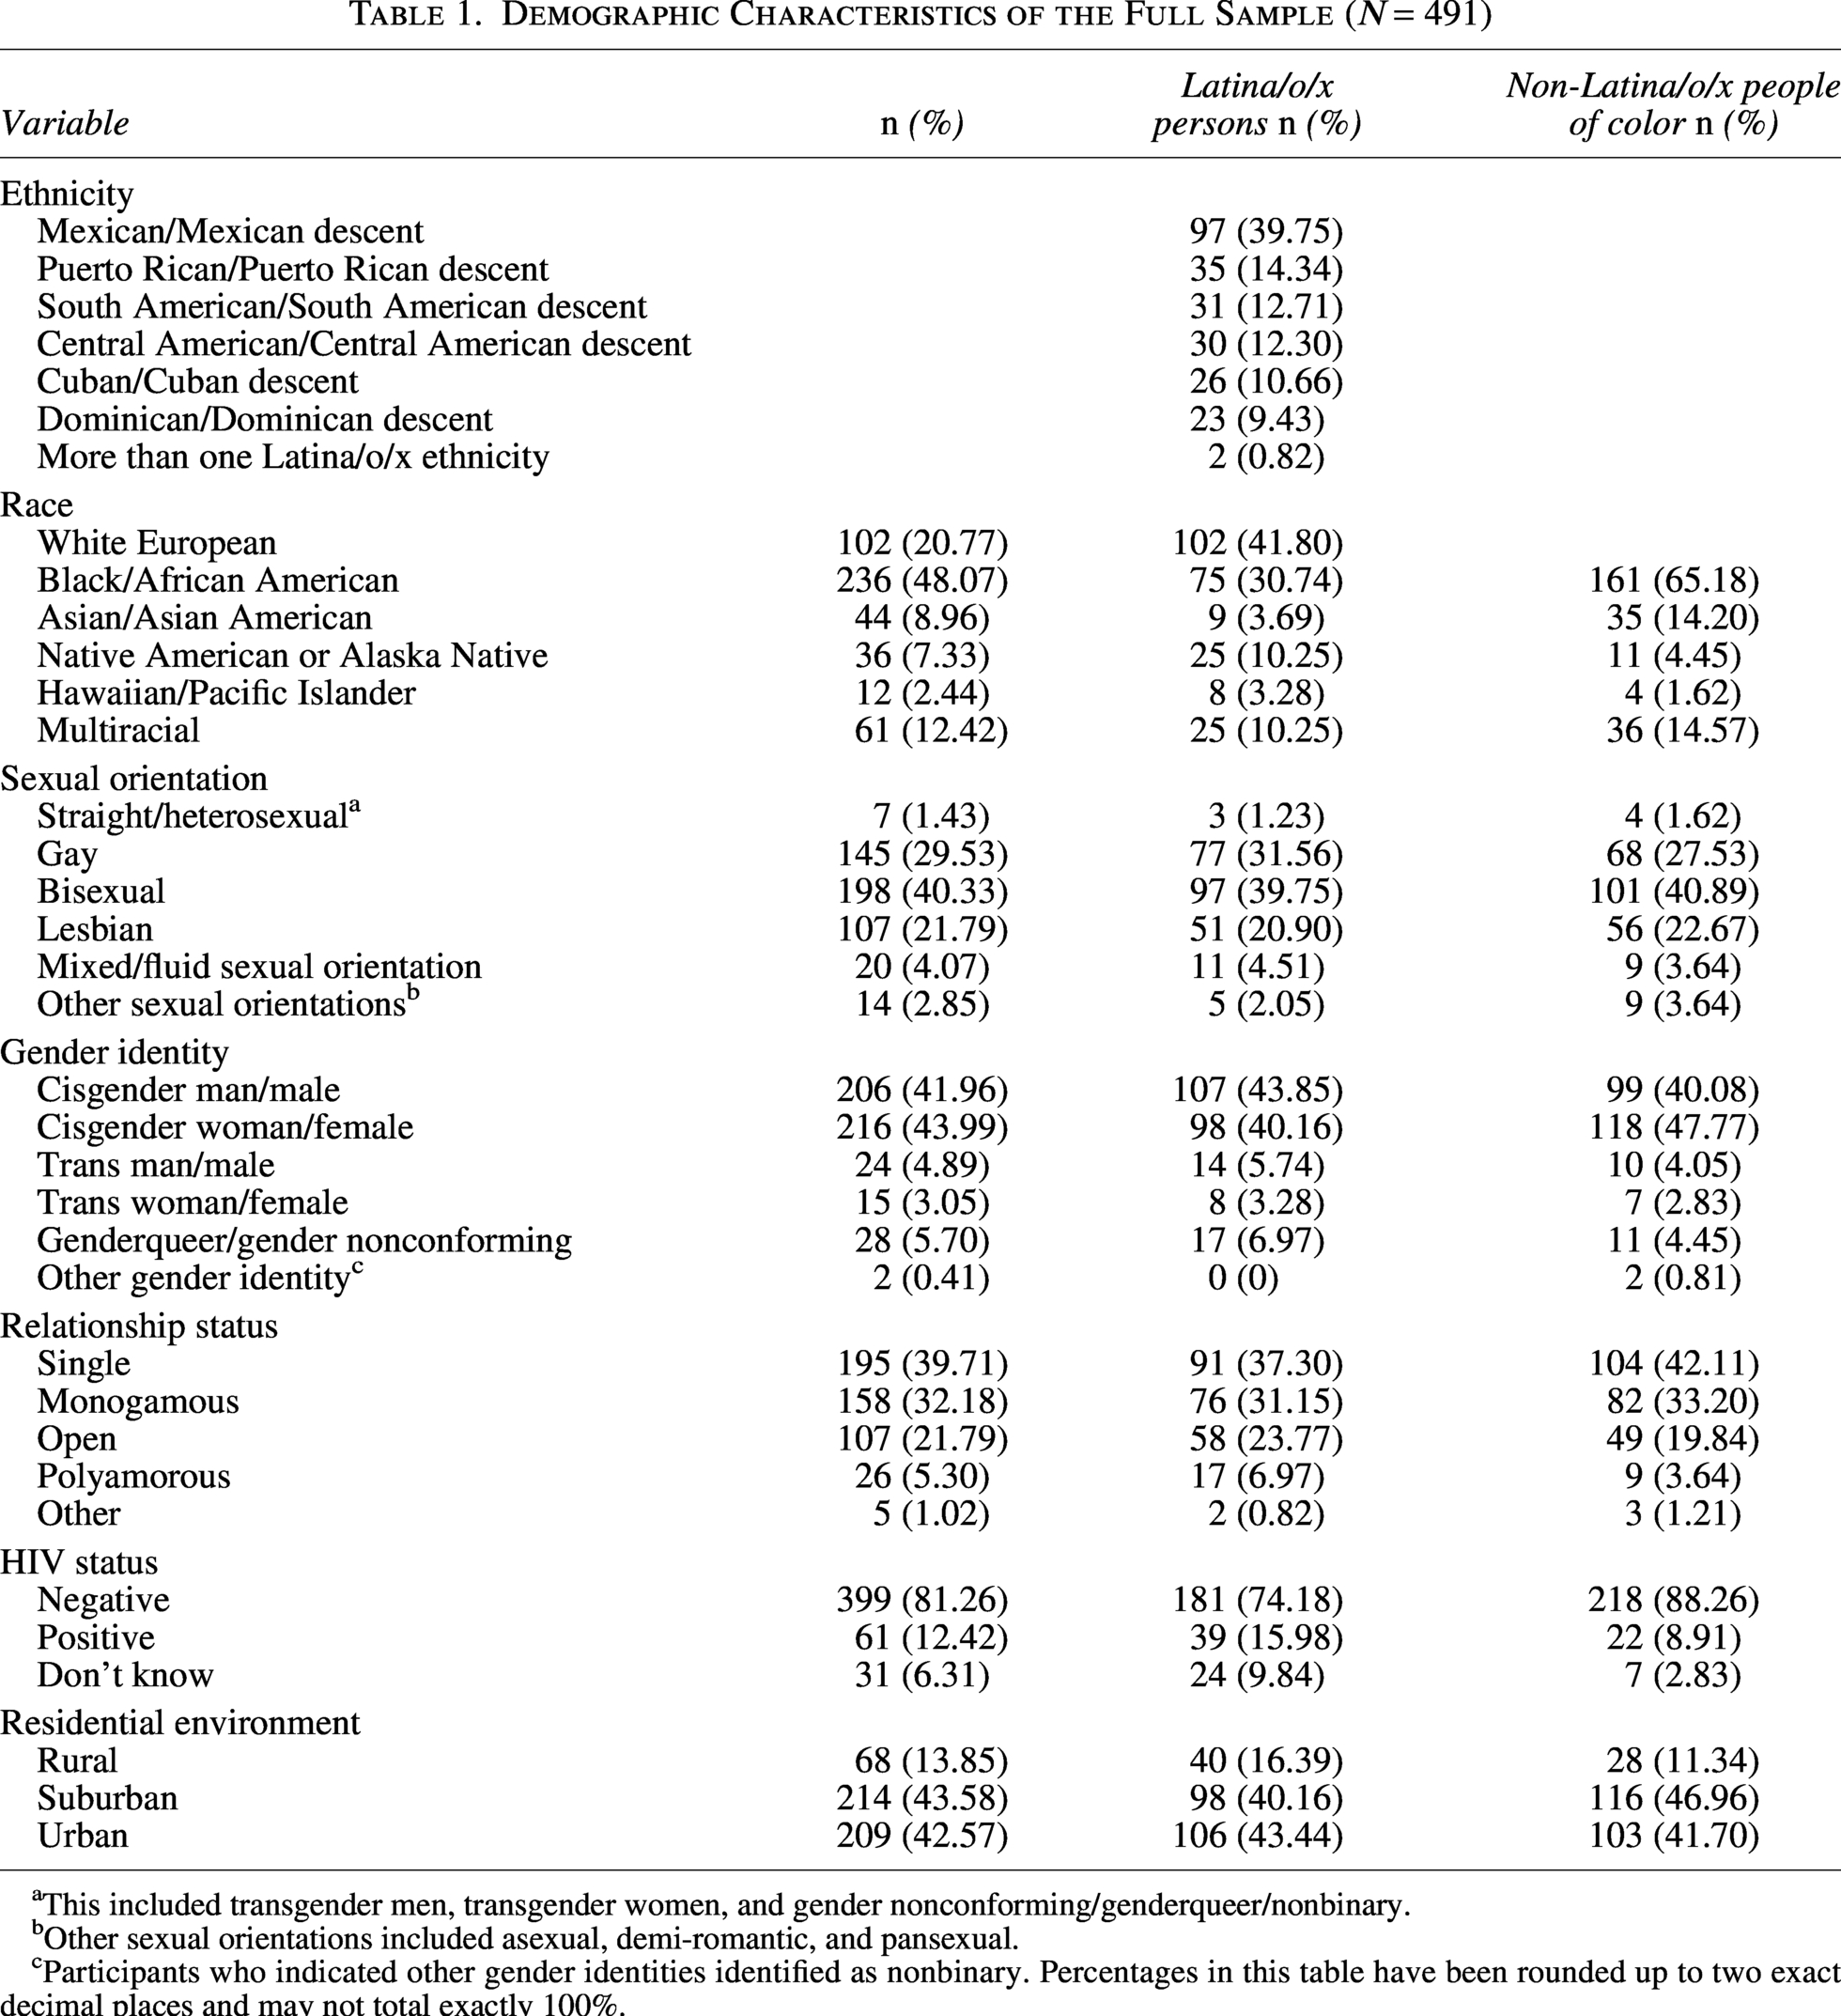
This included transgender men, transgender women, and gender nonconforming/genderqueer/nonbinary.
Other sexual orientations included asexual, demi-romantic, and pansexual.
Participants who indicated other gender identities identified as nonbinary. Percentages in this table have been rounded up to two exact decimal places and may not total exactly 100%.
Sexual orientation and gender identity. Sexual orientation and gender identity (SOGI) were assessed using the recommendations of The Williams Institute. 43 Sexual orientation was assessed via “Do you think of yourself as…” which allowed respondents to choose the following options: straight/heterosexual, gay, lesbian, bisexual, or other. We added one last sexual orientation option to our survey: mixed/fluid. Gender identity was assessed with “How do you describe your gender identity?” Possible options included cisgender man/male, cisgender woman/female, trans man/male, trans woman/female, genderqueer/gender nonconforming, or a different identity (e.g., nonbinary). If participants listed a different identity, they were asked to write this option as a text response (see Table 1).
Race and ethnicity. This variable was assessed in accordance with modified federal guidelines. 44 Participants were asked to self-report their ethnicity with the question “What is your ethnicity?” which had the following options: Not Latino/a/x or Latino/a/x. Next, participants were asked about their race via the item “What is your race? (Check all that apply)” and were given the following options: White European, Black/African American, Native American or Alaska Native, Hawaiian or Pacific Islander, and Asian/Asian American. Respondents who marked more than two racial groups were coded as Multiracial (see Table 1). For our analyses, individuals who identified as Latina/o/x, regardless of their racial background, were coded as Latina/o/x. Those who answered that they were not Latina/o/x were then coded as non-Latina/o/x POC.
LGBT-PCMS. The LGBT-PCMS is an 18-item self-report measure of IMS assessed by three subscales: (1) LGBT racism, (2) Heterosexism in communities of color, and (3) LGBT relationship racism. 27 Items are rated on a 6-point Likert scale (0 [Did not happen/Not applicable to me] to 5 [It happened, and it bothered me Extremely]). The total score and three subscales had adequate reliability (see Table 2).
Perceived stress. This was measured using the 10-item Perceived Stress Scale (PSS-10). 45 We used the two subscales (perceived helplessness and self-efficacy) from the PSS-10, which have shown validity and reliability in Latina/o/x persons, 46 compared to the full PSS-10. 47 Items are scored on a five-point Likert scale (0 [Never] to 4 [Very Often]). Reliability was adequate (perceived helplessness α = 0.87 and self-efficacy α = 0.78).
Reliability Estimates and Confirmatory Factor Analysis of the Full Sample, Stratified by Lesbian, Gay, Bisexual, Transgender, Queer, or Additional Sexual or Gender Minority Latina/o/x and Non-Latina/o/x People of Color Groups
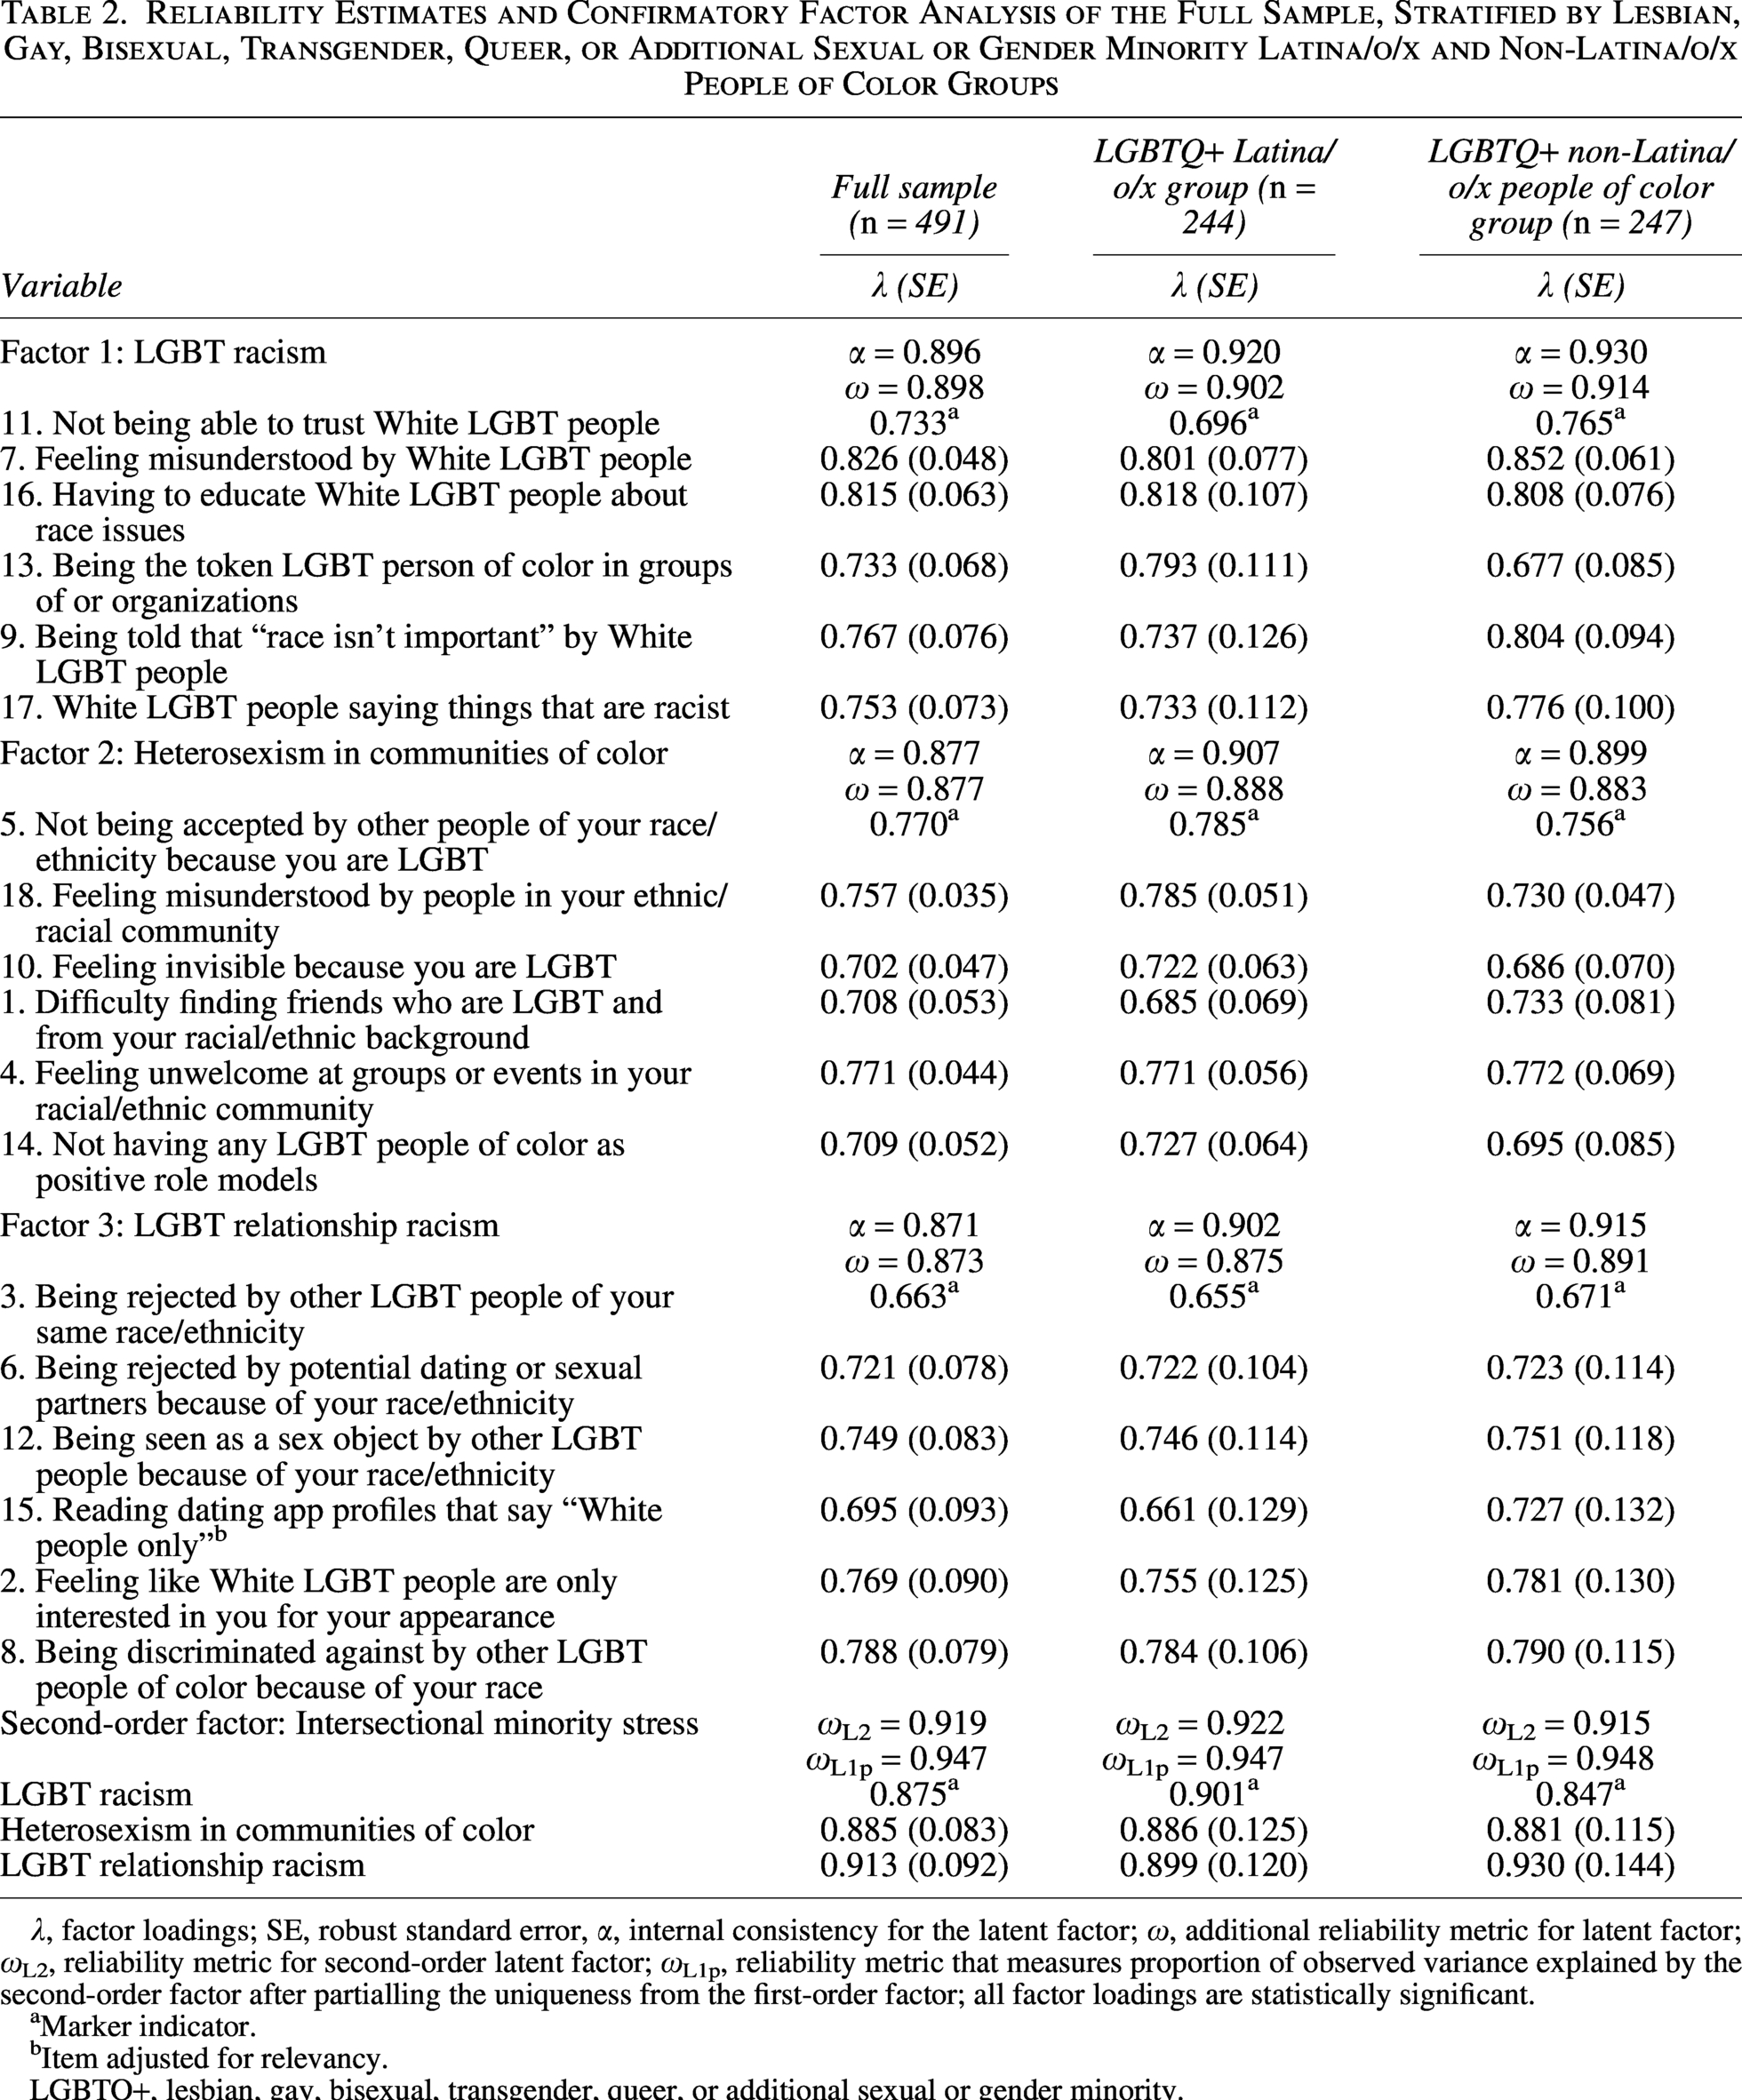
λ, factor loadings; SE, robust standard error, α, internal consistency for the latent factor; ω, additional reliability metric for latent factor; ωL2, reliability metric for second-order latent factor; ωL1p, reliability metric that measures proportion of observed variance explained by the second-order factor after partialling the uniqueness from the first-order factor; all factor loadings are statistically significant.
aMarker indicator.
bItem adjusted for relevancy.
LGBTQ+, lesbian, gay, bisexual, transgender, queer, or additional sexual or gender minority.
Data analysis
All analyses were conducted using R. 48 Listwise deletion was used to account for missing data. Hierarchical confirmatory factor analyses (CFAs) were conducted to examine the LGBT-PCMS factor structure for both the full sample and the LGBTQ+ Latina/o/x people and LGBTQ+ non-Latina/o/x POC samples. Figure 1 presents the CFA models tested using maximum likelihood with robust standard errors (MLR) estimation, where the LGBT-PCMS is referred to as IMS as the second-order latent factor and the three subscales are represented as first-order latent factors.
Although Balsam et al. treated items as ordinal, 27 MLR was used as a robust version of the most commonly used estimation method and the default for several software packages while yielding similar findings to ordinal estimation methods, 49 particularly with five or more response options.50,51 We used recommendations from Putnick and Bornstein, including comparative fit index (CFI; acceptable > 0.90; good > 0.95), root mean square error of approximation (RMSEA; unacceptable > 0.10; good fit < 0.06), and standardized root mean squared residual (SRMR; good < 0.05) for the CFA and structural equation modeling (SEM). 52
Comparisons of the LGBT-PCMS hierarchical factor structure between LGBTQ+ Latina/o/x persons and LGBTQ+ non-Latina/o/x POC were tested through MI. Constraints at each level of MI (i.e., configural, metric, scalar, and strict invariance) were tested sequentially, where partial invariance was established if invariance was not met.52,53 Latent means were compared between the LGBTQ+ Latina/o/x people and LGBTQ+ non-Latina/o/x POC groups, with effect sizes being quantified using Cohen’s d. Each step of invariance testing was evaluated by assessing the chi-square change (Δχ2) for statistical significance relative to the change in degrees of freedom in model comparisons, 53 along with changes in CFI (metric = ≤ 0.010, scalar/strict = ≤ 0.010), RMSEA (metric = ≤ 0.015, scalar/strict = ≤ 0.015), and SRMR (metric = ≤ 0.030, scalar/strict = ≤ 0.010) indicating invariance. 54
To test convergent validity, structural equation modeling (SEM) was used to examine the associations of IMS and the PSS-10 subscales. These associations were compared between LGBTQ+ Latina/o/x people and LGBTQ+ non-Latina/o/x POC using multigroup SEM. Group differences were detected by a significant chi-square test between the freely estimated model and the model constraining the intercept and regression paths.
Although not the aim of this study, we conducted exploratory analyses using a bifactor CFA to examine the factor structure and MI for SOGI groups. For the sexual orientation groups, we compared groups based on sexual orientation and sex assigned at birth. For invariance testing, we compared gay men with bisexual men and lesbian women with bisexual women. For the gender identities, we compared cisgender men, cisgender women, and transgender individuals (see Supplementary Data and Supplementary Tables S1, S2, S3, S4, S5, S6, and S7).
Results
To test for a hierarchical structure of the LGBT-PCMS in the full sample, an initial CFA was performed, which showed acceptable fit: χ2(132) = 351, p < 0.001; CFI = 0.943; RMSEA = 0.067, 90% confidence interval (CI): 0.059–0.076; SRMR = 0.043. Model fit was good for the LGBTQ + Latina/o/x group (χ2(132) = 210, p < 0.001, CFI = 0.959, RMSEA = 0.056, 90% CI: 0.041–0.07, SRMR = 0.041) and acceptable for the LGBTQ + non-Latina/o/x POC group (χ2(132) = 268, p < 0.001, CFI = 0.931, RMSEA = 0.075, 90% CI: 0.062–0.088, SRMR = 0.057). The factor loadings and reliability estimates revealed a hierarchical structure with acceptable fit for the first- and second-order latent factors (see Table 2).
Testing the bifactor CFA indicated a better fit than the hierarchical CFA (χ2(15) = 40.28, p < 0.001) for the full sample. However, there were large standard errors, “vanishing” of the LGBT relationship racism subscale variance (ᴪ = 0.003, p = 0.925), and non-convergence (see Supplementary Data). This suggests model under-identification.
Table 3 presents the fit for each level of MI testing, along with the differences in model fit indices. There were no statistically significant differences between MI levels when comparing LGBTQ+ Latina/o/x persons and LGBTQ+ non-Latina/o/x POC groups. When comparing latent means, no statistically significant differences were found between the two groups, with negligible effect sizes observed (see Table 4).
Measurement Invariance Findings Between Lesbian, Gay, Bisexual, Transgender, Queer, or Additional Sexual or Gender Minority Latina/o/x and Non-Latina/o/x People of Color Groups
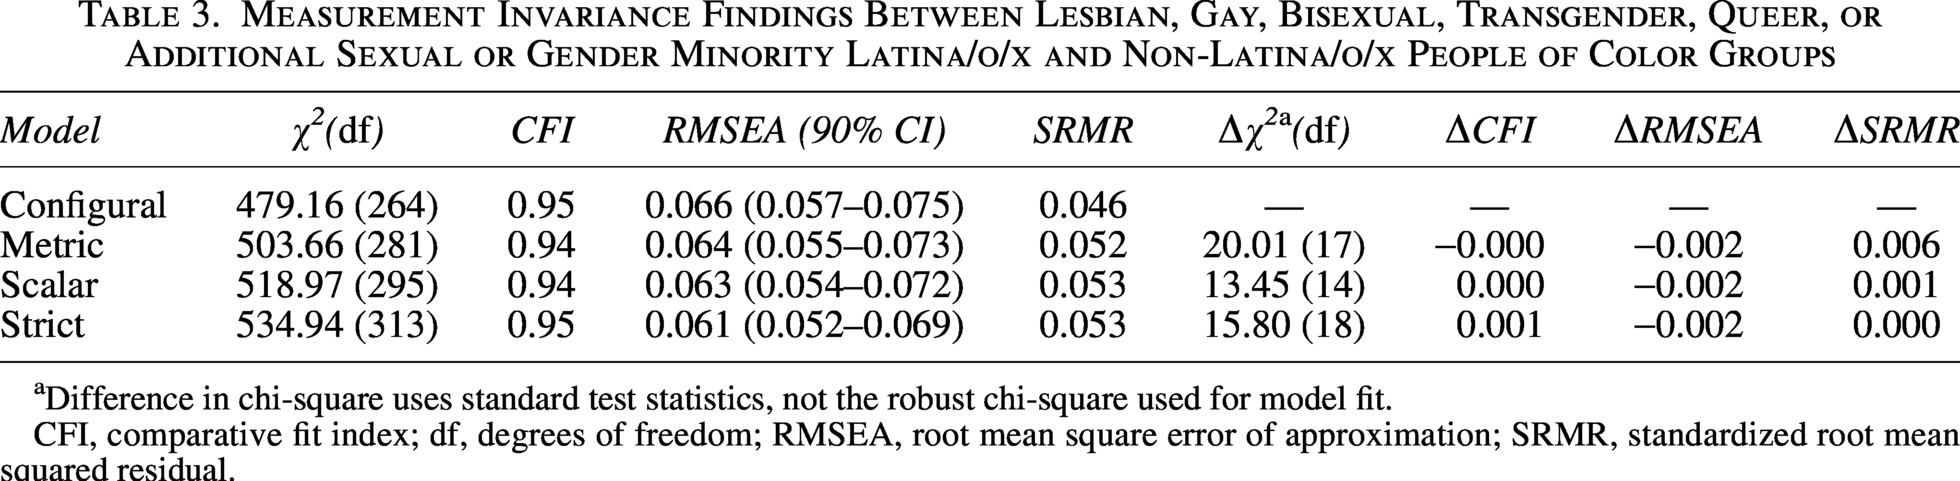
Difference in chi-square uses standard test statistics, not the robust chi-square used for model fit.
CFI, comparative fit index; df, degrees of freedom; RMSEA, root mean square error of approximation; SRMR, standardized root mean squared residual.
Means, Standard Deviations, and Effect Size in Latent Means Between Lesbian, Gay, Bisexual, Transgender, Queer, or Additional Sexual or Gender Minority Latina/o/x and Non-Latina/o/x People of Color Groups
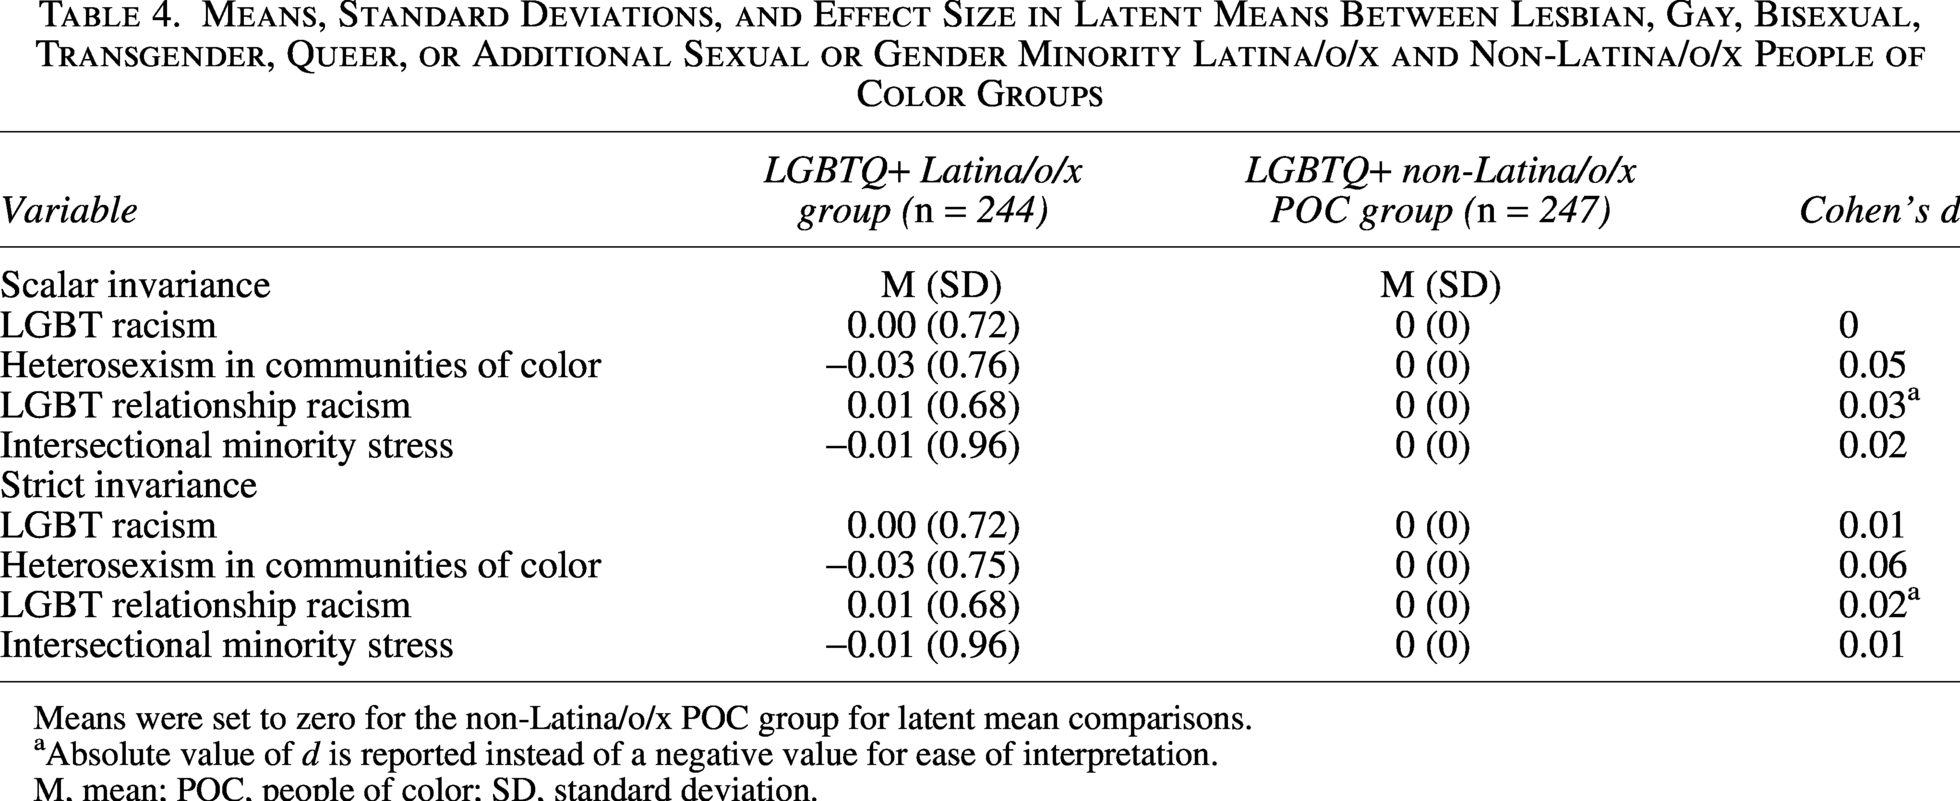
Means were set to zero for the non-Latina/o/x POC group for latent mean comparisons.
Absolute value of d is reported instead of a negative value for ease of interpretation.
M, mean; POC, people of color; SD, standard deviation.
Convergent validity was not attained, as IMS was not associated with perceived helplessness (b = −0.03, p = 0.912) or self-efficacy (b = −0.01, p = 0.967), although model fit was acceptable in the full sample (χ2(166) = 391.41; CFI = 0.944; RMSEA = 0.060, 90% CI 0.052–0.067; SRMR = 0.040). Differences were not found between the LGBTQ + Latina/o/x and the LGBTQ + non-Latina/o/x groups (χ2(18) = 13.91, p = 0.735).
Discussion
Our study investigated whether scores on the LGBT-PCMS work similarly for LGBTQ+ Latina/o/x people and LGBTQ+ non-Latina/o/x POC. These findings support the factorial validity of the LGBT-PCMS’ three-factor structure, 27 while extending IMS as a second-order factor in both groups. MI findings showed no differences between LGBTQ+ Latina/o/x people and LGBTQ+ non-Latina/o/x POC. We found that IMS was not linked to perceived stress.
From the CFA and corresponding MI analyses, the LGBT-PCMS showed acceptable fit in the full sample and in LGBTQ+ Latina/o/x and LGBTQ+ non-Latina/o/x groups, consistent with previous literature.27,37 The second-order factor was tested due to evidence of IMS being measured through a single construct rather than three subscales. Although limited, the second-order and general factors from the hierarchical CFA and bifactor CFA showed evidence for future practitioners and researchers to use IMS as the construct for this scale. This is reflected by previous literature indicating strong correlations between the LGBT-PCMS subscales (0.71–0.83) 37 and “vanishing” of variation when testing the bifactor CFA.
Furthermore, the LGBT-PCMS showed acceptable fit for LGBTQ+ Latina/o/x people and LGBTQ+ non-Latina/o/x POC with no differences across all levels of MI testing. What makes our findings unique is that we adjusted for previously overlooked factors in the published literature, including inappropriate estimation methods, 37 matching indicators to incorrect latent variables, 38 and testing latent variables separately. 39
We also examined latent means for the IMS and the corresponding subscales. The findings showed that they did not differ, suggesting that LGBTQ+ Latina/o/x people and LGBTQ+ non-Latina/o/x POC groups similarly experience these constructs. Previous MI studies with this measure in adult samples found partial invariance of the LGBT-PCMS within racial/ethnic groups, 38 some demonstrated varying levels of fit in their MI testing in adults, 40 whereas corrections were needed for the LGBT-PCMS in adolescents to attain partial invariance. 39 In contrast, our findings showed full invariance comparing LGBTQ+ Latina/o/x people and LGBTQ+ non-Latina/o/x POC.
Lack of differences between LGBTQ+ Latina/o/x people and LGBTQ+ non-Latina/o/x POC at the latent mean level suggests that these groups experience IMS similarly. These findings suggest that future analyses could analyze IMS collectively for these groups or compare these groups through composite scores to test associations within the minority stress model, such as with physical and mental health outcomes. Perhaps the LGBT-PCMS does not comprehensively capture the differences that may exist between these groups, such as heterosexism and cissexism in familial contexts, as measured by the new LGBTQ+ PCMS-2. 40 However, further validation of this measure is sorely needed.
Regarding convergent validity, our findings revealed no association between IMS and measures of perceived stress. This is inconsistent with previous literature on the associations of the LGBT-PCMS with psychological adjustment measures.27,37 The difference in findings may be the result of replicating the association of IMS and perceived stress 27 through the PSS-10 rather than the PSS-4. 47 The use of the PSS-10, including its subscales, to replicate the work of Balsam et al. who utilized the PSS-4, indicates that the PSS-10 serves as a comprehensive measure of perceived stress; this could explain the lack of evidence for convergent validity.47,55 Moreover, it could also be argued that perceived stress is an entirely different construct than IMS, in which case our null findings regarding convergent validity support this conjecture. Nonetheless, future studies should utilize appropriate mental health constructs to better test the minority stress model, 5 such as depressive symptoms, to parse out the associations between general stressors (i.e., perceived stress) and proximal and distal minority stressors (i.e., IMS). 56
Practical implications
Findings from this study have implications for researchers and practitioners working with LGBTQ+ Latina/o/x people and LGBTQ+ non-Latina/o/x POC. The LGBT-PCMS can be used with these groups to assess IMS. However, given null associations, clinicians must assess IMS and stress for LGBTQ+ Latina/o/x people and LGBTQ+ non-Latina/o/x POC separately, as these distinct constructs could have independent effects on LGBTQ+ Latina/o/x and LGBTQ+ non-Latina/o/x POC health, in line with evidence-based clinical assessment. 57
Limitations
First, the sample sizes for our LGBTQ+ Latina/o/x people and LGBTQ+ non-Latina/o/x POC groups were not as large as those in one invariance study 39 ; however, our groups were larger than those of Huynh et al. 40 Nevertheless, sample size is often not a significant factor in MI studies.undefined 53 Second, although precautions were taken, 42 recruiting from MTurk may result in non-representative samples that may conceivably not reflect our population of interest. Our sample was mostly cisgender sexual minority men and women of color; yet, qualitative differences in IMS exist for transgender POC, 58 with some indicating that the LGBT-PCMS does not reflect transgender POC IMS. 59 More research is needed to explore SOGI differences in the LGBT-PCMS (see Supplementary Data and Supplementary Tables S1, S2, S3, S4, and S5).
We used perceived stress as a measure of general psychological distress rather than a construct more closely aligned with IMS to examine convergent validity, in line with others. 32 These data were collected in 2018, reflecting a different time compared with the current sociopolitical climate that shows increased hostility and IMS for LGBTQ+ Latina/o/x people and LGBTQ+ non-Latina/o/x POC.
Our assessment of ethnicity does not fully capture the complexities of Latina/o/x ethnic identities 60 ; however, as a proxy measure for racial socialization, it allowed us to focus solely on whether differences that could be attributed to Latina/o/x culture could influence how IMS is experienced. Comparing Latina/o/x as an additional race/ethnicity category may also reduce reporting of White and Other races with the trade-off of reducing Black and Native American or Alaska Native reporting among Latina/os/x people 61 ; however, this study’s null findings provide further evidence to support examining Latina/o/x people as their own distinct group, similar to other MI studies in this area of research.38,40
Lastly, although our bifactor CFA was a significantly better-fitting model, it was under-identified. Future research is needed to examine item-level responses in other models to assess if they function differently across LGBTQ+ POC groups.
Conclusions
Our findings indicate that the LGBT-PCMS is a valid, reliable measure for LGBTQ+ Latina/o/x people and non-Latina/o/x POC. These results support its use in health research 55 ,undefined; however, more attention is needed to evaluate the LGBT-PCMS and its updated versions in representative samples to further test validity and compare ethnic group differences. Accurate IMS measurement enables researchers/clinicians to assess the intersectional psychosocial stress pathways through which health disparities develop and are maintained among LGBTQ+ Latina/o/x people and non-Latina/o/x POC.
Ethical Considerations
This study was reviewed and approved on November 29th, 2018, by the Institutional Review Board of the University of La Verne, Protocol #: 2018-94-CAS.
Consent to Participate
All participants provided their written consent to participate in this study.
Consent for Publication
All participants provided their written consent for the results of this study to be published.
Data Availability
De-identified data may be provided by reasonable request to the corresponding author.
Declaration of Conflicting Interest
The authors declare no potential conflicts of interest with respect to the research, authorship, and/or publication of this article.
Authors’ Contributions
J.A.P.: Conceptualization (equal), formal analysis (lead), validation (lead), visualization (lead), writing original draft (equal), and writing—reviewing and editing (equal); J.J.G.-G.: Conceptualization (lead), data curation (supporting), formal analysis (supporting), investigation (lead), methodology (lead), project administration (lead), supervision (lead), validation (lead), writing original draft (equal), and writing—reviewing and editing (equal); M.J.W.: Conceptualization (supporting) and writing—review and editing (supporting); M.S.A.: Investigation (supporting) and writing—review and editing (supporting); N.N.N.: Writing—review and editing (supporting); D.G.S.: Writing—review and editing (supporting); A.H. Writing—review and editing (supporting); D.C.: Writing—review and editing (supporting).
Footnotes
Acknowledgments
The authors would like to thank the participants for taking part in this study.
Funding Statement
The authors received no financial support for the research, authorship, and/or publication of this article.
Supplemental Material
Supplemental Material
Supplemental Material
Supplemental Material
Supplemental Material
Supplemental Material
Supplemental Material
Supplemental Material
References
Supplementary Material
Please find the following supplemental material available below.
For Open Access articles published under a Creative Commons License, all supplemental material carries the same license as the article it is associated with.
For non-Open Access articles published, all supplemental material carries a non-exclusive license, and permission requests for re-use of supplemental material or any part of supplemental material shall be sent directly to the copyright owner as specified in the copyright notice associated with the article.