
Abstract
Background:
There is distinct tibial subluxation in posterior cruciate ligament (PCL)–deficient knees on stress radiographs, including posteromedial and posterolateral subluxation. PCL injuries have been emphasized in previous literature to be frequently associated with posterolateral rotatory instability. However, diagnosis of posterolateral corner (PLC) injuries often relies on the dial test, given the limited detection of these lesions on magnetic resonance imaging, and the incidence of concomitant PLC injury is uncertain.
Purpose/Hypothesis:
The purpose of this study was to evaluate rotational subluxation patterns and to identify factors associated with a positive dial test. It was hypothesized that the posterolateral subluxation pattern would be more prevalent and severe due to concomitant PLC injury and that a positive dial test would be associated with posterolateral subluxation pattern.
Study Design:
Cross-sectional study; Level of evidence, 3.
Methods:
Patients who underwent primary PCL reconstruction were reviewed retrospectively. Three-dimensional models reconstructed from postoperative computed tomography were registered to preoperative stress radiographs. Posterior translation was assessed by measuring posterior tibial translation (PTT) of each compartment and side-to-side difference (STSD) on both radiographs and models. Rotational subluxation patterns were classified using the medial-lateral difference in side-to-side PTT changes. Clinical outcomes, distribution of suspected PLC involvement, and factors associated with dial test were assessed according to rotational subluxation patterns. Student t test and Mann-Whitney U test were used to compare outcomes, and univariate logistic regression was performed to identify related factors associated with dial test.
Results:
A total of 127 patients who underwent consecutive primary PCL reconstruction were included. Posteromedial subluxation (93 cases; 73.2%) was more prevalent than posterolateral laxity (34 cases; 26.8%) when compared with the contralateral side. Rotational laxity was greater in posteromedial subluxation than posterolateral subluxation (median, 5.07 vs 1.66 mm; P = .03). No significant differences were identified in clinical outcomes and distribution of suspected PLC involvement. In logistic regression, a positive dial test was associated with posterior laxity based on subgroup cutoffs—Telos PTT/STSD (odds ratio [OR], 3.701; P = .003/OR, 3.169; P = .01) and model PTT (OR, 3.236; P = .007)—but not with rotational laxity.
Conclusion:
Posteromedial subluxation pattern was markedly more prevalent than the posterolateral pattern in PCL deficiency. The dial test was associated with posterior laxity but was not specific for posterolateral subluxation. Patients with dominant posteromedial subluxation may be at risk of overtreatment if surgical decisions rely solely on rotational assessments.
Keywords
Posterior cruciate ligament (PCL) injuries are frequently accompanied by posterolateral corner (PLC) insufficiency, with previous studies reporting PLC involvement in 62% to 70% of PCL-deficient knees.19,29,30 However, diagnosis of PLC injury is challenging in chronic PCL deficiency, as magnetic resonance imaging (MRI) demonstrates poor sensitivity (48% to 57%) for detecting PLC pathology in chronic injury.8,20,22 For this reason, many surgeons rely on physical examination–dial test–when image studies cannot confirm PLC injury.8,15,17,20,32
Stäubli and Jakob 27 reported that in PCL-deficient knees, 3 distinct types of abnormal tibial rotation can be observed on stress radiographs, which include posterior, posteromedial, and posterolateral subluxation. The PCL is known as the primary restraint to posterior tibial translation § and also serves as a secondary restraint to external tibial rotation.1,9,11,18,19,23,26,31 The PLC, on the other hand, is known as the primary restraint of external tibial rotation. ‖ Furthermore, several studies have demonstrated that external tibial rotation increases under posterior drawer force with isolated PCL and combined PLC injury,2,12,26-28 Accordingly, combined PCL and PLC reconstruction has been widely advocated to reduce failure rates and improve clinical outcomes.1,14,21,22,32
Although external rotation has been emphasized in many studies, few studies have shown that the PCL contributes to resisting internal tibial rotation.18,19,31 However, internal tibial subluxation seems to be more frequently observed on stress radiographs of PCL-deficient knees, reflected by a relatively more posterior position of the medial tibial condyle (MTC) than the lateral side. Therefore, in this study, we investigated tibial subluxation patterns by registering 3-dimensional (3D) bony surface models to stress radiography and assessed their clinical relevance to rotational laxity.
We hypothesized that posterolateral laxity pattern, consistent with external tibial rotation, would be more prevalent and severe due to concomitant PLC injury and that a positive dial test would be associated with posterolateral subluxation pattern.
Methods
Patient Selection
A total of 169 patients who underwent PCL reconstruction (PCLR) by a single senior surgeon (J.H.W.) at a single center (Samsung Medical Center) between July 2010 and April 2025 were reviewed retrospectively. Ethical approval was obtained from the institutional review board before initiation of the study, and all investigations were conducted in conformity with the ethical principles of research. The informed consent was waived, as this study was conducted retrospectively and used anonymized data without any direct patient involvement or additional risk.
Inclusion criteria were patients who underwent primary PCLR and who had complete image studies including preoperative stress radiograph of both knee and postoperative computed tomography (CT) of the injured knee. Postoperative CT scans were routinely performed to evaluate the position of the femoral and tibial tunnels after PCLR and were used to reconstruct 3D bony surface models for 2-dimensional (2D)–3D registration. Indications for combined PLC reconstruction included patients with concomitant PLC involvement confirmed by objective studies, such as MRI or varus stress radiographs, as well as patients with chronic injuries who demonstrated consistently positive dial test findings when PLC injury could not be clearly diagnosed using objective imaging modalities. Because chronic PLC injury (>12 weeks after initial trauma) is difficult to identify on MRI,20,22 repetitive dial tests at 30° and 90° of knee flexion in the prone position were performed ≥3 times preoperatively (at the outpatient clinic, in the ward 1 day before surgery, and in the operating room under anesthesia) by the same senior author (J.H.W.) to assess suspected PLC involvement. PLC reconstruction was performed as follows: A femoral tunnel was created at the femoral footprint of the popliteal tendon. Subsequently, a transfibular tunnel was created connecting the fibular footprints of the lateral collateral ligament (LCL) and popliteofibular ligament. The remnant popliteal tendon and the graft were secured within the femoral tunnel, the graft was then passed through the transfibular tunnel deep to the LCL, and final fixation was performed at just above the LCL femoral footprint using an interference screw with spike washer under valgus forces. If the dial test results were inconsistent, an additional assessment was performed under anesthesia. Exclusion criteria were patients who had concomitant ACL injury, patients with revisional PCLR (which can affect and alter the anteroposterior laxity), and patients with incomplete image workup (Figure 1).
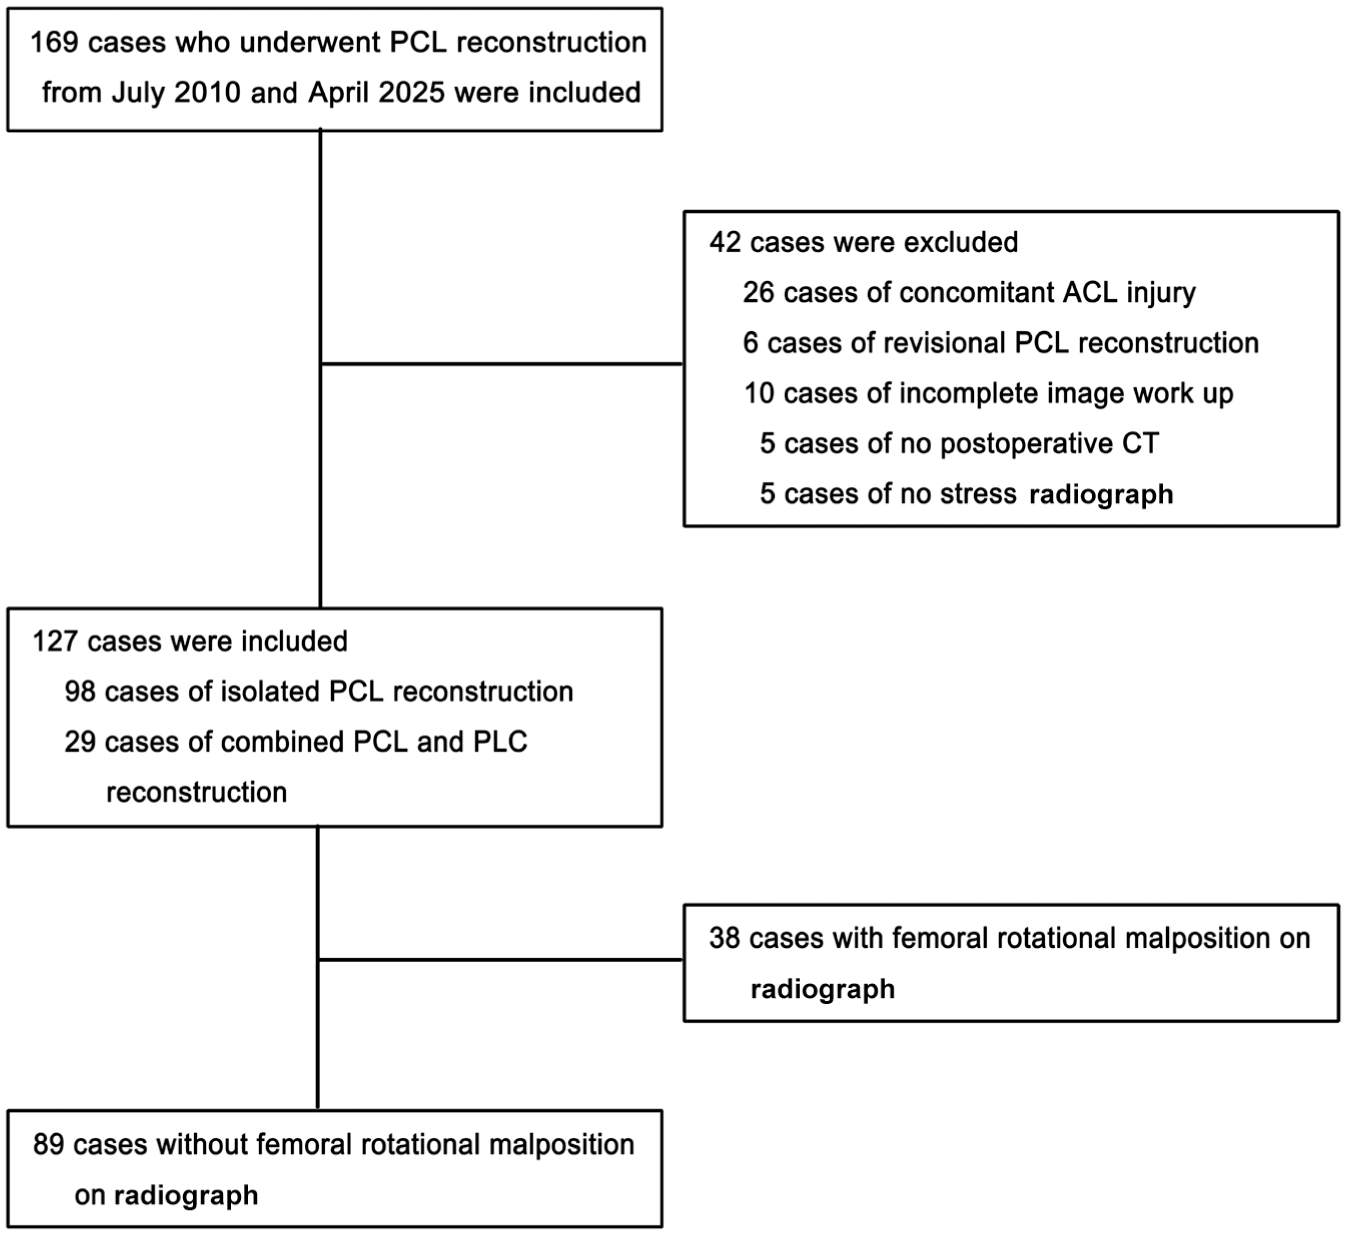
Patient flowchart. ACL, anterior cruciate ligament; CT, computed tomography; PCL, posterior cruciate ligament; PLC, posterolateral corner.
Demographic characteristics and the incidence of concomitant ligamentous, meniscal, and cartilaginous injuries were investigated in selected patients. Concomitant injuries were identified on MRI and intraoperative arthroscopic findings. PLC injuries, however, were frequently not detected on MRI and were therefore diagnosed based on the dial test.
Stress Radiograph–Based Measurement and Gross Classification
Preoperative stress radiography with the Telos GA II stress device (Telos) was performed with the patient in the lateral decubitus position and the knee flexed to 90°. A radiograph was taken while the Telos arm applied a 150-N posterior load to the anterior aspect of the tibia 10 cm distal to the medial joint. All radiographs were performed by 1 of 3 experienced radiology technicians to minimize femoral rotational malposition. Posterior tibial translation (PTT) was measured using the Stäubli method, and Telos PTT was defined as the greater value of the medial or lateral compartmental translation. 27 Two of the authors (Y.Y and J.I.K.), both orthopaedic surgeons, performed the measurements independently. They were blinded to each other's measurements and to their own previous measurements. All variables were measured twice for all knees, with a 2-week interval between measurements. Side-to-side difference on stress radiograph (Telos STSD) was calculated as the difference in Telos PTT between the injured and contralateral knees. Femoral rotational malposition was evaluated by difference between both femoral condyles; a difference ≤3 mm was considered acceptable. 4 Medial-lateral difference in PTT consistent with distance between the medial and lateral tibial condyles (Telos MTC-LTC) was measured to evaluate the amount of tibial rotation (Figure 2).
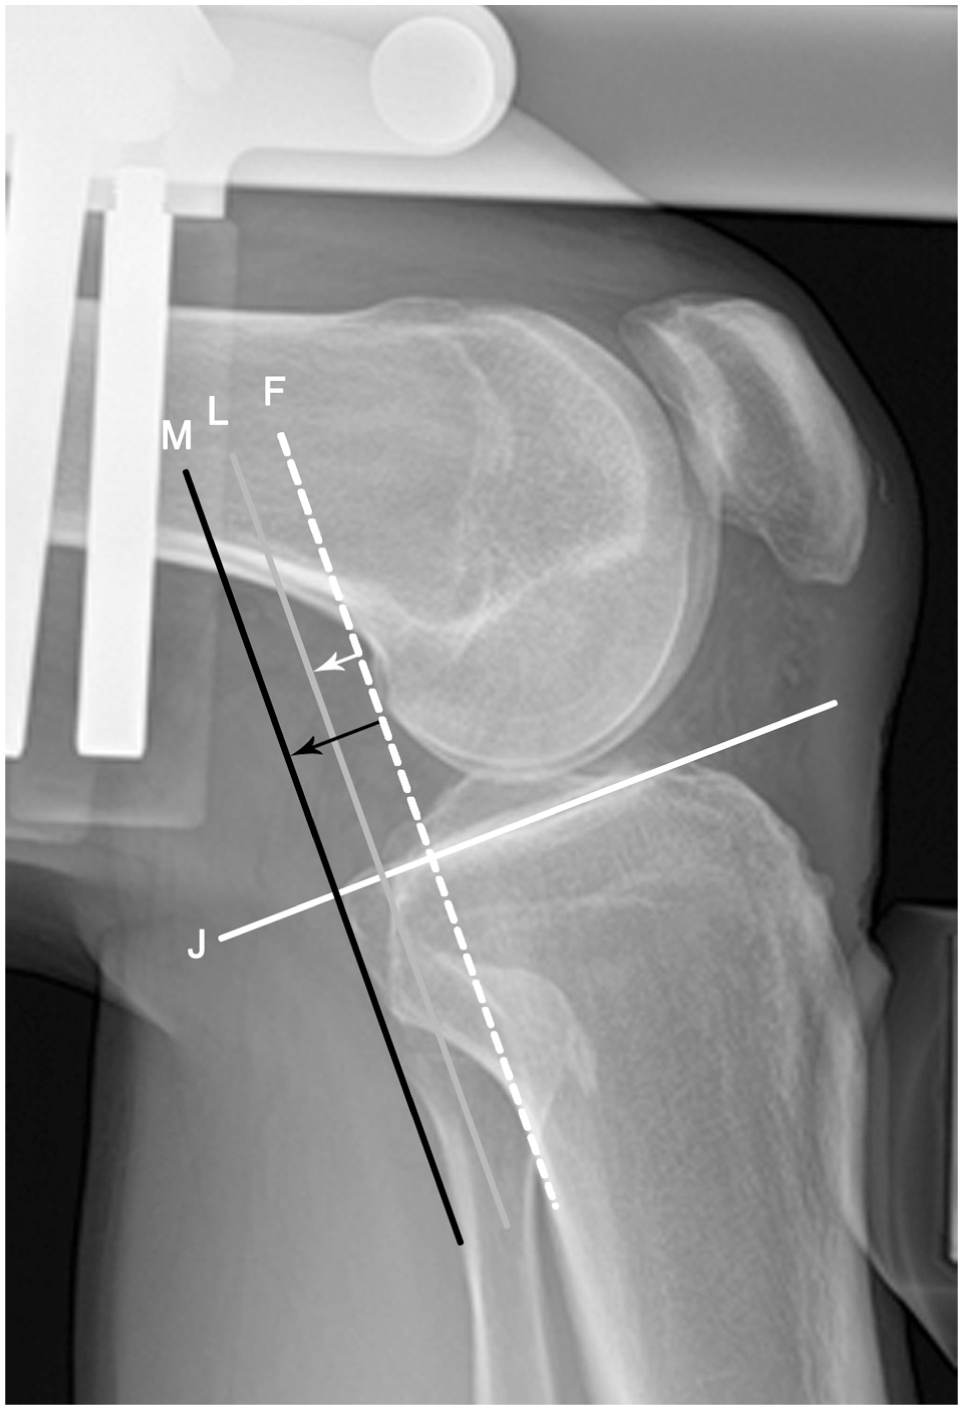
Stress radiograph–based measurement. Medial and lateral compartment PTTs were measured by the Stäubli method. Femoral reference line (F) was drawn on the most posterior cortex of the femoral condylar perpendicular joint line (J). The posterior-most cortex of the medial and lateral tibial condyle are represented by the black line (M) and gray line (L), respectively. Medial and lateral compartment-specific PTTs on Telos stress radiograph were defined as the distance from F to each compartment of the tibia (black and white arrows). The distance between M and L represents the Telos MTC-LTC. LTC, lateral tibial condyle; MTC, medial tibial condyle; PTT, posterior tibial translation; Telos MTC-LTC, medial tibial condyle–lateral tibial condyle difference in PTT.
Gross classification on stress radiograph was determined according to tibial condylar position: gross posteromedial, MTC markedly located more posteriorly than laterally; gross central, cases were not clearly classified with posteromedial or posterolateral type; gross posterolateral, LTC markedly located more posteriorly than medial (Figure 3).
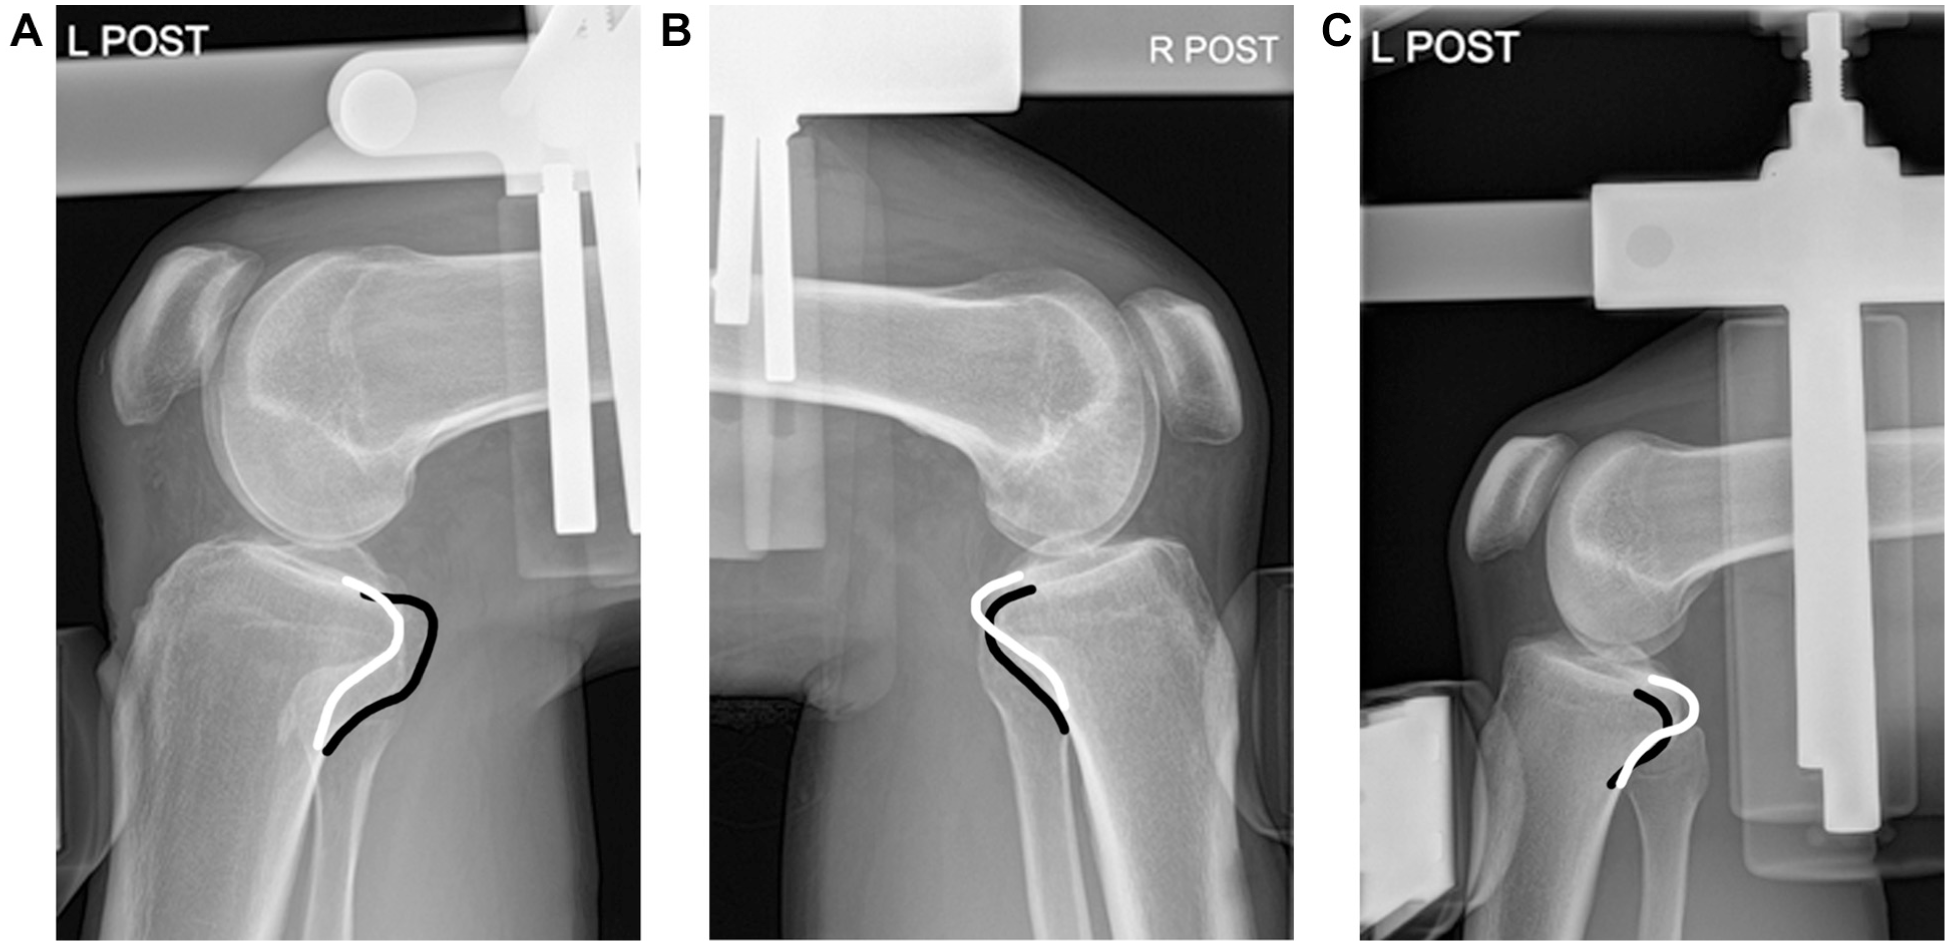
Three rotational subluxation patterns on Telos stress radiograph. There are 3 different patterns of rotational subluxation on a Telos stress radiograph without femoral rotational malposition. The black line is the contour of the medial tibial condyle and the white line is contour of the lateral tibial condyle. (A) Gross posteromedial: medial tibial condyle markedly located more posteriorly than the lateral. (B) Gross central: cases were not clearly classified with medial or lateral dominant type. (C) Gross posterolateral: lateral tibial condyle markedly located more posteriorly than medial.
3D Bony Surface Model Construction
Postoperative CT scans were obtained using a GE Revolution Frontier CT scanner (GE Healthcare) with 0.625-mm slice thickness. Segmentation of the femurs and tibias was performed using Seg3D Version 2.5 (SCI Institute; University of Utah). Three-dimensional bony surface models were constructed for subsequent registration. For contralateral comparison, mirror-reversed models of the injured knee were created, and subsequent registration was done with stress radiographs of the intact knee (Figure 4).
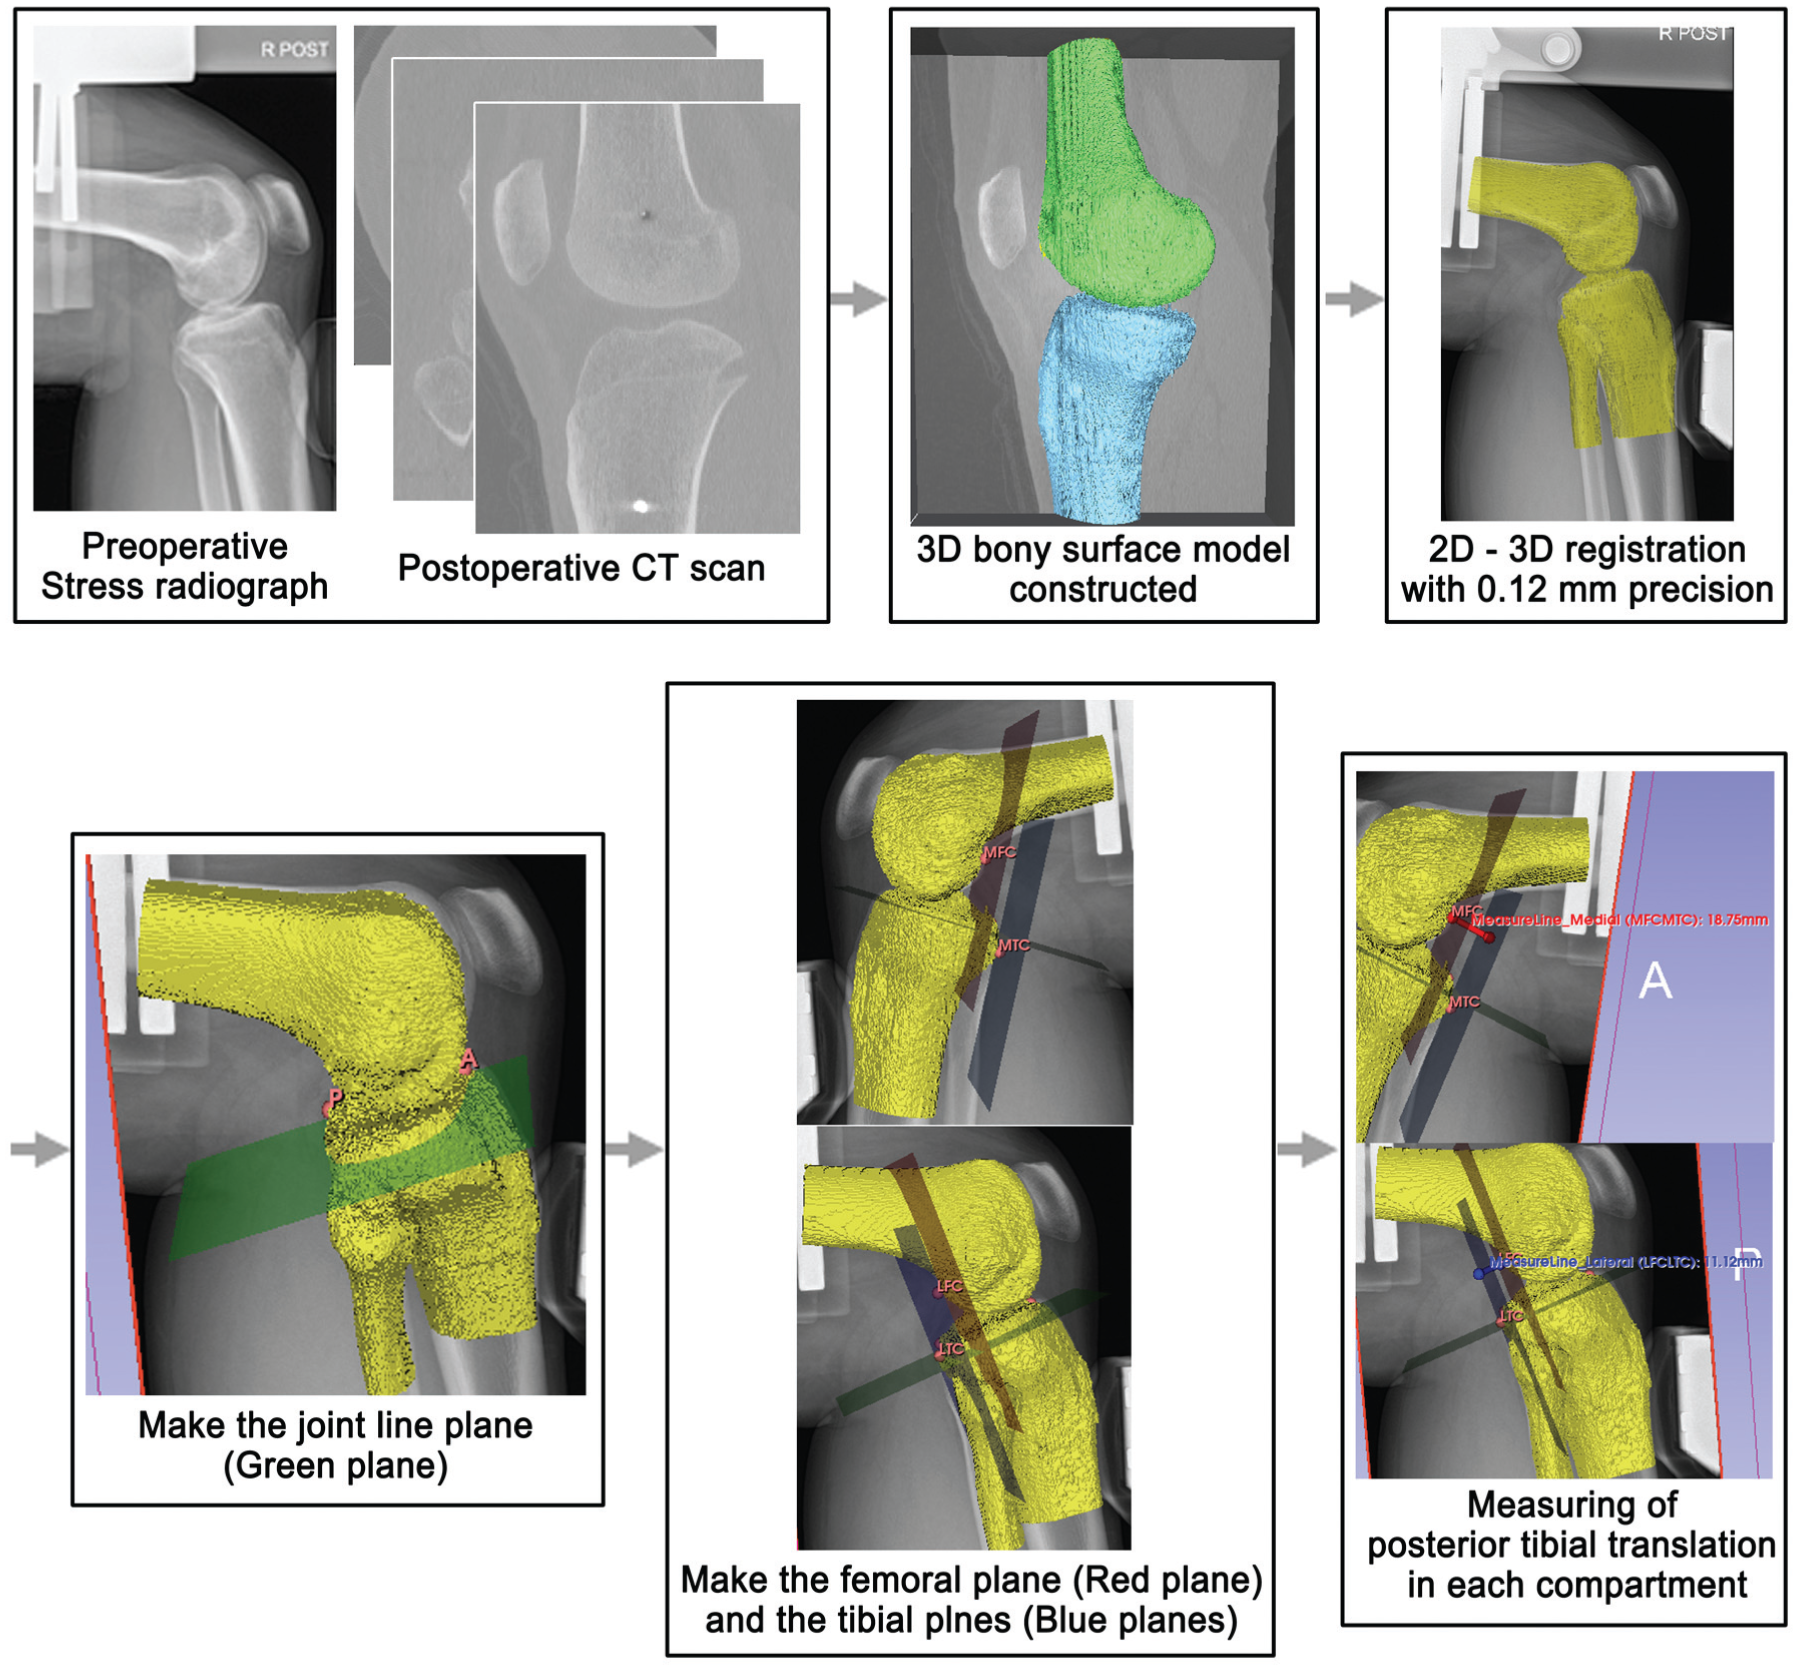
Flowchart of the analysis. Preoperative stress radiograph and postoperative CT were collected. A 3D bony surface model was constructed. Registration in 2D-3D via matching the model to the stress radiograph was performed. The joint line plane (green plane) was made across the joint line. The most posterior points of both femoral and tibial condyles were set and the femoral plane (red plane) is perpendicular to the joint line plane was made across both femoral condylar points; then the tibial planes were made parallel to the femoral planes across each tibial condylar point, respectively. The amount of translation was measured by the distance between 2 planes passing through the most posterior femoral and tibial condyles in the same compartment. 2-D, 2-dimensional; 3-D, 3-dimensional; CT, computed tomography.
2D-3D Registration
Image-based 2D to 3D registration was performed using MATLAB R2023a (The MathWorks). The 3D bony surface models were iteratively aligned to the Telos stress radiograph by minimizing the discrepancy between the projected model contour and the cortical outline on the radiograph, achieving an accuracy of approximately 0.12 mm3,13,16,24,25 (Figure 4).
Model-Based Measurement and Model Classification
Model-based PTT measured on the models was measured in 3D Slicer Version 5.6 (Brigham and Women's Hospital) following registration (Figure 4). A joint line plane was established across the radiographic model interface. A femoral plane was constructed that was perpendicular to the joint line plane and passed through the most posterior points of the medial and lateral femoral condyles. The medial and lateral tibial planes were then created parallel to the femoral plane and passed through the most posterior points of the respective tibial condyles. Medial and lateral compartment PTTs on the models were defined as the perpendicular distance between the femoral plane and each tibial plane. Model PTT was defined as the larger value of the medial or lateral compartment PTT. Model STSD was calculated by difference in model PTT between the injured and contralateral knees.
Model classification was determined by the medial-lateral difference in PTT, which is considered the relative tibial subluxation on 3D model (model M-L; Figure 5): model posteromedial, greater PTT of medial compartment than lateral; model posterolateral, greater PTT of lateral compartment than medial.
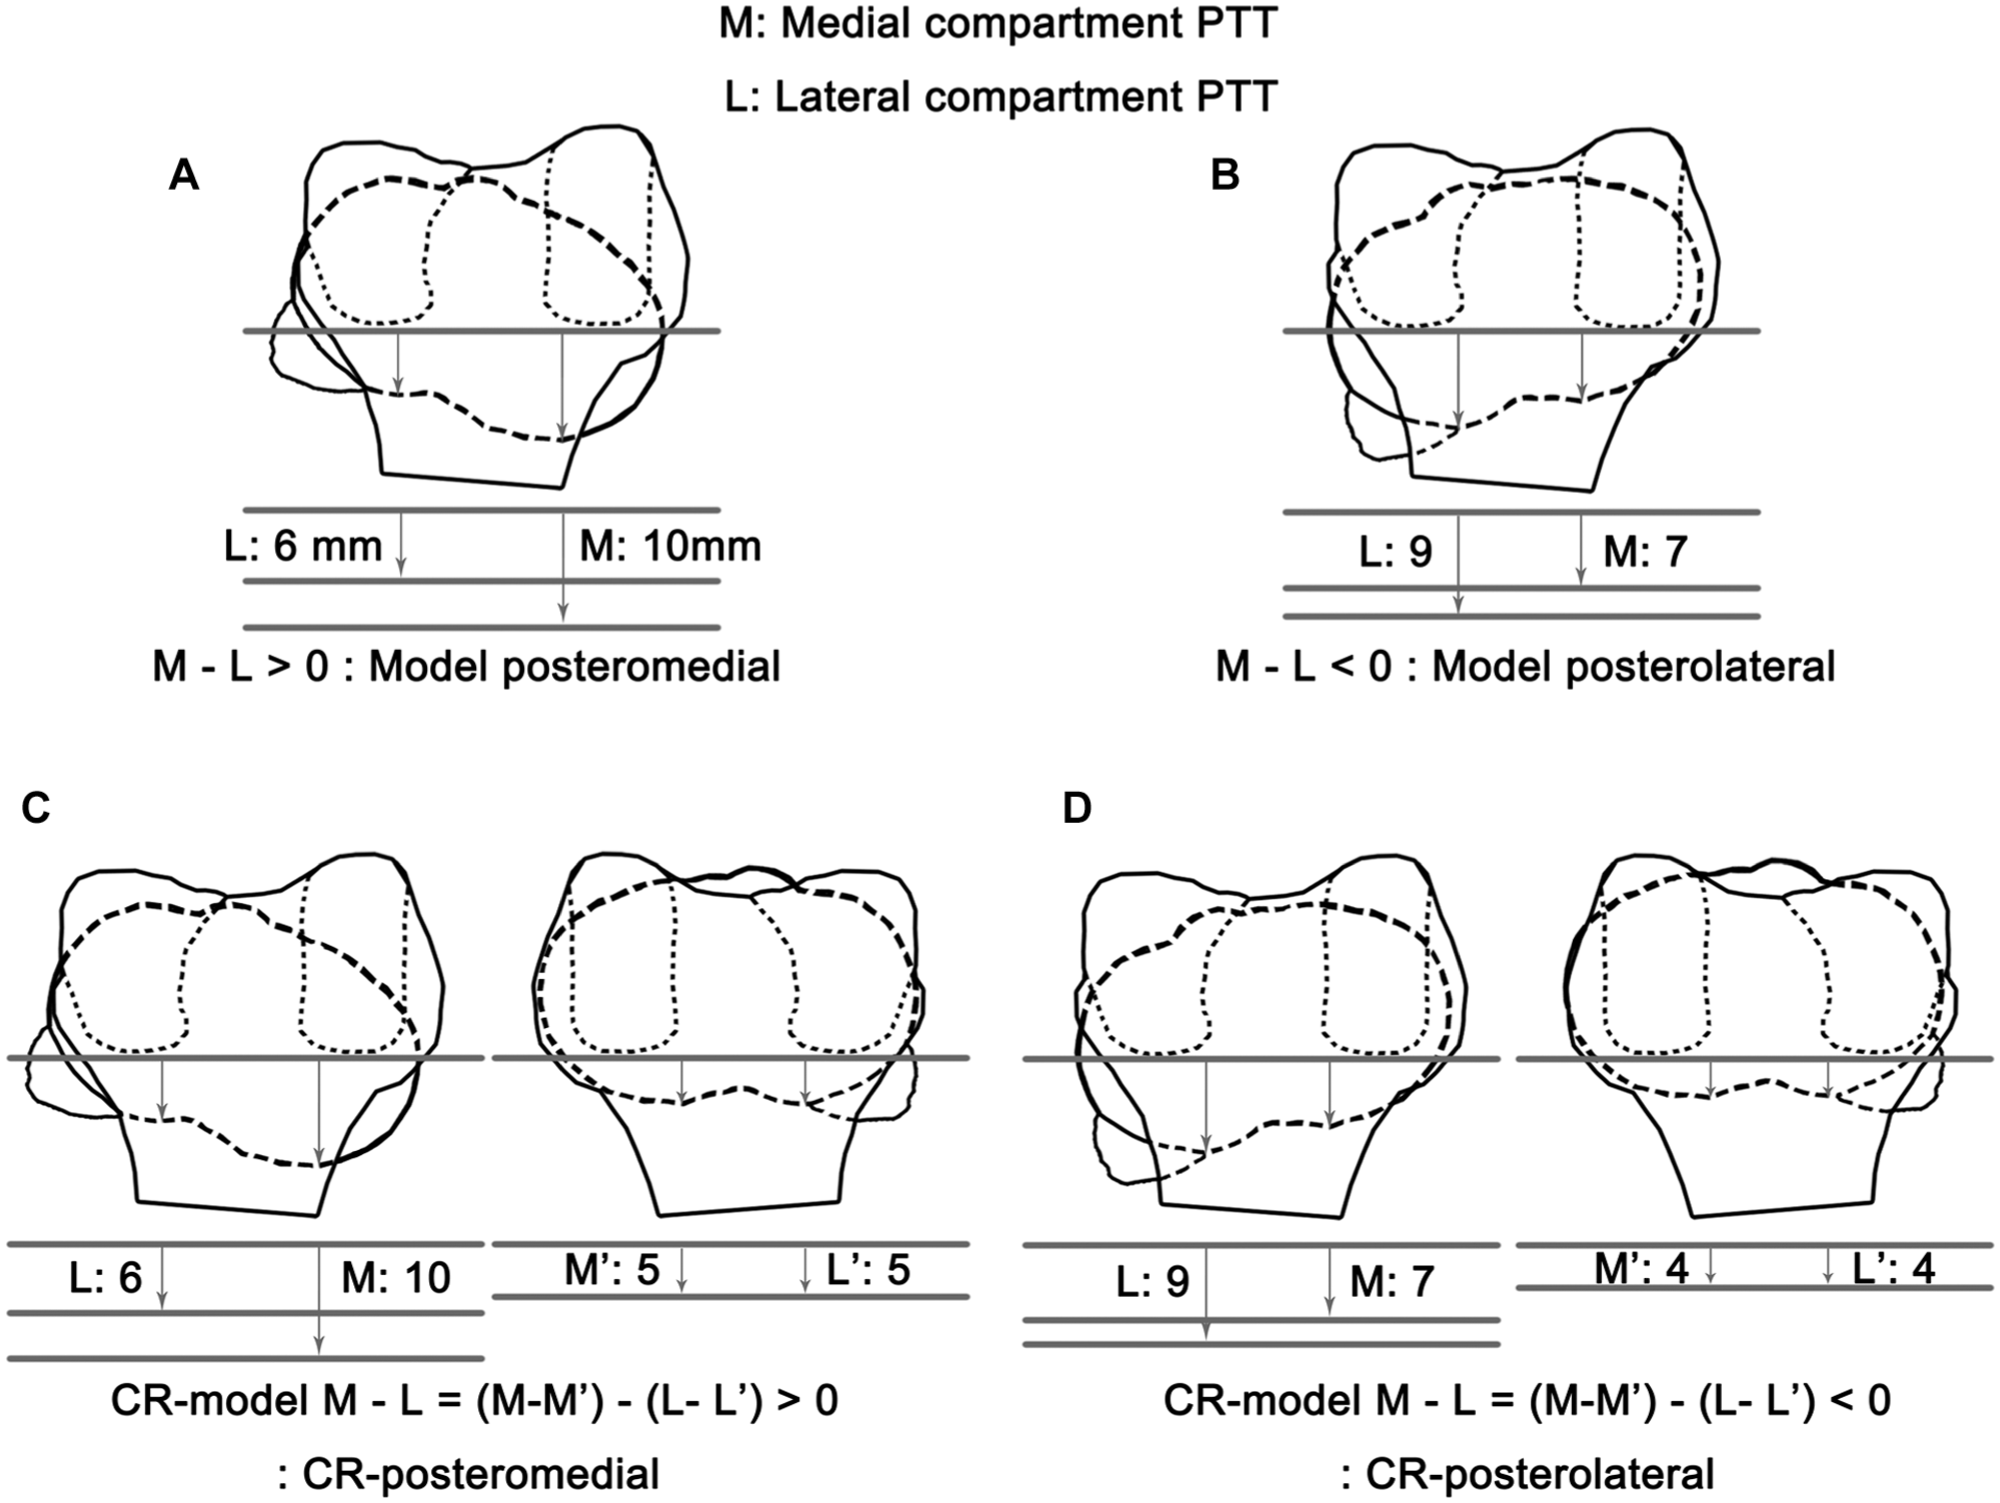
Schema of 3-dimensional bony surface model analysis. (A) Model posteromedial type. Medial compartment PTT is greater than lateral compartment. (B) Model posterolateral type. Lateral compartment PTT is greater than medial compartment. (C) CR posteromedial type. Change of medial compartment PTT is greater than lateral compartment. (D) CR posterolateral type. Change of lateral compartment PTT is greater than medial compartment. CR, contralateral referenced; L, lateral compartment PTT of the injured knee; L’, lateral compartment PTT of intact knee; M, medial compartment PTT of the injured knee; M’, medial compartment PTT of the intact knee; PTT, posterior tibial translation.
Because tibial rotation observed on the injured-side model could be influenced by a patient's inherent baseline rotation, mirror-reversed models were constructed from the injured knee and registered to the stress radiographs of the intact knee. Subsequently, medial and lateral compartment PTTs of a mirror-reversed model registered to stress radiograph of the intact knee were measured. Model classifications of the injured knee were then compared with the contralateral side to verify whether rotation of the injured knee truly reflected injury-related tibial movement under posterior drawer force.
The Contralateral Referenced (CR) model classification was determined by the medial-lateral difference in side-to-side PTT changes (CR model M-L; Figure 5). The CR posteromedial pattern represents cases where the change in PTT on the affected side compared to the contralateral side was greater in the medial compartment than in the lateral compartment. Conversely, the CR posterolateral pattern represents cases where the change in PTT on the affected side compared to the contralateral side was greater in the lateral compartment than in the medial compartment.
Clinical Outcomes
Demographic characteristics and clinical data were retrospectively collected from electronic medical records at both the preoperative and the final follow-up visits. The posterior drawer test (PDT), posterior sagging, and varus/valgus stress test were graded from 0 to 3 relative to the contralateral knee: 0 (normal), 1 (<5 mm), 2 (5-10 mm), and 3 (>10 mm). The dial test was defined as absent or present (>10° external rotation).
Posterior tibial translation was further assessed using Telos stress radiographs and a KT-2000 arthrometer (MEDmetric Corp). Telos radiographs were obtained as previously described, and the KT-2000 arthrometer testing was performed with the patient supine, the knee flexed to 90°, and a force plunger applied over the anterior tibial tubercle, secured with a Velcro strap. STSD in posterior translation compared with the contralateral knee was recorded under manual maximal force.
Patient-reported outcome measures, including the Lysholm score, International Knee Documentation Committee subjective score, Tegner activity scale, and Knee injury and Osteoarthritis Outcome Score, were collected preoperatively and at final follow-up. All patient-reported outcomes were obtained by trained research personnel not involved in clinical care or data analysis.
Statistical Analysis
Continuous variables were reported based on distribution. Normality was assessed using the Shapiro-Wilk test. Data were presented as mean with standard deviation or median with interquartile range. For comparison of characteristics between subgroups, the Student t test or Mann-Whitney U test for continuous variables were used to verify the significance depending on normality. Categorical variables are presented as frequencies and percentages and were compared using the Fisher exact test. Intra- and interobserver reliability of PTT on stress radiographs was assessed using the intraclass correlation coefficient (ICC), based on a 2-way random-effects, absolute agreement model with 95% CIs, as well as Bland-Altman analysis. The Bland-Altman analysis provided the mean bias and 95% limits of agreement, enabling evaluation of potential systematic bias and measurement consistency between observers. Intraobserver reliability of a repeated dial test was also assessed using ICC (3,1) based on a 2-way mixed-effect, absolute agreement model with 95% CI model. Agreement and overall association analysis between gross and model classification were performed using exact binomial tests and Fisher-Freeman-Halton test with Monte Carlo simulation. Logistic regression analysis was performed to identify independent predictors of a positive dial test.
R software Version 4.5.1 (R Foundation for Statistical Computing) was used for the statistical analysis. Statistical significance was set at P < .05.
Results
A total of 169 patients who underwent primary PCLR were initially reviewed, and 127 patients met all inclusion criteria after 42 patients were excluded (Figure 1). Baseline characteristics of the final cohort are summarized in Table 1. The median interval from injury to reconstruction was 10.5 months. Among the 127 patients, 115 (90.6%) patients had chronic PCL injury. The median follow-up period was 33.6 months. Gross classification was based on the position of tibial condyles. In the gross classification, 94 patients (74.0%) were classified as gross posteromedial, 28 (22.0%) as gross central, and 5 (3.9%) as gross posterolateral. Model classification of the injured knee was classified based on compartment-specific PTT of the injured knee model. In the model classification, 110 patients (86.6%) were classified as model posteromedial and 17 (13.4%) as model posterolateral. Based on the CR model classification, 93 patients (73.2%) were categorized as CR posteromedial and 34 (26.8%) as CR posterolateral. Across all classifications, the posteromedial pattern was markedly more prevalent than the posterolateral pattern. Subgroups are summarized in Table 2.
Patient Demographics a
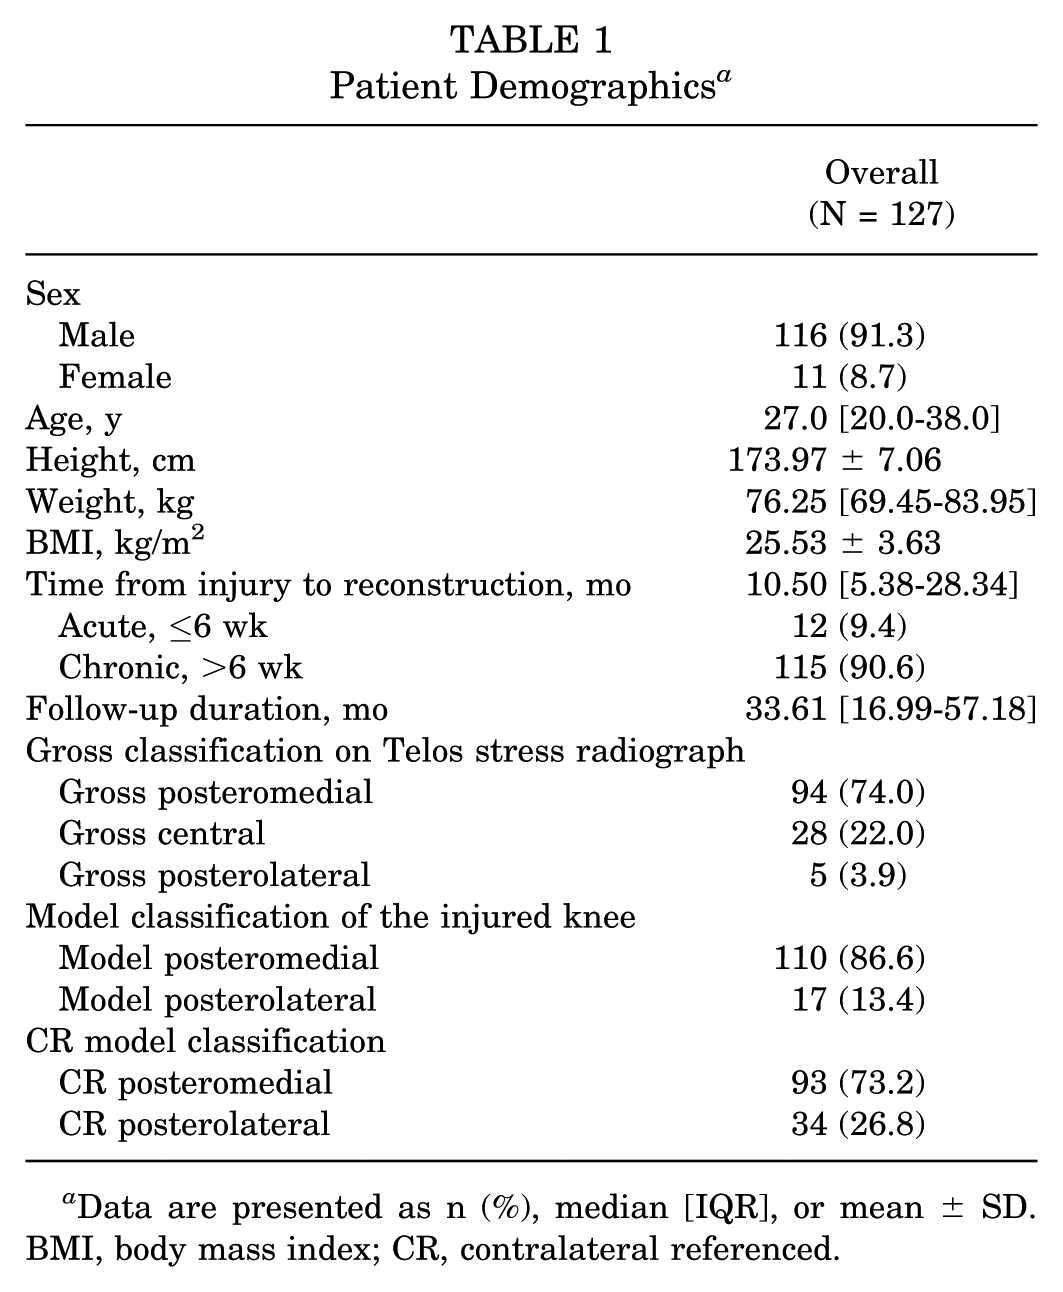
Data are presented as n (%), median [IQR], or mean ± SD. BMI, body mass index; CR, contralateral referenced.
Summary of Subgroups a

CR, contralateral referenced; PTT, posterior tibial translation.
Agreement and overall association between gross and model or CR model classification is summarized in Table 3. Of 127 knees, a total of 89 knees without femoral rotational malposition on stress radiography were included in these analyses (Figure 1). In the agreement between gross and model classification of the injured, all 60 (100%) gross posteromedial knees were consistently classified as model posteromedial (P < .001), and all 4 (100%) gross posterolateral knees were classified as model posterolateral (P = .06). Among the 25 gross central knees, which could not be clearly categorized grossly as posteromedial or posterolateral type, 16 were classified as model posteromedial and 9 as model posterolateral. In the agreement between gross and CR model classification, 93 knees (73.2%) were classified as CR posteromedial and 34 (26.8%) as CR posterolateral, 51 of 60 gross posteromedial knees (85.0%) were CR posteromedial (P < .001), whereas only 2 of 4 gross posterolateral knees (50.0%) were CR posterolateral (P = .69), indicating that gross posteromedial classification remained highly reproducible, while gross posterolateral knees exhibited less consistency when compared with the contralateral side.
Agreement Between Gross Classification and Model Classification (n = 89) a

Data are presented as n (%). Bolded P values indicate statistical significance. CR, contralateral referenced; NA, not available.
P values were calculated using Row-wise exact binomial tests.
P values of agreement between gross central and model could not be evaluated because central type of model does not exist.
Overall associations were calculated using Fisher-Freeman-Halton (Monte Carlo).
Table 4 summarizes stress radiograph–based and model-based subluxation measurements according to CR model subgroups. CR posteromedial knees demonstrated significantly greater model STSD compared with CR posterolateral knees (11.23 ± 4.24 vs 8.65 ± 4.52; P = .02). The difference between medial and lateral model PTT, which means the extent of internal tibial rotation under posterior drawer force, was greater in the CR posteromedial subgroup (5.75 ± 3.48 vs 3.97 ± 2.68; P = .02). Extent of CR rotation also demonstrated a larger amount of rotation in CR posteromedial knees (median, 5.07 mm vs 1.66 mm; P = .03). To further assess agreement of PTT measurements, the interobserver ICC was 0.81 (95% CI, 0.51-0.91). Bland-Altman analysis demonstrated a mean bias of −1.44 mm (95% limits of agreement, −5.32 to 2.43 mm), indicating good agreement without evidence of systematic bias. Intraobserver reliability was excellent, with ICC values of 0.90 (95% CI, 0.88-0.96) and 0.88 (95% CI, 0.85-0.92), respectively.
Telos- and Model-Based Measurement Between CR Model Classification (n = 89) a

Data are presented as mean ± SD or median [IQR]. Bolded P values indicate statistical significance. CR, contralateral referenced; M-L, medial-lateral; NA, not available; PTT, posterior tibial translation; STSD, side-to-side difference.
P values were calculated using Student t test or Mann-Whitney U test, as appropriate.
Data for CR posterolateral subgroup are presented as absolute values. The direction of these values is negative for the CR posterolateral subgroup.
Model M-L, M-L difference in PTT of injured knee; CR model M-L, M-L difference in side-to-side PTT changes as medial ΔPTT-lateral ΔPTT. Values are reported as absolute values.
Clinical outcomes did not differ significantly between CR model subgroups either preoperative or postoperatively (Table 5). Assessments of posterior laxity, including the KT-2000 arthrometer, PDT, and posterior sagging, also demonstrated no significant differences. The median STSD on the KT-2000 arthrometer was comparable between the groups both preoperatively (P = .70) and postoperatively (P = .35). Assessment of suspected PLC involvement, including dial test, and STSD of lateral gap on varus stress radiographs, did not differ between subgroups. The dial test demonstrated good to excellent reliability across repeated examinations, with ICC (3,1) values were 0.894 (95% CI, 0.863-0.922) at 30° of knee flexion and 0.986 (95% CI, 0.982-0.990) at 90°. Furthermore, the distribution of grades for the PDT did not differ preoperatively (P = .13) or postoperatively (P = .95), nor did the grades for posterior sagging (P = .53 and P = .58, respectively).
Comparison of Clinical Outcomes Between CR Model Classification (N = 127) a

Data are presented as median [IQR], n, or n (%). ADL, Activities of Daily Living; CR, contralateral referenced; IKDC, International Knee Documentation Committee; KOOS, Knee injury and Osteoarthritis Outcome Score; KT-2000, KT-2000 arthrometer; PDT, posterior drawer test; QoL, Quality of Life; ROM, range of motion; STSD, side-to-side difference.
P values were calculated using Mann-Whitney U test for continuous variables and Fisher exact test for categorical variables.
STSD in posterior translation using the KT-2000 arthrometer was measured under manual maximal force.
PDT, posterior sagging, and varus/valgus stress test grades are presented as 0:1:2:3.
Lateral gap is defined as STSD of lateral joint on varus stress radiograph.
Concomitant injuries are summarized in Table 6. These injuries were identified through either MRI or intraoperative arthroscopic findings. However, PLC injury was not confirmed on MRI in this cohort, as most cases (111 of 127) involved chronic injuries in which findings of PLC injury are typically not detectable. Therefore, concomitant PLC involvement was suspected based on the dial test, as described previously. No significant differences in the distribution of concomitant injury were observed between CR model subgroups. PLRI was diagnosed in 22 (23.7%) knees in the CR posteromedial and 7 (20.6%) knees in the CR posterolateral (P = .81).
Concomitant Injuries Between CR Model Subgroups (N = 127) a
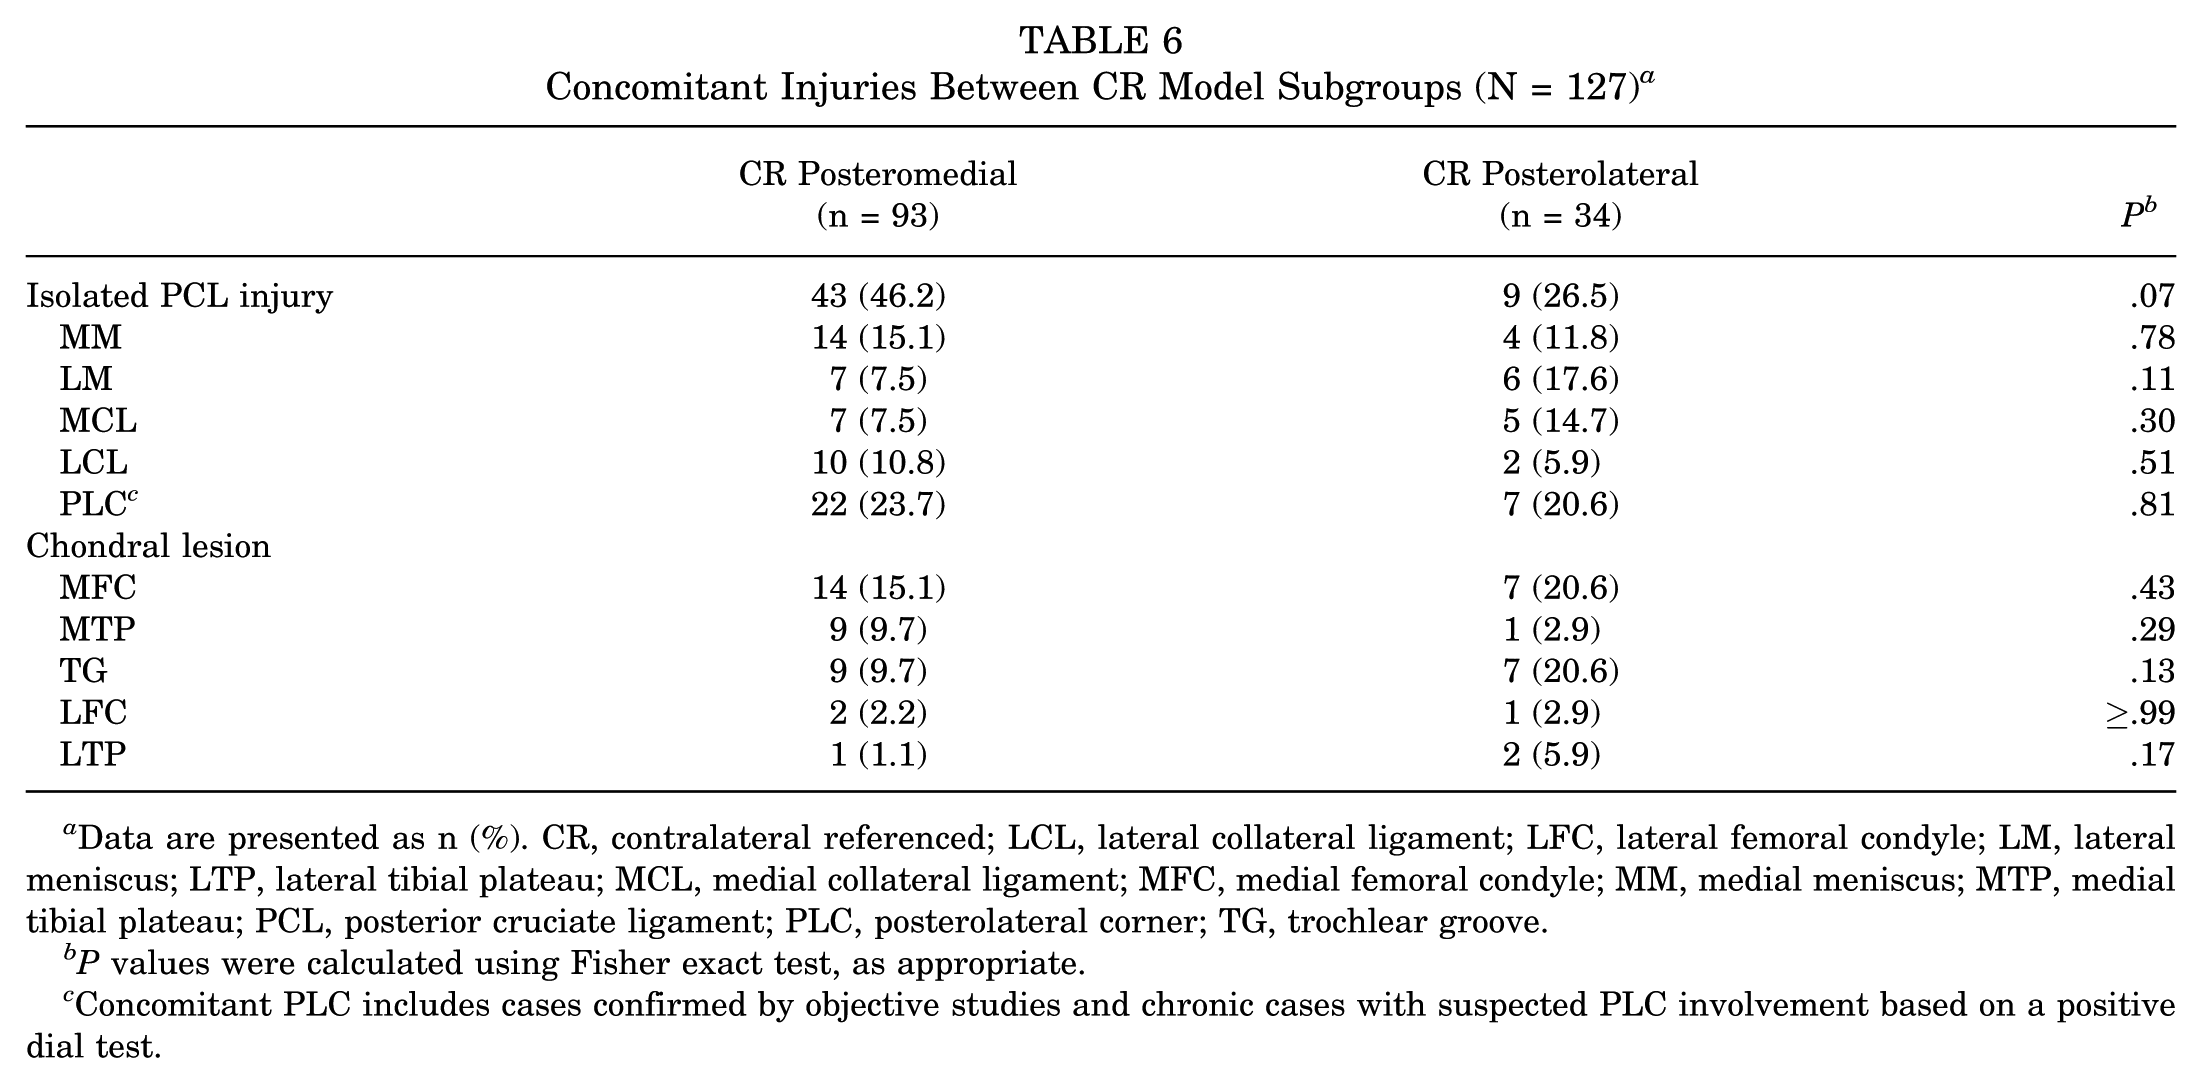
Data are presented as n (%). CR, contralateral referenced; LCL, lateral collateral ligament; LFC, lateral femoral condyle; LM, lateral meniscus; LTP, lateral tibial plateau; MCL, medial collateral ligament; MFC, medial femoral condyle; MM, medial meniscus; MTP, medial tibial plateau; PCL, posterior cruciate ligament; PLC, posterolateral corner; TG, trochlear groove.
P values were calculated using Fisher exact test, as appropriate.
Concomitant PLC includes cases confirmed by objective studies and chronic cases with suspected PLC involvement based on a positive dial test.
Logistic regression analysis demonstrated that in the CR posteromedial subgroup, greater Telos PTT (odds ratio [OR], 1.197; P = .01), model PTT (OR, 1.146; P = .02), Telos STSD (OR, 1.179; P = .01), and model STSD (OR, 1.131; P = .03) were independently associated with positive dial test. In the CR posterolateral subgroup, only Telos PTT was significantly associated with positive dial test (OR, 1.425; P = .01). Across the entire cohort, Telos PTT, model PTT, Telos STSD, and model STSD remained significant predictors, whereas rotational measures were not associated with positive dial test findings (Table 7). Given these findings, an additional exploratory stratified analysis was performed to examine the association between the severity of posterior laxity and dial test positivity. This post hoc analysis was not prespecified and used subgroup-specific central tendency values (mean or median, depending on normality) as reference cutoffs (Figure 6). In the CR posteromedial subgroup, Telos PTT ≥ 18.700 mm (OR, 3.437; P = .02), model PTT ≥ 18.352 mm (OR, 3.733; P = .01), and Telos STSD ≥ 13.700 mm (OR, 3.437; P = .02) were strongly associated with dial test positivity. In the overall cohort, Telos PTT ≥ 19.450 mm (OR, 3.701; P = .003), model PTT ≥ 17.698 mm (OR, 3.236; P = .007), and Telos STSD ≥ 13.867 mm (OR, 3.169; P = .01) demonstrated strengthened associations with positive dial test findings.
Logistic Regression According to Positive Dial Test a

Bolded P values indicate statistical significance. CR, contralateral referenced; L, lateral compartment PTT; LTC, lateral tibial condyle; M, medial compartment PTT; MTC, medial tibial condyle; NA, not available; OR, odds ratio; PTT, posterior tibial translation; STSD, side-to-side difference.
Each value means Telos PTT, the greater value of the medial or lateral compartmental translation on Telos stress radiograph; model PTT, the greater value of the medial or lateral compartmental translation on 3-dimensional (3D) surface model; Telos STSD, STSD between injured and contralateral knee; model STSD, difference in model PTT between injured and contralateral knee; Telos MTC-LTC, compartment-specific PTT difference between medial and lateral; model M-L, difference of compartment-specific PTT between medial and lateral on injured knee 3D bony surface model; CR model M-L, difference of changes in compartment-specific PTT from contralateral to the injured knee on 3D bony surface model.
“Higher” values were evaluated only for predictors such as Telos/model PTT and STSD that were significant in the continuous analysis. Higher values were defined separately for each group as those above the mean or median values of each variable among the cases with positive dial test.
ORs could not be estimated because of insufficient variability.
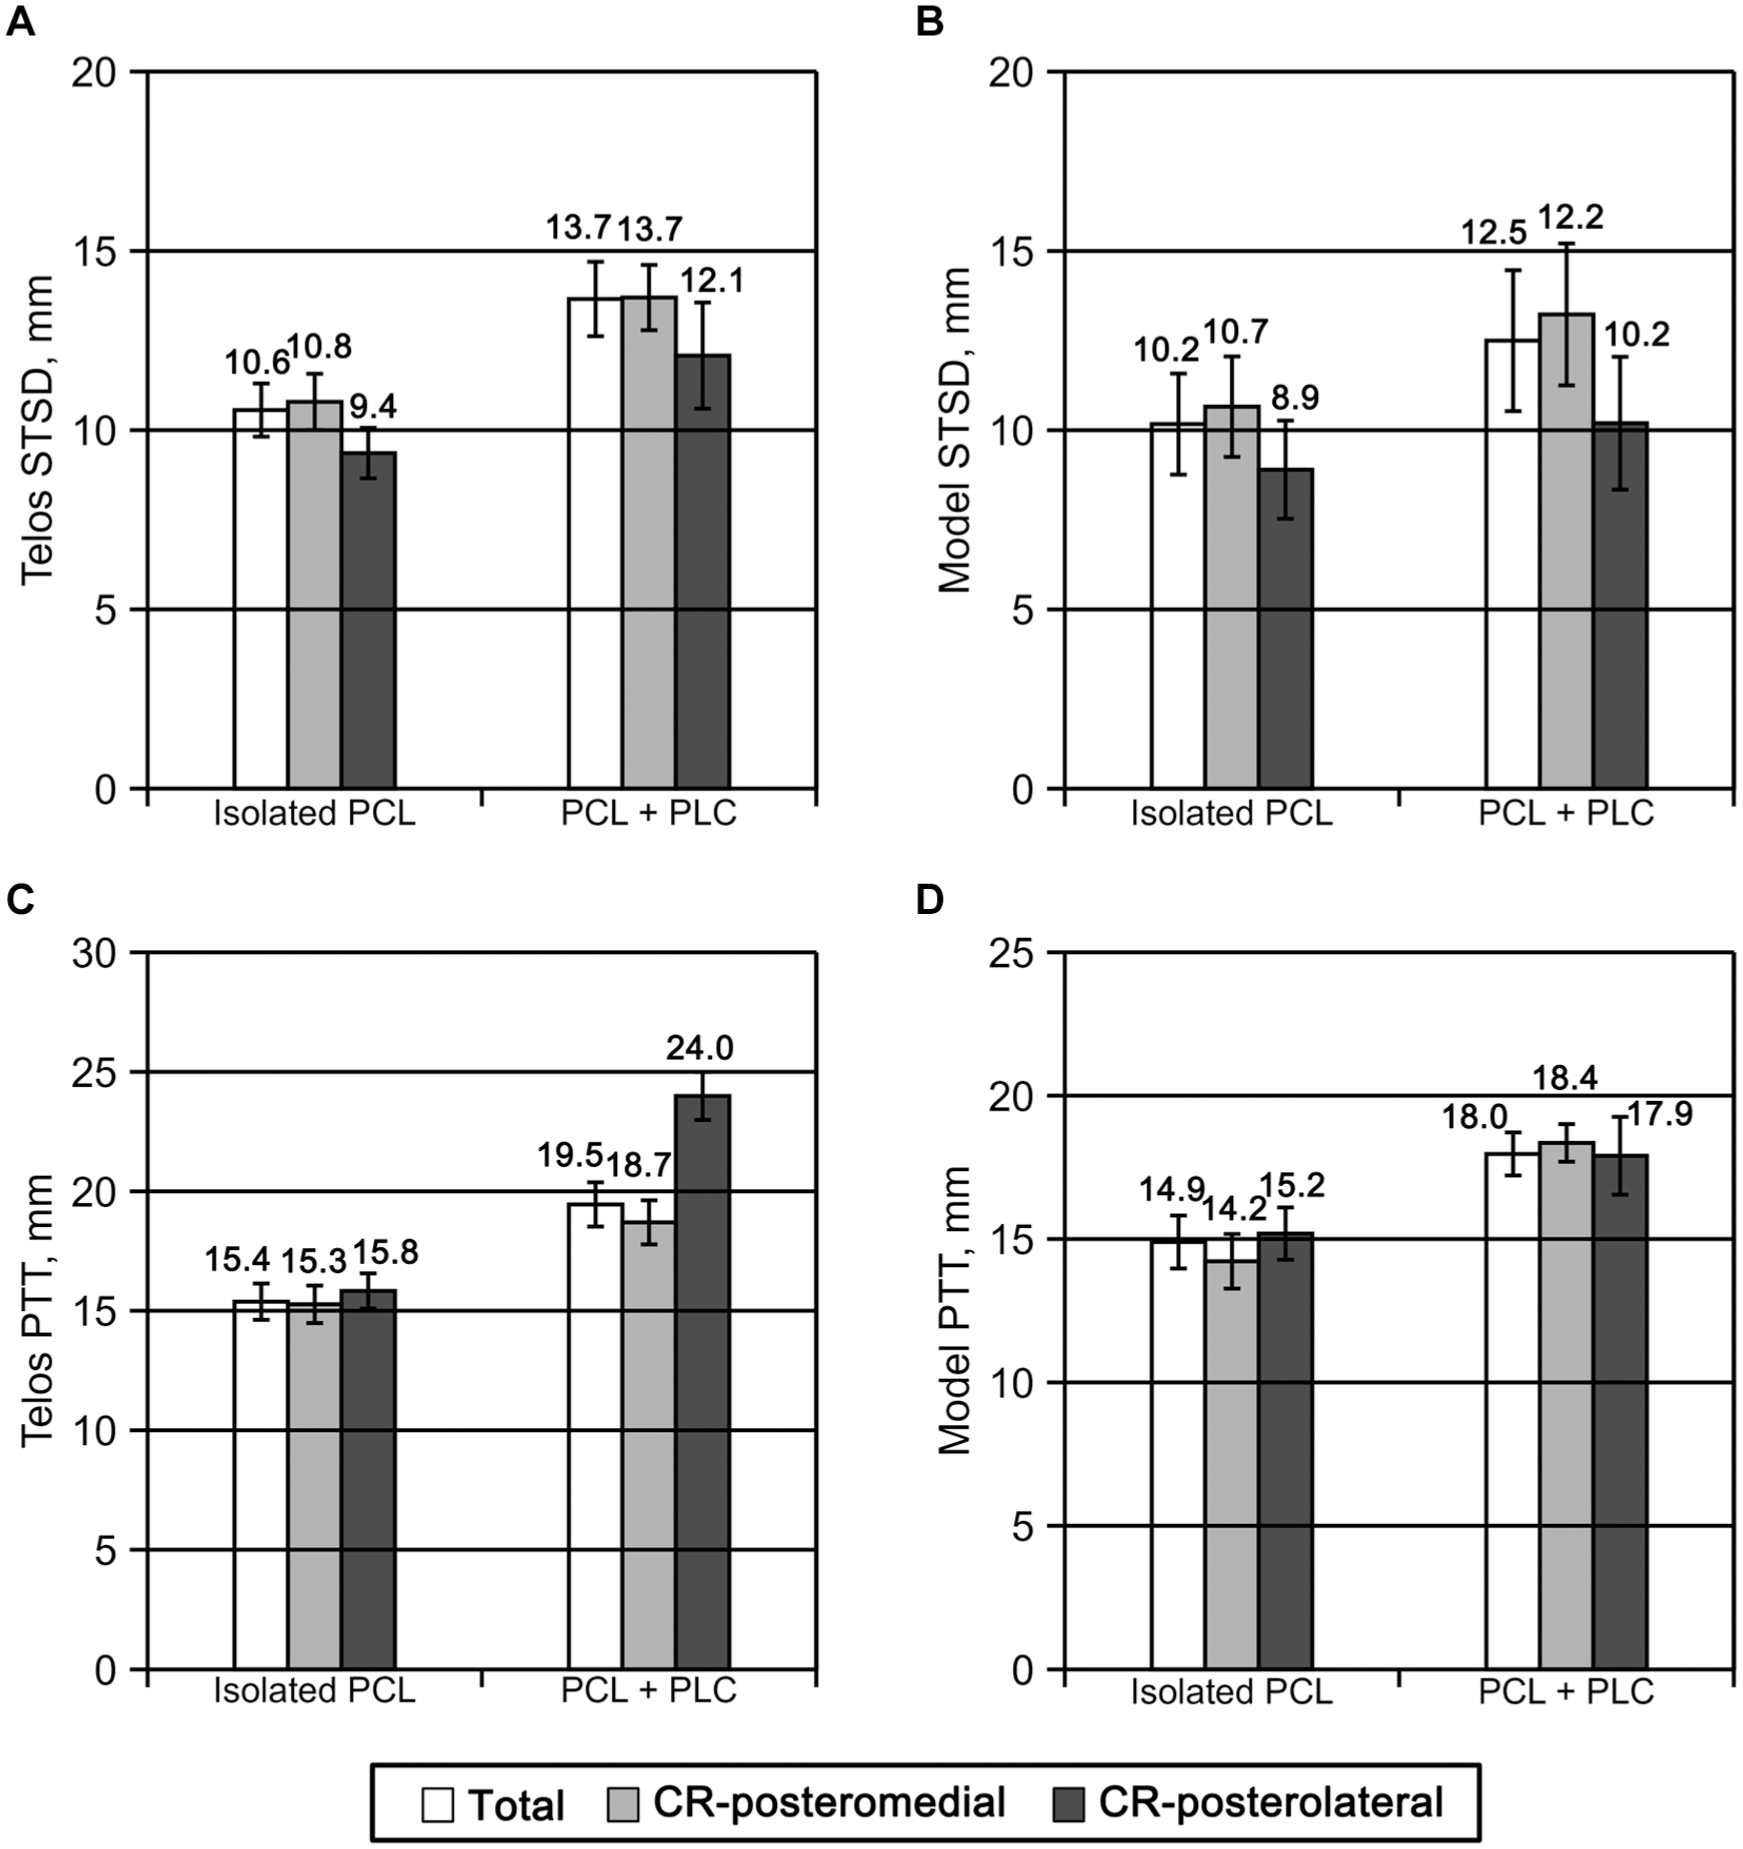
Exploratory stratified analysis based on subgroup-specific central tendency–based cutoffs. CR, contralateral referenced; PCL, posterior cruciate ligament; PLC, posterolateral corner; PTT, posterior tibial translation; STSD, side-to-side difference. Patients were dichotomized according to dial test positivity, and subgroup-specific central tendency values were used as reference cutoffs for posterior laxity measures: (A) Telos STSD, Side-to-side difference on Telos stress radiograph, (B) Model STSD, difference in model PTT between injured and contralateral knees, (C) Telos PTT, the greater value of the medial or lateral compartment PTT (D) Model PTT, the larger value of the medial or lateral compartment PTT. Telos and model STSD are reported as mean values, whereas Telos and model PTT are reported as median values according to data normality. CR, contralateral referenced, PTT, posterior tibial translation; STSD, side-to-side difference.
Discussion
Main findings of this study were that (1) posteromedial subluxation pattern, consistent with internal tibial rotation, was the predominant pattern. Of 127 cases, 93 cases (73.2%) had a posteromedial pattern; (2) the distribution of patients who underwent combined PLC reconstruction was not significantly different between posteromedial and posterolateral subgroups; and (3) the dial test was associated with posterior laxity (PTT or STSD) but was not specific for posterolateral subluxation.
Stäubli et al 27 reported that abnormal tibial rotation observed on stress radiographs in PCL-deficient knees could be classified into posterior, posterolateral, and posteromedial subluxation, each corresponding to concomitant injury of the posterolateral or posteromedial structures. In this study, rotational subluxation patterns identified on stress radiographs were highly consistent with model-based rotational patterns of the injured knee, confirming that these grossly identified patterns were not imaging artifacts but represent true rotational subluxation under posterior drawer force. However, consistency between gross and contralateral-referenced model classifications decreased because subluxation of the injured-side model alone may be misinterpreted due to a patient's inherent baseline tibial rotation. Thus, contralateral-referenced comparison was performed, and it allowed a more accurate assessment of relative rotational laxity by comparing each injured-knee model with the mirror-reversed model registered to the intact knee. In this analysis of side-to-side comparison, most of the gross posteromedial group remained posteromedial, whereas the gross posterolateral group showed low consistency, suggesting that rotational subluxation patterns on stress radiographs exist but may be influenced by baseline tibial rotation despite concomitant rotatory laxity. Although the PCL is typically regarded as a secondary restraint to external tibial rotation, and thus a predominance of posterolateral patterns might be anticipated, a predominantly posteromedial pattern was identified in the present study. However, Briese et al 6 demonstrated that combined PCL instabilities cannot be reliably differentiated using stress radiographs performed in different rotational positions. Furthermore, Damas et al 5 reported that posteromedial corner injuries can result in posterior tibial translation comparable with that observed in PLC injuries. These findings suggest that both medial and lateral structures may influence tibial subluxation patterns in PCL-deficient knees. Thus, further studies are warranted to confirm this unexpected finding.
A few studies have demonstrated that PCL deficiency can lead to internal tibial rotation.18,19,31 Kennedy et al 18 reported 2.8°± 2.1° increase of internal tibial rotation for complete a PCL-sectioned state when compared with the intact state in a cadaveric study. Wu et al 31 reported that PCL rupture caused 3.00° to 4.56° of internal tibial rotation under posterior drawer force on a finite element model. Consistent with these findings, internal tibial subluxation was more frequently observed in this study, even when concomitant PLC injury was clinically suspected. Relative rotational laxity was more severe in internal tibial subluxation in the CR posteromedial than in external subluxation in the CR posterolateral subgroup, contrary to our hypothesis that a posterolateral subluxation would be more prevalent due to concomitant PLC injury. This suggests that the PCL may function as a restraint to internal tibial rotation.
PCL injury frequently presents with other ligamentous injuries.19,22,29,30 A recent systematic review by Weiss et al 29 demonstrated that up to 70% of PCL injuries have concomitant PLC injury. LaPrade et al 19 reported that 62% of PCL injuries have PLC injury in a trauma setting. PLC deficiency is well known to increase external tibial rotation.2,10-12,26,28 However, diagnosis of PLC injury is challenging in chronic PCL deficiency.8,20,22 Several studies demonstrated that chronic PLC injury could not be reliably identified on MRI, with 48% to 57% of the sensitivity >12 weeks after initial trauma.8,19,20,22 Consequently, surgeons heavily rely on physical examination including a dial test, external rotation recurvatum test, posterolateral drawer test, and reverse pivot-shift test.7,20,22,32 Among these clinical assessment, the dial test is considered the successful test in detecting increased external rotational laxity. 20 In this study, PLC injury was diagnosed through repetitive dial tests preoperatively and under anesthesia. In contrast, Bae et al 2 reported that PLRI involving <2 PLC structures may not be clinically detected by dial test. The distribution of positive dial test did not differ significantly between CR posteromedial and CR posterolateral subgroups, indicating that a positive dial test may occur regardless of rotational laxity in this study. This suggests that a positive dial test is not strongly associated with a posterolateral pattern, which is typically considered indicative of PLRI, and may instead reflect a relative functional rotational difference between injured and intact knees.
To ensure clinical applicability of the dial test, we further investigated its relationship with other factors. Posterior laxity associated with Telos PTT/STSD, and model PTT/STSD demonstrated more significant predictors of positive dial test results rather than rotational laxity associated with model M-L and CR model M-L did not. Patients above the subgroup-specific cutoff values of PTT or STSD had markedly increased odds of positive dial test findings. LaPrade et al 19 reported that STSD of > 12 mm on stress radiograph indicated the presence of combined PCL and PLC injuries. Sekiya et al 26 reported that the knee with both PCL- and PLC-sectioned knee showed PTT of >22.3 ± 1.6 mm and STSD of >10 mm. These findings suggest that the dial test reflects a combined effect of posterior translation and rotation rather than isolated PLRI. Therefore, the decision to perform PLC reconstruction for chronic PCL deficiency with suspected PLRI should not be based solely on relative rotational laxity; the severity of posterior laxity should be evaluated concurrently. Our findings suggest that patients with dominant posteromedial subluxation may be at risk of overtreatment if only rotation is considered—a hypothesis that warrants further biomechanical studies.
Limitations
This study has several limitations. First, its retrospective design introduces potential selection bias. Second, the number of CR posterolateral cases was relatively small, and subgroup comparison is limited. Third, gross classification on stress radiograph is classified depending on observers, and it may be not enough to account for the inherent anatomic asymmetry between the medial and tibial condyles and the low agreement between gross posterolateral and CR posterolateral on contralateral-referenced analysis. Fourth, despite the submillimetric accuracy of our 2D-3D registration method and minimized projection error with methodology by Makelj et al 24 and Bey et al, 3 registrational error may still influence compartment-specific measurements. Fifth, models of intact side were constructed by mirror-reversed models of an injured knee as CT scans of an intact knee were not feasible. These models may not fully represent the true model of an intact knee. Sixth, defining an individual rotational axis on a 3D tibial model is challenging because of variability in bony morphology. Therefore, medial-lateral differences in posterior tibial translation were used as a surrogate measure of relative tibial rotation rather than absolute angular rotation. Seventh, although the CR model comparison was performed to minimize the effect of inherent baseline tibial rotation, no established standard exists for quantifying rotational laxity, and measured rotational laxity may not fully represent injury-related rotation; CR model comparison may be the most practical approximation, currently. Eighth, suspicious PLC injuries were assessed pragmatically using dial test at 30° of knee flexion rather than objective studies such as MRI or intraoperative findings. Because MRI has limited sensitivity for detecting combined PLC injuries in chronic cases, the dial test was performed repeatedly preoperatively and under anesthesia to enhance reliability, and suspicious PLC involvement was considered if consistent positive findings were identified. However, a positive dial test cannot be considered definitive evidence of structural PLC injury. Ninth, multiple univariate logistic regressions were performed without adjustment for multiple comparisons. These analyses were exploratory in nature and intended to identify mechanical factors associated with the dial test. Because the dial test may reflect various interacting contributors beyond PTT alone, further biomechanical investigations are warranted. Finally, the present study cannot demonstrate the biomechanical effects between posteromedial and posterolateral structures. Further cadaveric and biomechanical studies are warranted to clarify these mechanisms.
Conclusion
The posteromedial subluxation pattern, consistent with internal tibial rotation, was more prevalent than the posterolateral pattern in PCL deficiency. The dial test was associated with posterior laxity but was not specific for posterolateral subluxation. Patients with dominant posteromedial subluxation may be at risk of overtreatment if surgical decisions rely solely on rotational assessments; this concern warrants further biomechanical validation.
Footnotes
Acknowledgements
The authors would like to thank A.R. Kim for assistance with data collection.
Final revision submitted March 2, 2026; accepted March 8, 2026.
One or more of the authors has declared the following potential conflict of interest or source of funding: This work was supported by the National Research Foundation of Korea grant funded by the Korean government (RS-2024-00340610). This research was supported by Korean Fund for Regenerative Medicine funded by Ministry of Science and ICT, and Ministry of Health and Welfare (RS-2024-00334810; Republic of Korea).
Ethical approval for this study was obtained from Samsung Medical Center Institutional Review Board (IRB No. 2025-10-046).