Abstract
Background:
Patients with patellofemoral instability (PFI) have marked patellofemoral dysplasia, with severity often dictating surgical management. Typically, trochlear dysplasia is characterized in the two-dimensional (2D) plane using the Dejour classification, whereas patellar dysplasia is characterized using the Wiberg classification. However, these conventional systems have highly variable interrater reliability and fail to fully characterize dysplastic changes across the three-dimensional (3D) surfaces of the patellofemoral joint. The primary aim of this study was to evaluate whether integrated Gaussian curvature (K) – a geometric property describing surface shape – can distinguish dysplastic features of the trochlea, patella, and proximal tibia in pediatric patients with PFI vs. controls. A secondary aim was to determine whether K correlates with established clinical measurements.
Hypothesis:
K will distinctly quantify 3D dysplastic surface changes in the patellofemoral joint in patients with PFI vs. controls.
Methods:
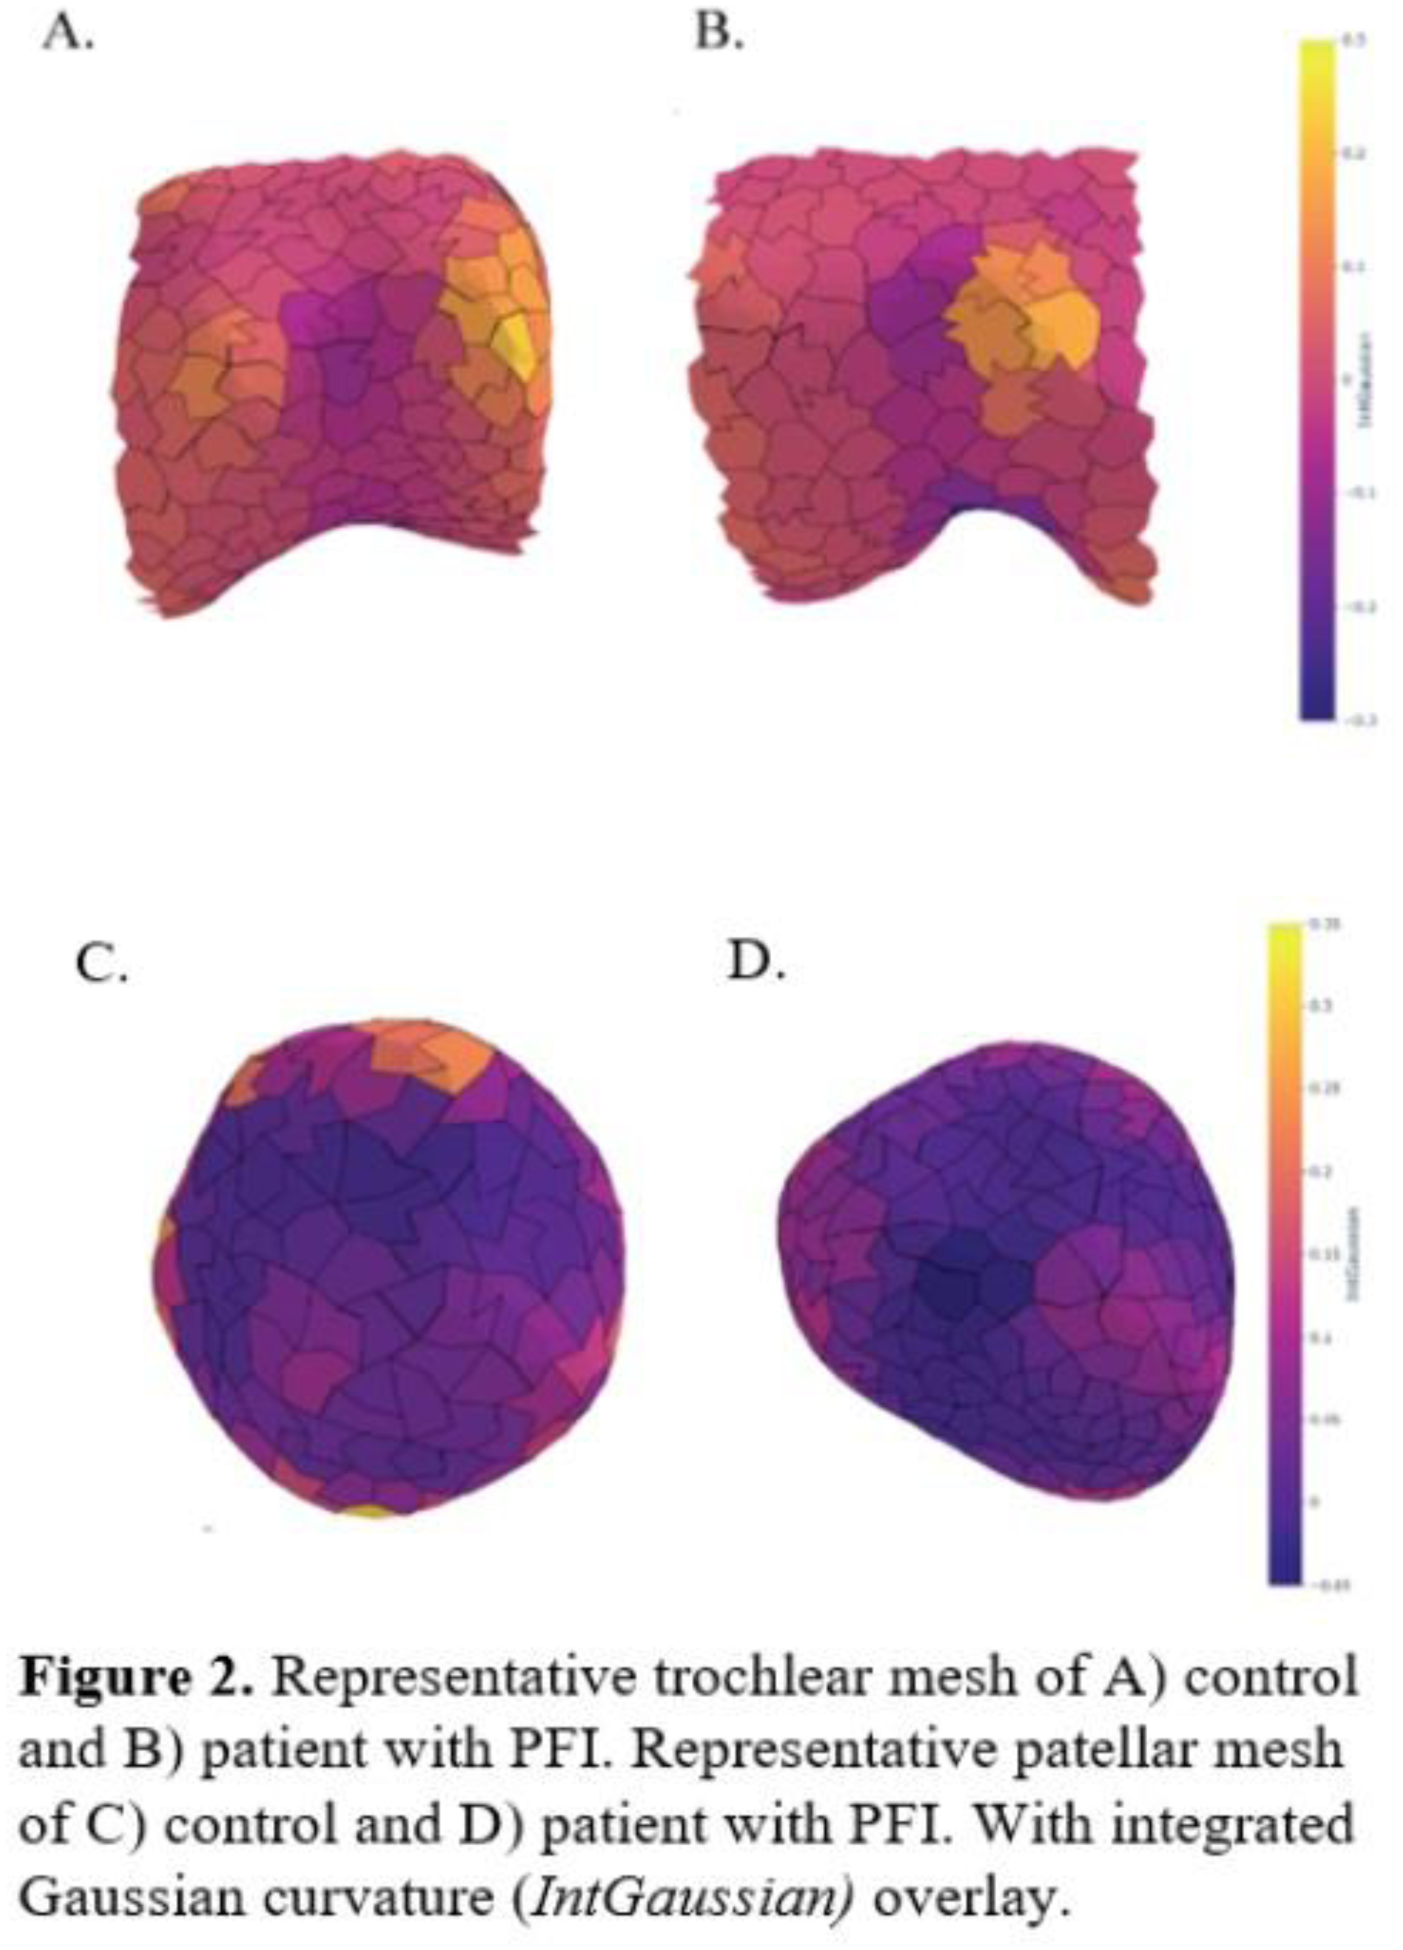
Retrospective magnetic resonance imaging (MRI) scans were obtained for 29 pediatric knees (14 PFI, 15 control; all <18 years). Patients with syndromic or obligatory PFI were excluded. Bone and cartilage surfaces of the distal femur (up to 1cm above the trochlea), patella, and proximal tibia (down to 1cm below to the tibial tubercle) were segmented, smoothed, and converted into surface meshes using Simpleware ScanIP (Synopsys, 2024). K was calculated for each surface (K>1: spherical; K=0.5: cylindrical; K<0: saddle; positive=convex vs. negative=concave). Standard 2D clinical measurements were also performed: tibial tubercle-trochlear groove (TT-TG) distance, tibial tubercle-posterior cruciate ligament (TT-PCL) distance, knee rotation, sulcus angle (SA), trochlear depth (TD), Caton-Deschamps (CDI), lateral patellar tilt (LPT). Group differences were analyzed using Wilcoxon or two-tailed t-tests; Spearman’s correlation assessed associations between K and 2D measurements.
Results:
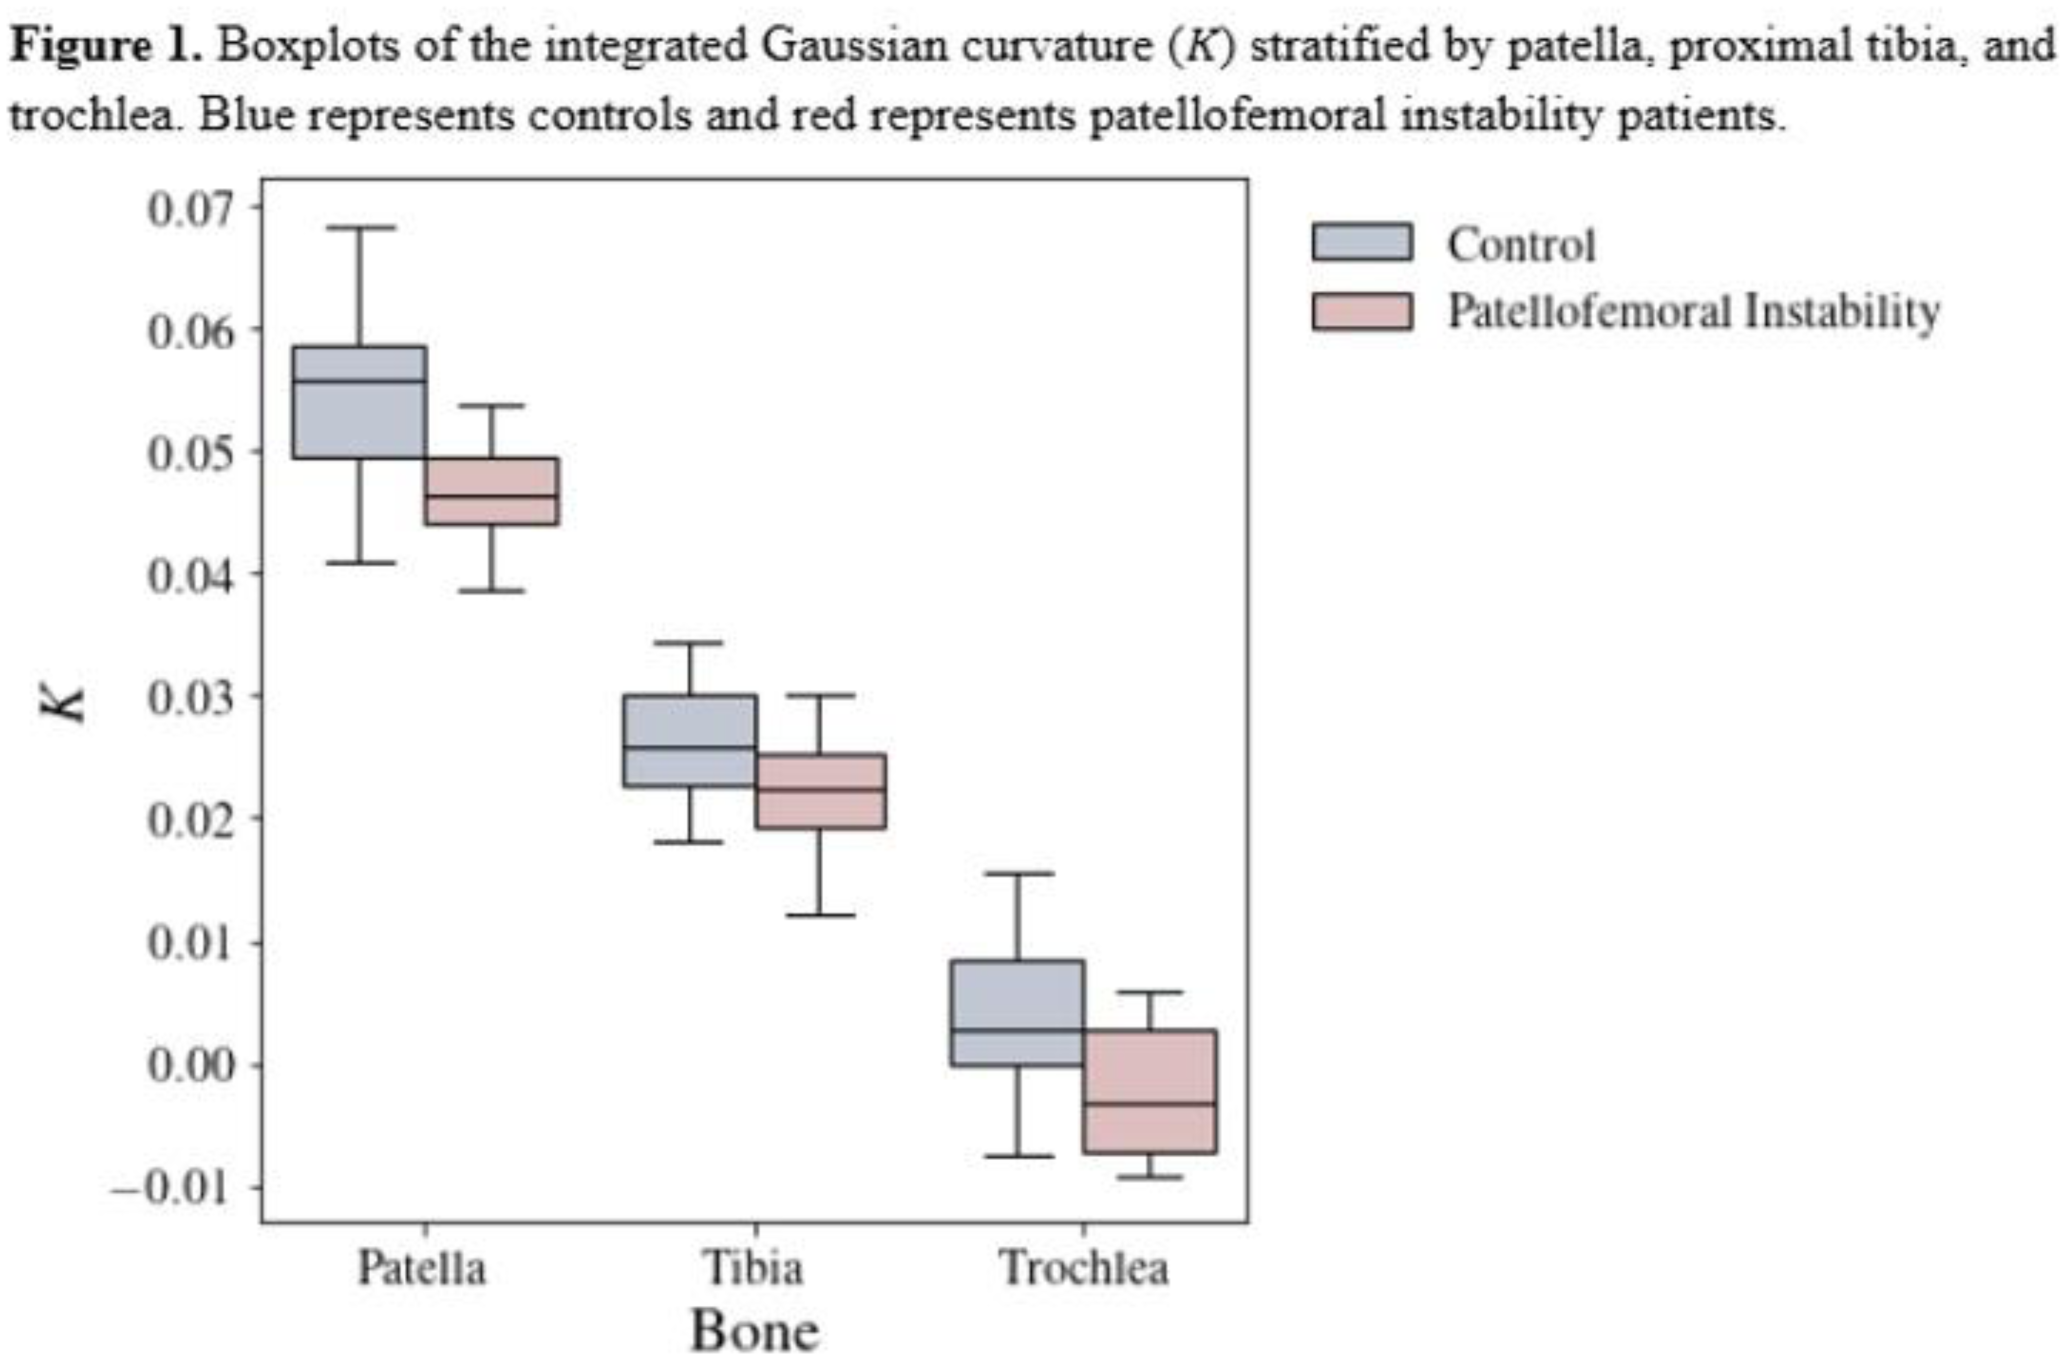
11 (78.6%) PFI patients were female (mean age: 12.5±1.4) and 12 (80%) controls were female (mean age: 11.5±1.6). Trochlear K (-2.09x10⁻³ vs. 3.98x10⁻³; p=0.006) and patellar K (4.73x10⁻² vs 5.43x10⁻²; p=0.004) were significantly lower in PFI patients, whereas tibial K did not differ significantly (2.22x10⁻² vs. 2.57x10⁻²; p=0.065). Trochlear K correlated moderately with TD (positive) and SA, TT-PCL, and LPT (negative). Patellar K correlated moderately with CDI and LPT (positive).
Conclusion:
Trochlear and patellar K are promising 3D quantitative biomarkers that distinguish dysplastic changes in PFI and show moderate correlation with conventional 2D imaging metrics. These findings support further investigation into their utility for surgical planning and outcome prediction.