
Abstract
In this article, we propose a metagenomic next-generation sequencing (mNGS) system for symptomatic clinical respiratory disease samples in Israel to enable detection early enough to contain novel pathogen outbreaks, limit international spread and expedite countermeasure development. We built an open-source, interactive SEIR (susceptible, exposed, infectious, recovered)-based model extending the work of Sharma et al (2023) for 7 representative known respiratory pathogens with pandemic potential, aiming to estimate costs and detection time for the identification of a novel respiratory pathogen in Israel through a network of mNGS monitoring in hospitals. We find that a novel pathogen with SARS-CoV-2-like characteristics could be detected within 68 days (interquartile range [IQR]: 53 to 80) after the first 2 emergency department presentations and 213 (IQR: 94 to 429) total infections across Israel. This surveillance system would cost US$24 million annually over 10 years when implemented in Israel’s 6 largest hospitals, covering 37% of the population. Our open-source interactive model allows policymakers and experts to explore different system configurations and their associated tradeoffs between cost, detection speed, and population coverage.
Keywords
Background
Problem Description
E
Early Detection Methods for Novel Pandemics
Enhancing infectious disease surveillance strengthens health security and outbreak management. 11 Early in a novel pathogen outbreak, a critical window allows for potential containment. Even without full containment, early warning systems accelerate response, inform interventions, and conserve lives and resources.12,13 However, contemporary public health surveillance faces challenges to promptly detect new pandemic pathogens. Standard lab tests are not pathogen agnostic, meaning they cannot detect a pathogen without a predetermined target, and therefore often fail to identify novel pathogens. 14 Currently, detection relies on symptom-based surveillance, which depends on clinicians recognizing and reporting unusual patterns. Given the volume of unexplained infections and clinical variability, this approach yields high rates of false-positive and false-negative results. 15 Consequently, discernible signals arise only with significant differences in case frequency and nature, often hindering timely containment. 16 Additionally, seasonal surges of endemic respiratory infections further obscure emerging outbreaks by masking new pathogen signals within overlapping infection trends.17,18
Technological Solutions to Improve Early Detection
Pathogen-agnostic detection is essential for modern surveillance. A future pandemic may arise from a novel virus divergent from known species, making targeted testing inadequate for early detection.14,19 Metagenomic next generation sequencing (mNGS) is a group of technologies that enables untargeted sequencing, reading out a random subset of RNA and DNA sequences in a sample without prior assumptions about its contents. 20
Applying mNGS for disease surveillance could significantly shorten detection time, enabling early containment, source identification, and isolation of initial cases. It also offers critical insights into novel pathogens, supporting outbreak preparedness and accelerating vaccine and treatment development.9,10 In some cases, mNGS could also aid healthcare workers in everyday clinical diagnosis. 21 Clinical applications of mNGS may drive economies of scale, creating a positive feedback loop in which broader adoption enhances routine care while lowering costs.22–27
However, several technical barriers limit the widespread use of mNGS for outbreak detection. For example, effective implementation depends on strategic sample site selection. While wastewater offers broad surveillance potential, high contamination reduces mNGS sensitivity. Clinical samples, such as blood and nasal swabs, yield higher sensitivity, though abundant host nucleic acids and low pathogen titers remain challenges. Emerging host depletion and pathogen enrichment techniques can mitigate these issues; however, they must be carefully selected—pathogen-specific methods may compromise detection of other agents, undermining pathogen-agnostic capability.14,23,28,29 Furthermore, the adoption of mNGS is also limited by the need for specialized equipment and expertise. Its high data output currently requires advanced, costly bioinformatics analysis. On the other hand, declining costs and complexity of related technologies may improve accessibility over time. 30
Sharma et al proposed to use mNGS in an architecture called Threat Net: an early detection system monitoring novel pathogens using mNGS at hospital emergency departments (EDs) as a high-yield surveillance location in the United States. 31 While outbreaks arise from diverse pathogens, those transmitted via airborne routes have greater pandemic potential. 32 For that reason, individuals presenting with influenza-like illness—defined by acute fever plus cough or sore throat—are systematically sampled upon ED arrival for diagnostic testing. Alongside standard molecular assays, a portion of the sample undergoes parallel mNGS analysis. Genetic sequences are immediately compared to databases to identify known pathogens. Instances where an unprecedented sequence is identified, trigger a comprehensive review by a multidisciplinary team of infectious disease experts, microbiologists, bioinformaticians, and public health officials, who interpret the findings and coordinate appropriate responses, including outbreak investigations and public health interventions. 31 No previous study has investigated this promising architecture for other settings than the United States. The purpose of this article is to expand upon the Threat Net simulation-based model and estimate its effectiveness in the Israeli setting.
Why Israel?
Israel’s centralized, universal healthcare system mandates insurance for all residents, providing public health coverage with options for enhanced coverage and supplementary private insurance. 33 Israel is a promising site to implement mNGS based surveillance in healthcare settings for several reasons. First, mNGS is only useful if the resulting data can be organized and acted upon. Israel demonstrated this capacity through its robust SARS-CoV-2 genomic surveillance system combined with electronic health records data and significant pandemic mitigation investments.15,34 Second, Israel’s thriving health technology sector supports ongoing mNGS development. 35 Third, heightened bioterrorism concerns may bolster political will for biosecurity investments. 36 Overall, Israel possesses the infrastructure and resources to establish a cost-effective early detection system.34,37
This paper aims to assess the projected costs of a metagenomic biosurveillance network (MBN) in Israel and its impact on novel pathogen detection, focusing on detection time and infection count at identification.
Methods
Model Overview
The use of SEIR models, where each person is in one of the “susceptible,” “exposed,” “infectious,” and “recovered” compartments and there are defined rates at which people transition between compartments, is a well-established approach in epidemiological studies. 38 Sharma et al previously developed an SEIR model to estimate infections occurring before MBN detection enables public health intervention in a novel outbreak. 31 One advantage of the focus on early outbreak detection is that it only models the early phase of disease transmission and thus renders additional features such as vaccination, reinfection, or mortality redundant to the model. Only a fraction of simulated infections results in hospitalization. Upon hospitalization, individuals cease community transmission and may receive mNGS testing to identify the outbreak’s cause. The “exposed” category represents the incubation period during which infected individuals are not yet infectious and do not seek hospital care, reflecting the pathogen’s natural incubation time. Disease outbreaks are inherently stochastic, and this is reflected in our model by each transition occurring randomly at some rate. For instance, rather than in a deterministic model specifying that each person infects exactly 3 other people, our computational model repeatedly draws random numbers to determine outbreak progression at each time step. The eventual detection of the outbreak is also stochastic, with only some patients tested, with a less-than-perfectly sensitive test.
Our model consists of 3 parts:
Epidemiological modeling of a hypothetical outbreak Estimating the effectiveness of the MBN at detecting a novel pathogen Estimating the costs of the MBN at different degrees of implementation
Additionally, we developed an open-access web interface for our model, allowing users to explore estimated detection times across varying pathogens and implementation levels. It is available at https://biosurveillance.shinyapps.io/MBN_app/.
Estimating Time to Outbreak Detection
Understanding MBN’s detection rate requires modeling various scenarios. Respiratory pathogens differ in transmission, incubation, illness duration, and reproduction rates, all affecting detection time and pandemic potential. Because future pathogens’ traits are uncertain, simulating diverse outbreak scenarios helps evaluate MBN’s impact on detection timing. The selected pathogens reflect a range of epidemic potentials for this capability assessment. We will assume that as the simulation runs, the pathogen is not yet known and therefore targeted testing capabilities such as targeted quantitative polymerase chain reaction (qPCR) are not yet possible. The pathogen characteristics have been summarized for the following pathogens in Table 1: SARS-CoV-2 wildtype, SARS-CoV-2 Omicron, SARS-CoV-1, Middle Eastern respiratory syndrome coronavirus (MERS-CoV), seasonal influenza (multiple influenza A and B strains that have caused epidemics), H1N1 influenza A (cause of 1918 influenza pandemic, also known as Spanish flu) and HPAI (highly pathogenic avian influenza, a form of bird flu caused by influenza A strains which is currently being monitored because of its pandemic potential 39 ). Severity of the disease was not included in the model due to lack of reliable data. Similarly, mortality was excluded since the model focuses on early detection. MERS-CoV was included due to its spread through camels in Middle Eastern countries, making it more relevant for Israeli detection systems.40–42 Three different strains of SARS-CoV were included because all 3 have historically proven their capacity to cause an outbreak among humans, but their pathogen characteristics have caused very different outbreak dynamics.
Characteristics of Pathogens Used to Simulate Different Epidemics
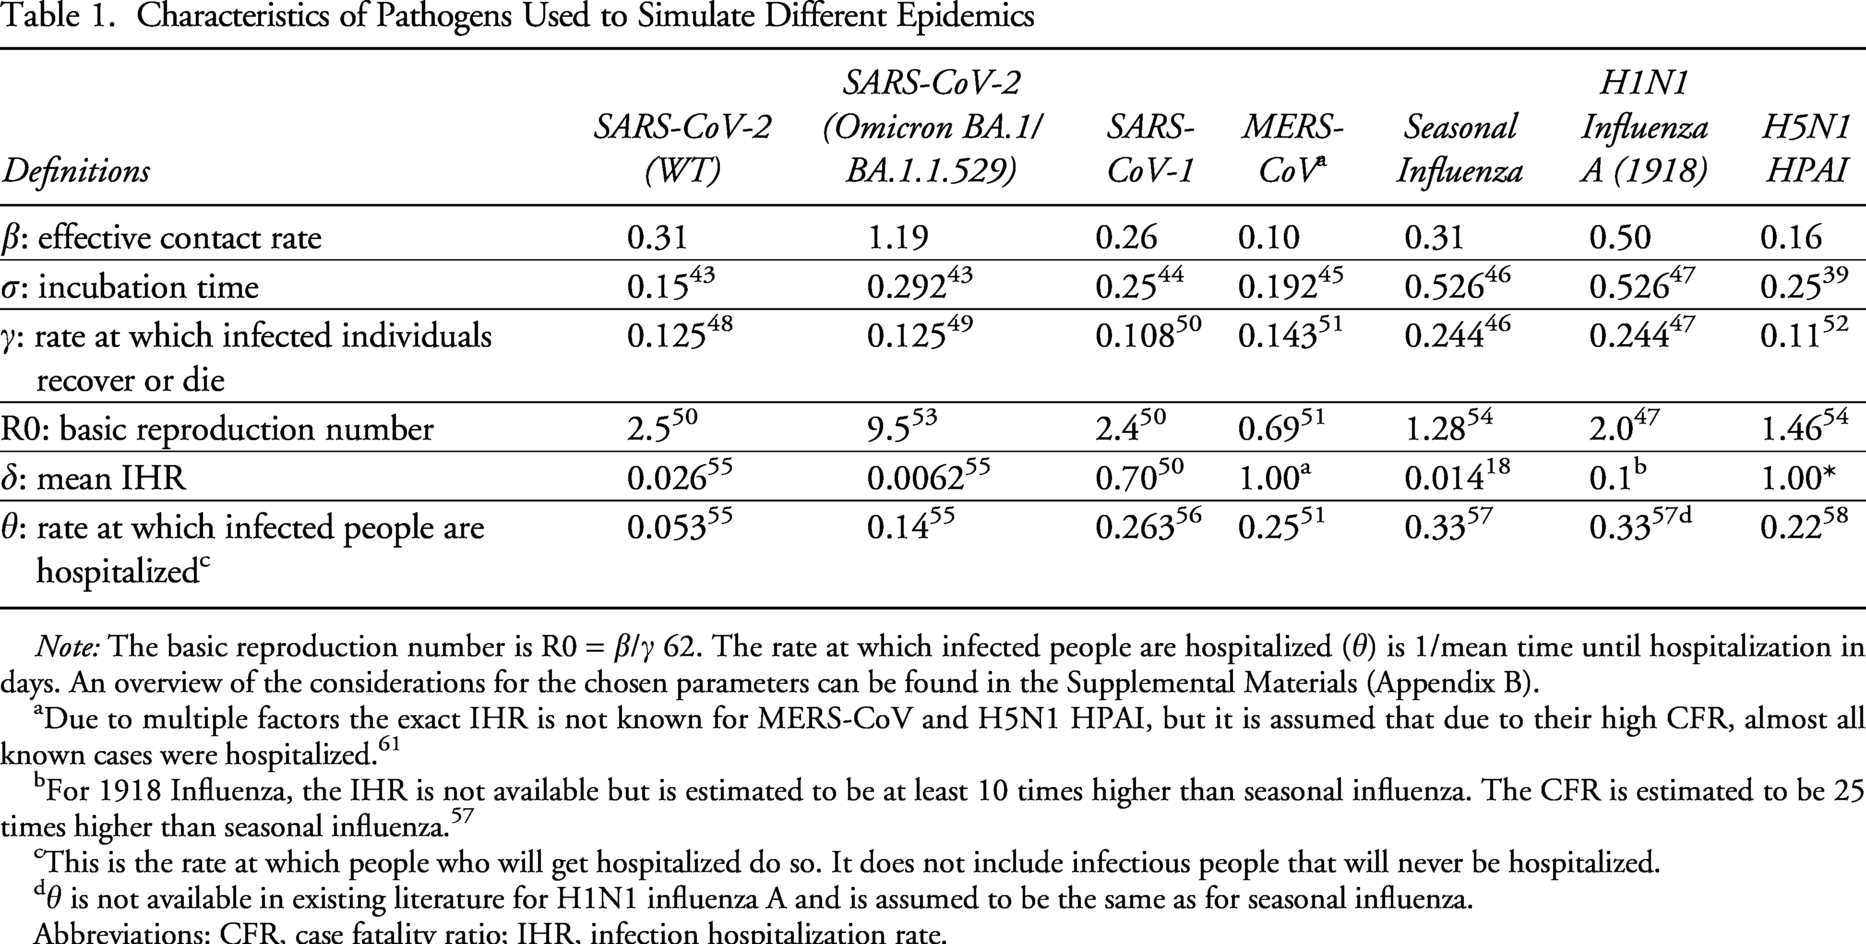
Note: The basic reproduction number is R0 = β/γ 62. The rate at which infected people are hospitalized (θ) is 1/mean time until hospitalization in days. An overview of the considerations for the chosen parameters can be found in the Supplemental Materials (Appendix B).
Due to multiple factors the exact IHR is not known for MERS-CoV and H5N1 HPAI, but it is assumed that due to their high CFR, almost all known cases were hospitalized. 61
For 1918 Influenza, the IHR is not available but is estimated to be at least 10 times higher than seasonal influenza. The CFR is estimated to be 25 times higher than seasonal influenza. 57
This is the rate at which people who will get hospitalized do so. It does not include infectious people that will never be hospitalized.
θ is not available in existing literature for H1N1 influenza A and is assumed to be the same as for seasonal influenza.
Abbreviations: CFR, case fatality ratio; IHR, infection hospitalization rate.
Using the historical data of respiratory pathogens derived from existing literature through a literature scope, we modelled potential epidemics of similar characteristics, simulating the amount of time and infections that would have occurred until detection through the MBN in a fully susceptible population. To estimate the time until detection of a human infection with a novel pathogen in Israel we used a variant of the standard SEIR model, based on 4 infection compartments that use the standard population conservation law—tracking the total population and their infection status, as explained in the Supplemental Materials (Appendix A).38,59 A system of ordinary differential equations was used to model the time evolution of these groups. 59 The ordinary differential equations were parameterized using reported case data for a variety of diseases, listed in Table 1. As well as being of direct interest for each of these historical diseases, this serves as a sensitivity analysis showing how disease outbreak and detection dynamics vary for different pathogen characteristics.
As noted in Figure 1, in addition to the infection compartments, we track the number of people who will get tested at a hospital. This requires the addition of prehospitalization (P), hospitalization (H) and tested positive (T) “tracking compartments.” These are subsets of the main infection progression compartments that track the severity of infection. For instance, P is a subset of I, representing the fraction (δ) of infections that will eventually require hospitalization. Severe infections do not immediately become hospitalized, however, there is some rate θ at which severe cases seek hospital care.
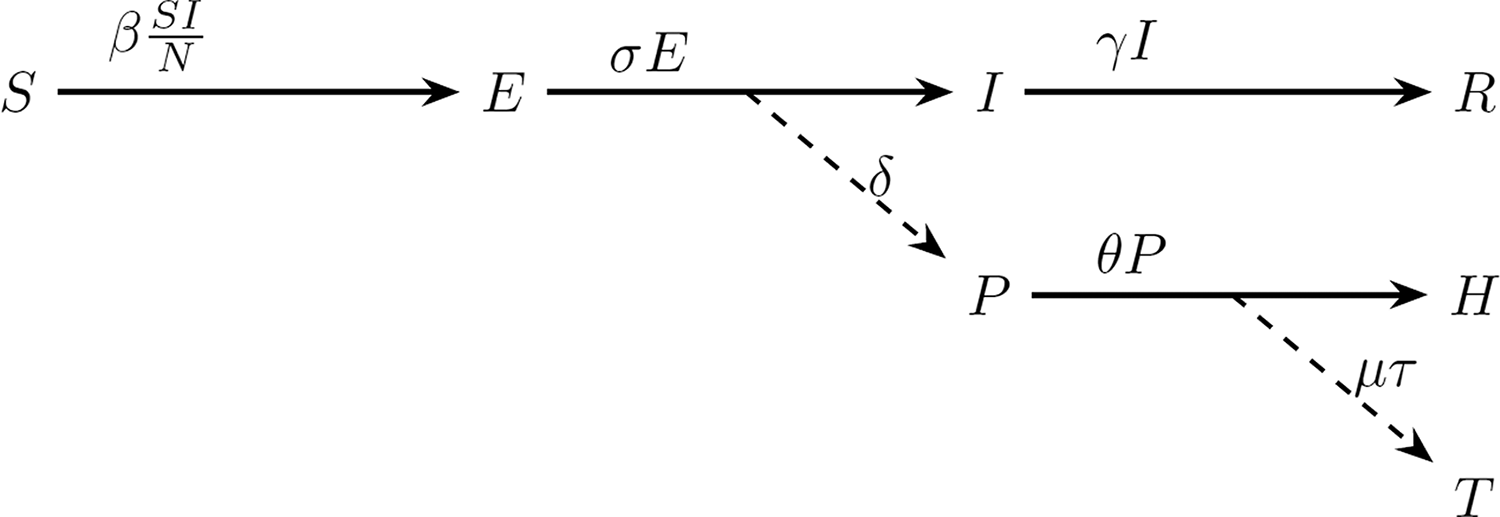
Overview of the modelling used to estimate the metagenomic biosurveillance network’s ability to detect outbreaks of novel pathogens in Israel. Our model is based on the classical SEIR model with the addition of the tracking compartments prehospitalization (P), hospitalization (H) and tested positive (T). The dashed lines represent probabilities, and the solid lines represent rates. Abbreviation: SEIR, susceptible, exposed, infectious, recovered.
Following the previous paper by Sharma et al, the model only explicitly represents symptomatic cases. 31 Since the derived transmission and incubation numbers are based on surveillance, the model implicitly represents only the cases that are detected. Asymptomatic spread and undetected cases are not explicitly counted, but their contribution to spread is accounted for due to the model fit. An overview of these and other assumptions made in this model is provided in the Supplemental Materials (Appendix B).
Estimating Probability of Detection
Building on the model by Sharma et al, the probability of successfully detecting that a given patient is infected with a novel pathogen p is defined as:

Detection within the SEIR model was simulated using tracking compartments, with a probability δ representing the likelihood that an infected individual with influenza-like symptoms seeks care at an ED. 68 The actual hospitalization and the mNGS test occur randomly after a period of time which is distributed with a mean of 1/θ. Once hospitalization has occurred, detection of a true positive occurs with a probability of μτ. μ is the fraction of the total cases that gets tested, which depends on the number of EDs connected to the MBN and the proportion of the Israeli population each ED serves. The population coverage per hospital was determined by the number of annual ED visits a specific hospital receives as a proportion of the total number of yearly ED visits in Israel (Figure 2).63,64 We conducted a retrospective analysis using data from the National Emergency Department Visits Database (NEDVD), maintained by the Ministry of Health’s Health Information Division. The NEDVD includes all visits to EDs in 29 acute care hospitals in Israel, covering 98% of ED beds. To estimate population coverage, we calculated each hospital’s share of national ED visits for the years 2019, 2020, and 2021 (see Supplemental Materials Appendix C). Despite total visit fluctuations—particularly in 2020 which can be explained due to the unusual circumstances including COVID-19 lockdowns—the relative distribution remained consistent. The model is based on the average across these years. 69 τ is the sensitivity of mNGS. A recent meta-analysis has determined mNGS’ sensitivity for pathogen-agnostic detection in clinical samples to be 0.75. 70
Each scenario was simulated for the first 100 days, with 1,000 replicates for each scenario. Detection probability was calculated as the proportion of simulations in which the MBN successfully identified a novel pathogen within the first 100 days. For each simulation, we recorded the number of days until detection and cumulative infections at detection. In the stochastic model, simulations ended once a predefined threshold (Ω) of individuals tested positive for a novel pathogen, triggering an outbreak investigation. This detection threshold is a policy choice: lower values support a more precautionary approach, while higher thresholds reduce false alarms.
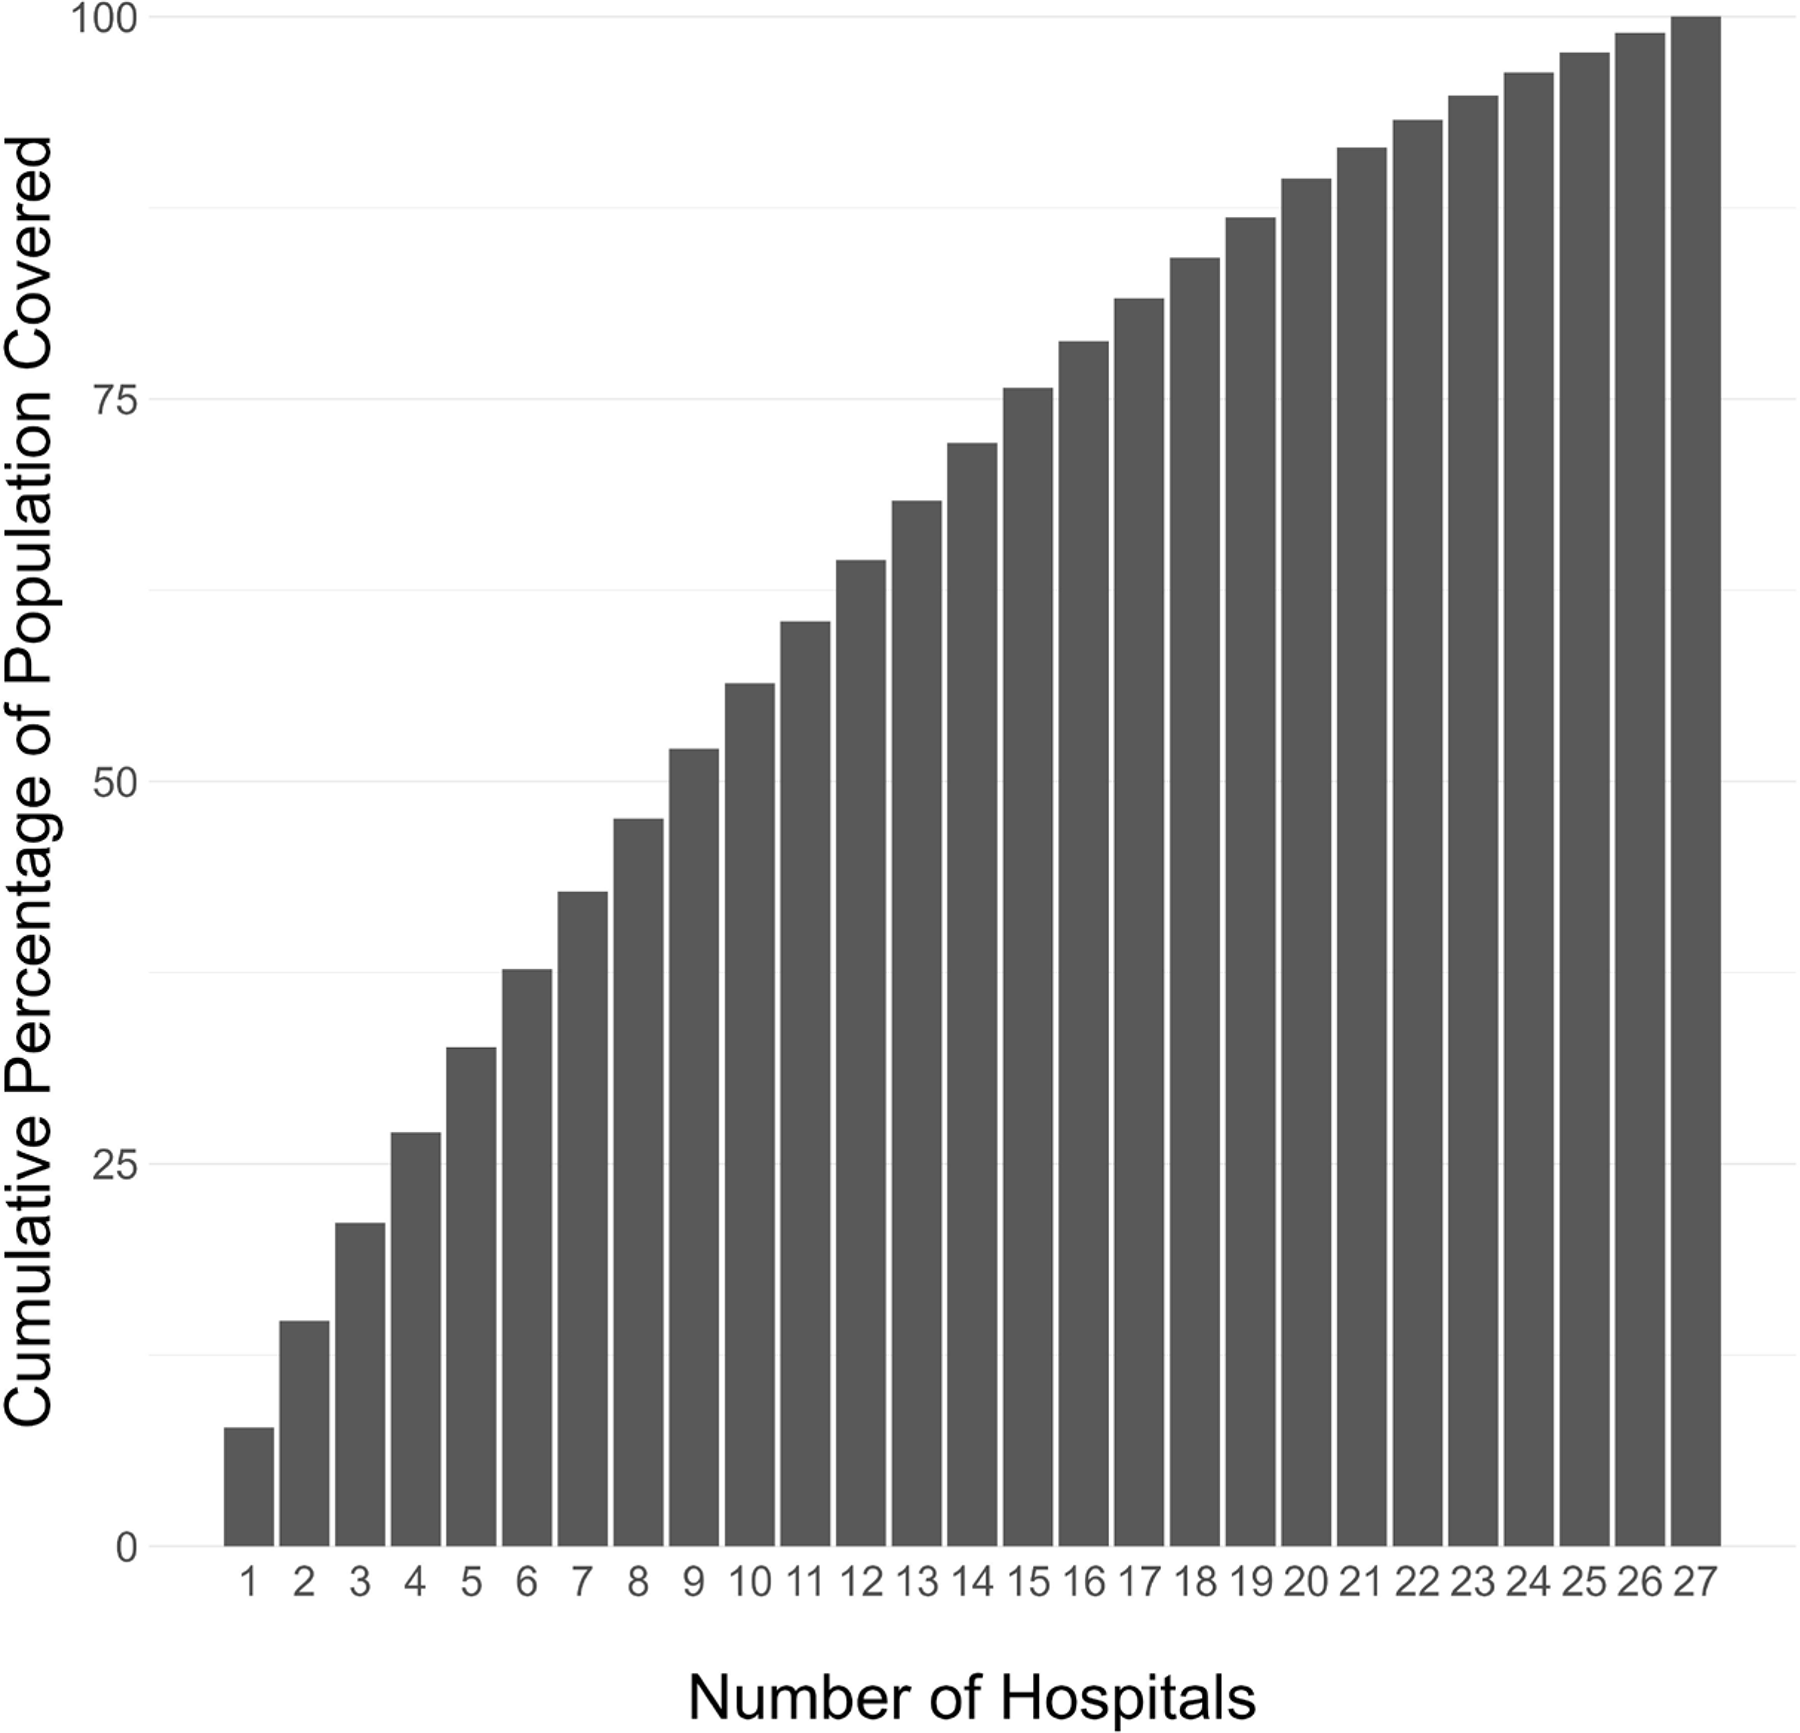
The cumulative the population coverage per hospital connected to the metagenomic biosurveillance network. The hospitals are ranked based on the population size their emergency departments serve from large (many people) to small (few people).
Cost of MBN Architecture
The costs of the MBN were modeled as a function of implementation and operational expenses for different degrees of implementation. Cost components included salaries for lab personnel, lab space in Israel, cloud storage, reagents, and metagenomic sequencing equipment—specifically the Illumina 1000. Annualized costs were estimated over a 10-year period (see Supplemental Materials Appendix D). However, these estimates likely overstate actual costs, as sequencing reagents—the largest expense—may decrease through innovation and bulk purchasing. Data were sourced from publicly available materials and where possible validated with relevant experts for accuracy.
Results
The MBN Costs
We begin by analyzing MBN costs relative to hospital enrollment and population coverage. Installing mNGS at the six largest hospitals achieves 38% coverage; expanding to the top 16 hospitals increases coverage to 79%. This increase in hospitals required to approximately double population coverage is attributed to disparities in ED visit volumes, with high-traffic hospitals contributing most to early coverage gains. However, as additional hospitals are added, each yields progressively smaller increases, illustrating diminishing returns.
Implementation costs consistently account for approximately 11% of total annualized expenses across all coverage levels. Table 2 summarizes estimated MBN costs by hospital and population coverage.
An Overview of the Associated Costs of the MBN for Different Degrees of Implementation
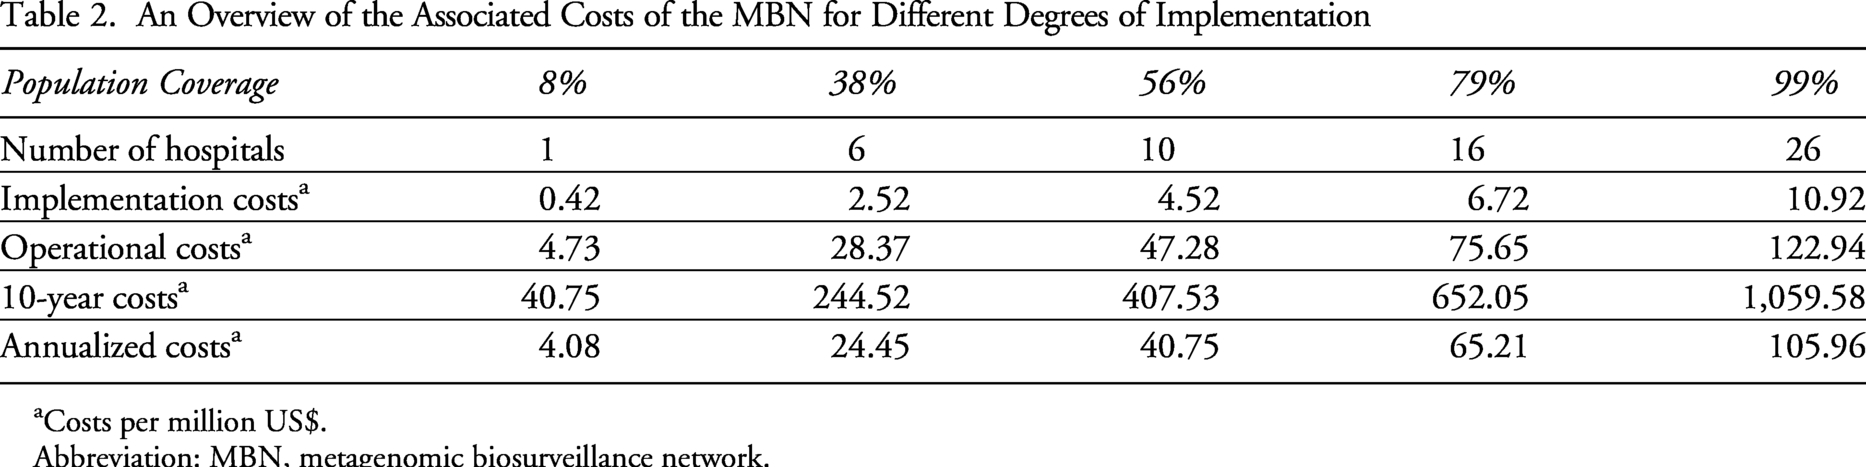
Costs per million US$.
Abbreviation: MBN, metagenomic biosurveillance network.
Disease Progression
Figure 3 shows the disease progression for 7 different known pathogens with pandemic potential: MERS); H1N1 influenza; SARS caused by SARS-CoV-1, SARS-CoV-2, and SARS-CoV omicron; seasonal influenza (data derived from different virus lineages); and avian influenza (H5N1 HPAI).
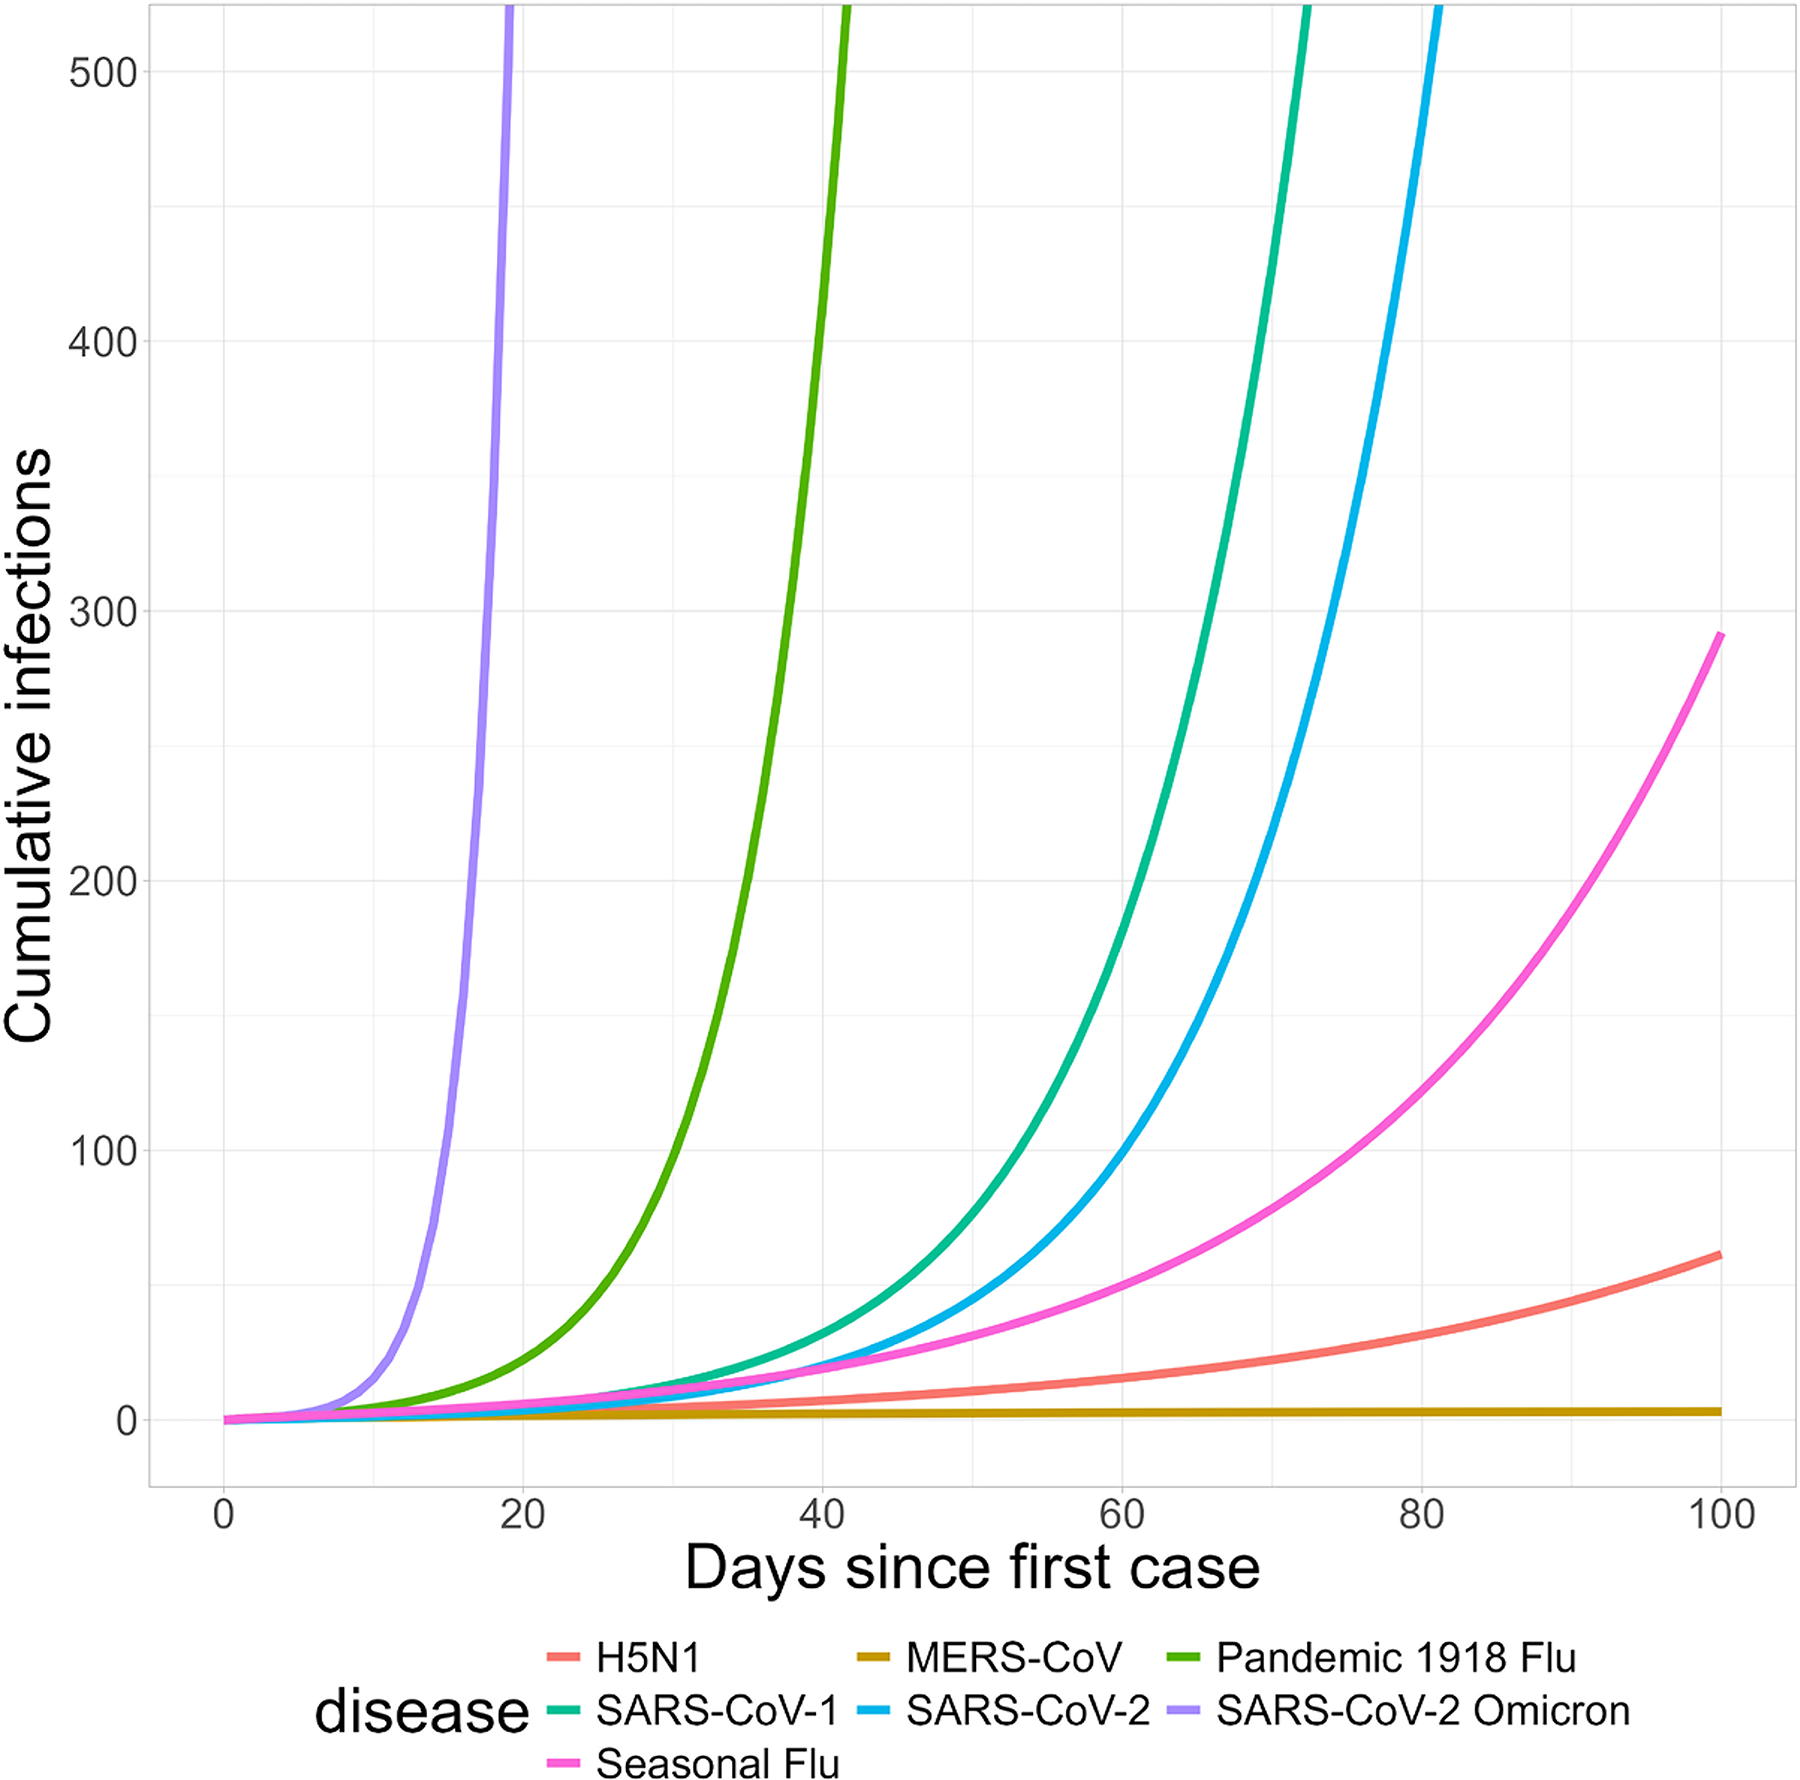
Deterministic SEIR model for 7 pathogens. The graph displays the median disease progression per disease: MERS, H1N1 influenza (1918), SARS-CoV-1, SARS-CoV-2, SARS-CoV Omicron, seasonal influenza (data derived from different virus lineages), and avian influenza (H5N1 HPAI) in the Israeli population. Stochasticity can be displayed per disease on the interactive display, but is not shown here. Abbreviations: MERS, Middle Eastern respiratory syndrome; SEIR, susceptible, exposed, infectious, recovered.
Outbreak Detection: SARS-CoV-2 Wildtype
We modeled detection time and infection counts across varying population coverages, detection thresholds, and pathogens.
Using SARS-CoV-2 wildtype as a reference, the MBN with a 38% population coverage is estimated to detect the virus on average by day 68 postintroduction with an interquartile range (IQR) of 53 to 80, after 213 cumulative infections (IQR: 94 to 429) and 2 ED presentations (IQR: 1 to 5). Expanding population coverage to 79% advances detection by 11 days, to day 57 (IQR: 53 to 80), with fewer infections (90; IQR: 34 to 199) and 1 ED presentation (IQR: 1 to 2).
Our interactive web tool (https://biosurveillance.shinyapps.io/MBN_app/) enables exploration of varying coverage levels, pathogen scenarios, detection thresholds, and associated costs and timelines.
Figure 4 illustrates the inverse relationship between the cumulative number of infections at detection and the costs with additional population coverage at a detection threshold of 1. Notably, this correlation appears to be nonlinear; we discern a sharp decline in cumulative infections upon detection within the first US$20 million to US$30 million allocated, after which the curve starts to flatten, suggesting a plateau effect indicative of diminishing returns on further investments. Figure 5 delineates the temporal aspect of detection, again highlighting the marked efficiency gains up to the US$20 million to US$30 million mark. After this investment threshold, the days until detection continue to decrease, albeit at a decelerated pace.
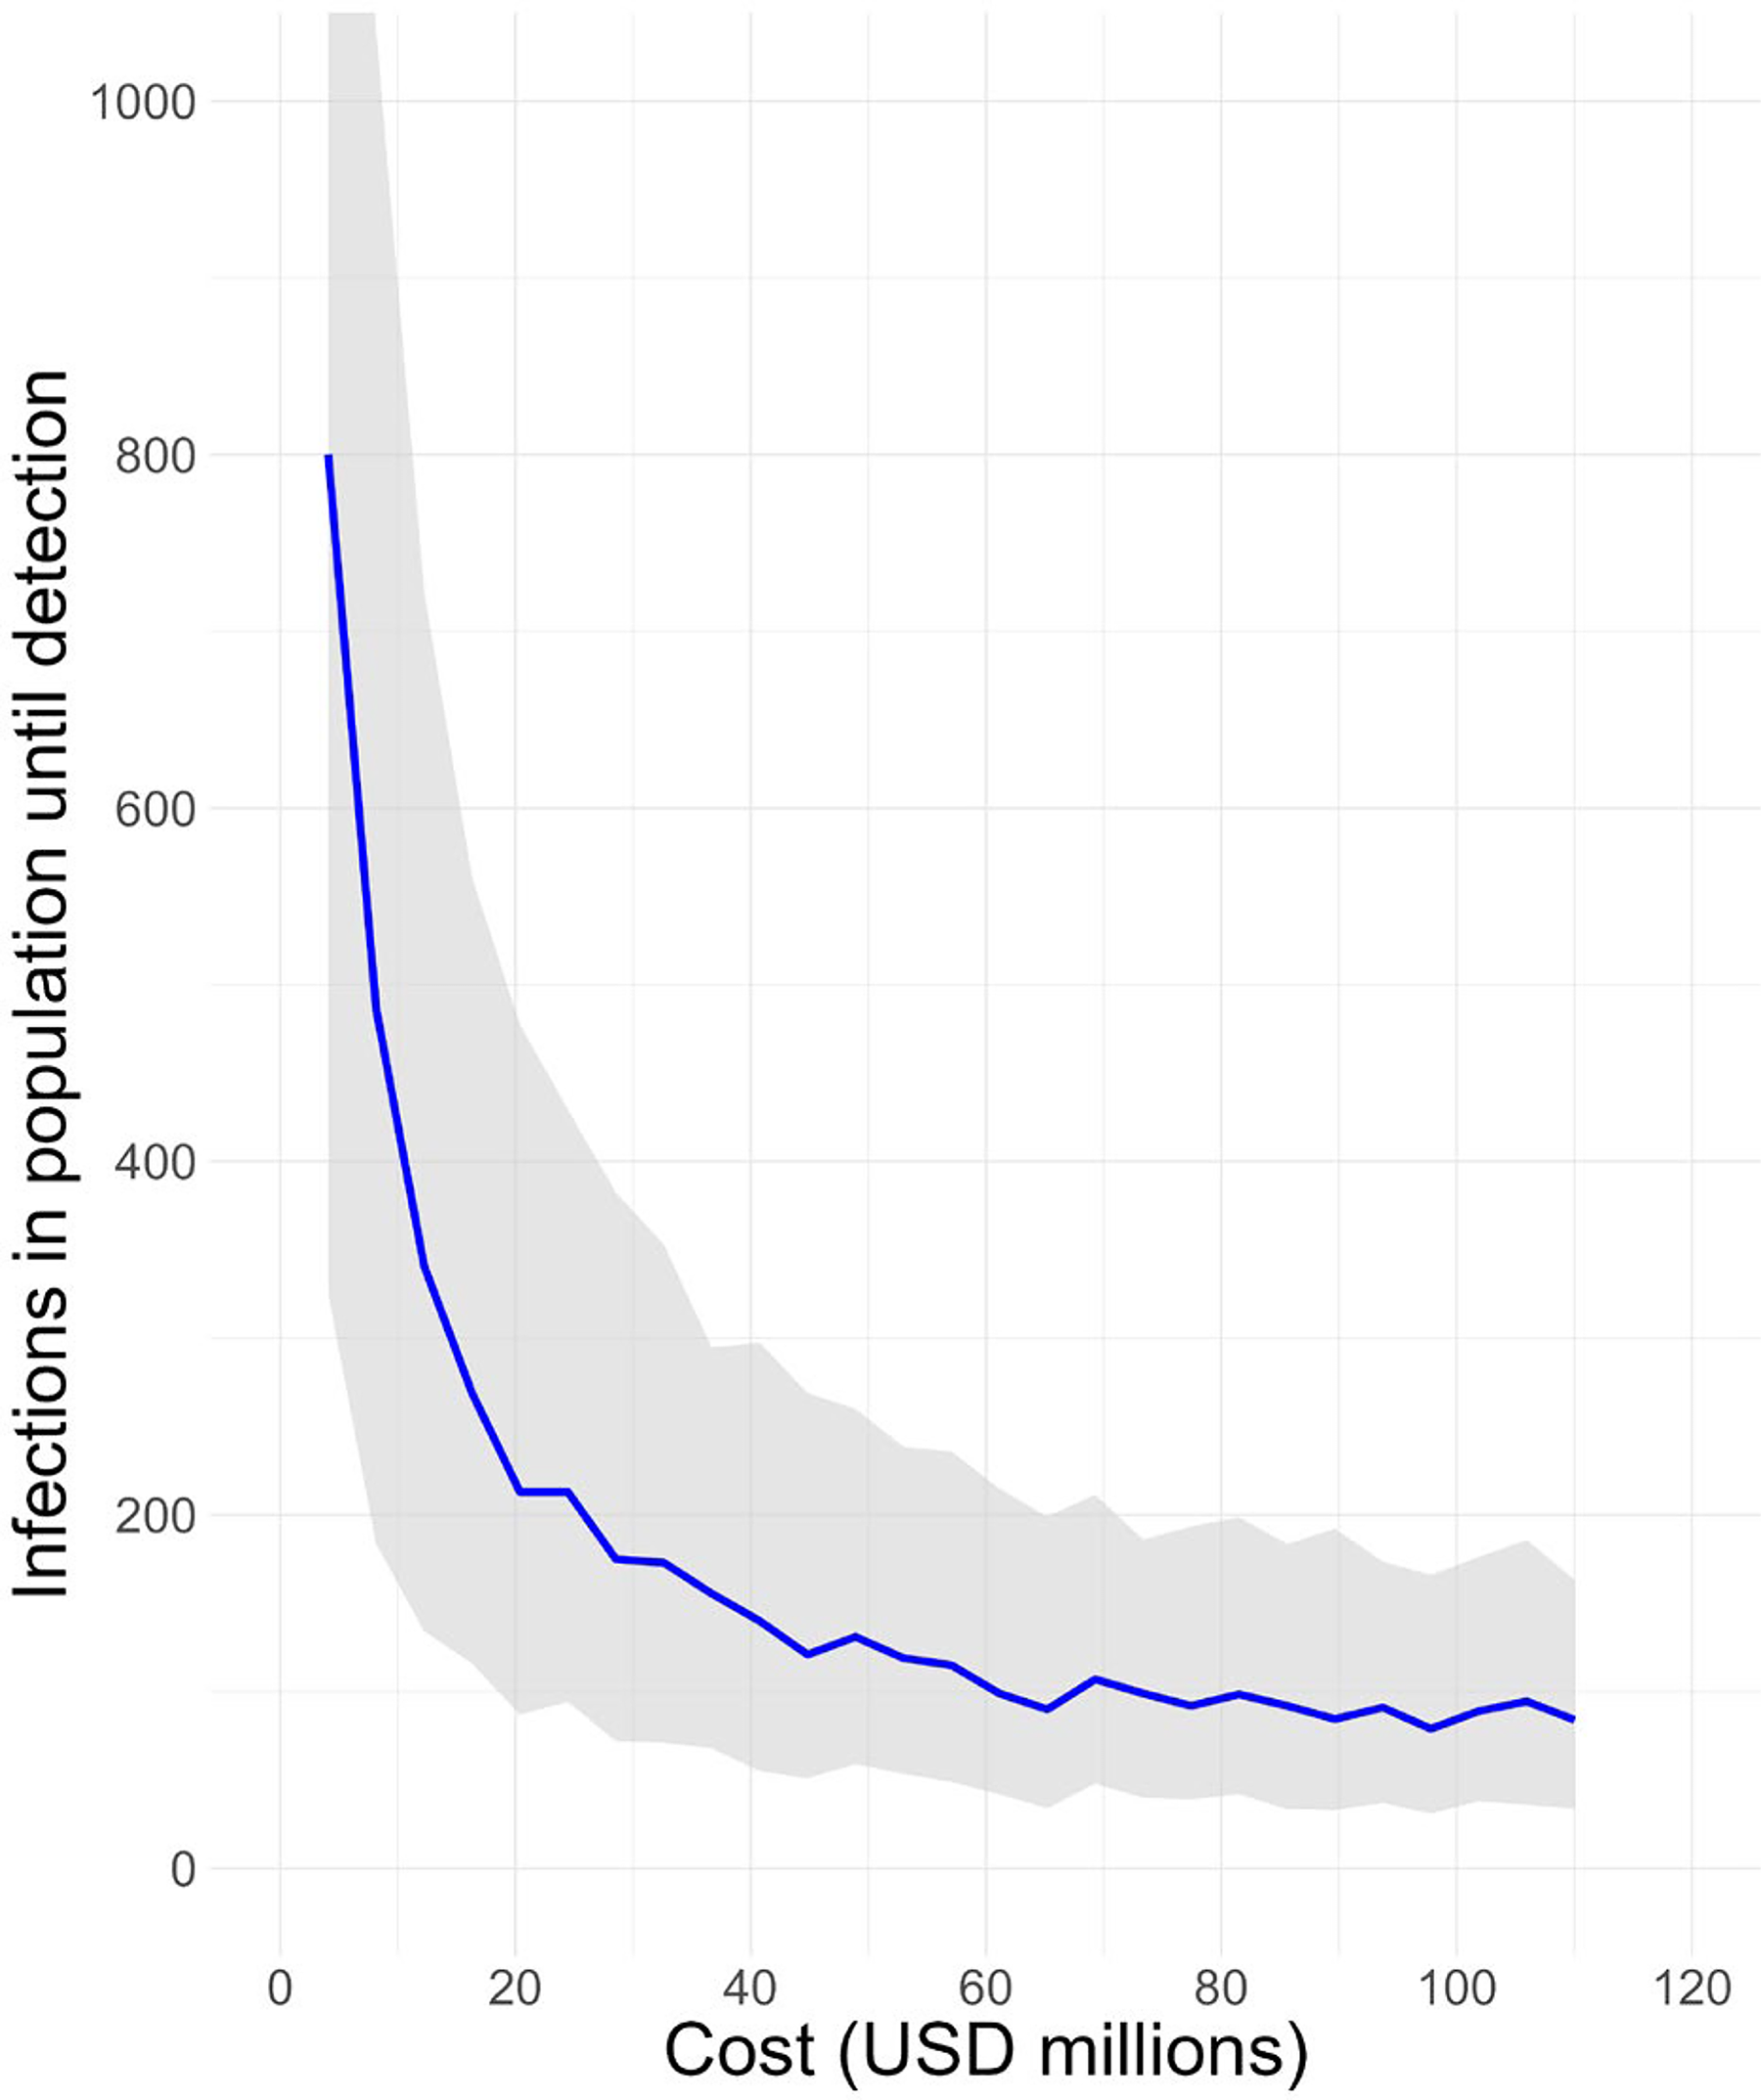
Estimated costs of the MBN and infections until detection of SARS-CoV-2 WT. Costs versus mean total infections at first successful detection by the MBN for a novel pathogen with the characteristics of SARS-CoV-2 WT. This graph shows the reduction of the mean total amount of infections as more hospitals are being connected, resulting in higher costs. The grey area reflects the IQR. Abbreviations: IQR, interquartile range; MBN, metagenomic biosurveillance network; WT, wild type.
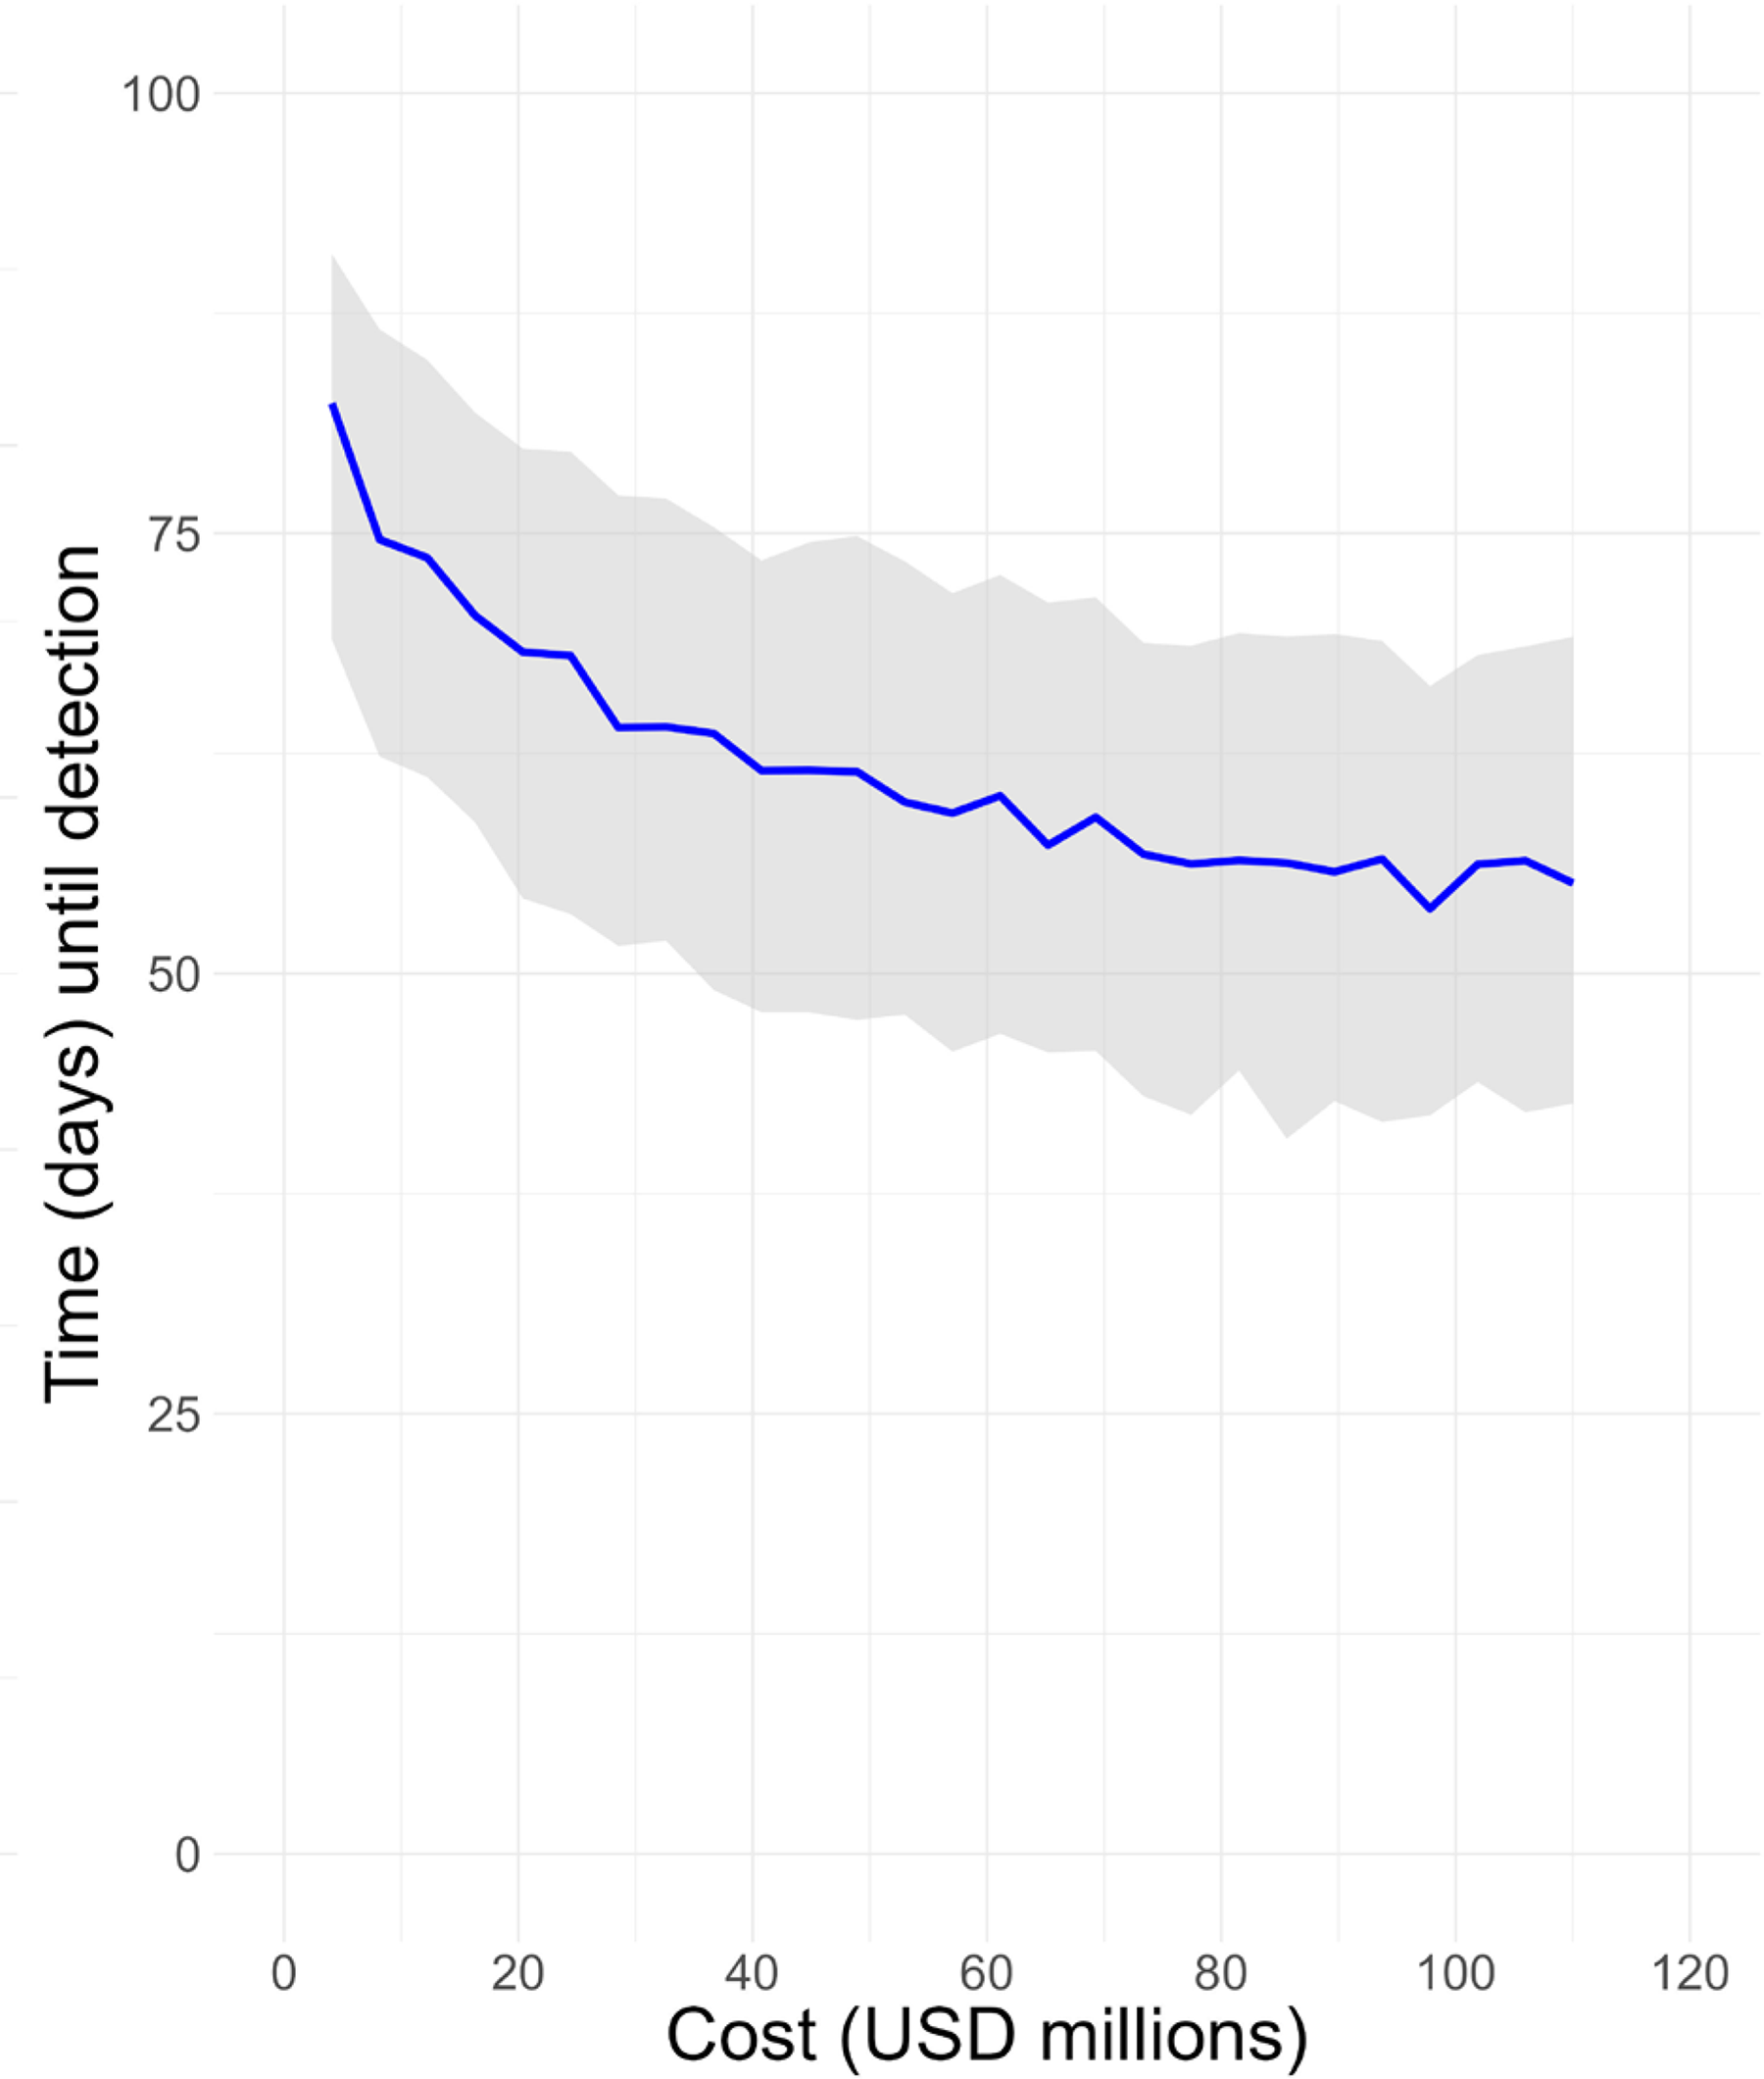
Estimated costs of the MBN and days until detection of SARS-CoV-2 WT. Costs versus time until detection at first detection by MBN of a novel pathogen with the characteristics of SARS-CoV-2 WT. This graph shows the increase of the estimated chance of successful detection earlier in time as more hospitals get connected, resulting in higher costs. The grey area reflects the IQR. Abbreviations: IQR, interquartile range; MBN, metagenomic biosurveillance network; WT, wild type.
Figure 6 provides insight into the influence of varying the detection threshold before an outbreak response team investigates. Increasing the detection threshold produces an upward shift in the cost-outbreak detection curve. The incremental increase from a threshold of 1 to 3 results in a more pronounced effect than that observed when the threshold is further elevated from 3 to 5, highlighting the impact of the ability to detect from a small number of genomes. Table 3 summarizes the costs and estimated time and infections until first, third, or fifth detection for different scales of implementation of the MBN.
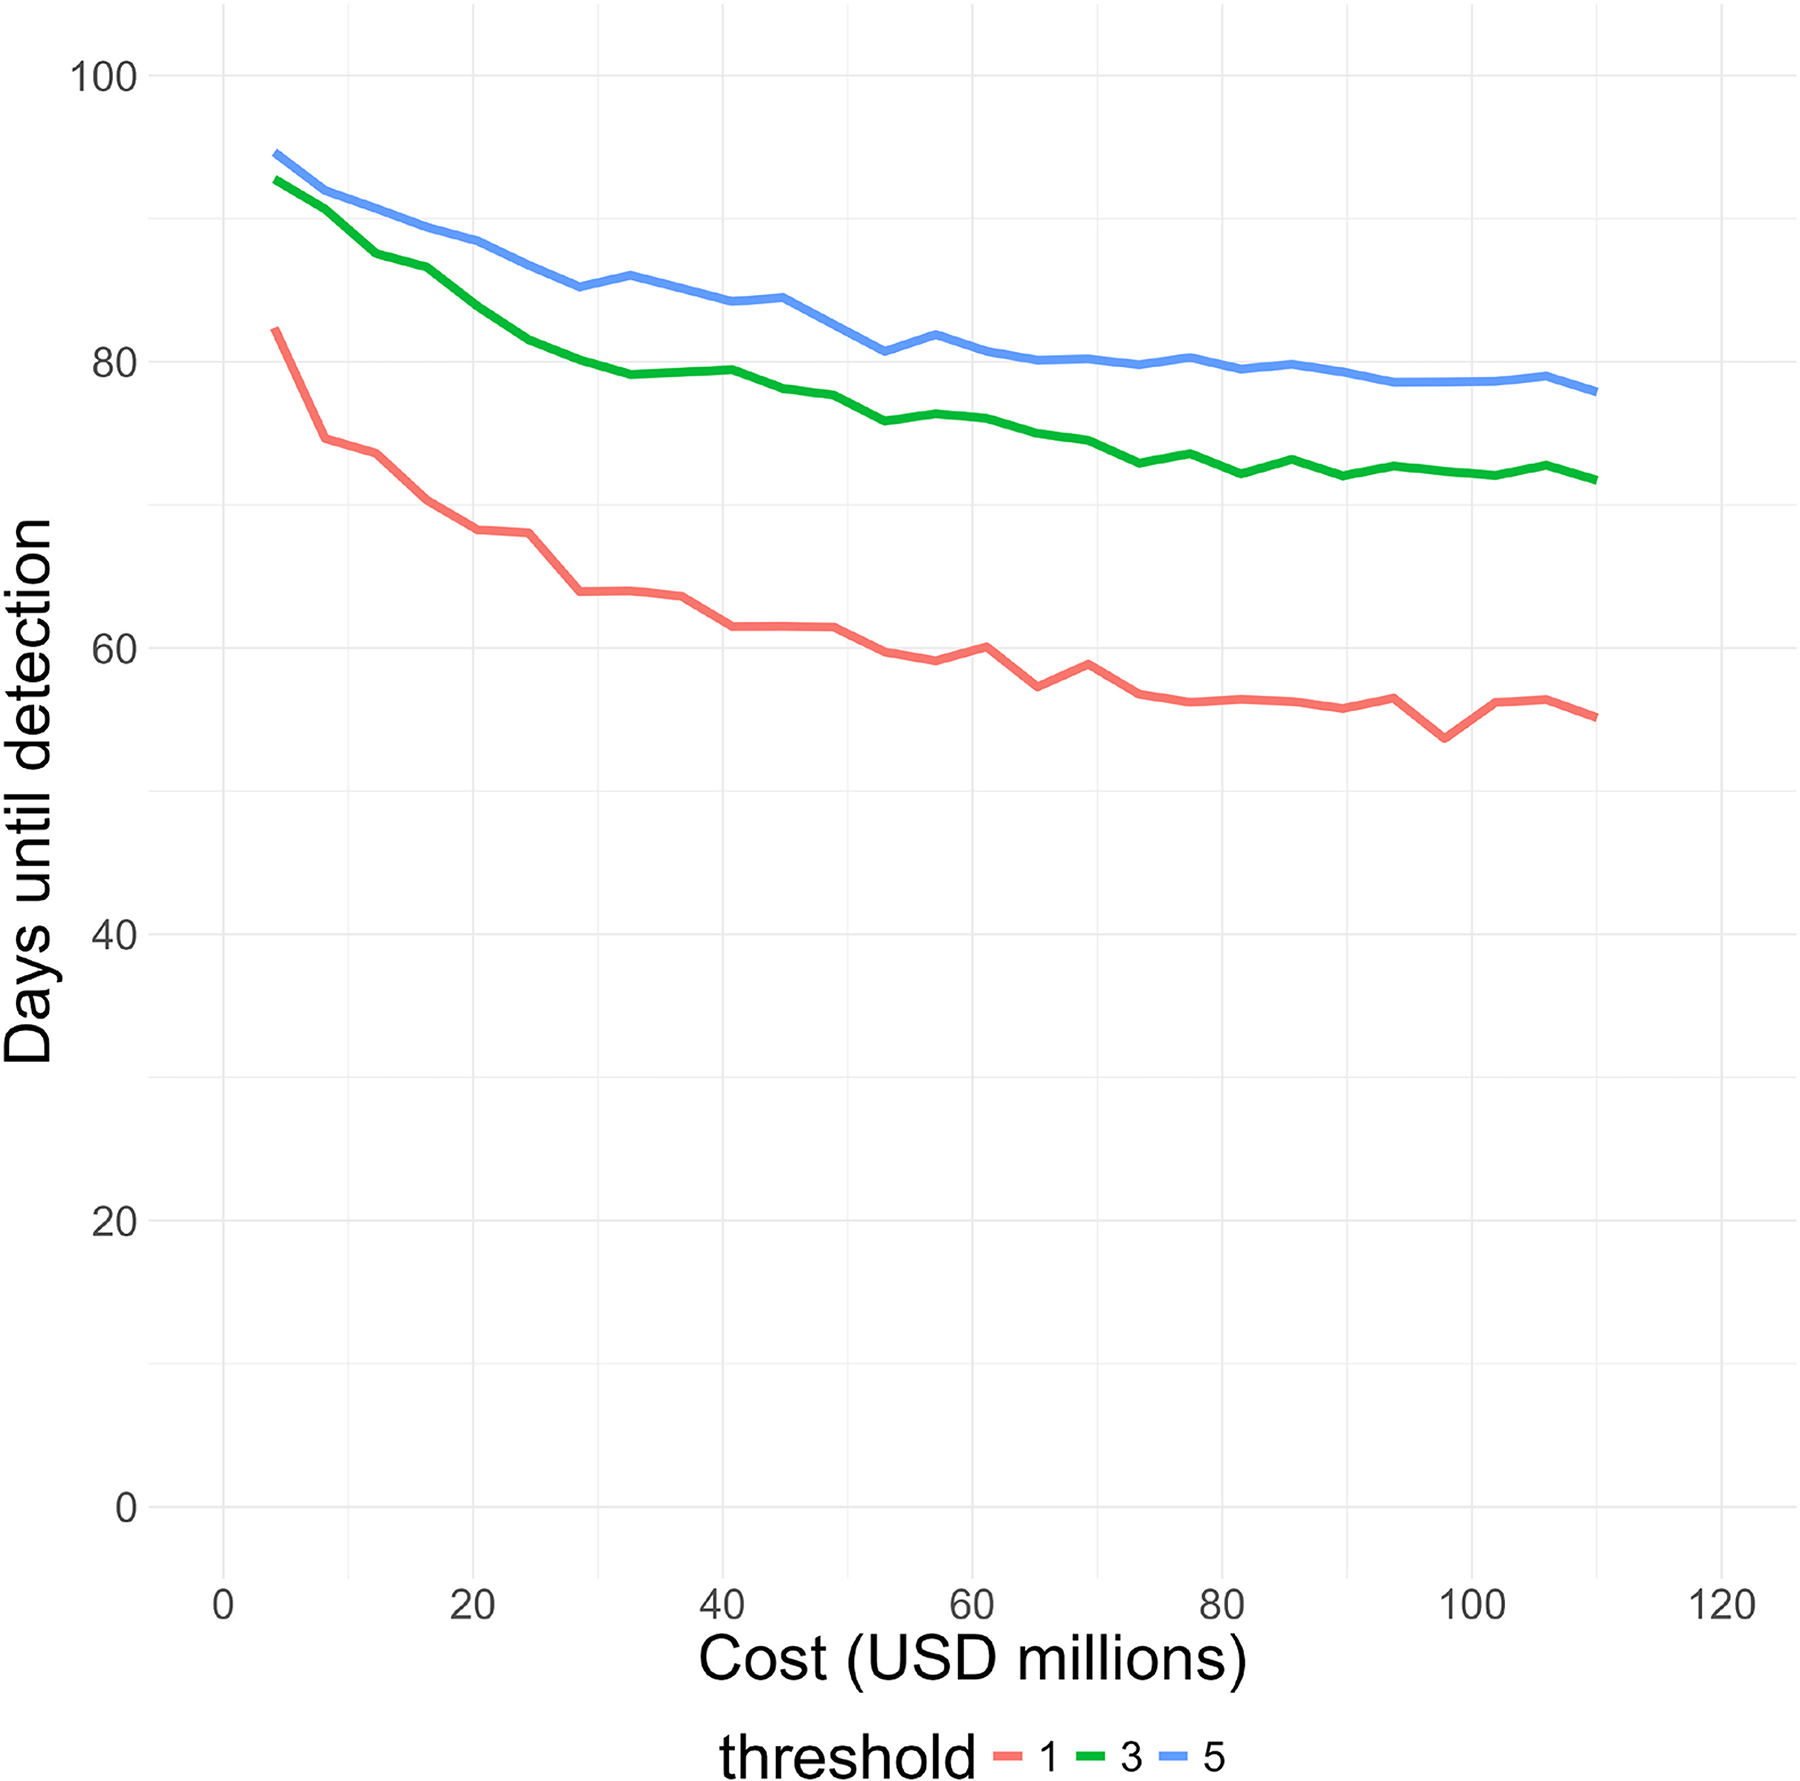
Different thresholds change the days until detection and costs of the MBN. Costs versus time passed until successful detection of 1, 3, and 5 cases of a pathogen with the characteristics of SARS-CoV-2 WT. Abbreviations: MBN, metagenomic biosurveillance network; WT, wild type.
Mean Cost, Time Until Detection, Number of Infected Cases, and Number of Emergency Department Presentations a
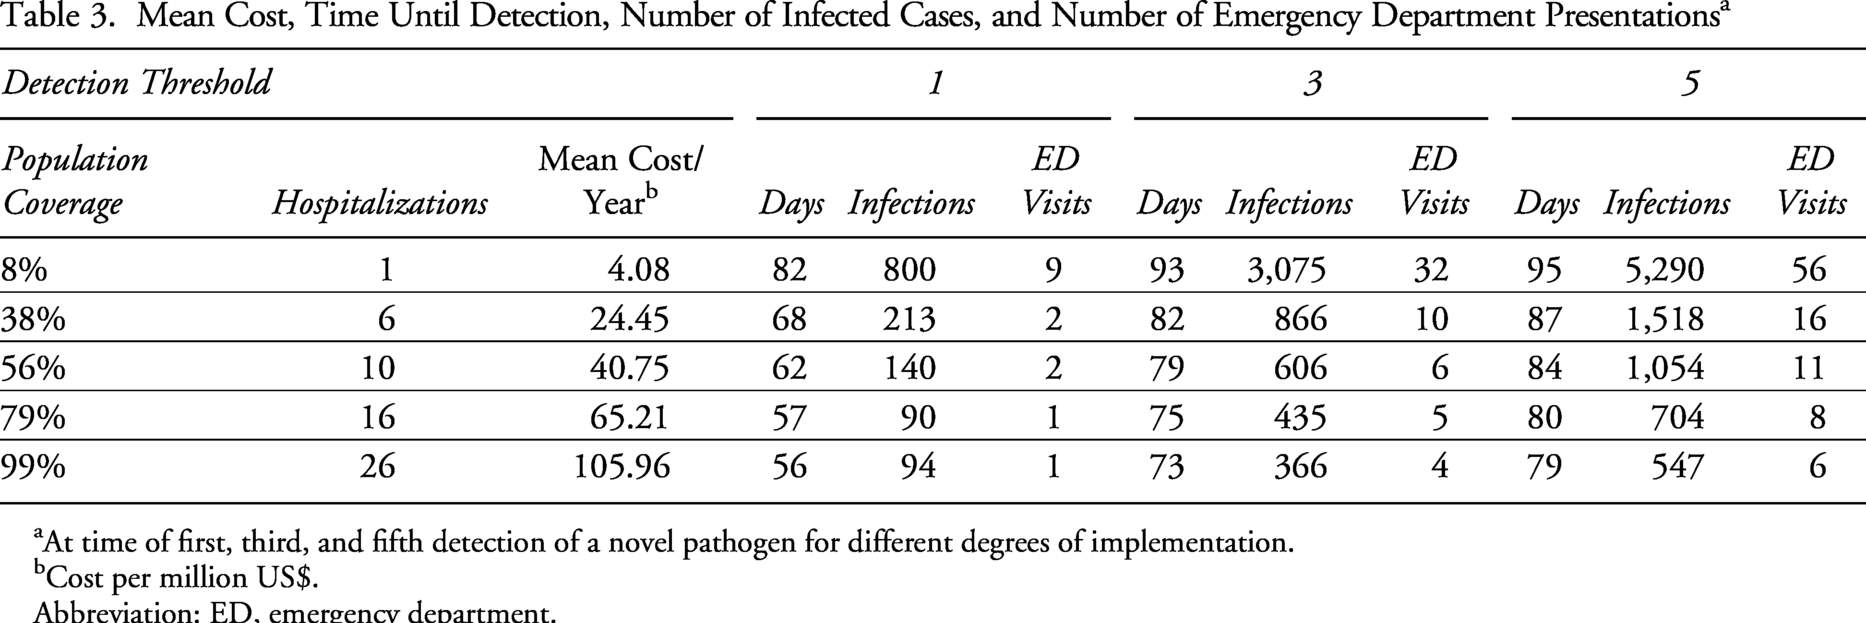
At time of first, third, and fifth detection of a novel pathogen for different degrees of implementation.
Cost per million US$.
Abbreviation: ED, emergency department.
Outbreak Detection: Other Pathogens
When examining a more transmissible variant such as Omicron, we find that while detection occurs earlier, it coincides with a higher initial case burden. Specifically, at a 38% population coverage level, the Omicron variant is detected on average by day 23 from the index case, coinciding with 1,526 cumulative infections and 3 ED presentations. Notably, increasing the hospital enrollment to include 79% population coverage markedly reduces the cumulative infections at the moment of detection to 740. However, this increase in coverage does not significantly alter the detection time, which is around day 21. Conversely, more severe but less transmissible pathogens, like the SARS-CoV-1 strain and H1N1 influenza, are identified earlier and with a lower case burden due to higher hospitalization rates. For example, at 38% coverage, SARS-CoV-1 is detected on day 15, with fewer cases (4 cumulative infections) and 2 ED presentations. Enhancing coverage to 79% further accelerates detection, reducing it to day 10, although the effect on the low case burden at the point of detection is comparatively minor (2 cumulative infections). Figure 7 illustrates how the cumulative infections and days passed since patient zero was infected with SARS-CoV-2 are derived from different multiple simulations that have been run on the same set of parameters. Results for all 7 pathogens are summarized in the Supplemental Materials (Appendix E).
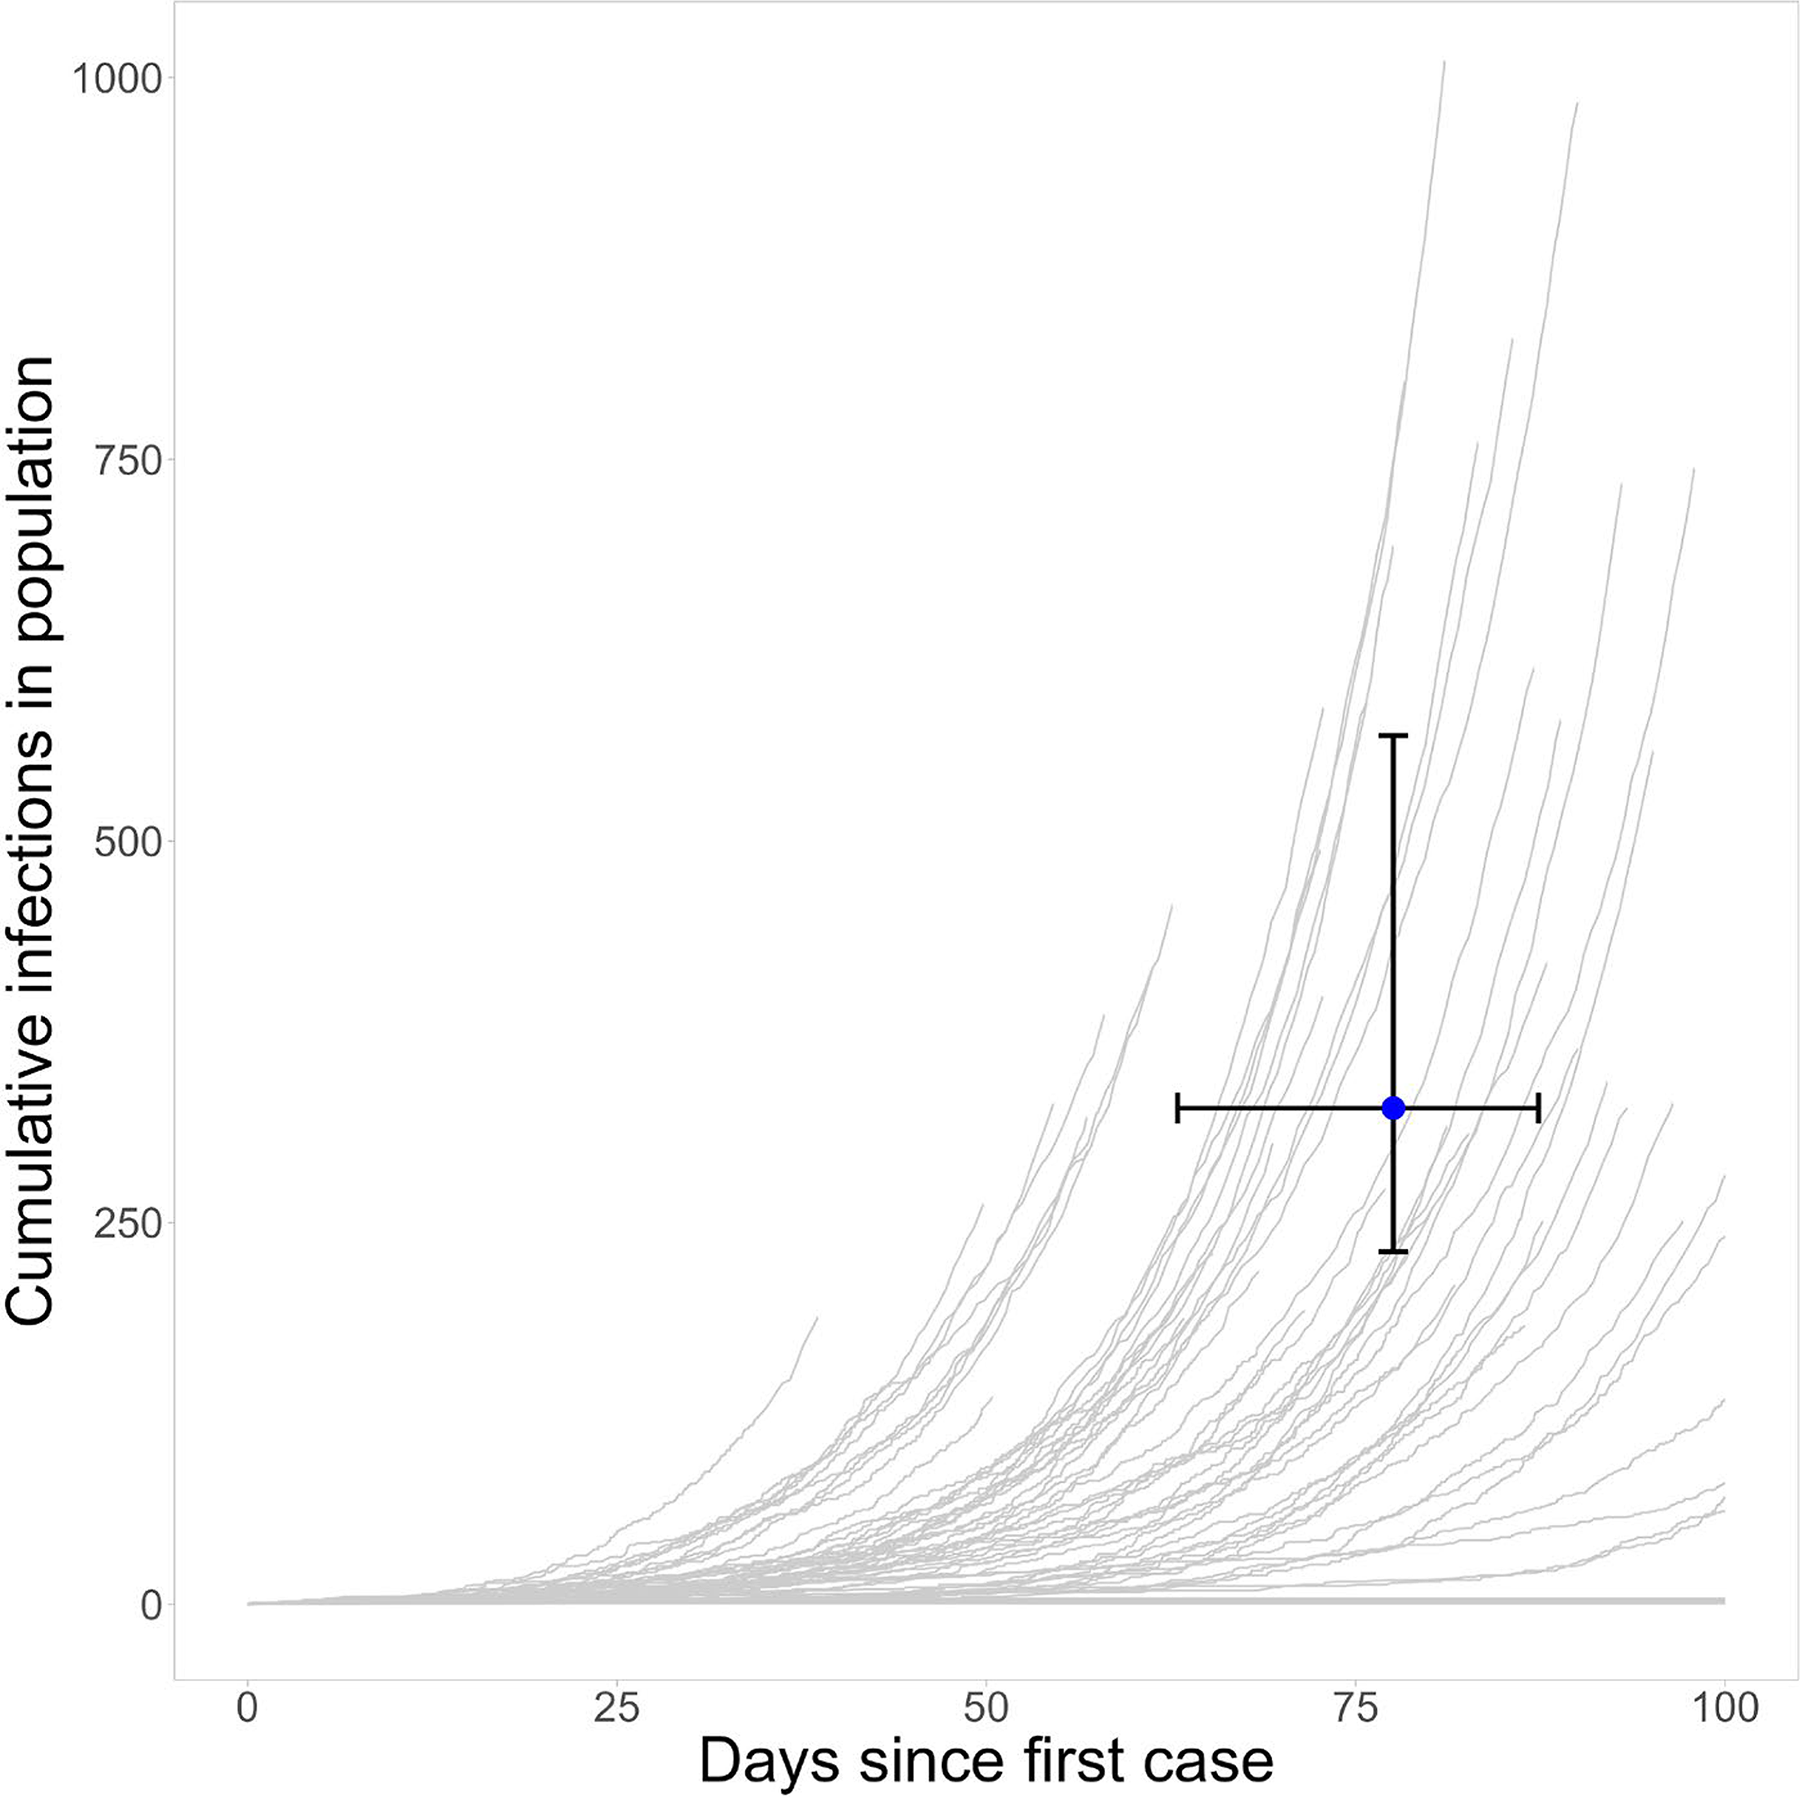
Representation of simulations to determine mean cumulative infections and days passed since patient zero. Cumulative infections versus time passed by the time of successful detection of a novel pathogen with the characteristics of SARS-CoV-2 WT by the MBN. The grey lines illustrate the results of 1,000 different simulations, the blue line shows the mean of these results. Abbreviations: IQR, interquartile range; MBN, metagenomic biosurveillance network; WT, wild type.

Schematic illustration of a classical SEIR (susceptible, exposed, infectious, recovered) model.
Discussion
Interpretation of Findings
This study set out with the aim of simulating the potential of an MBN in an Israeli setting. The results of this study showed that strategic mNGS biosurveillance implementation at the largest hospitals in Israel may enhance early detection of novel pathogens with pandemic potential, but it is a costly endeavor. Based on our model, an annual investment of US$24 million and 38% population coverage enables the MBN to detect a novel respiratory pathogen, similar to SARS-CoV-2, after on average 2 ED presentations, 213 cumulative infections, and 68 days in Israel. These estimates are less optimistic, but arguably more realistic, than those reported by Sharma et al (2023) for the US-based MBN, which estimated detection after, on average, 2 ED presentations, 15 infections, and 40 days at the same coverage level. 31
While both models require a similar number of ED presentations for detection, our model indicates a longer detection timeframe and higher infection count at detection. Factors contributing to these differences include: (1) a more conservative infection hospitalization rate, reducing the number of infected individuals tested; (2) incorporation of delays between symptom onset and hospital presentation, allowing greater pathogen spread; (3) stochastic modeling yielding a longer detection time distribution; and (4) accounting for reduced sensitivity inherent to pathogen-agnostic genomic testing, which was not accounted for in the Threat Net analysis.
Notably, our annualized costs are 20 to 40 times lower than Sharma et al’s, primarily due to Israel’s healthcare infrastructure, where 6 major hospitals provide emergency care for 38% of the population, and smaller size overall. In contrast, the larger population and the more rural geography of the United States necessitates inclusion of many more hospitals to achieve similar coverage. However, for policymakers, other considerations than the size of the population a hospital serves may be of importance, such as the geographic location. For this purpose, specific hospitals can be selected in the open-source model, enabling tailored detection and cost estimates.
Interestingly, the results reveal a nonlinear, inverse relationship between population coverage and both cumulative infections and detection time, with the most pronounced effects occurring within the initial US$20 million to US$30 million investment range—partly attributable to variations in ED traffic in Israel. These findings can inform policy decisions on the scale of initial MBN pilot projects.
Diminishing returns are observed for pathogens beyond SARS-CoV-2, albeit with distinct patterns. For highly transmissible variants like SARS-CoV-2 Omicron, detection timing changes minimally with increased coverage, while cumulative infections vary substantially due to exponential spread, resulting in greatly reduced incidence due to small detection improvements. Conversely, for more severe infections such as SARS-CoV-1, increased coverage significantly advances detection time but yields minimal impact on cumulative infections. These results underscore the MBN’s strength in detecting pathogens that prompt early hospitalization.
To evaluate the potential of early detection through mNGS biosurveillance, establishing a comparative baseline is important. However, this task presents inherent challenges, primarily due to uncertainties surrounding the actual onset of an outbreak and the true number of cases at the time of initial detection. No exact data exists on the total number of infected people starting from patient zero for any of the known pandemics. Nevertheless, we offer some points of comparison. Although the circumstances of the early outbreak of SARS-CoV-2 in Wuhan remain clouded and controversial, research based on phylodynamic rooting methods applied to SARS-CoV-2 sequence data quantifies both the time of SARS-CoV-2 introduction into humans and the time series of cases following. It estimates that the pandemic most likely began in November 2019 (95% confidence interval: between October 23 and December 8). 71 Our estimates for the detection of the wildtype SARS-CoV-2 are considerably lower for various degrees of implementation of MBN than the 27 cases of pneumonia of unknown etiology presenting at and reported by the Wuhan Municipal Health Commission during the early stages of COVID-19,72,73 as noted in the initial ProMed report on December 31, 2020,74,75 or the 9 known ED presentations at the start of the SARS-CoV-1 outbreak (2002–2004). 50 This shows the potential for advanced biosurveillance and emphasizes the importance of exploring cost-effective surveillance methods to do so. Due to variances in data measurement and differing contexts, these findings cannot be used to draw direct comparisons. Nonetheless, they do suggest there is still much room for improvement. Despite its significant costs and the limited real-world evidence currently demonstrating its feasibility, our results indicate that the MBN shows promise for shortening detection times for novel pathogens behaving like SARS-CoV-2 and SARS-CoV-1.
These findings are in agreement with Liu et al (2023), who modelled the early detection potential of different biosurveillance approaches and developed an empirically validated quantitative model that simulates disease spread and detection time for a range of diseases. Despite using a higher detection threshold of 10, they estimated routine hospital monitoring for novel pathogens could have detected COVID-19 in Wuhan 0.4 weeks earlier than it was actually discovered, at 2,300 cases compared to 3,400. 72 Ultimately, a robust biosurveillance system would monitor all settings, including clinical, environmental, and sentinel, to prepare for a range of scenarios. 76
Limitations of Research
Our model, while providing valuable insights, is subject to certain limitations. Despite being a widely used model, SEIR is limited due to its dependance on fixed parameters, which is a simplification of reality (Figure 8). As a consequence, using the correct parameters is vital for the results. However, obtaining parameters to reflect reality as correctly as possible can be challenging, especially when little data and few studies are available, as is the case for a number of epidemiological markers (including H1N1 influenza, avian influenza, and SARS). A more exhaustive search for relevant studies, coupled with the incorporation of heterogeneity through probability distribution sampling, could enhance the precision of these estimates. This includes a more profound determination of the sensitivity of mNGS for novel respiratory pathogens of samples derived by a nasal swab; and a better understanding of healthcare disparities and health seeking behaviors within Israel to estimate the population coverage more accurately. Other modeling assumptions and simplifications also constrain results (see Supplemental Materials Appendix B). Although prior studies suggest synchronous disease spread in Israel—justifying the SEIR approach treating the country as a single population—this may overlook subpopulation heterogeneity. 77 Thirdly, cost estimates focus primarily on operational expenses of mNGS pipelines, assuming centralized data processing costs are minor. Additionally, our conservative cost model does not account for potential declines in reagent prices or volume discounts over a 10-year horizon. Finally, we based sampling on influenza-like illness definition, reflecting ED data availability. We assumed clinicians would include patients with infectious respiratory diseases even if fever was absent. However, some emerging pathogens (eg, SARS-CoV-2 Omicron, MERS) may lack fever or respiratory symptoms, risking underdetection. Future models could refine this by adjusting hospitalized case capture rates or broadening surveillance to encompass acute respiratory infections.
Recommended Follow-Up Research
Decisionmakers would benefit from model expansions exploring alternative sampling strategies, as demonstrated in prior biosurveillance research. These could include targeted testing of influenza-like illness cases negative for known pathogens, sampling from other clinical syndromes (eg, pyrexia of unknown origin, gastrointestinal illness), or sampling in different settings such as wastewater78,79 or traveler-based surveillance. 15
Another key area for expansion involves modeling the likelihood of pathogen introduction or spillover events in various regions of Israel. Integrating air traffic and geospatial data can help identify which metropolitan and rural areas are most vulnerable to outbreaks, particularly those driven by multiple introductions. This would optimize biosurveillance resource allocation to high-risk zones. Arguably, one of the most productive next steps is conducting well-designed prospective pilot studies to measure detection times for known and novel outbreaks and assess benefits to individual patients. Such studies are essential to validate and refine the MBN’s effectiveness and to uncover implementation barriers often only evident in real-world settings. The United Kingdom is a pioneer in this space with the UK Health Security Agency’s metagenomics Surveillance Collaboration and Analysis Programme (mSCAPE), which collects and analyzes metagenomic data from multiple clinical laboratories for national-level pathogen surveillance. 80 Such initiatives offer valuable insights for designing and implementing metagenomic surveillance networks. Another priority is optimizing mNGS sensitivity through enrichment techniques while maintaining pathogen-agnostic detection, especially for novel pathogens with pandemic potential. Lastly, future research should also focus on developing optimization tools to determine the optimal density of metagenomic testing sites, coupled with a transition from agnostic to targeted NGS approaches to maximize early detection, sensitivity, specificity, and costs.
Implications for Practice
Metagenomic biosurveillance offers benefits beyond early detection, especially during pandemics when specific diagnostics for novel pathogens are lacking. The adaptability of mNGS enables modification of sequencing protocols to target and amplify pathogens of interest, enhancing test performance while reducing costs.25,29,81 Techniques like multiplexing and barcoding improve scalability, enabling large-scale testing that can detect mildly symptomatic, presymptomatic, or asymptomatic cases, thereby overcoming limitations of symptom-based surveillance. 82 Furthermore, extensive mNGS testing generates rich genomic data, crucial for refining estimates of early epidemic growth and transmission dynamics, which in turn supports more effective public health responses.14,83 The contribution of the MBN to early surveillance of novel pathogens could be beneficial worldwide, providing best practices and a framework for national and international mNGS-based surveillance systems. Widespread adoption of mNGS could drive market growth, leading to economies of scale that lower costs through increased production, distribution, and research and development investment. Cost reductions are especially critical for low- and middle-income countries, where financial barriers hinder access to advanced technologies. More affordable mNGS would strengthen their capacity to detect and respond to emerging infectious diseases, thus enhancing global health security. 84
Conclusion
mNGS–based surveillance for novel respiratory viruses has the potential to shorten detection times. Our model estimates that implementing the MBN in Israel at an annual cost of US$24 million would detect a novel respiratory pathogen within a mean of 68 days postintroduction, corresponding to approximately 213 infections and 2 ED presentations. Increasing the density of mNGS sites demonstrates a point of diminishing returns, with optimal site density varying by population demographics, healthcare infrastructure, and pathogen characteristics. In Israel, the population and largest hospitals are concentrated centrally, offering an efficient starting point, though geographic coverage remains an important consideration. As mNGS technology advances and MBN pilot studies are completed, cost reductions and improved sensitivity will further improve the feasibility of widespread biosurveillance for pandemic-potential pathogens. We strongly recommend further research to refine mNGS-based biosurveillance systems and support global pandemic preparedness.
Data Availability Statement
The software and datasets supporting the conclusions of this article are available in the MBN- Metagenomic Biosurveillance Network—Github repository: https://github.com/Isabel050/MBN-Metagenomic-Biosurveillance-Network
The current version of our interface can be accessed at https://biosurveillance.shinyapps.io/MBN_app/
Footnotes
Acknowledgments
The authors thank The Existential Risk Alliance for funding this study. We would also like to thank Dr. Will Waites for sharing his insights on compartmental modeling and Dr. Gregory Lewis for reviewing our code and suggesting improvements. Funding for this study has been provided by the Existential Risk Alliance, Cambridge, a fiscally sponsored project of Rethink Priorities, made possible by a grant from Open Philanthropy.