



Abstract
Measures of speech intelligibility in noise show limited correspondence with difficulties people with hearing loss report from daily life. This mismatch suggests that standard measurement conditions do not sufficiently capture aspects that are relevant for speech perception, such as dip listening and spatial release from masking. In the present study we developed and evaluated a test condition that incorporates these aspects and compared it with a standard condition. Speech intelligibility was measured in 100 participants with normal hearing (NH, N=17) and hearing loss (HL, N=83) ranging from mild to severe. Measurements were conducted using the German matrix sentence test (OLSA) in the standard condition with frontal presentation of stationary noise co-located with the target speech, and the proposed condition with fluctuating, speech-like maskers spatially separated (±60°) from the target. Stimuli were presented via headphones using virtual acoustics. Tests were performed unaided and with individualized amplification. The proposed condition revealed reduced speech intelligibility also for listeners with HL that showed close-to-normal speech intelligibility in the standard condition. With individualized amplification, more listeners with HL showed reduced speech intelligibility compared to NH listeners than in the standard condition. Benefit of amplification varied widely across individuals with similar hearing thresholds, with some listeners showing little or no benefit. The advantages of the proposed condition were driven by masker fluctuations rather than by spatial separation of sound sources. These findings demonstrate that speech intelligibility measurements incorporating fluctuating maskers provide potentially relevant information beyond standard assessments and can support a more individualized assessment of hearing loss.
Introduction
Approximately 53% of people with self-perceived hearing loss in Germany do not own hearing aids (EHIMA, 2025). A commonly reported reason for not purchasing hearing aids is their limited benefit in noisy environments (EHIMA, 2025). Individual hearing assessment should enable hearing care professionals (HCPs) to obtain an understanding of both the severity of a hearing problem and the potential benefit of hearing aids for the client. However, standard tests of speech intelligibility do not correlate well with the listening experiences reported in everyday life (Dorismond et al., 2023; Stenbäck et al., 2023; Wang et al., 2022). This mismatch suggests that the measurement methods might neglect aspects of hearing loss that are relevant in everyday life.
A recent study by Warkentin et al., 2024 investigated typical measurement setups used by HCPs in Germany for the assessment of speech intelligibility. In their survey, most of the 1154 respondents reported using a test which measures speech intelligibility for monosyllabic words presented in quiet (Hahlbrock, 1953). This test was used by 91.7% of HCPs. The same test but with stationary noise was used by 68.8% of HCPs. In the speech tests, speech is typically presented from the front (0° azimuth). When noise was used, different types of hearing care institutions used different spatial configurations. Hearing instrument specialists preferred noise being presented from the rear/180° azimuth (∼68%), in clinical settings noise is presented mostly from the front/0° azimuth (∼81%).
These commonly used measurement setups do not include fluctuating noise and therefore fail to capture certain temporal aspects of hearing, such as the ability to “listen in the dips”. Research has shown that the ability to extract speech during time frames with a high signal-to-noise ratio (SNR) improves speech intelligibility in fluctuating noise for normal-hearing (NH) listeners, but dip-listening is often reduced in case of hearing loss (Bernstein & Grant, 2009; Festen & Plomp, 1990; George et al., 2006; Holube, 2011; Wagener & Brand, 2005; Wagener et al., 2006). When measuring speech intelligibility in fluctuating noise with listeners with hearing loss (HL), restoring audibility of the speech signal can improve intelligibility (George et al., 2006), but a performance gap compared to NH listeners often remains (George et al., 2006; Goossens et al., 2017).
In clinics speech and noise are mostly presented from the same direction. Therefore, another well-established mechanism for listening to speech in noise is neglected: Spatial release from masking (SRM). It describes the improvement in speech intelligibility when the noise is spatially separated from the target speech (for an overview, see Culling & Lavandier, 2021). There are two major components that are relevant for SRM: better-ear listening and binaural unmasking. When speech and noise are spatially separated, this often leads to the signal having a better SNR at one ear than the other, which is referred to as better-ear listening. The magnitude of this effect depends on the spatial configuration of the target and masker sources and the room acoustic (e.g. reverberation time, Beutelmann & Brand, 2006). In the presence of uncorrelated, fluctuating maskers, as often the case in the real world, an additional mechanism called better-ear glimpsing becomes relevant. When independent fluctuating noise sources are presented to the left and right of the listener, the ear with the more favorable SNR can change in short time intervals. Healthy auditory systems can exploit these fast SNR changes. The information of both ears is integrated, leading to improved speech intelligibility (Brungart & Iyer, 2012; Glyde et al., 2013a). In symmetrical setups, such as target speech presented from the front with noise sources symmetrically positioned to the left and right, long-term better-ear advantages are largely diminished. In such cases, binaural unmasking becomes the dominant contributor to SRM. Binaural unmasking refers to the ability of the auditory system to use interaural time and phase differences between the ears to improve the segregation of target and masker signals, and thereby improving speech intelligibility in noise (Culling & Lavandier, 2021).
SRM can be reduced in case of hearing loss (Arbogast et al., 2005; Glyde et al., 2013b; Marrone et al., 2008). When provided with amplification so that audibility is restored, i.e., stimuli are above the hearing threshold for the whole frequency range, people with HL can perform better than without amplification, but a gap to NH performance can remain (Glyde et al., 2015; Jakien et al., 2017).
In daily life we often experience environments with fluctuating spatially distributed sound sources, for example at a gathering with friends or at a café. As described, listeners with HL often experience disadvantages for these kinds of situations. Consequently, for hearing aids to provide high user satisfaction and effective compensation for hearing loss, they must deliver measurable benefits specifically in these demanding conditions. In recent years, research has increasingly focused on more complex laboratory measurement setups, including realistic speech and noise configurations to better reflect challenging real-life listening situations. Lab measurements with more challenging listening situations using more than two loudspeakers were conducted for example in Neher et al. (2009), Rønne et al. (2017) and Zaar et al. (2023). Complex sound-field setups with many loudspeakers often use virtual acoustics, which allows for more flexible spatially complex sound environments (e.g. Jansen, Hartog, Oetting, & Kayser, 2024; Mansour, Marschall, May, Westermann, & Dau, 2021; Miles, Beechey, Best, & Buchholz, 2022). However, such complex setups require sophisticated hardware and software which are not typically available to HCPs. There is a need for speech intelligibility measures that capture the above mentioned important aspects of hearing loss, while remaining feasible for use in hearing care practices. Such measurements should enable HCPs to estimate speech intelligibility in complex listening environments and to predict the potential benefit that hearing aids—through gain and signal processing features—can provide in daily life. At the same time, the necessary setups must remain compatible with the hardware typically available in clinics or at the hearing instrument specialist, such as setups with headphones or sound-field setups with two or maximum three loudspeakers.
The goal of this study is to develop and compare measurement approaches that capture further aspects of speech intelligibility that are not included in the standard measurements used by HCPs so far. To include the main aspects of hearing such as temporal processing and SRM within the speech intelligibility measurements, we applied fluctuating, speech-like noise sources, which are co-located with the target speech or spatially separated. As comparison, a standard clinical condition with stationary noise co-located with the target speech from the front was also included in the study. Measurements were performed for NH listeners and listeners with HL with a wide variety of hearing loss types from close-to-normal to moderately-severe hearing loss. Measurements were performed unaided and with individualized amplification, so that supra-threshold processing deficits could be identified when audibility was accounted for.
We hypothesize that in the spatially separated measurement condition with fluctuating noise. 1. Unaided listeners with mild hearing loss will show group-level deficits in speech intelligibility which are not visible in the co-located stationary noise condition. 2. Amplification will make supra-threshold processing deficits more apparent than in the standard (co-located stationary-noise) condition, resulting in fewer listeners with hearing loss achieving performance comparable to normal-hearing listeners.
Based on the literature above, we further hypothesize that for listeners with hearing loss the group-level benefit from spatial separation of target and noise and from fluctuations in the noise will be reduced relative to that observed in normal-hearing listeners.
Methods
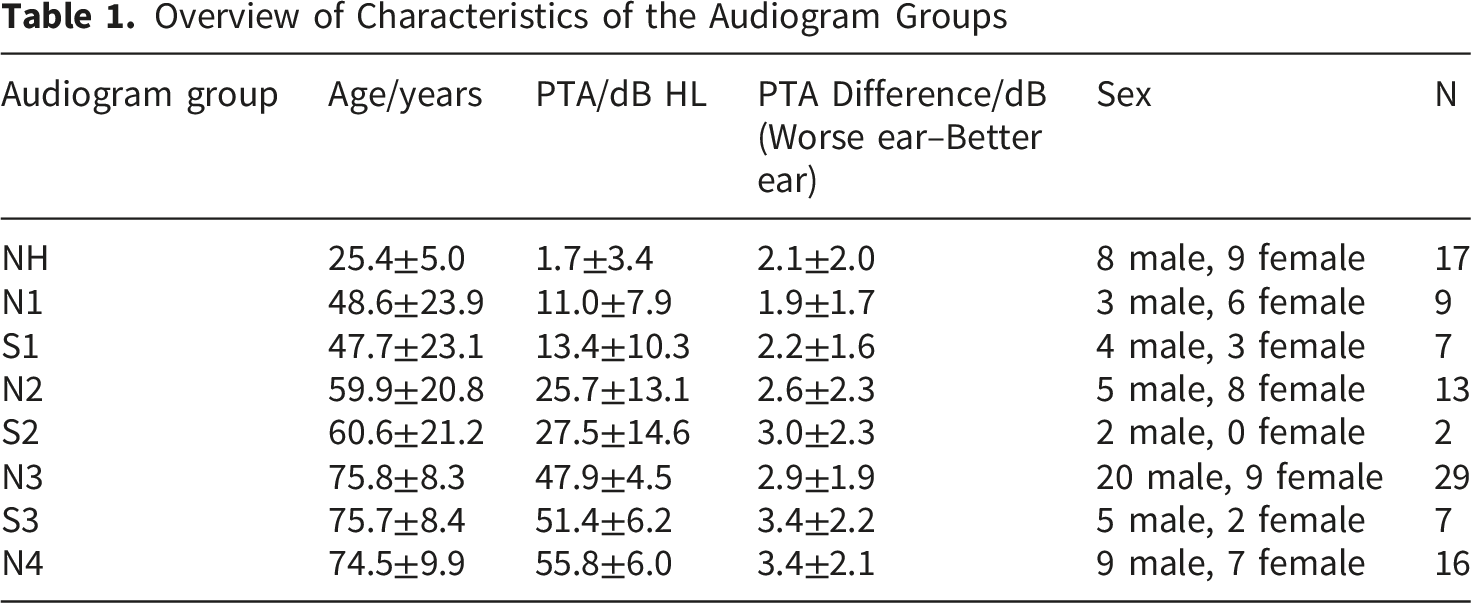
Participants
Overview of Characteristics of the Audiogram Groups
Individualized Amplification to Restore Audibility
In order to individually restore audibility, frequency and level-dependent amplification needs for each participant were determined using a loudness-based procedure (Oetting et al., 2016, 2018; Zimmer et al., 2024). The aim of the method is to restore normal loudness perception for binaural and broadband signals. In a first step monaural narrowband loudness functions are estimated based on the participant’s audiogram. These functions are the basis for the calculation of a frequency-dependent gain, so that monaural narrowband loudness is normalized. The participant then performs loudness scaling measurements (Brand & Hohmann, 2002) over headphones for binaural broadband stimuli with the narrowband gains applied to the stimuli. The resulting loudness function is used to calculate a gain correction of the narrowband gains for binaural broadband stimuli to account for individual binaural broadband loudness summation (Oetting et al., 2016). These corrected narrowband gains are used as individual level- and frequency dependent amplification for the participant. The method to determine the narrowband gains corrected by the results of the binaural broadband loudness growth function results is referred to as trueLOUDNESS.
In this study, the trueLOUDNESS procedure was used to determine individual amplification which was then applied in the subsequent speech intelligibility measurements that were performed over headphones. Amplification was applied to both the speech and noise stimuli. The level of the combined speech and noise signal was used as the broadband input signal level assuming a speech spectrum. For all conditions, an unaided presentation level of the noise of 65 dB SPL was used. For measurements with negative SNRs the noise level dominated the presentation level. In these cases, the gains corresponded to the gains for a 65 dB SPL speech signal as an input signal. Constant frequency-dependent gains were subsequently applied using a static filter.
Speech Intelligibility Measurements
For the measurement of speech intelligibility the German matrix sentence test (OLSA) was performed (Wagener, Brand, et al., 1999a, 1999b; Wagener & Brand, 2005; Wagener, Kühnel, et al., 1999). The speech material of the test consists of a matrix of words with a fixed syntax: subject, verb, numeral, adjective, object. Each word category has 10 items, making up 50 words in total. In the original design of the test, lists of 20 sentences were generated. Besides the original male speaker version, the test is also available with a female speaker (Wagener et al., 2014), which was used in the current study, because it is typically more challenging to understand female compared to male speech in case of age-related high frequency hearing loss (Larsby et al., 2015). In all conditions the speech was presented simultaneously with noise. Between trials the noise was stopped 0.5 s after the sentence was finished and started again 0.5 s before the next sentence was played. Using an adaptive measurement procedure (Brand & Kollmeier, 2002), the signal-to-noise ratio at which 50 % of the presented speech was correctly repeated was determined. This is called the speech recognition threshold (SRT). During the procedure the noise level was held constant at 65 dB SPL and the speech level was varied.
There were two types of noise used during the measurements. One was the standard noise of the female OLSA, called olsafnoise (Wagener et al., 2014). It is a stationary noise with the spectrum of the target speech. The other was the International Female Fluctuating Masker (IFFM; Holube, 2011), which is a version of the International Speech Test Signal (ISTS; Holube et al., 2010), but with the silence intervals being shortened to maximum 250 ms. The IFFM consists of segments of speech from six different languages. This results in a masker that has the properties of speech, but is largely unintelligible. The spectrum was adapted to match the spectrum of the target speech and the olsafnoise, to avoid performance differences between conditions due to spectral differences.
Stimuli were presented in two spatial configurations. In one condition, speech and noise were both presented from 0° azimuth. In the other condition, speech was presented from the front, and the noise was presented from ±60° azimuth. The noise in the spatial condition was decorrelated between +60° and -60° by introducing a time shift of 10 seconds between the two sources.
As the standard laboratory condition, stationary noise and target speech were both presented from the front (0° stat.). In the more complex measurement condition, target speech was presented from the front while the fluctuating IFFM masker was presented from ±60° (±60° fluct.). To separate the effects of spatial separation and temporal fluctuations of the noise, an additional condition was included in which speech and stationary noise were spatially separated (±60° stat.). 0° stat. And ±60° fluct. were measured both with and without applied amplification, whereas ±60° stat. was measured only with amplification applied. Measurement conditions with applied amplification are labeled “amplified”, measurement conditions without amplification are labeled “unaided”. All participants performed all measurement conditions. This means that also the NH participants conducted the trueLOUDNESS measurement, and the calculated gains were applied in the amplified conditions.
Overview of the Measurement Conditions for Assessing Speech Intelligibility

Measurement Signal Generation
All speech intelligibility measurements were conducted using headphones. Headphone presentation allows for a simple and controlled measurement setup and enables the isolated investigation of the effect of individual amplification, without interactions with other hearing aid features. To provide a realistic spatial impression, virtual acoustics was used to simulate loudspeaker presentation under controlled acoustic conditions. For this purpose, three loudspeakers at 0°, 60°, and -60° azimuth were arranged around the recording position at a distance of 1.5 m in a laboratory at Hörzentrum Oldenburg. A head-and-torso simulator (KEMAR) by GRAS was placed at the listening position, and binaural head-related room impulse responses (HR-RIRs) were recorded for each loudspeaker direction. The corresponding energy decay curves of the measured HR-RIRs are shown in Figure 1. In addition, the transfer from the headphones to the KEMAR ear microphones was measured in the same setup, yielding a binaural headphone impulse response (HP-IR). The same headphones were used for stimulus presentation during the speech intelligibility measurements. Each impulse response was obtained by playing a 10-s exponential sine sweep (Farina, 2000) with a frequency range of 22.05 to 22050 Hz and a level of 80 dB SPL from the loudspeakers at 0°, +60°, and −60°. Each sweep was repeated 30 times, and HR-RIRs were derived from the recorded signals. The impulse responses (HR-RIRs and HP-IR) were truncated so that the HR-RIRs included the direct sound and the early room reflections, and the HP-IR included the direct headphone response. Truncation points were determined from the energy-decay curve as the time at which the response reached the noise floor. Energy decay curves obtained from the truncated head-related binaural room impulse responses (HR-RIR) for the three loudspeaker positions 0°, +60° and -60°
For each direction (0°, 60° and -60°), a binaural headphone playback filter was calculated separately for the left and right ear channels in the frequency domain. Specifically, the Fourier transforms of the measured impulse responses were used to calculate the playback filter
Spatial signals were then generated by convolving the speech and masker signals with the corresponding binaural playback filters. Separate filters were used for each source direction (0°, +60°, and −60°) and ear channel (left/right). For the ±60° measurement conditions two masker instances were generated from the same masker source signal. One instance was circularly shifted by 10 s. The original (unshifted) masker signal was convolved with the +60° playback filter, while the shifted masker signal was convolved with the -60° playback filter. The two resulting spatial masker signals were then summed. After summation, the level of the resulting signal was reduced by 3 dB to account for power addition. This procedure resulted in two simultaneously presented, spatially separated uncorrelated maskers from +60° and -60°. The procedure was applied to both masker types (IFFM and olsafnoise) to obtain the ±60° fluctuating and ±60° stationary condition. For the 0° stationary condition the olsafnoise was convolved with the 0° binaural playback filter. Since speech was always presented from the front, speech signals were convolved with the 0° playback filter for all measurement conditions.
General Procedure and Measurement Apparatus
As a first step during the appointment, otoscopy was performed, and the pure tone audiogram was measured, including air conduction (AC) and bone conduction (BC) thresholds. For the NH participants, only AC was measured. The test frequencies for AC were 125, 250, 500, 750, 1000, 1500, 2000, 3000, 4000, 6000, and 8000 Hz. For BC, the test frequencies were 500, 750, 1000, 1500, 2000, 3000, and 4000 Hz. Afterwards, the trueLOUDNESS measurement for the gain calculation was conducted. Following a short break, speech intelligibility measurements were performed, with small breaks after the completion of every four test lists. The estimated total duration of an appointment was 1.5 hours. Loudness and speech intelligibility measurements were conducted using the Oldenburg Measurement Application software developed by Hörzentrum Oldenburg. Audio playback was realized using an RME RayDAT interface with an RME ADI-8 Pro multichannel digital-to-analog converter, and signals were presented via an Earbox 3.0 HiPower headphone amplifier and Radioear DD65v2 headphones. The study was approved by the responsible ethics committee (“Kommission für Forschungsfolgenabschätzung und Ethik”) of the Carl von Ossietzky University in Oldenburg, Germany (Drs.EK/2025/026). The participants provided their written informed consent and received an allowance for their participation in the experiments.
Statistical Analysis
Multiple Linear Regression
To investigate the relationship between different measurement results and test person characteristics, multiple linear regression models were applied to the data using R version 4.5.1. To assess the goodness of fit of the model, the coefficient of determination
Piecewise Linear Regression
For the analysis of the unaided SRTs, a piecewise linear (“broken-stick”) regression model was fitted using Matlab 2021b. This model allows for two linear segments with different slopes that meet at an estimated breakpoint 
In all cases where the piecewise linear regression model was applied, we initially included age as an additive covariate to account for potential age-related effects on hearing loss. Age was not significant in any cases. Therefore, for the final models age was excluded.
The piecewise linear regression has the same assumptions as a linear regression model. In most cases the assumptions of linearity, homoscedasticity and normal distribution of the residuals were met. In one instance homoscedasticity was violated, hence robust standard errors were calculated using the same method as described above.
Results
Figure 2 shows the unaided SRTs of all participants plotted against PTA4. Different marker types and colors indicate the respective audiogram groups. The left panel depicts the SRTs in 0° stat. unaided, while the right panel shows the SRTs in ±60° fluct. unaided. The green-shaded area indicates the 10th to 90th percentile of SRTs of NH participants. Due to the application of spatially distributed fluctuating maskers in ±60° fluct. unaided, large differences were expected between the two conditions. Speech Recognition Thresholds (SRTs) unaided (without amplification) as a function of Pure Tone Average (PTA4). Left: SRTs in standard clinical condition with speech and stationary noise from 0°. Right: SRTs in complex condition with speech from 0° and uncorrelated fluctuating maskers from ±60°. Different marker types and colors indicate different audiogram groups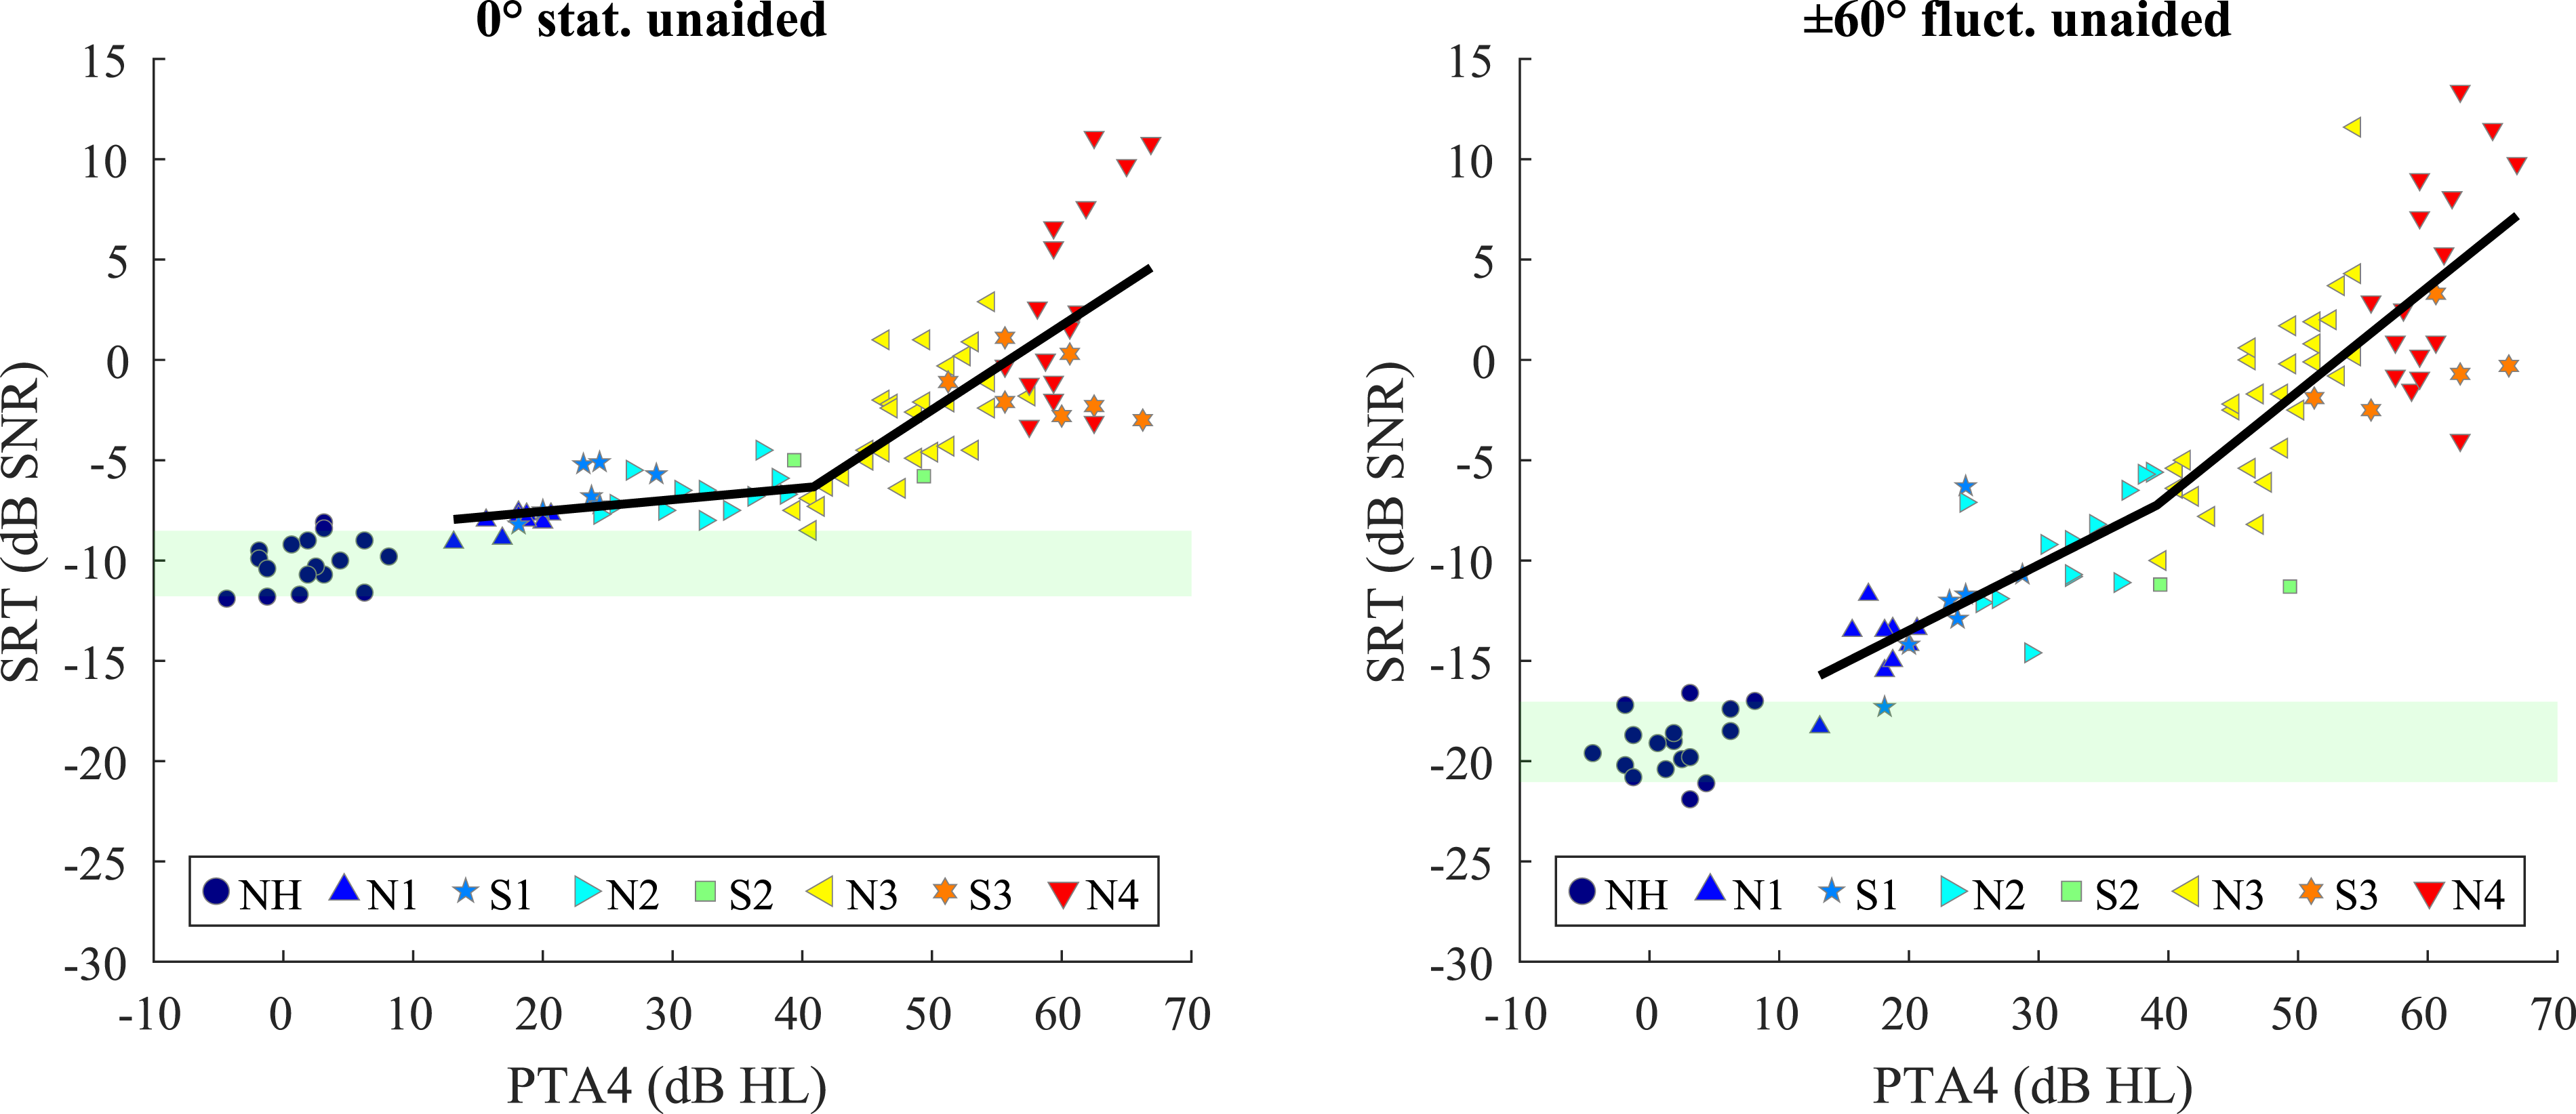
On visual inspection participants with HL show different behavior between 0° stat. unaided and ±60° fluct. unaided. In 0° stat. unaided participants with a mild hearing loss (groups N1, S1, N2, S2) show a performance close to normal hearing, with a few participants falling within the green-shaded NH range. Around a PTA4 of 40 dB HL, the relationship between PTA4 and SRT shows a noticeable change in its progression, with a steeper increase at higher PTA4 values, as well as a gradual increase in SRT variability. In contrast, in the ±60° fluct. unaided condition, the mild hearing loss groups (N1, S1, S2, N2) show an increase in SRT with PTA4 and also a clear diversion from the NH range. Additionally, the variance in SRTs for similar PTA4 values appears to be greater than in 0° stat. unaided.
Statistics for the Piecewise Linear Regression Model in the Condition 0° Stat Unaided and ±60° Fluct. Unaided

In the 0° stat. unaided condition, β1 was not significantly different from zero (p= 0.183), indicating that participants with a PTA4 up to 40.9 dB HL could not be differentiated from one another in this stationary noise condition. After the breakpoint, the increase in SRT was significant (p< 0.001), with a slope of 0.42 dB SNR/dB HL on the right side of the breakpoint.
In contrast, in ±60° fluct. unaided, β1 showed a significant positive slope of 0.33 (p< 0.001), corresponding to an increase of 0.33 dB in SRT per 1 dB increase in PTA4 for participants with mild hearing loss. The change in slope of the piecewise linear regression function after the breakpoint (β2) was not significant (p= 0.074), suggesting that the SRT increases linearly with PTA4 in this condition.
The piecewise linear regression model explained 68.1% of the variance in SRT (R
2
= 0.681, adjusted R
2
= 0.673) for 0° stat. unaided and 78.4% of the variance (R
2
= 0.784, adjusted R
2
= 0.778) in ±60° fluct. unaided, indicating a higher proportion of explained variance in the latter condition. The Pitman-Morgan test shows a significant difference in the residual variance of the piecewise linear fit models of the two conditions (
Overall, these results demonstrate that while unaided SRTs in stationary noise remain relatively stable up to moderate hearing loss, performance in fluctuating noise deteriorates more consistently, showing clear speech intelligibility deficits and visible differences between participants with HL also for mild hearing loss.
Figure 3 shows SRTs of all participants over PTA4 with participant-individual amplification applied. Speech Recognition Thresholds (SRTs) as a function of Pure Tone Average (PTA4) for all participants with individual amplification. Solid lines show linear regression estimates of SRT as a function of PTA4 while controlling for age Left: SRTs for co-located speech and stationary noise at 0°. Right: SRTs for speech at 0° and fluctuating maskers at ±60°. Different marker types and colors indicate different audiogram groups
The left panel shows the condition 0° stat. amplified, while the right panel depicts the condition ±60° fluct. amplified. The green-shaded area indicates the 10th to 90th percentile of SRTs of NH participants. In the left panel, SRTs are generally clustered tightly above the NH range, with several participants with HL, particularly those with mild losses (N1, N2), falling within the NH range. Even some participants with moderate to severe thresholds approach NH performance. One participant in the N4 group has an SRT that is in the range of NH.
In contrast, in ±60° fluct. amplified, SRTs show a wider spread and are shifted upward, indicating poorer performance compared to NH overall. Only one participant with mild hearing loss reaches NH performance, while for moderate and severe losses (N3, N4), the performance gap between participants with HL and with NH increases substantially.
Results of Multiple Linear Regression Models for Speech Intelligibility in the Conditions 0° stat. Amplified and ±60° Fluct. Amplified

To verify the observed differences in SRT increase over PTA for the two measurement conditions, a combined model for both conditions including all observations was fitted, with condition as a categorical factor. The model included the main effects of PTA, condition, and age (covariate), as well as the interaction between PTA and condition (SRT ∼ PTA * condition + age). The interaction term of PTA and measurement condition served as the statistical test for differences in slopes between conditions. The results showed a significant interaction term, i.e. a significant difference in slope between the conditions, with p< 0.001. This illustrates that performance decreases more substantially with higher PTA4 under more complex listening conditions despite individual amplification.
Figure 4 shows the effect of SRM for stationary noise and the effect of dip listening for spatially separated sound sources separately. The left panel shows the difference in SRT between the standard condition (0° stat. amplified) and the spatially separated condition with stationary noise (±60° stat. amplified), representing the benefit of spatial separation in case of stationary noise. The right panel shows the difference in SRTs between spatially separated stationary noise (±60° stat. amplified) and spatially separated fluctuating noise (±60° fluct. amplified), representing the benefit of the fluctuating noise in case of spatially separated sound sources. In both panels, the abscissa depicts the hearing loss (PTA4), and each marker corresponds to an individual participant. All data presented here was obtained with applied amplification. Benefit in Speech Recognition Threshold (SRT) as a function of Pure Tone Average (PTA4) for spatial source separation in case of stationary noise (left) and noise fluctuations in case of separated sound sources (right) for the amplified case. Solid lines show linear regression estimates of SRT benefit as a function of PTA4 while controlling for age. Left: difference between SRTs in stationary noise from the front and stationary noise from ±60°. Right: difference between SRTs with stationary noise from ±60° and fluctuating noise from ±60°. Different marker types and colors show different audiogram groups
Results of the Multiple Linear Regression Model for Speech Intelligibility Benefit of Spatial Separation of Sound Sources in Case of Stationary Noise

Results of the Multiple Linear Regression Model for Speech Intelligibility Benefit of Fluctuating Noise Compared to Stationary Noise in Case of Spatially Separated Sound Sources
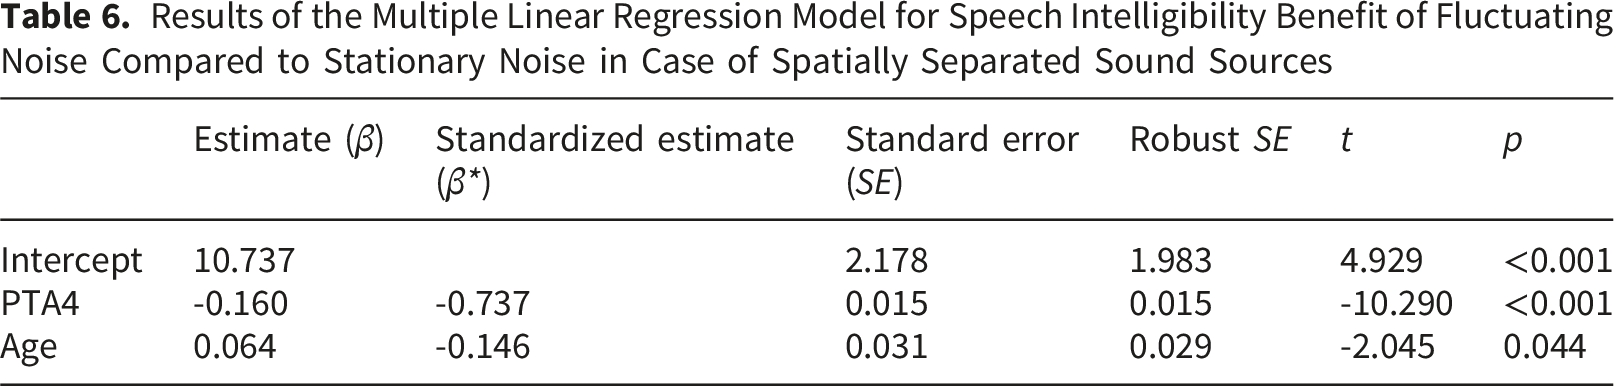
Notably, while NH participants and participants with mild HL generally showed a positive benefit from fluctuating compared to stationary noise (in case of spatially separated sound sources)—reflecting the ability to “listen in the dips”—this benefit decreased with increasing hearing loss. In fact, participants with more severe hearing loss often performed worse in fluctuating noise than in stationary noise.
Not only is it interesting for audiologists to measure the unaided and aided performance of the person with HL, the benefit that the hearing aid provides is also relevant. Figure 5 shows the benefit of amplification for the two main measurement conditions 0° stat. and ±60° fluct. Benefit in Speech Recognition Threshold (SRT) of amplification as a function of Pure Tone Average (PTA4). Left: SRT benefit in standard clinical condition with speech and stationary noise from 0°. Right: SRT benefit in complex condition with speech from 0° and uncorrelated fluctuating noise sources from ±60°. Different marker types and colors indicate different audiogram groups
Again, on the abscissa the PTA4 is depicted. On the ordinate the SRT difference between unaided and amplified is shown. Generally, for both measurement conditions, the average benefit increases for higher hearing loss, as one would expect. There is also a visible increase in data spread towards higher PTA4. Interestingly, independently of PTA4 there are participants who do not benefit from amplification alone, in these experiments. For group N4, which on average shows the largest benefit, there is a large spread in benefit from 0 dB up to approximately 15 dB in 0° stat. And -3 to 13 dB in ±60° fluct.
When comparing the two measurement conditions, the trends in the performance of the hearing loss groups are similar, meaning that the benefit on average increases with increasing hearing loss and that for all hearing loss groups there are participants who to not benefit at all from amplification. For mild hearing loss and normal hearing the standard deviation appears to be larger in ±60° fluct. Linear regression indicated an association between the SRT benefit in the two measurement conditions (R 2 = 0.5, p< 0.001).
Discussion
Interpretation of Results and Comparison With Literature
Unaided Measurements
In the standard measurement condition 0° stat. unaided, speech intelligibility performance showed similar SRTs for hearing losses below approximately 40 dB HL and a significant SRT and SRT variance increase beyond this value. Similar results were also found by Wardenga et al. (2015), who measured unaided SRTs in stationary noise across a wide range of hearing thresholds in a clinical population. They also used the OLSA, but with the male speaker and the corresponding stationary noise matched to the male speech spectrum. Measurements were conducted monaurally via headphones without virtual acoustics. A total of 177 participants participated, resulting in 315 measured ears, with PTA ranging from 0 to more than 100 dB HL. The authors found a similar pattern of SRTs as a function of PTA as in the present study. Two linear functions were fitted with a breakpoint at 47 dB HL. It was shown that the slope increased markedly beyond the breakpoint. They also showed that the variance in SRT increased after the breakpoint, with SRTs spanning a range of 20 dB SNR for a PTA of 60 dB HL.
The change of slope observed in both studies is likely related to audibility. For participants with mild hearing loss the stimuli are still above threshold, which leads to similar performances for these participants. For higher PTA4s above approx. 40 dB HL, parts of the speech stimuli fall below the hearing threshold. Therefore, the speech stimuli need to be increasingly higher in level to be audible, which leads to a linear increase in SRTs with a higher slope.
In the more complex measurement condition 60° fluct. unaided, performance decreased linearly with increasing thresholds, even for participants with mild hearing loss, meaning that this condition allows for better separation of participants with HL than 0° stat. unaided. Wagener and Brand (2005) as well as Wagener et al. (2006) had similar findings, when they investigated the influence of fluctuating noise on SRTs. They used stationary and fluctuating noises of the International Collegium for Rehabilitative Audiology, so called ICRA noises (Dreschler et al., 2001). In both studies it was shown that for the fluctuating ICRA5 the variance among participants with HL was much higher compared to the stationary ICRA1 noise. This was the case independently of silence interval duration (2s, 250 or 62.5 ms) of the fluctuating noise (Wagener et al., 2006).
Generally, the measurement results suggest that the proposed measurement condition captures additional deficits that are not detected in the standard clinical condition. By design it targets temporal and spatial processing deficits. These deficits likely play an important role for impaired speech intelligibility in daily life, where often several fluctuating sound sources are present. The study results indicate that speech intelligibility in fluctuating spatial noise can be impaired also for mild HL, even if the presented stimuli are above the hearing threshold, and one would assume that audibility of the speech is not an issue. This finding highlights the importance of including more complex stimuli in a clinical setup for assessing unaided speech-in-noise ability.
Measurements With Amplification
By applying individual amplification to the stimuli, the effect of audibility on the SRTs was assumed to be largely excluded. However, no additional measurements were performed to verify this assumption. During the adaptive measurement procedure, the masker level was kept constant at 65 dB SPL, while the speech level was varied. Amplification was applied relative to the level of the total input sound. In cases of highly negative SNRs, it is therefore possible that soft speech components were not sufficiently amplified and might have fallen below the hearing threshold. Highly negative SNRs were mostly achieved by the NH group in the ±60° fluct. condition. Consequently, we cannot rule out that performance with amplification was underestimated for some of these participants.
In 0° stat. amplified, the performance of participants with HL was often close to that of NH participants or within the NH range. In ±60° fluct. amplified, however, the performance gap between participants with NH and participants with HL increased substantially, with the difference growing with increasing PTA4. This demonstrates that in such a measurement condition restoring audibility alone does not restore normal speech intelligibility, and that deficits unrelated to audibility generally increase with increasing hearing threshold.
When comparing SRTs in ±60° stat. amplified and ±60° fluct. amplified, we see that for high hearing loss (groups N3 and N4), fluctuating noise even resulted in poorer speech intelligibility than stationary noise. In other studies investigating the effect of fluctuating maskers in speech intelligibility measurements, mostly a benefit from fluctuating compared to stationary noise or no difference between the stationary and fluctuating noise was found (George et al., 2006; Holube, 2011; Peters et al., 1998; Wagener et al., 2006), though the amount of masking release observed differs between studies and between individual listeners with HL in the studies. A deterioration of SRTs is not observed for the studies mentioned above and was not expected in the current study.
There are different study design choices that can influence the observed benefit from fluctuating noise. 1. The hearing threshold: As we have seen in Figure 3, the PTA4 does correlate with the SRT in fluctuating noise, even when amplification is provided. For milder hearing loss groups, a benefit from fluctuations is observed, while for higher hearing loss, a performance decrease can be seen. This suggests that higher hearing thresholds are often indicative of suprathreshold processing deficits which are not compensated for when audibility is restored. 2. Fluctuating masker type: Anecdotally, participants have reported that the IFFM masker used in this study is quite distracting because of its speech-like nature. Therefore, the reduction in performance compared to stationary noise that we observed might be an interaction between the high hearing threshold and difficulties to direct attention away from the masker. Using a noise with amplitude modulation as the fluctuating masker might not have this distracting effect. On the contrary, the effect might even be more pronounced if intelligible maskers were used (Brouwer et al., 2012). Furthermore, other parameters such as gap length, modulation rate and modulation depth can also lead to differences in dip listening (George et al., 2006; Wagener et al., 2006).
One study with a similar design was conducted by Goossens et al. (2017). They investigated the effect of hearing loss and age on speech intelligibility in stationary and fluctuating, speech-like noise. The noise types they used were very similar to those in the current study. The stationary noise had the same spectrum as the speech. The fluctuating noise was the International Speech Test Signal (ISTS), which is the same as the IFFM but with longer silence intervals. They presented the stimuli monaurally over headphones. They ensured audibility of the stimuli is given by applying amplification to the stimuli and then performing a speech test in quiet. The results showed that young NH participants had a better performance with the ISTS compared to the stationary noise. For older participants with HL, however, the performance with the ISTS was on average approx. 10 dB worse than with the stationary noise. The authors also included a noise with speech spectrum which was amplitude-modulated with 4 Hz. It was shown that for this noise type also a performance decrease compared to stationary was visible for the older participants with HL, but the effect was less pronounced than for the ISTS. This suggests that the natural speech properties of the ISTS added a component that makes processing speech more difficult for older listeners with HL than for other fluctuating noise types. This difference might be attributed to a higher cognitive load that is imposed by this masker.
SRM can improve SRTs by approximately 12 dB for NH listeners depending on the stimuli, spatial configuration and room acoustics (Beutelmann & Brand, 2006; Litovski, 2012). In this study the effect of SRM for the NH group was on the smaller side with 0.8 to 4.6 dB SNR improvement. A main factor influencing SRM is the spatial configuration of the sound sources. In setups with target speech from the front and symmetrical noise sources from the sides, the better-ear-listening component of SRM is diminished, which leads to lower SRM compared to asymmetrical setups, e.g. one noise source from the side. SRM values for NH participants in this study align with other studies using similar measurement setups. Ewert et al. (2017) found a mean SRM of approx. 4 dB for NH, using the German matrix sentence test (OLSA) in speech-shaped noise presented over headphones with head related transfer functions (HRTFs). In their 0° azimuth condition two statistically independent noise instances were presented co-located with the speech. In the spatial condition the masker instances were moved to ±60° azimuth, which results in a similar measurement setup as the one used in the current study. Hawley et al. (2004) assessed SRM in NH for two correlated interferers from -30° and 90° azimuth. For stationary speech shaped noise they found a mean SRM of approx. 1dB.
In this study, SRM was analyzed by comparing SRTs in the 0° stat. condition and the ±60° stat. condition. It is to be said that SRM can vary depending on the type of masker. For instance, Hawley et al. (2004) found higher SRM for reversed speech than stationary noise in the measurement condition with target speech from the front and maskers from -30° and 90° azimuth. A study assessing SRM for symmetrical interfering talkers was performed by Neher et al. (2009). They had three competing talkers using the Danish equivalent to the OLSA as speech material. The sentences from the three talkers were presented simultaneously. The target speech was identifiable using the first word of a sentence as the call sign. All three talkers were presented at 0° azimuth in the co-located condition. In the spatially separated condition the two maskers were shifted to ±50° azimuth. For hearing aid users with symmetrical moderate hearing loss the authors observed a mean SRM of 5.4 dB, with individual listeners showing SRM of more than 14 dB. It is possible that the similarity between target and maskers enhances SRM because listeners rely heavily on spatial cues to differentiate the sound sources.
Notably, some NH participants in this study show almost no SRM. We defined normal hearing by the pure tone hearing threshold only. We cannot exclude that some NH participants had a e.g. binaural processing hearing deficit that is not visible in the audiogram.
In the current study all stimuli were presented over headphones, so head movement did not affect SRTs. It should be noted that if stimuli had been presented over loudspeaker the benefit of spatial separation might have been larger because participants would have been able to use head movements to get a small better-ear advantage and possibly a stronger spatial segregation of speech and masker auditory streams.
In contrary to dip listening, average SRM differed only slightly with PTA4. Instead, the variance in SRM remains almost constant across the whole range of hearing thresholds, even including NH participants. This indicates that - differently to dip listening - the ability to exploit spatial cues in stationary noise is only mildly related to the hearing threshold when audibility is restored.
Benefit of Amplification
When investigating the benefit of amplification, we found an increase in benefit with increasing PTA4 for both measurement conditions. However, there was also a large variance in the benefit of amplification, especially towards high hearing thresholds. There were some participants who did not benefit from amplification at all. This finding is in line with Jansen et al. (2024). They used a research hearing aid and virtual acoustics to assess the benefit of amplification and additional signal enhancement algorithms on speech intelligibility. It was shown that participants differed markedly in their benefit from amplification and also signal enhancement algorithms.
In ±60° fluct. 50% of the variance in SRT benefit was explained by the SRT benefit in 0° stat. This shows that even though both conditions have a similar trend in the data, there are aspects of amplification benefit that are addressed in ±60° fluct. that are not covered in 0° stat. It will be interesting to investigate which results are a better estimate of the perceived benefit of hearing aids in the daily life.
The Role of Age
Age did not emerge as a significant predictor of unaided SRTs in the present study. This aligns with findings by Gieseler et al. (2017). They investigated auditory and non-auditory contributors to unaided speech intelligibility for 438 participants with HL with a wide range of hearing thresholds. The participants’ age range was 60-85 years. The authors found that age emerged as a predictor of speech intelligibility in their regression model, but the goodness of fit of the model was only marginally improved. The authors concluded that it was rather factors associated with age, such as PTA, that explained the speech-in-noise performance. In the case of Gieseler et al. (2017) speech intelligibility was assessed in stationary noise. However, similar results were also found for speech intelligibility in fluctuating noise by Wagener et al. (2006), who reported that age played only a minor role in speech intelligibility in fluctuating noise for unaided listening conditions.
When comparing the benefit of spatial separation and the benefit of fluctuations in the masker, age significantly influenced the benefit of fluctuations, but not the benefit of spatial separation. However, the influence of age on dip listening was small compared to that of PTA4, showing that the hearing threshold remains the dominant factor. In contrast, Goossens et al. (2017), who compared speech intelligibility of young, middle-aged, and elderly and of NH and listeners with HL, found that especially for the speech-like ISTS masker age did play a major role in SRT outcomes.
Regarding SRM, the literature presents mixed results. While Glyde et al. (2013) reported that age was not a significant factor for spatial processing ability, Gallun et al. (2013) observed a clear age effect. Neher et al. (2009) showed a significant effect of age on spatial separation benefit with two interfering fluctuating maskers when the maskers were shifted to the sides (±50°), but not when they were shifted to the back (180°).
Implications for Hearing Care Practice
A measurement condition was developed in which speech intelligibility was assessed in fluctuating noise presented from ±60°. This setup provides two main advantages compared to the standard clinical condition with speech and stationary noise from the front.
Firstly, it enables the detection of speech intelligibility deficits even in individuals with mild hearing loss tested without amplification, for whom this effect is not seen in the standard condition. This offers audiologists an additional tool to demonstrate a potential need for hearing device provision. Individuals with mild hearing loss account for approximately 73 % of all people with hearing loss world-wide (World Health Organization, 2021), representing a substantial potential customer group that is often not treated, even when they consult an audiologist due to hearing difficulties in challenging listening situations. There are different strategies for fitting hearing aids to this group. Typically, when hearing thresholds are relatively low, a so-called open-fit approach (large venting) is applied, allowing as much natural sound as possible to reach the ear. Amplification is then provided only in frequency regions where thresholds are elevated, usually in the high frequencies. However, this limits the effectiveness of hearing aid signal enhancement algorithms such as directional microphones and noise reduction, since the direct sound dominates the processed sound (Jürgens et al., 2025). Such algorithms could be particularly beneficial for this population with HL, as their main challenges typically occur in complex listening environments rather than in quiet settings. An alternative strategy is a closed fit (small venting), minimizing direct sound and providing amplification across the full frequency range, with signal enhancement algorithms activated. In complex environments, this approach may yield greater benefit than the open fit, because the algorithms can work more efficiently as shown by Jürgens et al. (2025). However, it might be most suitable for situational use in louder or more complex listening situations, since a closed fit can be perceived as uncomfortable due to the occlusion effect. Advantages and disadvantages of these two fitting strategies are described in detail by Winkler et al. (2016).
Secondly, even with amplification, participants with HL continue to show a performance gap relative to NH participants for ±60° fluct. This highlights residual deficits that can remain despite amplification. Estimating performance with hearing aid amplification can assist audiologists in counseling clients, providing a measure to help set realistic expectations for the fitting process. There are other approaches besides speech intelligibility measurements that aim to estimate performance with hearing aids. Using psychoacoustic measures that target specific speech-related auditory features may be beneficial for identifying underlying auditory processing deficits and for optimizing both diagnostics and hearing-aid fitting. Such a measurement using spectro-temporal modulation detection thresholds was evaluated in Zaar et al. (2024).
Our results also revealed considerable variability in amplification benefit, especially for individuals with higher audiometric losses. This pattern was observed in both 0° stat. And ±60° fluct. Assessing the individual benefit of amplification can support a more personalized fitting. Clients who have little or no benefit may perceive limited improvement in daily life. This challenge can be addressed by emphasizing additional hearing aid features such as beamforming and noise reduction, highlighting their advantages, and incorporating them into client counseling. It should be noted that all measurements were conducted at an unaided level of 65 dB SPL. It can be expected that also participants who showed no benefit from amplification in this study will benefit from amplification when speech is presented at lower levels.
Limitations and Outlook
There are some limitations to the current study, as well as aspects that warrant further investigation.
In the current study amplification was provided, so that the effect of audibility on speech intelligibility could be examined, but the influence of additional hearing aid signal processing and their potential interaction with the measurement condition remains unknown. However, by using spatially separated sound sources, a solid foundation has been established to also investigate the effects of directional microphones and additional hearing aid functionalities in future studies. It has to be noted that common directional microphones mostly suppress sounds from the rear hemisphere, therefore a measurement condition with noise sources at ±60° would likely not reveal the maximum benefit of such algorithms.
In this study, stimuli were presented over headphones, using head-related room impulse responses to simulate a presentation over loudspeaker. This approach assured high reproducibility and control of the measurement conditions and allowed the effect of amplification to be examined in isolation. Nevertheless, it remains unclear whether these findings can be generalized to real hearing aids and presentation via loudspeakers. When designing the measurement condition, potential future loudspeaker presentation was taken into account. The condition was structured so that only three loudspeakers are required, making it a realistic setup for application in hearing care practice. A comparison between the current headphone setup and a loudspeaker setup with real hearing aids is planned for a forthcoming study.
Although the results indicate that the proposed measurement condition targets various aspects of hearing and signal processing in the human brain that is used in challenging listening situations, such as dip listening and SRM, it is still uncertain whether it provides a sufficient estimate of speech perception or hearing aid benefit in daily life. Verification of this would require studies in real-life environments, potentially using Ecological Momentary Assessment (EMA; Holube et al., 2020; Shiffman et al., 2008; von Gablenz et al., 2021). In the present study, we observed considerable variability in speech intelligibility outcomes, even among participants with similar audiograms. It will be of interest to determine whether these differences are also reflected in EMA ratings.
Conclusions
In the current study we developed and investigated a measurement condition for the German matrix sentence test (OLSA). Speech is presented from the front, and two fluctuating noise sources are presented from ±60° azimuth via headphones. The proposed condition provides two major benefits in comparison to a standard procedure with speech and stationary noise from the front: 1. The proposed measurement condition is able to resolve differences in unaided speech intelligibility among listeners with hearing loss, even for mild audiometric hearing loss. This can facilitate a better understanding of the severity of hearing loss and reveal a potential need for hearing aids. 2. After restoration of audibility through individual amplification, we still see a performance difference between normal-hearing listeners and listeners with hearing loss, demonstrating that amplification alone does not necessarily restore normal hearing. This helps to identify listeners with hearing loss who are particularly dependent on additional speech enhancement techniques in hearing devices.
The data suggests that the benefits of the proposed measurement condition compared to the standard measurement condition primarily originate from the fluctuation of the noise, rather than spatial separation of speech and noise. Notably, in other studies with different experimental setups a different balance between benefit of fluctuations and spatial separation was found.
The benefit of amplification varies widely across participants, even in cases of similar hearing thresholds. Across the whole range of measured hearing thresholds there were participants who did not benefit from amplification.
Footnotes
Acknowledgements
The authors would like to sincerely thank Christian Albers, Müge Gökalan, Chiara Haf, Janique Reinwaldt and Kerstin Sommer for data collection, as well as Mats Exter and Sven Kissner for the fruitful discussions.
ORCID iDs

Ethical Considerations
The study was approved by the responsible ethics committee (“Kommission für Forschungsfolgenabschätzung und Ethik”) of the Carl von Ossietzky University in Oldenburg, Germany (Drs.EK/2025/026).
Consent to Participate
The participants provided their written informed consent and received an allowance for their participation in the experiments.
Funding
The authors disclosed receipt of the following financial support for the research, authorship, and/or publication of this article: This work was funded by the Lower Saxony Department of Science and Culture and the European Regional Funding (EFRE, ZW 7- 87012865, “Individualisierte, modellbasierte Hörgeräteanpassung, IMFIT)”.
Declaration of Conflicting Interests
The authors declared the following potential conflicts of interest with respect to the research, authorship, and/or publication of this article: Theresa Jansen, Kirsten C. Wagener, Laura Hartog and Dirk Oetting are employees at Hörzentrum Oldenburg gGmbH, which offers trueLOUDNESS and the German matrix sentence test (OLSA) as commercial products. No potential conflict of interest was reported by the other authors.
Data Availability Statement
The datasets generated during and/or analyzed during the current study are available from the corresponding author on request.
Appendix
Magnitude error between the target HR-RIR transfer functions and the effective playback transfer functions 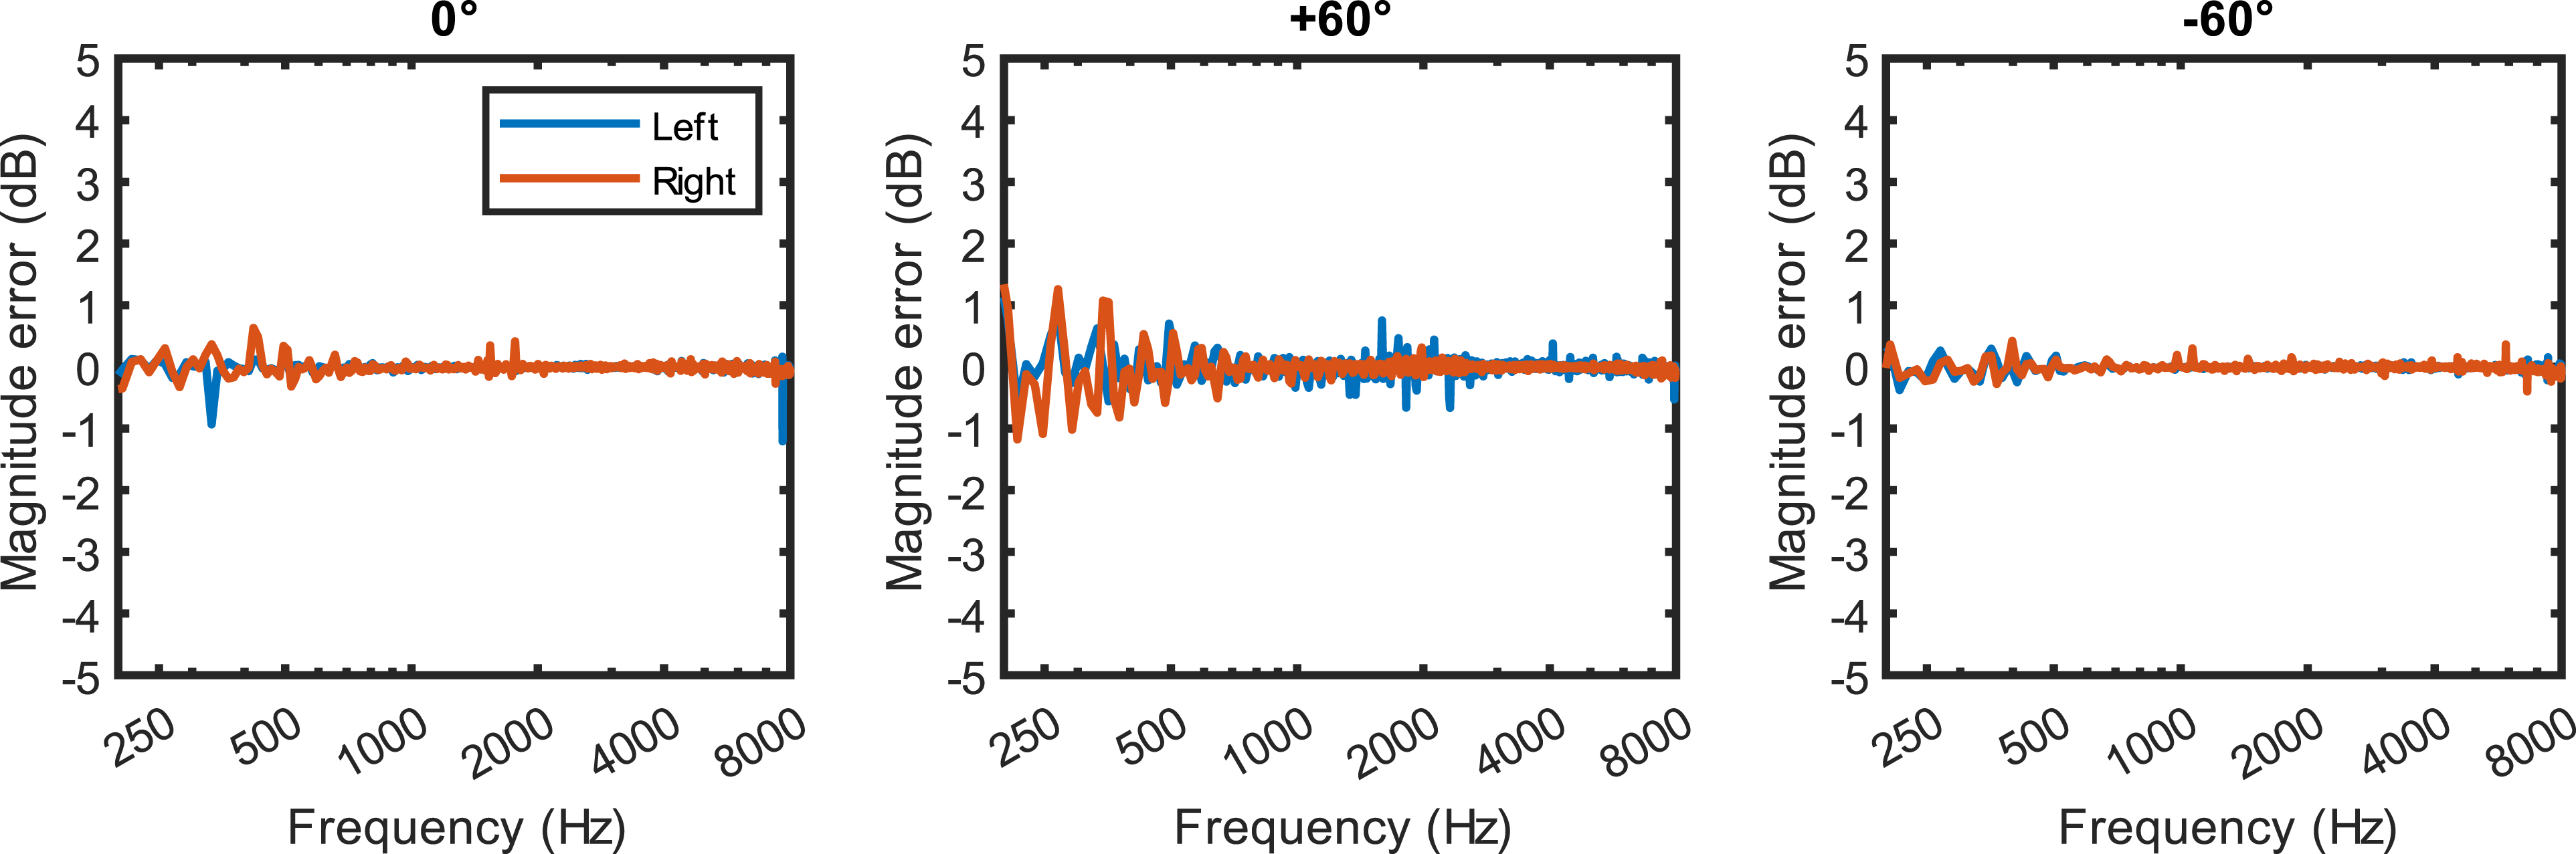
Phase error between target HR-RIR transfer functions and the effective playback transfer functions for the three source directions 0°, +60° and -60°. The small deviations across the frequency range indicate that the playback filters have similar phase characteristics as the measured HR-RIRs