



Abstract
Executive Summary
In 2021, the undocumented population residing in the United States (US) increased slightly to 10.3 million, compared to 10.2 million the previous year. The gradual decline or near-zero growth of this population has continued for more than a decade. However, the large increases in apprehensions at the southern border in recent years, along with continued legislative gridlock in Congress, could portend a new era of growth of this population. Unfortunately, the data needed to determine whether the population will enter a period of growth after 2021 — or whether the era of near-zero growth will continue — will not be available for at least a year or two. The most accurate demographic estimates of the undocumented population are derived from data collected in the US Census Bureau’s American Community Survey. Estimates of the size of the undocumented population in 2022 will not be available until early 2024.
This report focuses on the most significant trend in the undocumented population in the past decade — the remarkable decline of 1.9 million in the undocumented population from Mexico from 2011 to 2021. The decline for Mexico in this period was 600,000 more than the total population increase from the seven countries (in order) with the fastest growing US undocumented populations: Guatemala, Honduras, India, Venezuela, El Salvador, Brazil, and China. This paper finds that: The long-term decline, or near-zero growth, of the total undocumented population that began in 2008 continued in 2021. The percent of undocumented residents in the total US population declined from 3.8 percent in 2011 to 3.1 percent in 2021. The undocumented population from Mexico declined from 6.4 million in 2011 to 4.4 million in 2021, a drop of 1.9 million in 10 years. A total of 2.9 million, or 47 percent, of the US undocumented population from Mexico in 2011 had left the undocumented population by 2021. The drop in the undocumented population from Mexico from 2011 to 2021 occurred nationwide, and the decline affected the undocumented population in nearly every state. The fastest growing undocumented populations by country in the last 10 years were from Guatemala, Honduras, India, El Salvador, Venezuela, and Brazil. The combined undocumented populations from these six countries grew by 1.2 million. Countries that had declining populations after 2011 included Poland, Peru, Ecuador, Korea, and Philippines, in addition to the large drop for Mexico. California had the largest decline in undocumented residents — 665,000 from 2011 to 2021. The undocumented population from Mexico living in California during this period declined by 720,000. The combined undocumented population in California, New York, and Illinois fell by more than one million from 2021 to 2011.
Change in the Undocumented Population, 2011 to 2021
From 2011 to 2021, the total US undocumented population dropped by about one million, gradually declining from 11.3 million to 10.3 million. The decline occurred mostly because the undocumented population from Mexico fell by 1.9 million while the population from all other countries increased by about 900,000 (Figure 1).
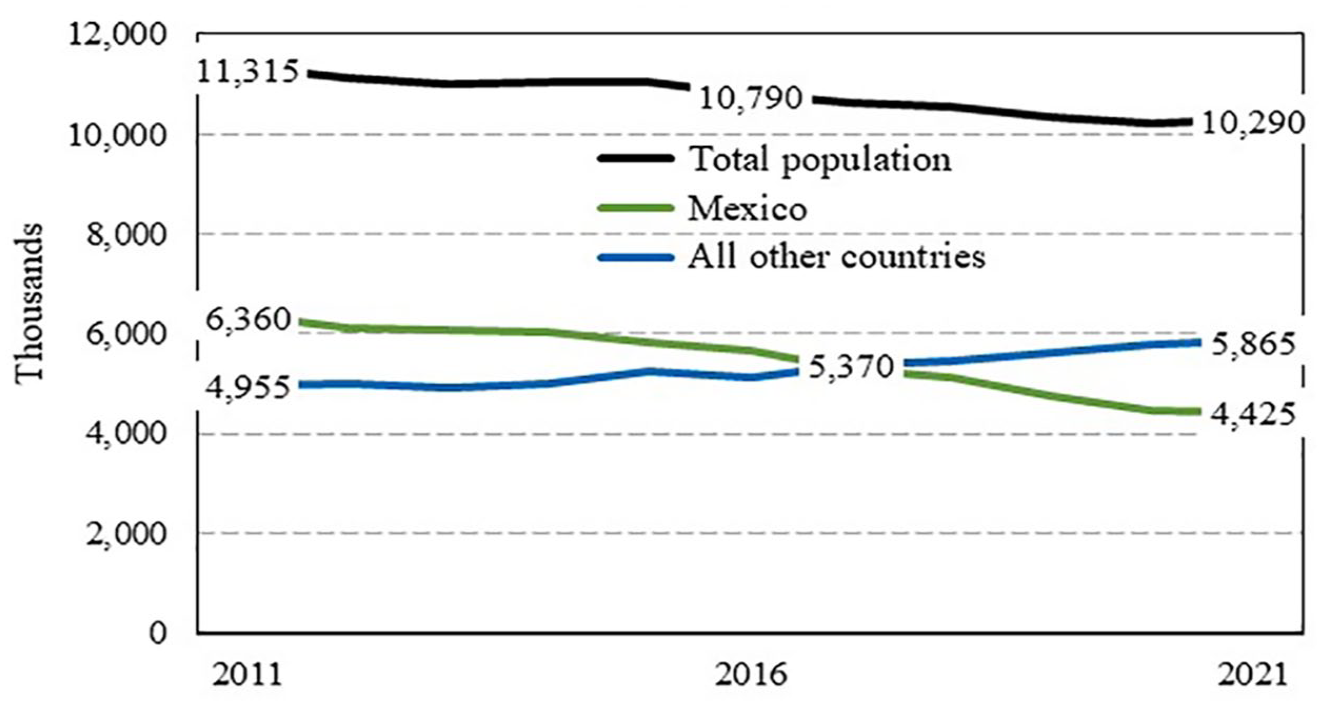
Major trends in the undocumented population: 2011 to 2021.
The green and blue lines in Figure 1, representing Mexico and “all other countries,” cross in 2017. That intersection marks a crossroads in the history of undocumented immigration to the United States. It represents the first time the population from Mexico was not more than one-half of the total undocumented population.
The decline in the undocumented population shown in Figure 1 began around 2008. That was the year the long-term increase in departures from the undocumented population finally equaled the number arriving. Since 2008, the undocumented population has dropped from about 12 million to about 10.3 million. As a result, the rate of undocumented residents to the foreign-born population and to the total US population has declined (Figure 2). At its peak in 2008 (not shown), the undocumented population comprised four percent of the US population. Since then, the percentage has declined to 3.1 percent (Figure 2). 1

Undocumented residents as a percent of foreign-born and Total US population: 1990 to 2021.
Decline in the Undocumented Population From Mexico, 2011 to 2021
The undocumented population from Mexico declined from 6.4 million in 2011 to 4.4 million in 2021, a drop of 1.9 million in 10 years (Figure 3). The population declined by 700,000 from 2011 to 2016, and then fell by 1.2 million from 2016 to 2021.
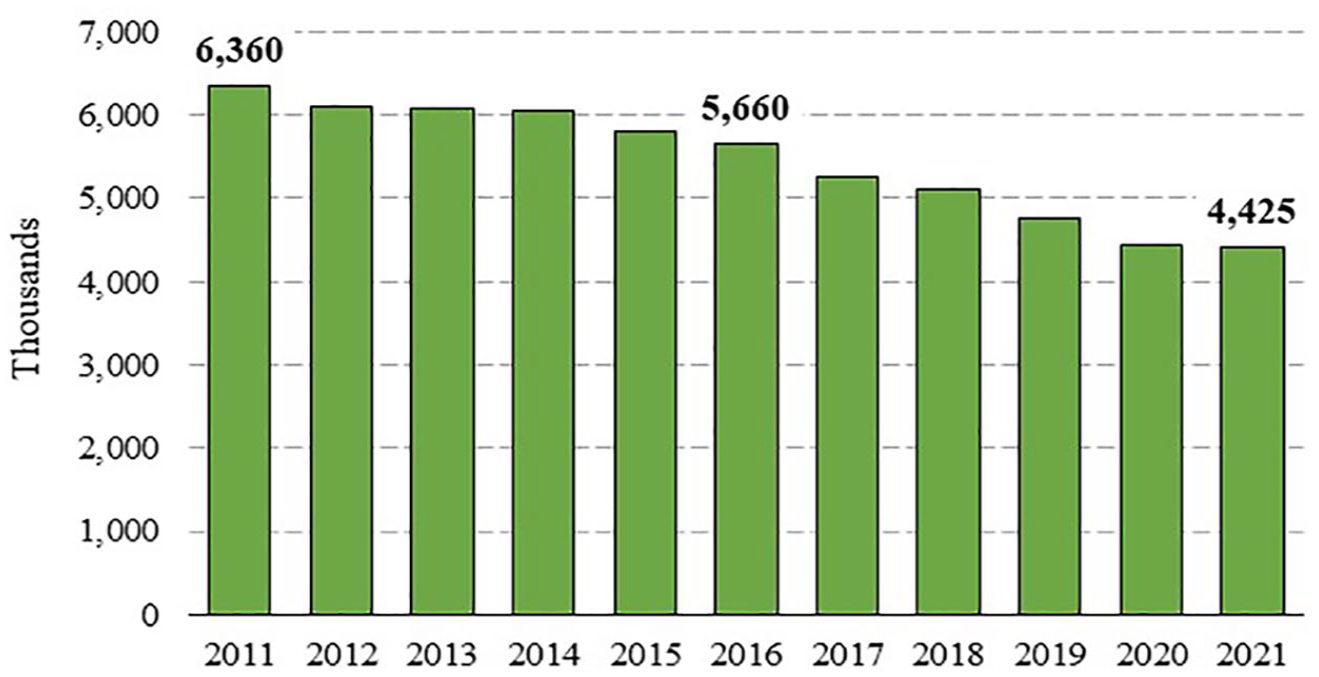
Estimated undocumented population from Mexico: 2011 to 2021.
A new demographic technique (Warren and Warren 2023) designed to evaluate estimated change in undocumented populations was used to confirm that the reported population decline for Mexico was not the result of errors in the data or CMS estimation procedure. The evaluation, described in detail in the Appendix, provides sound empirical support for the estimated decline of 1.9 million in the undocumented population from Mexico from 2011 to 2021.
It might seem puzzling that the undocumented population from Mexico declined by 1.9 million from 2011 to 2021 even though twice that number from Mexico were apprehended during the same period (US Department of Homeland Security, Office of Immigration Statistics 2023, Table 34). The explanation is twofold. First, apprehensions at the border do not correspond to undocumented population growth, and second, as illustrated in this report, large numbers leave the undocumented population each year.
Populations decline when the number leaving the population exceeds the number arriving. In the United States, undocumented residents can leave the population in four ways: voluntary emigration, removal by the Department of Homeland Security, adjustment to lawful permanent resident (LPR) status, and death. In this report, the phrases “left the population” or “departures” refer to the total of these four ways of leaving the undocumented population.
As Figure 3 shows, the undocumented population from Mexico remained nearly the same from 2012 to 2014 and then declined steadily after 2014, falling by an average of 270,000 per year.
Unfortunately, statistics are not available to derive precise annual estimates for each of the four ways of leaving the undocumented population. However, enough information is available to establish which of the four was most responsible for the decline. Three of the ways of leaving the population — deaths, removals, and adjustments of status — remained constant 2 throughout the 2011–2021 period. The stability of these three ways of leaving the population indicates that increases in voluntary emigration after 2014 was primarily responsible for the steady decline in the undocumented population from Mexico from 2014 to 2021. 3
Determining the cause of the increase in emigration to Mexico after 2014 is outside the scope of this report. Initial hypotheses might include: (1) The failure of Congress to enact a legalization program, particularly through the Border Security, Economic Opportunity, and Immigration Modernization Act of 2013, S. 744, 113th Cong. (2013); (2) the Trump Administration’s anti-immigrant policies and rhetoric (Kerwin and Warren 2019), and its threat of mass deportations (Warren and Kerwin 2017).
Disaggregating data for the undocumented population from Mexico in 2011 and 2021 by period of arrival produces important information about arrivals and departures from the population. Table 1 shows changes in the undocumented population from Mexico for seven periods of arrival. Column 3 shows how much each entry cohort changed from 2011 to 2021, and column 4 shows percent change from 2011 to 2021. 4
Change in the Undocumented Population From Mexico, by Period of Arrival: 2011–2021.

Note: Numbers in 5,000s. — not applicable.
Source: Center for Migration Studies.
The information shown in Table 1 is valuable for understanding the process of arrivals and departures from the undocumented population. The table mixes a variety of demographic concepts. Each row has been numbered for clarity of presentation.
The first two columns in Table 1 show estimates of the undocumented population from Mexico in 2011 and 2021 for each period of arrival. The total population declined from 6.4 million to 4.4 million, a drop of 1.9 million, or 30 percent (Row 1).
Rows 2 through 7 show estimates of the undocumented population in 2011 and 2021 for each period of entry. Note that the numbers in column 1, rows 2 to 7, can only decrease as undocumented residents leave the population. The percent that left the population increased slightly as length of residence increased. 5
The figures in row 8 of Table 1 are of particular interest. The population in that arrival cohort was 75,000 6 in 2011 and 1.1 million in 2021, a net increase of 1.0 million. The figure of 1.0 million in column 3, row 8, is the net 7 increase in the number that arrived in the 2011–2021 period.
Row 9 summarizes change in the population that arrived between 1982 and 2010 and were still undocumented in 2011 (Table 1). A total of 6.3 million resided in the United States in 2011, and only 3.3 million of them were still undocumented in 2021. About 2.9 million, or 47 percent, left the undocumented population from Mexico from 2011 to 2021 (Row 9).
Table 2 shows the same information on departures from the population that is shown for Mexico in Table 1, row 9, except that 19 additional countries are included. Half of the 11.1 million undocumented residents that arrived from 1982 to 2010, and resided here in 2011, were no longer undocumented in 2021 (Table 2).
Estimated Number that Left the Undocumented Population From 2011 to 2021, by Country of Origin.
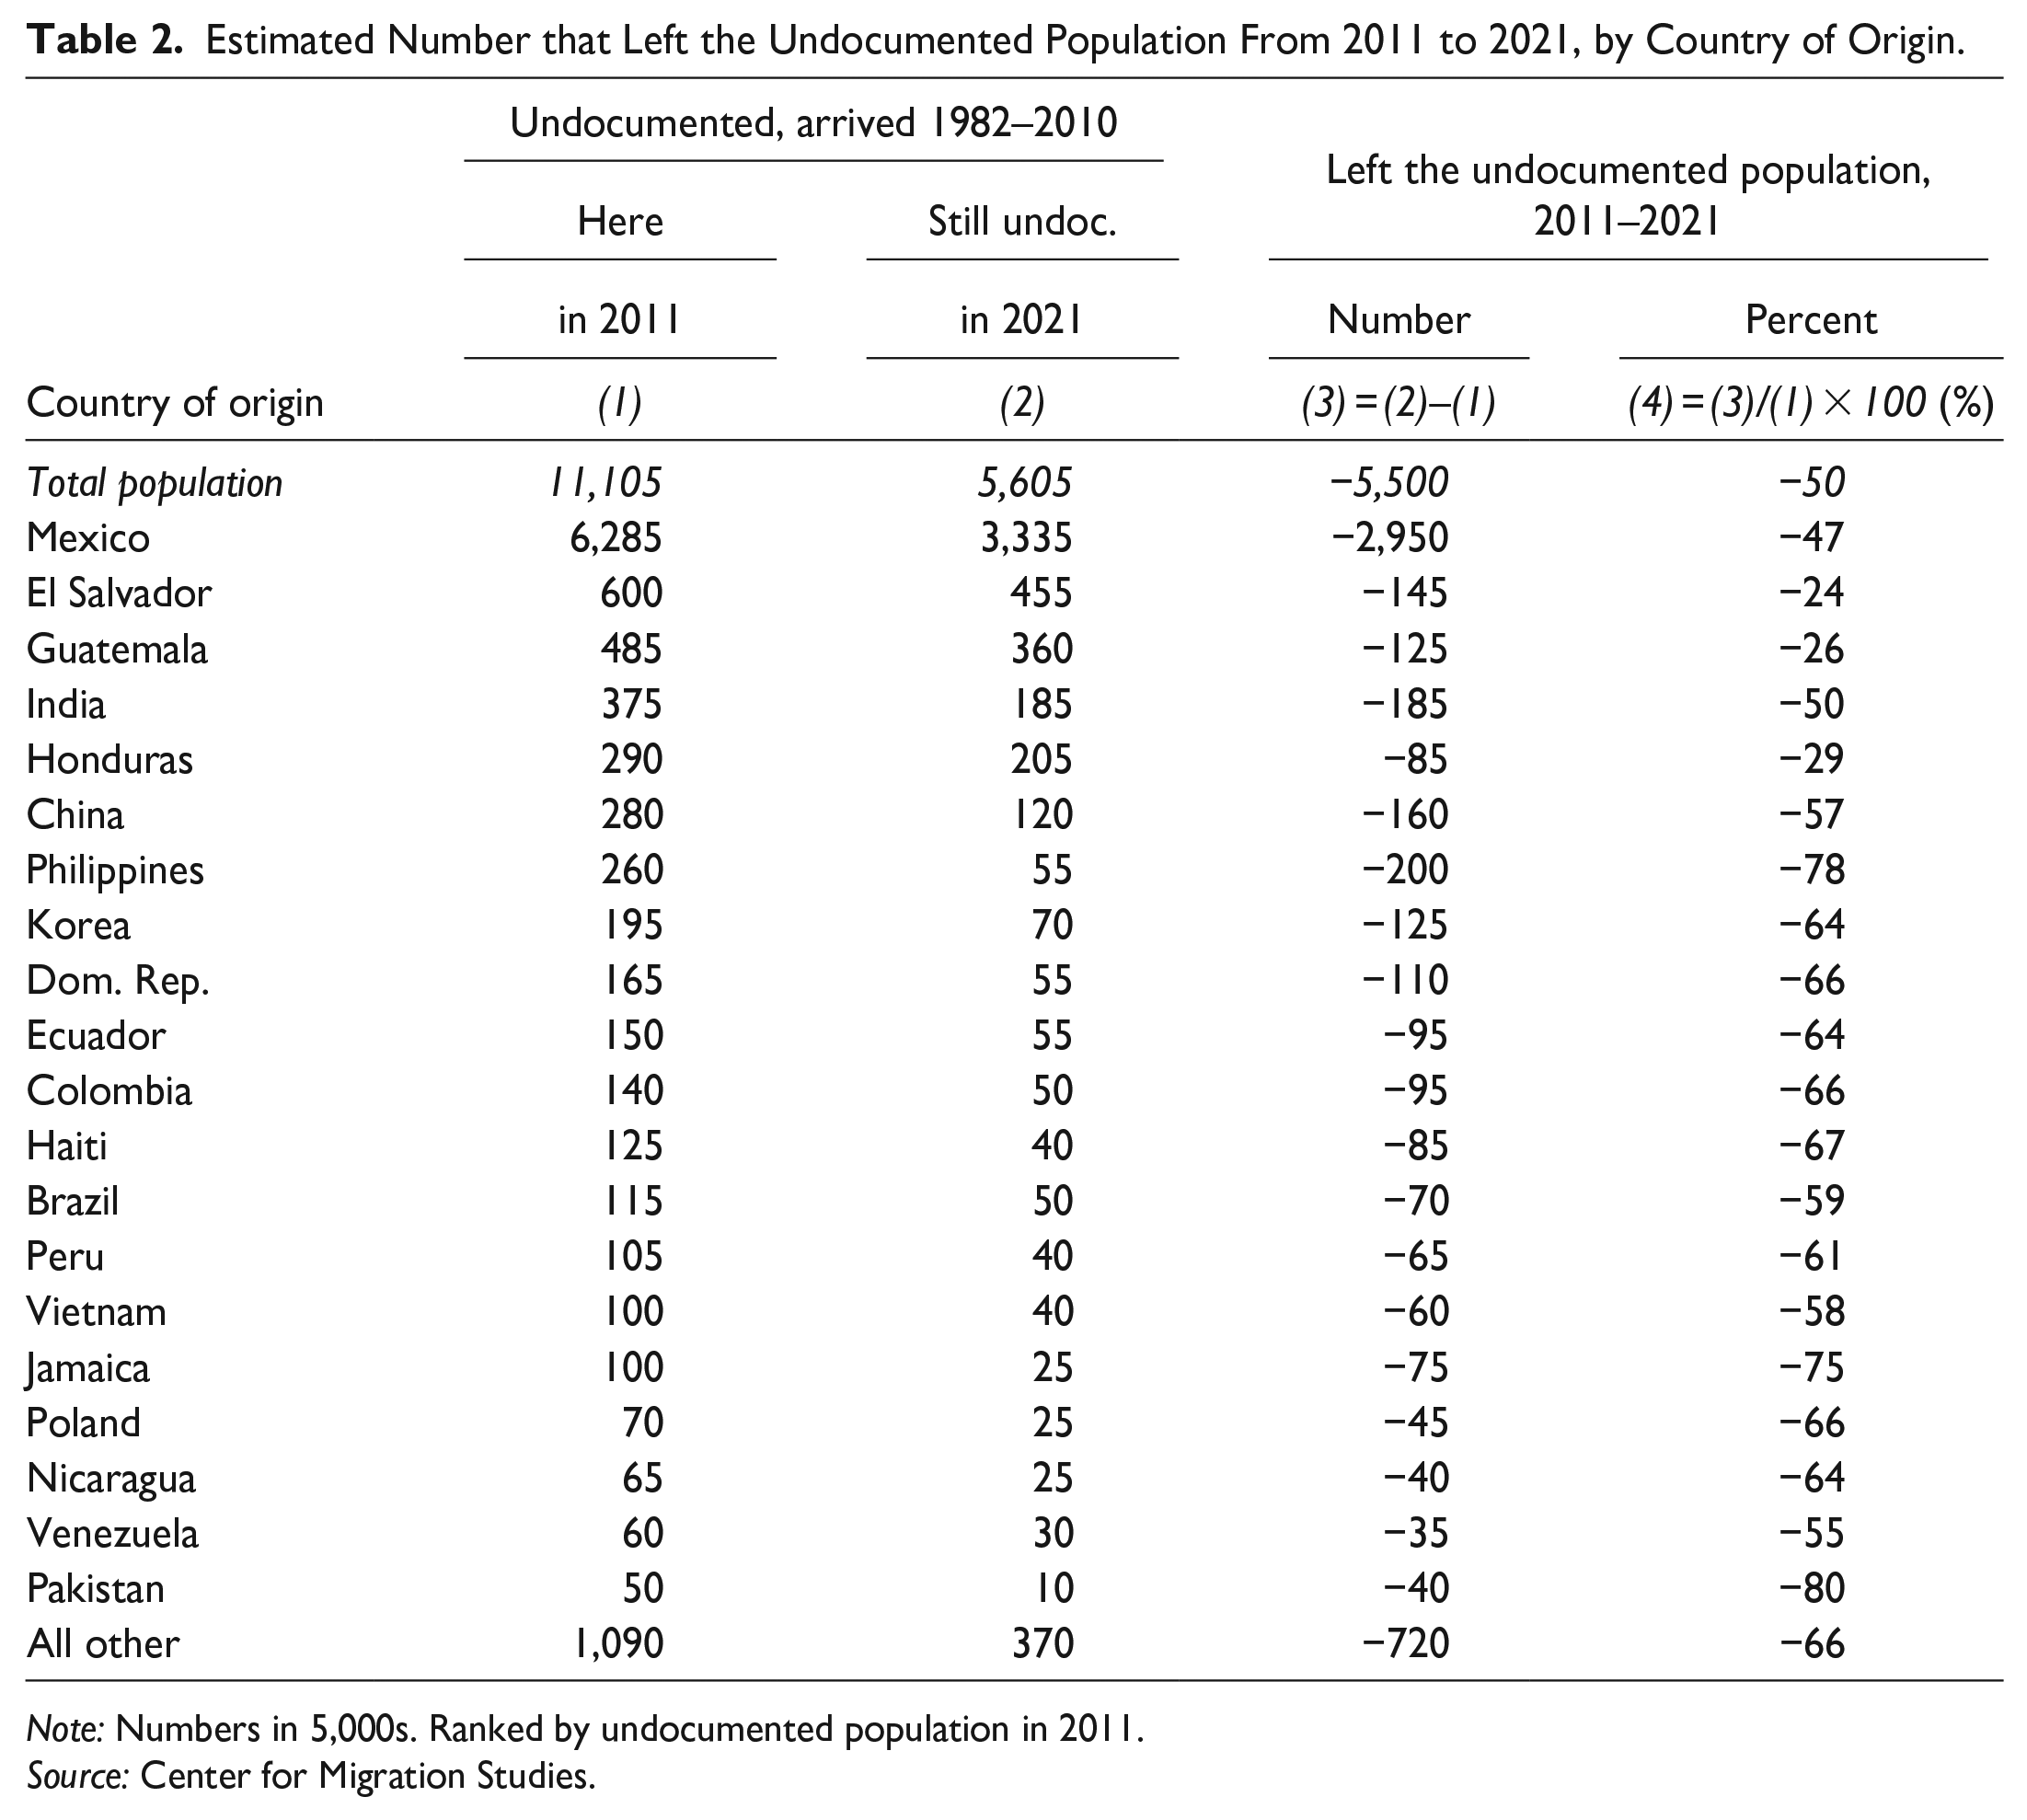
Note: Numbers in 5,000s. Ranked by undocumented population in 2011.
Source: Center for Migration Studies.
It might be surprising that almost half (47 percent) of the undocumented population from Mexico that resided here in 2011 were no longer undocumented 10 years later (Table 2). However, the departure rate of 47 percent for Mexico is low compared to the rates for most of the other sending countries shown in Table 2. Only El Salvador (24 percent), Guatemala (26 percent), and Honduras (29 percent) have lower rates of departure from the undocumented population (Table 2, column 4). Sixteen of the countries shown in Table 2 have 10-year departure rates higher than the rate for Mexico.
Of the 20 countries shown in Table 2, the percentages that left the undocumented population from 2011 to 2021 are lowest for El Salvador, Guatemala, Honduras, and Mexico. Part of the reason the departure rates are lowest for these countries is that large percentages of undocumented immigrants from those countries arrived illegally across the border compared to other countries. Most undocumented residents from other countries arrive legally and overstay temporary visas. Because they arrived illegally, a higher percentage of migrants from Mexico and Central America are unable to adjust to LPR status. Undocumented residents who arrive by air and overstay a temporary visa are allowed to adjust to LPR status much more easily than those that arrived without inspection across the border.
Decline in the Undocumented Population From Mexico, by State, 2011–2021
The drop in the undocumented population from Mexico from 2011 to 2021 occurred nationwide, and the decline affected the undocumented population in nearly every state. Table 3 shows estimates of the undocumented population from Mexico in 2011 and 2021 for the top 15 states of residence. Percent decline for the decade was generally in the 20–40 percent range, with New York (−44 percent) and Georgia (−40 percent) declining the most, and Texas (−19 percent) and Washington (−21 percent) declining the least.
Estimated Change in the Undocumented Population from Mexico From 2011 to 2021 for the Top 15 States a of Residence.
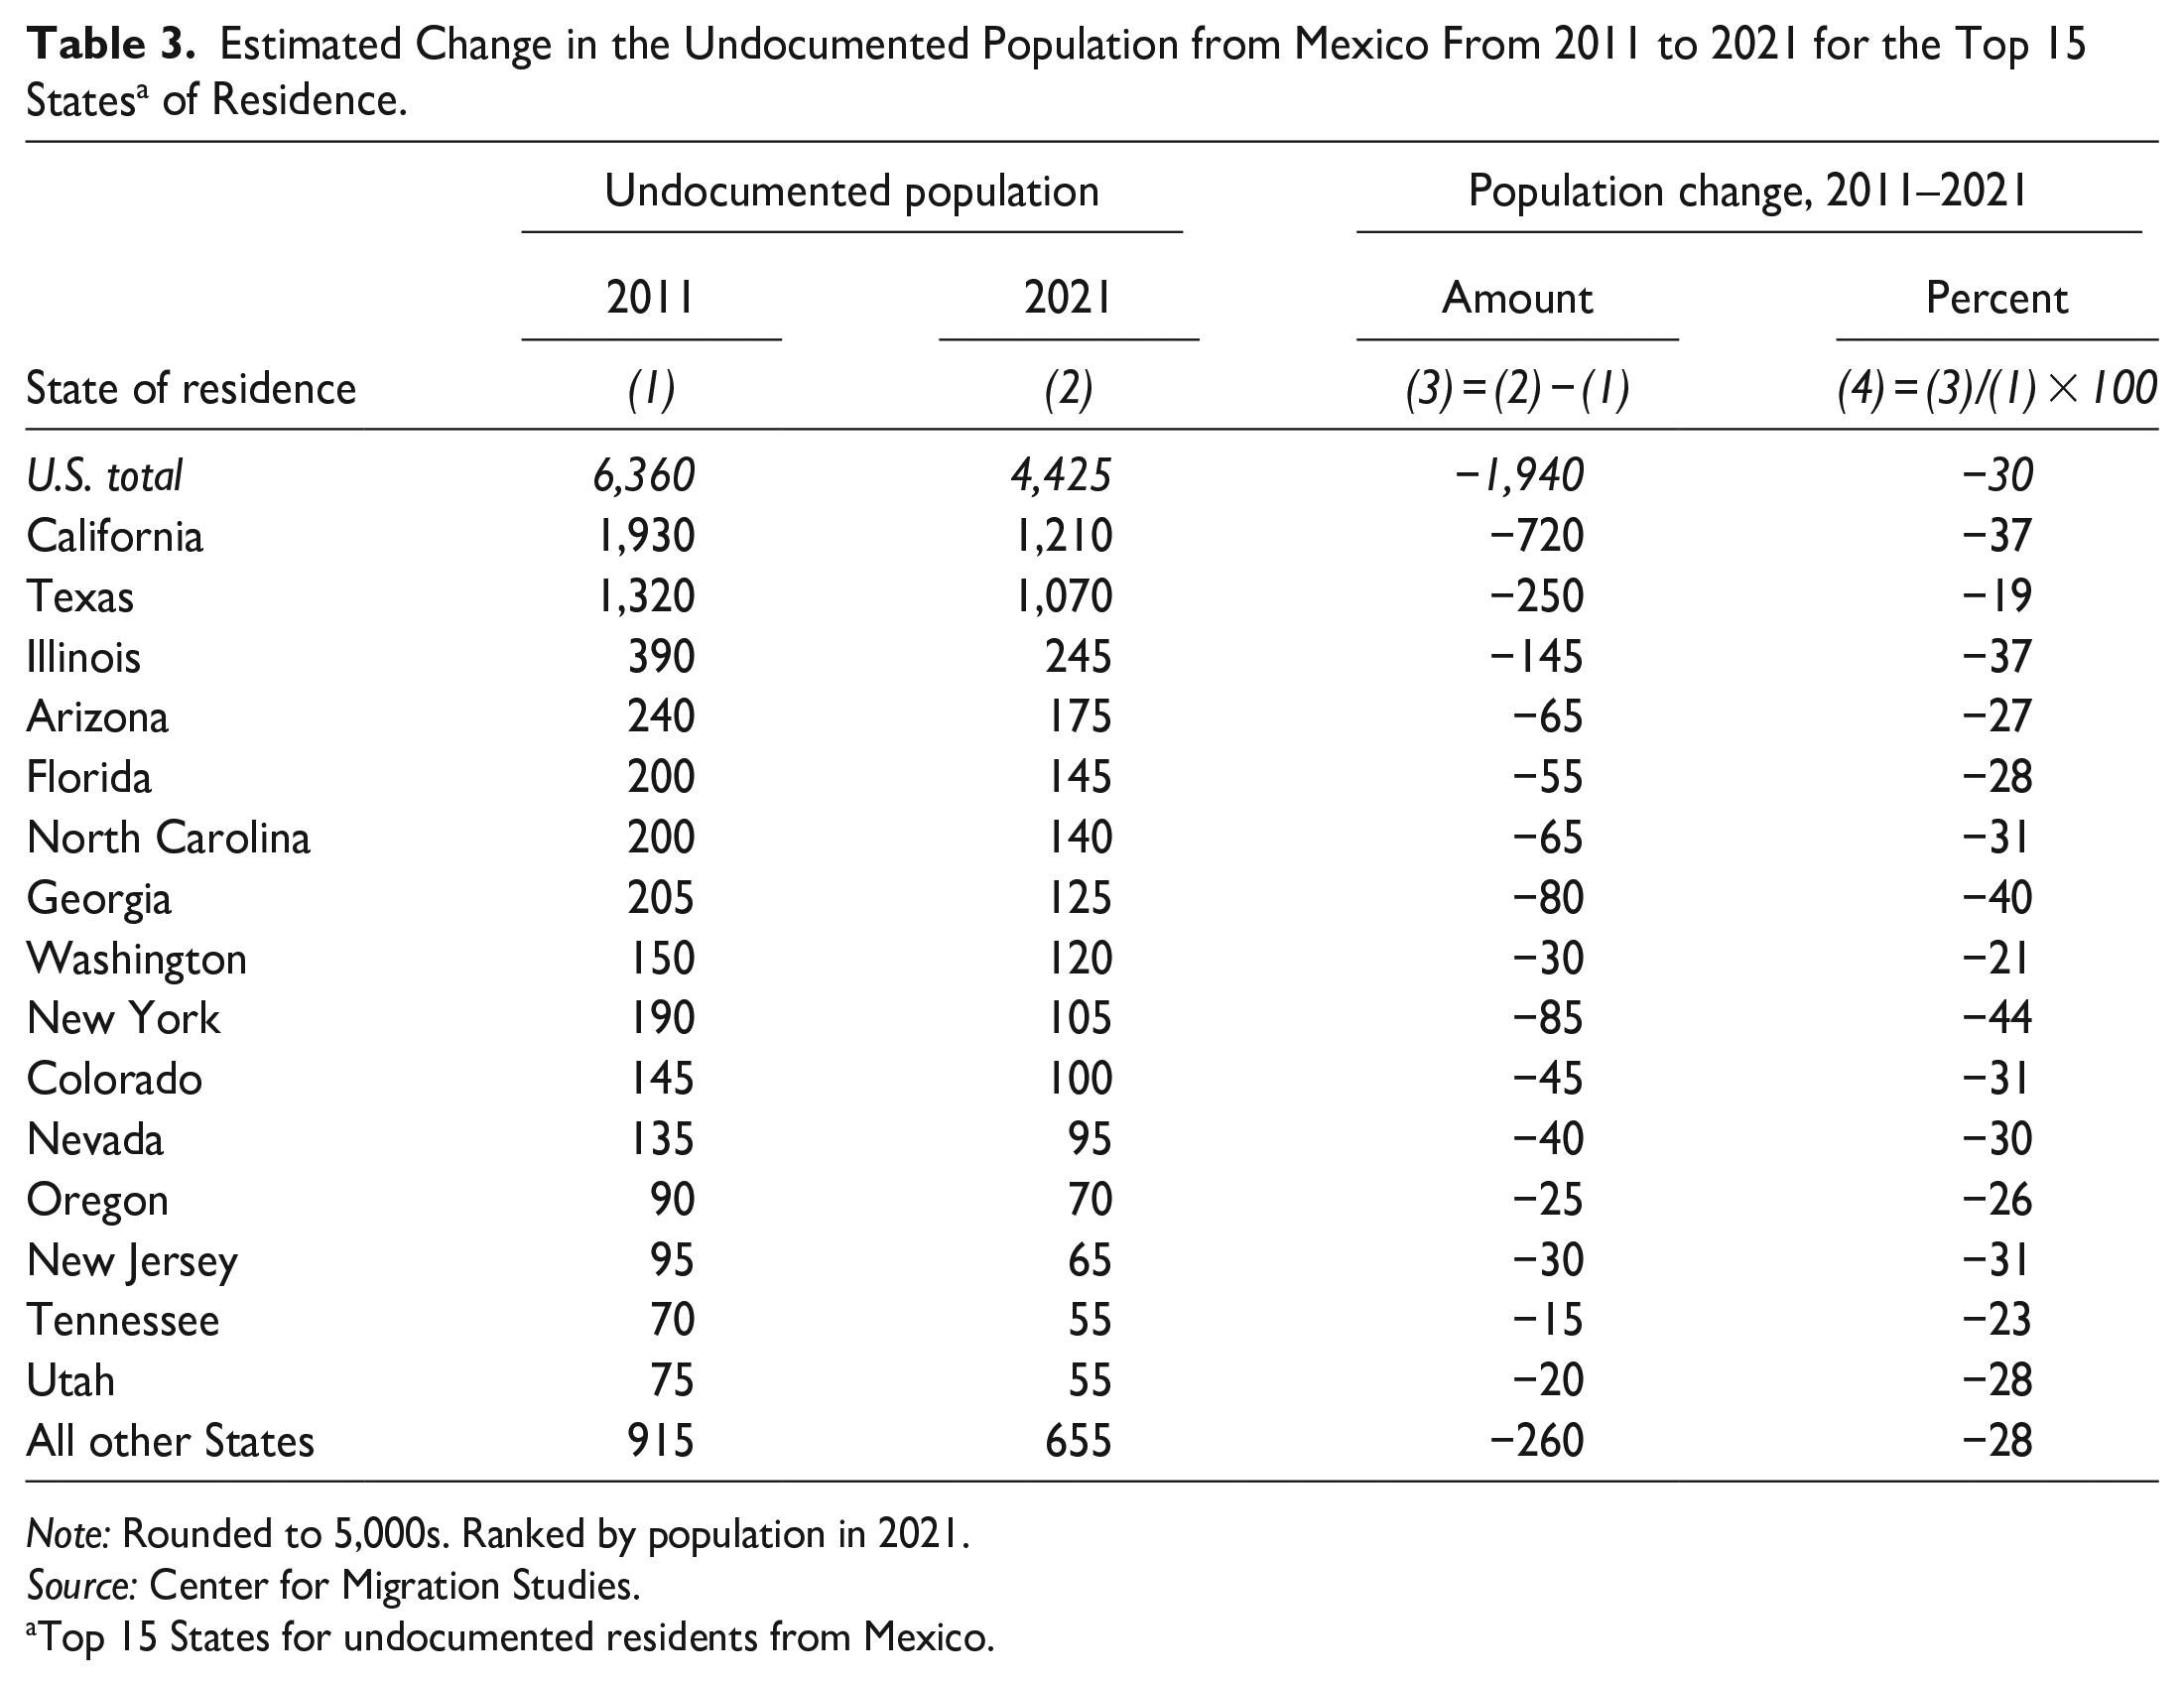
Note: Rounded to 5,000s. Ranked by population in 2021.
Source: Center for Migration Studies.
Top 15 States for undocumented residents from Mexico.
Change in the Total Undocumented Population, by State, 2011–2021
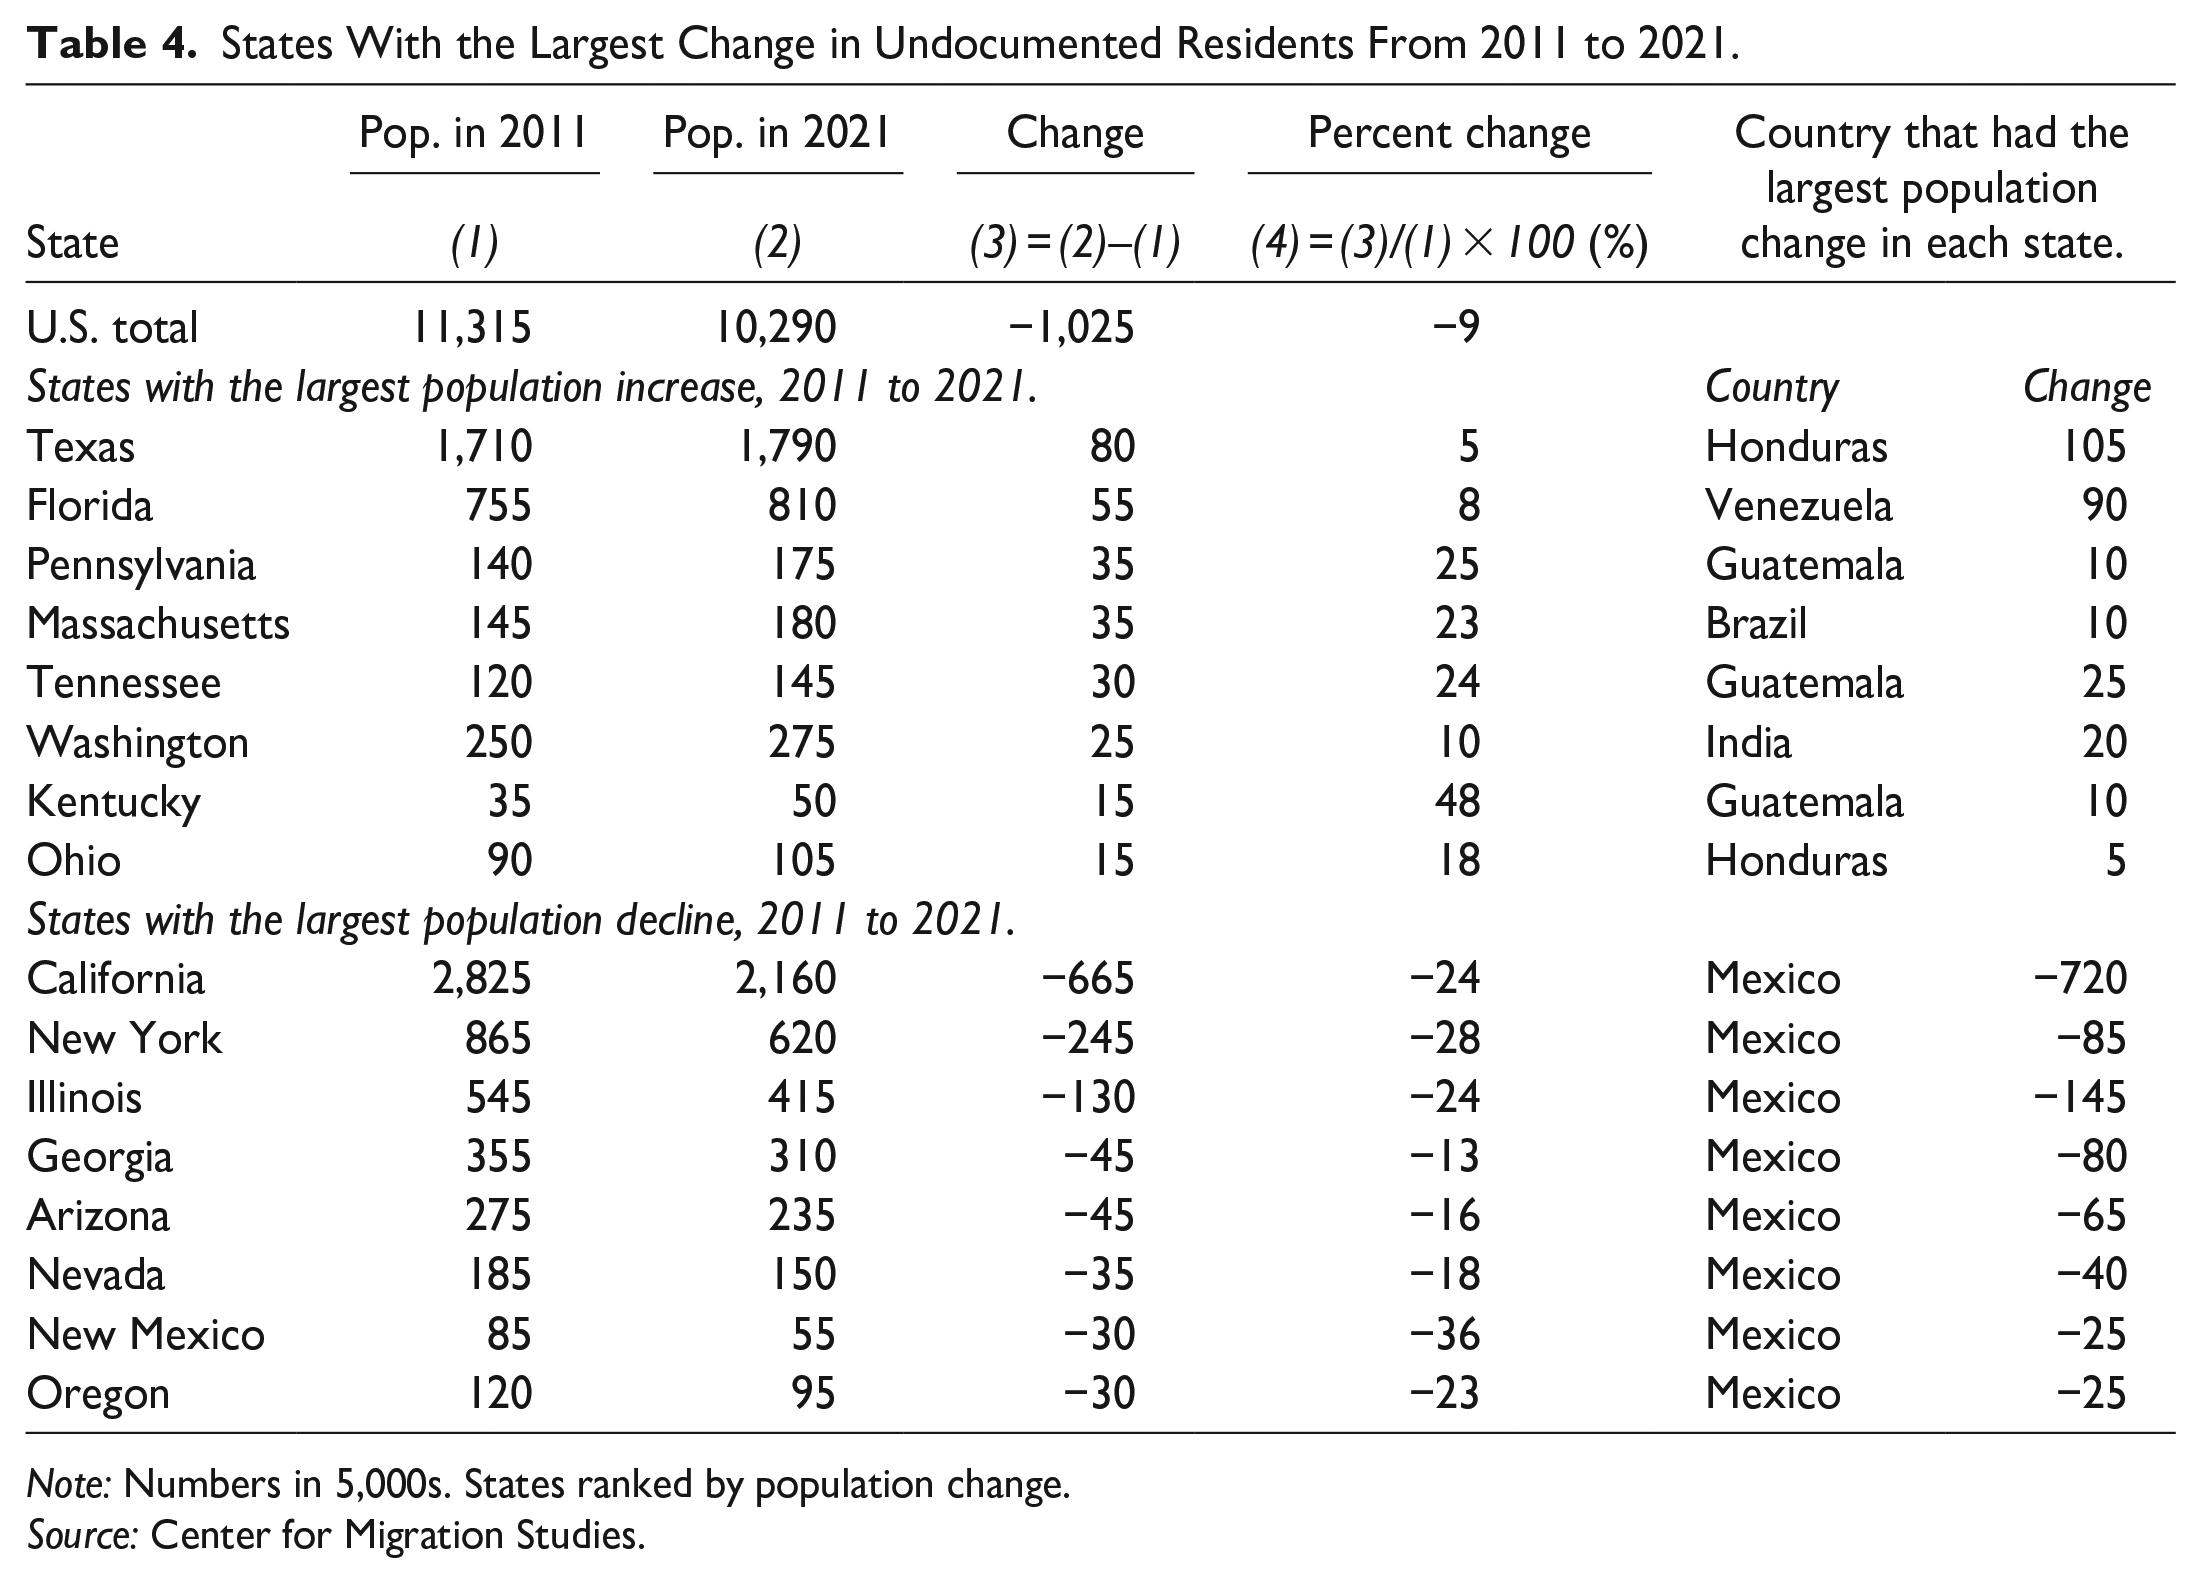
Geographic preferences, migration patterns, and economic opportunities within the United States determine whether States gain or lose undocumented population from year to year. Table 4 shows estimated change in the undocumented population from 2011 to 2021 for the eight states that gained the most undocumented population and the eight states that lost the most population. The table also shows the country of origin that had the largest effect on population change in each state.
States With the Largest Change in Undocumented Residents From 2011 to 2021.
Note: Numbers in 5,000s. States ranked by population change.
Source: Center for Migration Studies.
Texas and Florida had the largest increases in undocumented residents from 2011 to 2021. The increase for Texas was led by an increase of 105,000 undocumented residents from Honduras. Venezuela was the leading contributor to population growth in Florida. The increases in the undocumented populations in Texas and Florida are not surprising. However, the list of states that had the largest increases in undocumented populations from 2011 to 2021 includes states that are rarely mentioned in estimates of undocumented immigrants — Pennsylvania, Massachusetts, Tennessee, Kentucky, and Ohio (Table 4).
The decline in the population from Mexico was the largest contributor to population loss for all the eight states listed in the second panel of Table 4. A variety of countries — Guatemala, Honduras, India, Brazil, and Venezuela — had the largest population growth in the eight states that increased the most (Table 4).
California had the largest decline in undocumented residents, 665,000, from 2011 to 2021. The undocumented population from Mexico living in California declined even more, 720,000 (Table 4). The undocumented population in California, New York, and Illinois combined fell more than one million from 2021 to 2011.
Change in the Undocumented Population, by Country of Origin, 2011–2021
Figure 4 shows the six countries with the largest increases in US undocumented residents from 2011 to 2021. The combined undocumented populations of these six countries increased from 2.0 million in 2011 to 3.2 million in 2021 (Figure 4).
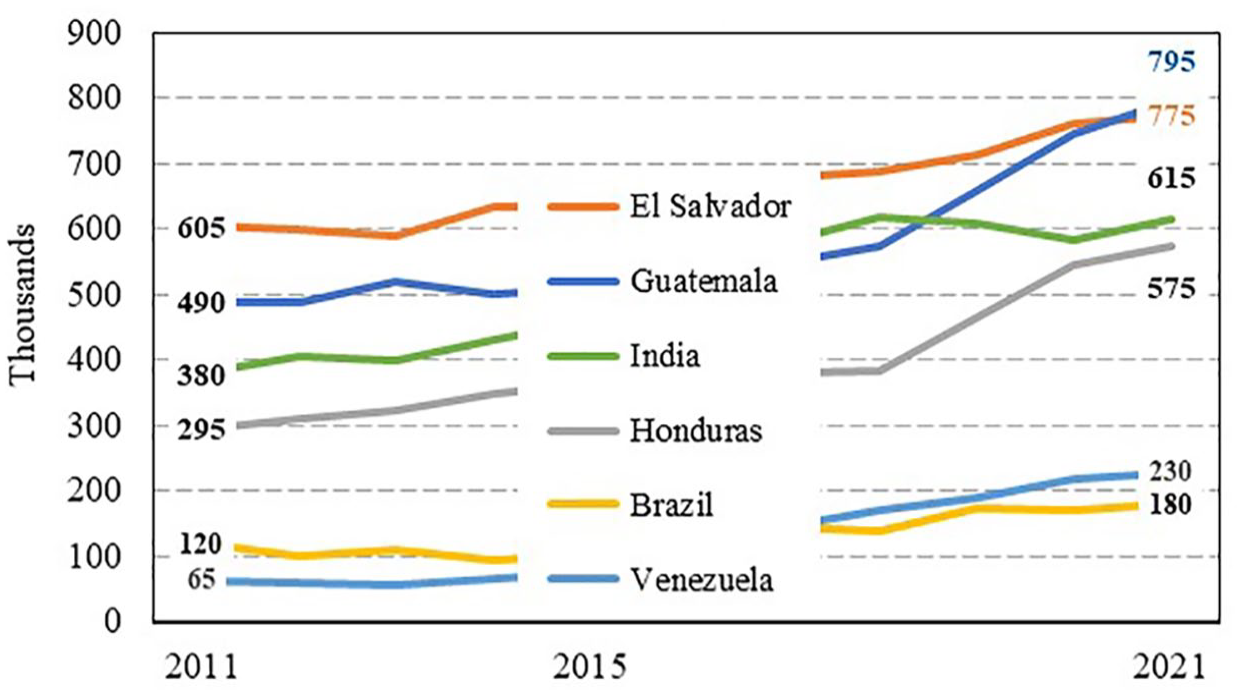
Countries with the largest undocumented population increase, 2011 to 2021.
The countries with the largest increases in US undocumented residents in the past 10 years were Guatemala, Honduras, India, El Salvador, Venezuela, and Brazil (Figure 4). Combined, these six countries grew by 1.2 million from 2011 to 2021. A country that has been a relatively large contributor to undocumented population growth — China — is not included in Figure 4. The undocumented population from China increased from 285,000 in 2011 to 385,000 in 2015. After that, the population declined steadily, falling to 340,000 in 2021.
Figure 5 shows the countries whose US undocumented populations declined the most from the 2011 to 2021 (with the notable exception of Mexico, as described). The population from Philippines and Korea combined dropped from 470,000 in 2011 to 280,000 in 2021, a decrease of about 190,000, or 40 percent (Figure 5). The undocumented population from Poland continued its steady decline, falling by more than half, from about 75,000 in 2011 to 35,000 in 2021.
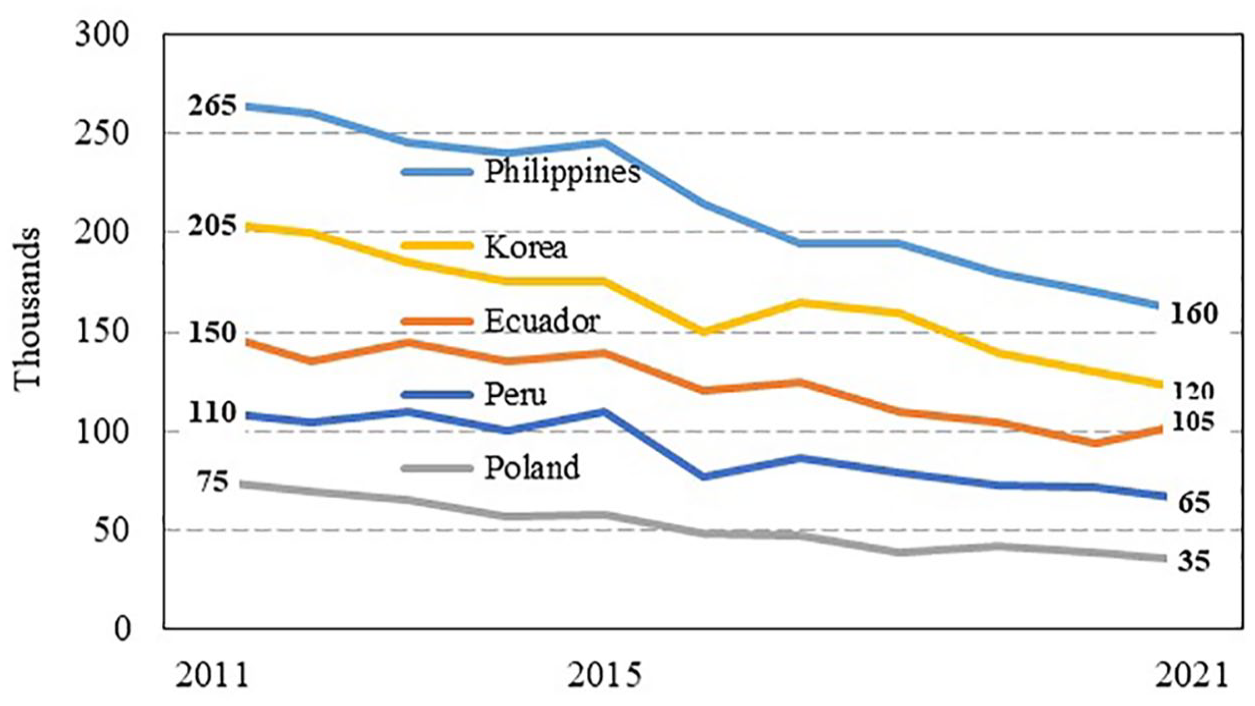
Five countries that had declining undocumented population from 2011 to 2021.
For each of the five countries shown in Figure 5, considerably more undocumented residents left the population than arrived from 2011 to 2021. The estimated numbers and percentages that left the populations of these countries are shown in Table 2, columns 3 and 4. The population of the five countries declined by a total of 320,000 from 2011 to 2021. In each case, at least 60 percent of the undocumented population in the United States in 2011 had left the undocumented population by 2021.
Methodology
The estimates presented in this paper were derived by the Center for Migration Studies based on information on country of birth, citizenship, and year of immigration collected in the American Community Survey (ACS) (Ruggles et al., 2022). The estimates are derived by analyzing detailed statistics in the ACS for the noncitizen population that arrived after 1981, as summarized in the Appendix of Warren (2021). The CMS estimation procedure produces detailed data that can be tabulated for each variable included in the ACS.
The estimates are subject to sampling variation as well as errors in the data used to compile the estimates. Estimates of the undocumented population counted in the ACS have been adjusted for undercount as described in Warren (2014).
Conclusion
This report provides detailed information about the nearly two million decline in the undocumented population from Mexico from 2011 to 2021. The decline accelerated after 2014 primarily because voluntary emigration from the population increased during the period. A new demographic technique for evaluating change in undocumented populations, described in the Appendix, provides sound demographic support for the finding.
The detailed analysis of changes in the undocumented population from 2011 to 2021 yields crucial information that should lead policymakers, the public, and the media to reconsider their concepts of undocumented immigration. For example, the data presented here show that the total undocumented population from Mexico dropped by 1.9 million from 2011 to 2021. In the same period, there were roughly twice as many apprehensions of Mexican migrants by US immigration officials (DHS 2023, Table 34). Once again, this illustrates that there is not necessarily a link between the number of apprehensions and undocumented population growth.
A major finding of this report is that a high percentage of undocumented immigrants leave the population within 10 years. For Mexico, almost half (47 percent) of the population that lived here in 2011 were no longer undocumented in 2021. In that 10-year period, a total of about three million left voluntarily, adjusted to legal status, were removed by DHS, or died. The 10-year attrition rate was relatively low (about 25 percent) for El Salvador, Guatemala, and Honduras, partly because conditions are less favorable for a return to those countries and because most of the migrants from those countries arrived illegally across the border. It is much more difficult to adjust status to legal residence for migrants that arrive illegally across the border compared to those who arrive with temporary visas and overstay. For the rest of the countries shown in Table 2, between a half and three quarters of the 2011 population were no longer undocumented in 2021.
The report that three million left the undocumented population from Mexico from 2011 to 2021 is pertinent to current discussions of undocumented migration. Voluntary emigration accounts for the largest number of departures from the population. As Kerwin and Warren (2022) reported, “the reality of emigration continues to be missing from public discourse on migration and policymaking. The nearly complete lack of knowledge about emigration contributes to a siege mentality that makes it harder to build consensus for needed reforms. It lends credence to the false ideas that the nation is ‘being overwhelmed’ or has an ‘open border’ policy.”
Footnotes
Appendix
The data shown in this Appendix provides strong empirical support for the decline of 1.9 million in the undocumented population from Mexico between 2011 and 2021. The estimates described here are independent of the methodology that CMS and other organizations use to estimate undocumented populations. Table A1 shows the components of population change of the legal noncitizen population from Mexico for 2011 to 2021 and an independent estimate of the undocumented population from Mexico in 2021.
The estimation procedures and data in Table A1 show that the undocumented population from Mexico counted in the ACS declined by 1,674,000 (Row 12 minus row 2) from 2011 to 2021. An additional decline occurred from 2011 to 2021 because undercount of the undocumented population from Mexico was 224,000 lower in 2021 than it was 10 years earlier. The latter change occurred because of changes in the distribution by year of entry of the undocumented population from Mexico. 8 Those two factors combined to reduce the total undocumented population from Mexico by 1.9 million from 2011 to 2021.
Declaration of Conflicting Interests
The author declared no potential conflicts of interest with respect to the research, authorship, and/or publication of this article.
Funding
The author received no financial support for the research, authorship, and/or publication of this article.
1
2
The number of deaths to this population is small compared to other populations because a large proportion of the population is in the 18 to 64 age range, which has relatively low mortality rates, and the annual number of deaths would not change very much over the period. Removals of non-US citizens to Mexico by DHS remained steady during the 2011 to 2020 period. The small changes that occurred in the number of removals would not affect the trend line in  . Adjustments to legal status remained constant from 2011 through 2019 and then declined somewhat because of the effects of COVID-19.
3
A decline in the number of arrivals, if it occurred, could also have caused a decline in the undocumented population after 2014. This is not a plausible explanation for the decline reported here because the annual number of undocumented arrivals from Mexico (Warren 2021, ) was steady, remaining in the 125,000 to 155,000 range, throughout the decade.
4
5
Higher rates of departure among those who had lived in the United States the longest could be the result of increased mortality as the population aged and because longer-term residents have had more time to adjust to legal status.
6
The figure of 75,000 shown in row 8, column 1, is a small number because it includes only the segment of the 2011 undocumented population that arrived in 2011.
7
The figure of 1.0 million is referred to as net increase because undocumented immigrants that arrived and left between 2011 and 2021 would not be included in the calculations. For example, an undocumented immigrant that arrived in 2013 and left in 2018 would not be included as an arrival or a departure in the estimate of 1.0 million net arrivals shown in column 3, row 8. Estimates shown in Warren (2021), , indicate that 1.3 million undocumented residents arrived from Mexico from 2010 to 2019.
8
Undercount adjustments are based on number of years lived in the United States, with the highest adjustments being applied to the most recent arrivals. Because the population from Mexico has been declining, relatively fewer residents were new arrivals in 2021 than in 2011; therefore, undercount for the total population declined by 224,000 over the 10-year period.
9
The term “census-level” refers to census or survey data that have not been adjusted for undercount.