
Abstract
Studies of social stratification and factors that contribute to inequalities by indices such as race, ethnicity, and gender are core contributions sociologists make to the discipline and to general discourse. The measurement and construction of such indices play a crucial role in the understanding or misunderstanding of inequalities in society. Focusing on within-group heterogeneity of persons of Hispanic origin, the authors examined the percentage of incarceration to demonstrate the varied understandings that arise from the changing definitions and categorizations of racial and ethnic groups in the United States. As social scientists, we often ask the general question of if and how racial and ethnic categorizations affect a specific area; however, we tend to pay less attention to how the exclusion of incarcerated persons from many of the national surveys that inform our areas of study affects the knowledge we produce. This is particularly important because the U.S. incarcerated population consists mostly of persons from marginalized groups. Not taking incarcerated populations into account paints a misleading picture of the United States regarding racial and ethnic inequalities. It is imperative that we recognize the implications of using race and ethnicity in studies such that our findings do not contribute to inaccurate representations of society.
W. E. B. Du Bois stated that the problem of the twentieth century would be the color line; yet as we move into the twenty-first century, the United States continues to grapple with issues surrounding the color line. As articulated by Du Bois in his July 1900 speech at the First Pan-African Conference in London, the color-line construct speaks directly to the question as to how far differences of race, which show themselves chiefly in the color of the skin and the texture of hair, are going to be made, hereafter, the basis of denying to over half the world the right of sharing in their utmost ability the opportunities and privileges of modern civilization. (Walters 1917:257–58)
The color line, however, has become much more complex than the one dividing blacks and whites that Du Bois spoke about in The Souls of Black Folk (Du Bois 1903:8). There exists not merely one line but several lines surrounding the construction of race. A major reason for this growing diversity in the construction of race is the increase in the number of different immigrant groups entering the United States from around the world. The incorporation of immigrants from Africa, Asia, Central America, Europe, and South America challenges previous characterizations of racial and ethnic identity in the United States as simply a black and white issue. More than a decade ago, Bonilla-Silva (2004) described the color line in the United States as undergoing a process of Latin Americanization, whereby the line better resembled a spectrum with whites at one end, blacks at the other, and all other groups falling somewhere in the middle. More recent research using census data to map residential segregation has demonstrated that the color line in an increasingly multiracial United States is “shifting” (Parisi, Lichter, and Taquino 2011).
The increasing heterogeneity in the U.S. population stemming from immigration is also shifting much of the sociological discourse surrounding racial identity formation in the United States (Campbell and Rogalin 2006; Denton and Massey 1989; Flores and Román 2009; Frank, Akresh, and Lu 2010; Lee and Bean 2007; Nicholson, Pantoja, and Sequra 2005). The insertion of ethnicity (e.g. Hispanic vs. non-Hispanic) into survey questions measuring race further complicates the conversation surrounding racial categories. Ethnic groups are often characterized as groups of people thought to have common cultural traits such as language, nativity, history, traditions, and values that distinguish them from other groups (Ford and Harawa 2010; Griffith et al. 2011; Howard 2000; Smedley and Smedley 2005). When ethnicity is not considered in racial discourse, outcomes have the potential to create a very different account of the nation’s past, present, and future.
The issues surrounding the conceptualization and classification of race and ethnicity in the United States have real ramifications for the collection, quality, and consistency of data used in social science research. Often, data collection tools fail to inquire about ethnicity, resulting in an overreliance on racial data. As such, an important question raised by this article is: how do categorizations of race and ethnicity affect understandings of social inequalities? To illustrate how different categorizations of race and ethnicity alter the findings between and within groupings, we pair our examination with a subject Du Bois had much to say about: incarceration.
Although Du Bois clearly stated that the color line was the issue of the twentieth century, he also wrote about another set of institutions he found problematic: the convict-lease system and the crop-lien system (Du Bois 1901). Both institutions were established after slavery and were based on criminalizing blacks, sentencing them to prison, and then leasing the prisoners to work on the same plantations (and other work spaces) from which the Emancipation Proclamation had released them. The concerns raised by Du Bois have come to pass, and several recent scholars studying mass incarceration seek to include a historical narrative of incarceration, establishing the lineage of incarceration to its parent, slavery (e.g. Alexander 2010; Blackmon 2009; Wacquant 2010).
Beyond its lineage, the importance of understanding incarceration has become imperative in sociology because the United States has such a high level of incarceration that disproportionately affects certain groups. Because persons behind bars are not included in many national surveys, many areas of sociological study are vulnerable to distorted understandings (Pettit 2012). Such distortions exacerbate the issues attached to the lack of data collected on ethnicity and the lack of social meaning attached to the United States’ limited ethnic groupings of Hispanic and non-Hispanic. Before proceeding, we briefly review the extant literature regarding racial and ethnic classifications. We pay particular attention to how broad racial categories have affected the way sociologists conduct research and the consequences that research has for particular outcomes such as incarceration. In addition, we focus on those who identify as Hispanic and review literature speaking to the heterogeneity within this group. The final part of our review addresses the tenuous relationship among race, crime, and incarceration. After reviewing the aforementioned literature, we calculate and compare the proportion of people in prisons, incorporating measures that also address the differences in racial and ethnic composition of the United States. This allows us to illuminate the unique information different racial and ethnic classifications communicate.
Background
Racial Construction and Its Consequences
Within the field of sociology, the theoretical debate over whether race is a fixed or fluid concept has greatly evolved. According to the American Sociological Association’s [ASA] (2003) statement The Importance of Collecting Data and Doing Scientific Research on Race, sociologists have a long history of examining race and how the concept has been used to categorize people. Early conceptualizations of race were based primarily on biological explanations originating from the eugenics movement (Saperstein 2006; Zuberi 2001). Today, race as biology is largely invalidated and understood as a social construct that changes over time. As the Human Genome Project affirmed, race tells us more about people’s social arrangements than their biology (McCann-Mortimer, Augoustinos, and LeCouteur 2004). As dynamic social concepts, race and racial categorizations in the United States change with changing economic, political, and historical contexts (ASA 2003; Lee 2001; Morning 2014; Omi and Winant 1994; Saperstein 2006; Zuberi 2001). Although many social scientists recognize that race is not “real,” they readily acknowledge that race as a social construction has real consequences for people’s life chances across a wide range of social and economic institutions (ASA 2003; Smedley and Smedley 2005; Smedley 2012; Zuberi 2001). Given the consequences the lived experience of race has for important outcomes such as incarceration, scholars have advocated continued examination and measurement of differential experiences, treatment, and outcomes across racial categories as a necessary line of research to track disparities and inform work toward achieving greater social equity (ASA 2003).
In their efforts to bring racial and ethnic inequalities in social institutions to light, sociological researchers have been attuned to racial and ethnic classifications, especially categorizations appearing in U.S. censuses and other social surveys derived from these censuses. Since the late 1800s, social scientists have used census data and social surveys collected by the U.S. Census Bureau to examine research questions around race, ethnicity, and a diverse array of outcomes. The census is unique in that it provides the longest running consecutive compilations of data on racial classification in the Americas (Zuberi 2001:101). The census’s classification of race and ethnicity has shaped and has been shaped by the social reality of race in the U.S. Yet, no two decennial censuses have had the same classification for race and ethnicity.
Hispanic Ethnic Heterogeneity
Although we recognize that diversity exists within all ethnic and racial categories, we focus on Hispanics because as the nation’s largest ethnic minority, their identification patterns have had a major influence on how the United States categorizes people into different racial and ethnic groups (Campbell and Rogalin 2006; Hitlin, Brown, and Elder 2007; Lee and Bean 2007; Itzigsohn, Giorguli, and Vazquez 2005). Furthermore, Hispanics historically and currently remain marginalized and negatively affected by racial and ethnic disparities. Unlike their white European counterparts and like their black counterparts, Hispanic immigrants have not fully assimilated into the social and economic echelons of American life and bear the brunt of social inequalities as a result (Zuberi 2001).
Similar to the U.S. black population, Hispanics are typically characterized as a homogeneous group in academic scholarship. The term Hispanic was not introduced in U.S. government enumeration policy until 1970, when the Office of Management and Budget dropped the language of “Spanish heritage” and sought a more culturally indicative term. The original operationalization of Hispanic referred to “a person of Mexican, Puerto Rican, Cuban, Central or South America or other Spanish culture or origin, regardless of race” (Hayes-Bautista and Chapa 1987:64). Since the 1970s, the term Hispanic has shifted and molded according to the prevailing political, economic, and social mores (Choldin 1986). For almost the entirety of the twentieth century, the vast majority of Hispanics living in the United States were Mexican men who were predominately in the United States as agricultural laborers (Massey 1988).
Today, the term Hispanic is used to denote individuals of Latin American origin, including Mexicans, Mexican Americans, Puerto Ricans, Cubans, and Central and South Americans (Jones-Correa and Leal 1996). The prevailing misconception holds that all Hispanics share similar experiences in areas such as assimilation, health, linguistic capabilities, political involvement, and gender norms (Donato 2010; Jones-Correa and Leal 1996). Because Mexico has consistently ranked as the number one source of immigrants to the United States, common stereotypes have often characterized all Hispanics, regardless of their countries of origin or legal status, as Mexican, and often as unauthorized (Hayes-Bautista and Chapa 1987; Jiménez 2008). However, the differences between groups from various Latin American countries of origin are incontrovertibly and vastly distinct. Furthermore, the treatment of the Hispanic population as a homogeneous group fails to acknowledge the very distinct experiences of authorized versus unauthorized individuals.
Racial Heterogeneity among Hispanics
Even more complex than the heterogeneity within the Hispanic population is how the diverse individuals under this category identify racially and how they are perceived racially by others. Because the United States classifies “Hispanic” as an ethnicity, people of Hispanic origin have the option to select at least one of the limited race options or not select any and opt for the “Other” category. When those who select “Other” are probed to elaborate further, Hispanics typically provide a national origin or panethnic descriptor (Landale and Oropesa 2002). That the question regarding Hispanic origin is separated from the race question on the U.S. census and other federally influenced surveys implies that being Hispanic is somehow fundamentally different from being white, black, Asian, or Native American (Hitlin et al. 2007). And although this separation of race and ethnicity may be theoretically and analytically meaningful for researchers, scholars find a blurring of race and ethnicity in the lived experiences of Hispanics (Campbell and Rogalin 2006; Hitlin et al. 2007; Landale and Oropesa 2002). In other words, one reason race is so complex among Hispanics is that a significant proportion of Hispanic Americans insist that they are a racial category unto themselves (Nicholson et al. 2005); and indeed, “Hispanic” has assumed a social position almost equivalent to that of the major racial categories in the United States (Campbell and Rogalin 2006). At the same time, there is fluidity in how Hispanics identify racially that does not necessarily depend on skin color or other phenotypic features such as hair texture and facial features. In the Latin American and Caribbean contexts, wealth, class, power, geographic location, and even language proficiency also play a role in where individuals fall on the racial spectrum (Campbell and Rogalin 2006; Lee and Bean 2007; Nicholson et al. 2005).
Regardless of how Hispanics identify or are identified in their ancestral countries, that identification changes once they are embedded in the U.S. context. For example, in their comparison of racial identification among Puerto Rican migrants on the island and their offspring on the U.S. mainland, Landale and Oropesa (2002) found that islanders were more likely to identify as white, black, or trigueña, whereas mainland women were more likely to identify as Hispanic or Latina even after taking skin tone, parental ethnicity, and sociodemographic factors into account. Furthermore, in their study of immigrant incorporation and racial identity among Dominican immigrants in the United States, Itzigsohn et al. (2005) found that Dominicans rejected the black label and sought to identify as indio/a, a familiar category used in the Dominican Republic to distinguish themselves from their “negro” neighbors in Haiti. When asked how mainstream America perceived them racially, most of the Dominican respondents answered “black” (Itzigsohn et al. 2005).
Moreover, perceptions and observations of the discrimination, segregation, and poverty blacks face in the United States deters many Hispanics from readily self-identifying as black (Denton and Massey 1989; Lee and Bean 2007). Although not much studied, Hispanic blacks face similar social injustices as non-Hispanic blacks in the United States. For example, scholars studying the labor market have found that darker skinned Hispanics experience more discrimination and lower occupational prestige than their lighter skinned counterparts (Espino and Franz 2002; Gómez 2000). Although Hispanic blacks come from all over Latin America and the Caribbean, the majority are of Dominican ancestry, followed by Puerto Ricans (Nicholson et al. 2005). While many Hispanic blacks express a desire to distance themselves from blacks by stressing their Hispanic ethnicity, they share similar sociodemographic profiles to non-Hispanic blacks in terms of low education, income, homeownership as well as high poverty and segregation (Denton and Massey 1989; Lee and Bean 2007; Nicholson et al. 2005).
Taking their cue from Du Bois, some scholars have characterized the three-pronged social reality of being Hispanic, black, and American as “triple consciousness” (Flores and Román 2009). By delineating Hispanic blacks in our analyses, this study seeks to bring this invisible segment of the U.S. population to light. Incarceration provides an especially compelling case to examine the aforementioned issues regarding the variability in constructing race and ethnicity, because the United States has the highest incarceration rate of any nation. Furthermore, incarceration disproportionately affects young African American and Hispanic men (Beck and Karberg 2001; Harlow 2003; Wilson 1993). Before proceeding to the analyses, we weave the literatures on race and incarceration to further situate social inequalities arising from current constructions of race, ethnicity, and crime.
The Present Study: The Intersection of Race, Incarceration, and Invisibility
In this section, we address the social construction of the law and how it disproportionately affects marginalized populations in the United States. The persistent exposure of crime portrayed in images of young men of color contributes to an underlying ideology that equates some racial and ethnic groups with deviance and deviance with some racial and ethnic groups (Saperstein 2006). Furthermore, institutions such as prisons can be used to define groups, and groups also inform what an institution itself means. Because incarceration is an axis of stratification associated with negative experiences (Bonczar and Beck 1997; Pettit and Western 2004; Wakefield and Uggen 2010), researchers may be underestimating the heavy burden experienced by marginalized populations when they exclude experiences of the currently and formerly incarcerated.
Scholars continue to document the deleterious effects of incarceration on health and social and economic mobility (Binswanger et al. 2011; Bushway 2004; Patterson 2010a; Spaulding 2011; Western 2006; Wildeman 2012). For example, findings from a recent study indicate that prison is accompanied by a hidden death penalty. Specifically, Patterson (2013) found that every year served in prison removes two years from one’s life expectancy. However, because much of the data used to examine social inequalities tend to exclude the experiences of incarcerated populations, understandings of inequality are potentially flawed. Combined with the different experiences between races and within ethnic categories, the exclusion of incarcerated populations from routine social science data collection efforts poses a large challenge to fully appreciating the impact of mass incarceration.
As detailed earlier, race and ethnicity are dynamic processes and variable by time, space, and inquiry. Furthermore, the constructs used in estimation shape interpretations and ability to make inferences. In the case of mass incarceration, there is not only the social construction of race and ethnicity but also the social construction of law and the breaking of a law. Law is typically thought of as neutral, without motive or ill intent, and in place to protect citizens and maintain order within society. However, the law and the enforcement of laws disproportionately affect marginalized groups (Calavita 2010; Travis, Western, and Redburn 2014). One commonly used example is the difference in the sentencing for crack cocaine and powder cocaine possession. Although both substances are essentially the same, crack cocaine carries a much longer sentence in prison than powder cocaine. Crack cocaine costs less, and the people who use crack typically have much lower incomes than people who use powder cocaine. Nevertheless, decades passed before such disparities in use and sentencing were acknowledged, culminating in Congress passing the Fair Sentencing Act of 2010. Despite the law’s intent to reduce the disparity in the amount of crack cocaine and powder cocaine needed to trigger mandatory minimum sentences, possession of crack still carries a harsher sentence than possession of cocaine in many states (Travis et al. 2014).
Another illustration of the social construction of crime regards the neutralization or mitigation of a crime, such as the taking of another life (homicide), to a justifiable action. The act of homicide is universally considered a crime across societies that should result in some form of punishment (Barkan 2014). At the same time, a charge of homicide can be negated to something much less depending on mitigating circumstances (Dressler 2012). For example, some courts allow intoxication to negate premeditation, thereby eliminating first-degree murder as a possible charge. Self-defense due to the threat or presence of grievous bodily harm can mitigate homicide to a justified action (i.e., no longer a crime; Dressler 2012). The burden of establishing self-defense varies by state; furthermore, the acceptance of self-defense varies by the race of the deceased and the person alleging self-defense (Baumer, Messner, and Felson 2000; Lee 1996). In other words, the decision to call an incident homicide or self-defense is a complex and dynamic racialized process.
A historical look at the United States reveals a symbiotic relationship between law and persons convicted of breaking the law, where one function of law has been to subjugate certain populations (Alexander 2010; Black 1976; Gómez 2010; Haney-López 1996). African American and Hispanic men have lower rates of use of illegal substances than white men (Donziger 1996; Mauer and King 2004), yet they are disproportionately represented in prison because inequality exists at every stage of the U.S. judicial system, from policing to sentencing (Bach 2009; Calavita 2010; Travis et al. 2014). The resulting incarcerated population is more reflective of monetary resources than persons guilty of committing crimes (Beckett 1999; Beckett and Harris 2011). In the aforementioned examples of the social construction of law (drugs and homicide), human beings who are not free from motive or prejudice decide if something is deemed a crime or not a crime. The decision to accept or not accept the presence of mitigating factors is also a decision not free of the subconscious or conscious biases. As Haney-López (1996) argued, “Law is both a system of behavioral control and an ideology, and legal actors are in some senses both conscious and unwitting participants in the legal construction of race” (p. 113).
Resident status further complicates detaining and sentencing procedures. People who are not citizens can face a variety of hardships because they are not afforded the same rights as citizens (Demleitner 2009). For example, some noncitizens are sent to detention centers, whereas others are sent to jails and eventually sentenced to serve time. Persons facing deportation typically do not have legal representation; when they do, it is of questionable quality (Markowitz 2009). If noncitizens do serve time, they often are not privy to a number of rights, such as prison programming, limits on overcrowding, and credit toward the total sentence if previously held. But there is nothing that is systematic about the decisions (Demleitner 2009); in many cases, one could say that the judicial process makes noncitizens disappear (Hernandez 2008; Markowitz 2009). In sum, with respect to both sentencing and criminal court procedures, the current judicial system has structural inequalities that increase the likelihood that certain groups, in particular young men of color, will experience incarceration (Bach 2010; Kramer and Ulmer 1996; Steffensmeier and Demuth 2006; Steffensmeier, Ulmer, and Kramer 1998; Tonry 1996; Ulmer, Kurlychek, and Kramer 2007). Moreover, the punishments associated with the commission of crime reach beyond the individual to families and communities (Braman 2004; Clear 2007; Hagan and Dinovitzer 1999; Mauer 1999; Pager 2003).
Pettit (2012) began a conversation about prisoners’ being invisible, with specific focus on the gap between whites and blacks. We complicate invisibility by expanding it to include both race and ethnicity, moving beyond the white-black dichotomy and thereby illustrating how different constructions of race and ethnicity affect understandings of social phenomena. The main question driving our inquiry is: how do different constructions of race and ethnicity affect current understandings of incarceration in the United States? By considering Hispanic populations, their racial classification, and the proportion of the adult population in state and federal custody, we depict how different groups experience “justice” in the United States. Our chosen vehicle, percentage of imprisonment, is of particular importance given the reach of prisons in marginalized populations. We also examine differences when prison populations are disaggregated by type of crime as well as differences by residence in a state or federal correctional facility. As such, this article makes an important contribution in expanding the knowledge of how we misrepresent marginalized groups whose presence in prisons leads us to very different conclusions in areas such as education if they were included in national surveys of the U.S. population.
Data and Sample
We used two data sources, The 2004 Survey of Inmates in State and Federal Correctional Facilities (SISFCF) (U.S. Department of Justice 2004) and the 2004 American Community Survey (ACS) (U.S. Census Bureau 2004), for our study. The SISFCF is a representative survey of the prison population, providing detailed information on the lives of current inmates, the lives they led prior to their current incarceration, and the lives of persons affected by their crimes. The survey has contributed to the production of significant scholarship regarding the U.S. state and federal correctional populations (e.g., Krivo, Peterson, and Kuhl 2009; Patterson 2010a; Pettit and Western 2004; Sykes and Pettit 2014; Wakefield and Wildeman 2014; Western 2006) and has proved consistent after undergoing various tests of data quality (Patterson 2010b). Although more recent data would be informative about the current pervasiveness of imprisonment between racial and ethnic groups, such data are not available. Furthermore, the present study’s focus is on how different categorizations of race and ethnicity have the potential to change understandings of social phenomena like incarceration.
The U.S. Census Bureau gathered the 2004 SISFCF for the Bureau of Justice Statistics from October 2003 to May 2004. The survey uses a two-stage stratified random sampling design. Prisons are sampled in the first stage, and inmates, stratified by gender, are sampled in the second stage. In our analysis, we also include variables pertaining to education, ethnicity, age, citizenship, and race. With respect to the overall U.S. prison population in 2004, about 8 percent of cases were eliminated because of noncitizen status. Fewer than 7 percent of inmates in state correctional facilities were noncitizens; people who were not U.S. citizens made up 18.8 percent of persons in federal correctional facilities.
Because the 2004 inmate survey occurred during an intercensal year, we used the 2004 ACS, which provides information regarding the current makeup of the U.S. population in between censuses, to obtain the denominator for the percentages in our analysis and the modeling of incarceration in 2004. Similar to numerous other national surveys that omit institutionalized populations, the ACS does not include persons in prison. Therefore, combining the 2004 ACS and inmate survey data to speak to the proportion or percentage of persons incarcerated in federal and state correctional facilities makes sense for our investigation and is consistent with prior rigorous scholarship (e.g., Pettit 2012). The data from the ACS were extracted via the U.S. Census Bureau’s Federated Electronic Research, Review, Extraction, and Tabulation Tool.
Analytic Strategy
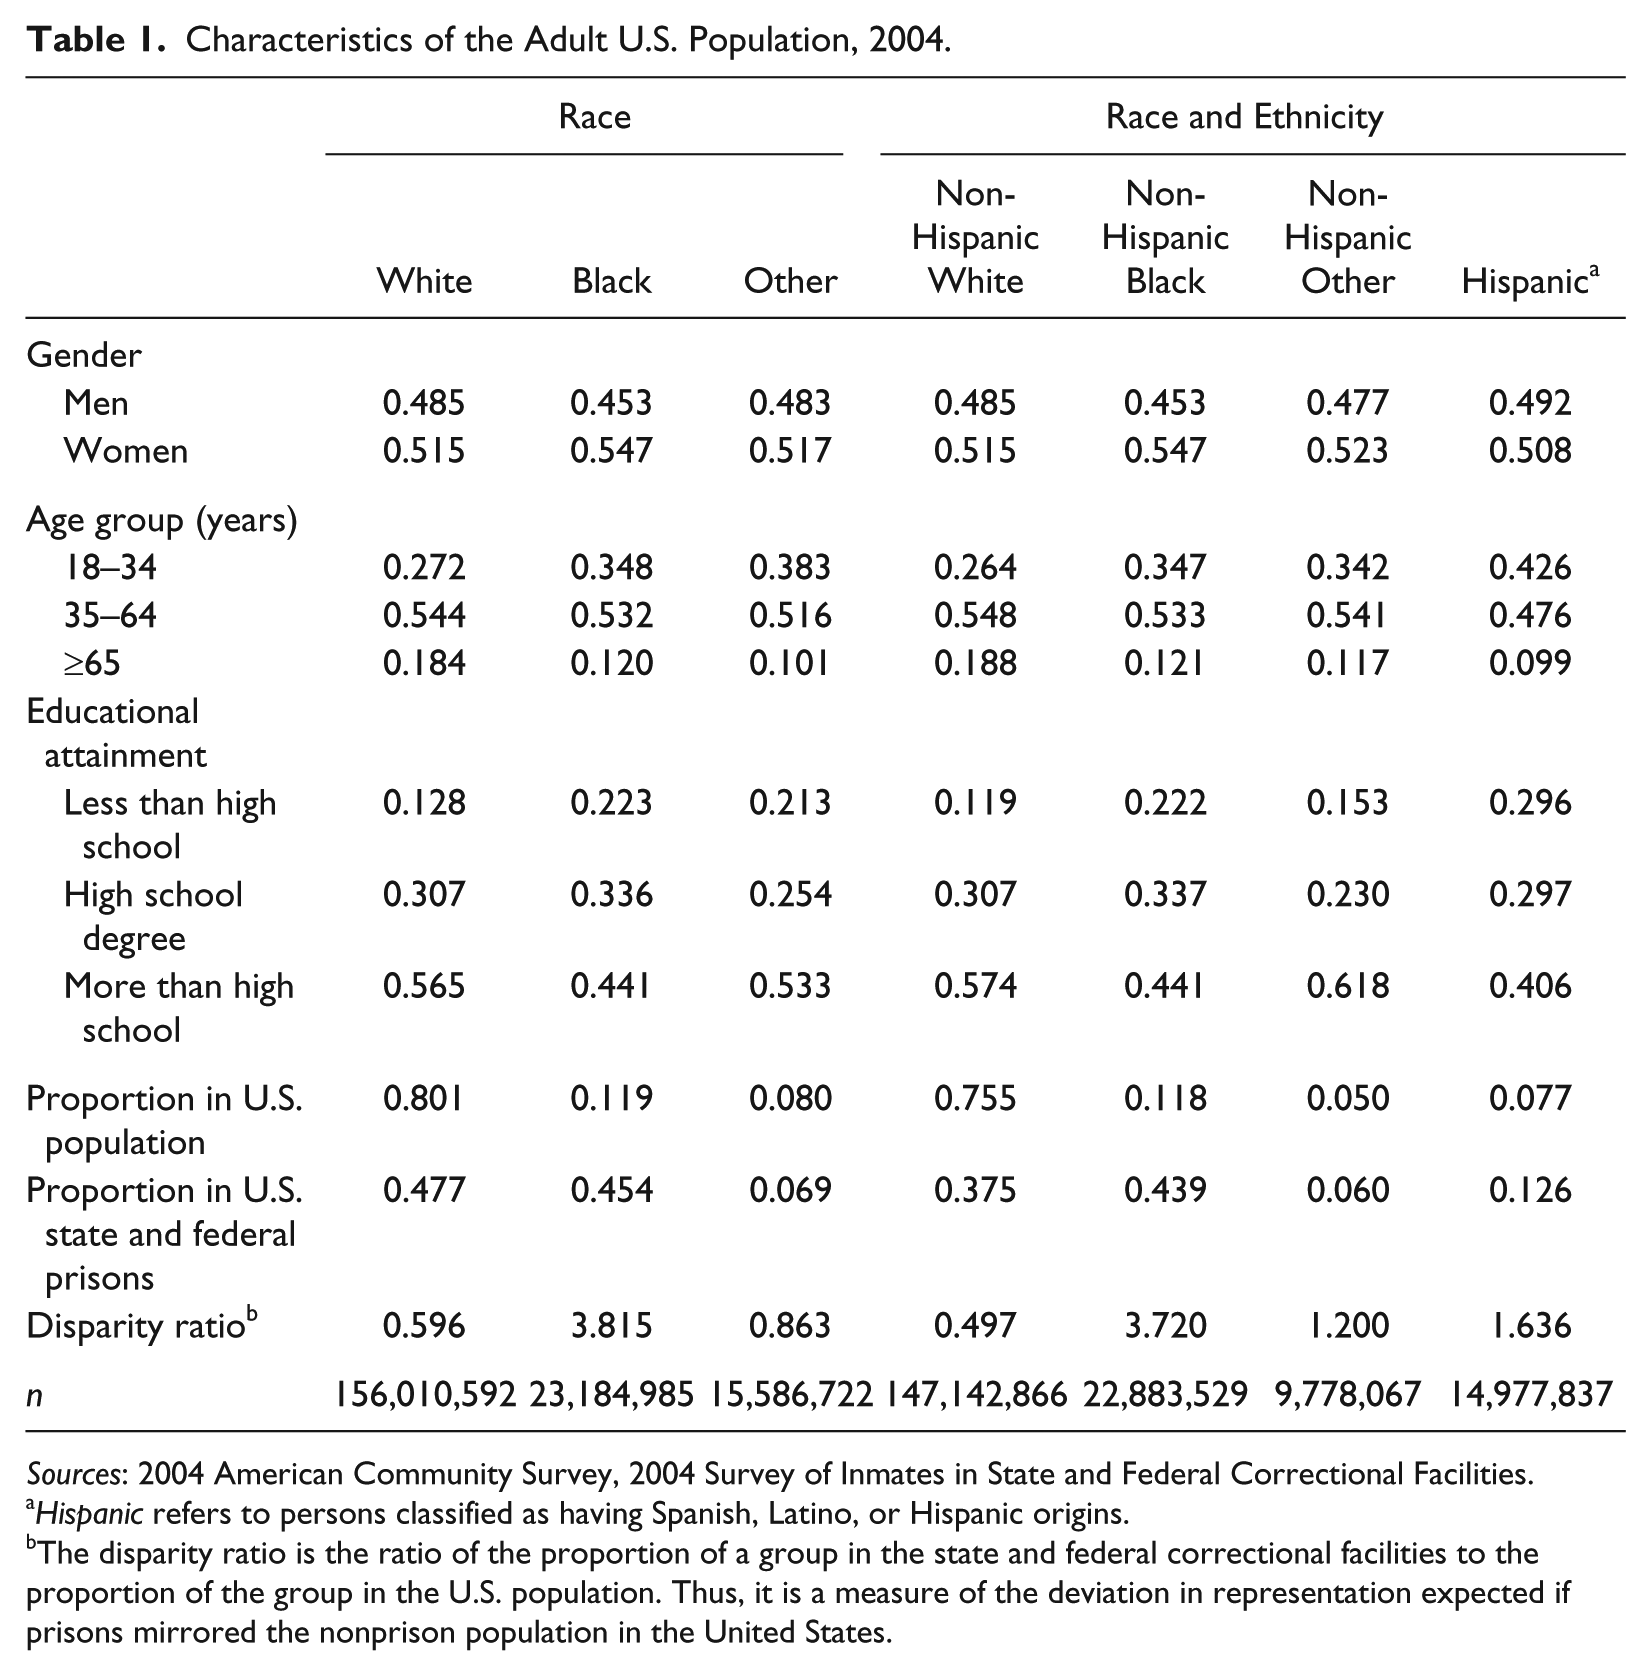
For our examination, we first conducted descriptive analyses (proportions) of our study variables. Table 1 displays characteristics of the resident 2004 population for each of the categorizations delimited in the study. Our selection of categories to illustrate the impact of changes in racial and ethnic classifications in the United States was informed by the issue studied: incarceration. The largest populations represented in the judicial system are Hispanics, non-Hispanic blacks, and non-Hispanic whites (Carson and Sabol 2012). Although non-Hispanic others constitute a large segment of the U.S. population, they represent less than 6 percent of the state and federal correctional population, and American Indians/American Alaskans constituted 4.32 percent, Asians 0.61 percent, Hawaiian and Pacific Islanders 0.47 percent, others 0.34 percent, and those of unknown race/ethnicity 0.25 percent. Table 1 compares racial partitions (white, black, and other) to the grouping that includes ethnicity (non-Hispanic white, non-Hispanic black, non-Hispanic other, and Hispanic). If we chose a different topic, the categories of interest could change. The methods and results presented reflect the research questions posed.
Characteristics of the Adult U.S. Population, 2004.
Sources: 2004 American Community Survey, 2004 Survey of Inmates in State and Federal Correctional Facilities.
Hispanic refers to persons classified as having Spanish, Latino, or Hispanic origins.
The disparity ratio is the ratio of the proportion of a group in the state and federal correctional facilities to the proportion of the group in the U.S. population. Thus, it is a measure of the deviation in representation expected if prisons mirrored the nonprison population in the United States.
Table 1 further provides the descriptive characteristics for each categorization described previously by gender, age group, educational attainment, representation in state and federal correctional facilities, and disparity ratio. With respect to gender, each group in the racial categorization has a higher proportion of women than men. This property holds when we include ethnicity. The age distributions for the groups contained in the categorizations vary considerably. Although we see relatively similar numbers of persons occupying ages 35 through 64 for white and black persons in the racial categorization, the white population is older. Approximately 18 percent of the adult white population is 65 years old or older, while only 12 percent of the black population is 65 or older. Disaggregation of Hispanics from whites (as shown in the second categorization under “Race and Ethnicity”) ages the population slightly, with the relative distribution shifting upward for whites and remaining the same for blacks. Accordingly, the Hispanic population has a younger adult population than non-Hispanic blacks and whites.
With respect to education, we partitioned the educational attainment into three categories: (1) less than high school education, (2) high school degree or equivalent (General Educational Development certificate), and (3) schooling beyond high school. More than 40 percent of persons in each group, regardless of the categorization, had education beyond high school. The introduction of ethnicity increased the percentages of persons with more than a high school diploma for non-Hispanic whites and non-Hispanic other, while non-Hispanic blacks remained the same as in the categorization that did not include ethnicity. Hispanics reported the highest percentage of persons without a high school degree or equivalent. Recall that the Hispanic group has a younger age distribution, which might account for some of the difference we see in the distribution of educational attainment.
The last set of characteristics in Table 1 describe the proportion of the U.S. population outside and inside state and federal correctional facilities. Non-Hispanic whites constituted 75.5 percent of the adult population but only 37.5 percent of the adults in state and federal correctional facilities in 2004. Hispanics, on the other hand, made up 7.7 percent of the adult population and 12.6 percent of adults in correctional facilities. The disparity ratio is the ratio of the proportion of persons expected to be incarcerated (proportion in the nonincarcerated population of the United States) to the proportion of persons actually incarcerated. Thus, the ratio provided a sense of the disproportionate representation in correctional facilities of racial/ethnic categories. If it is less than 1, then a group has a lower representation in correctional facilities than in the nonprison population, and if it is greater than 1, a group is overrepresented in correctional facilities. Examination of the racial categorization shows disparity ratios of 0.60, 3.82, and 0.86 for whites, blacks, and other racial groups, respectively. However, the disparity ratio declines with the incorporation of ethnicity for blacks and whites. Non-Hispanic whites have a disparity ratio of 0.50 and non-Hispanic blacks 3.72. Hispanics have a disparity ratio of 1.64. Thus, the exclusion of information regarding ethnicity makes disparities in incarceration rates appear larger.
In the next section, we answer the question of how different constructions of race and ethnicity affect knowledge surrounding incarceration. Using the 2004 inmate survey and ACS, we calculated the percentage of adults incarcerated along a variety of indices—gender, educational attainment, race, and ethnicity—to show how findings and relative disparities shift with the inclusion of ethnicity. We then used logistic regression to model the differences, investigating if and how the parameterization of the characteristics of persons in state and federal correctional facilities provides additional insight on the various indices we included. Furthermore, we examined the heterogeneity within the Hispanic population by comparing how the findings of the logistic regression changed when we disaggregated Hispanics into racial categorizations. Last, we examined the differences in imprisonment by type of facility, separating federal and state correctional facilities. Here, we continued to control for race, ethnicity, gender, and education in addition to examining the variation by type of crime committed.
Results
Race versus Race and Ethnicity: Does the Story Change?
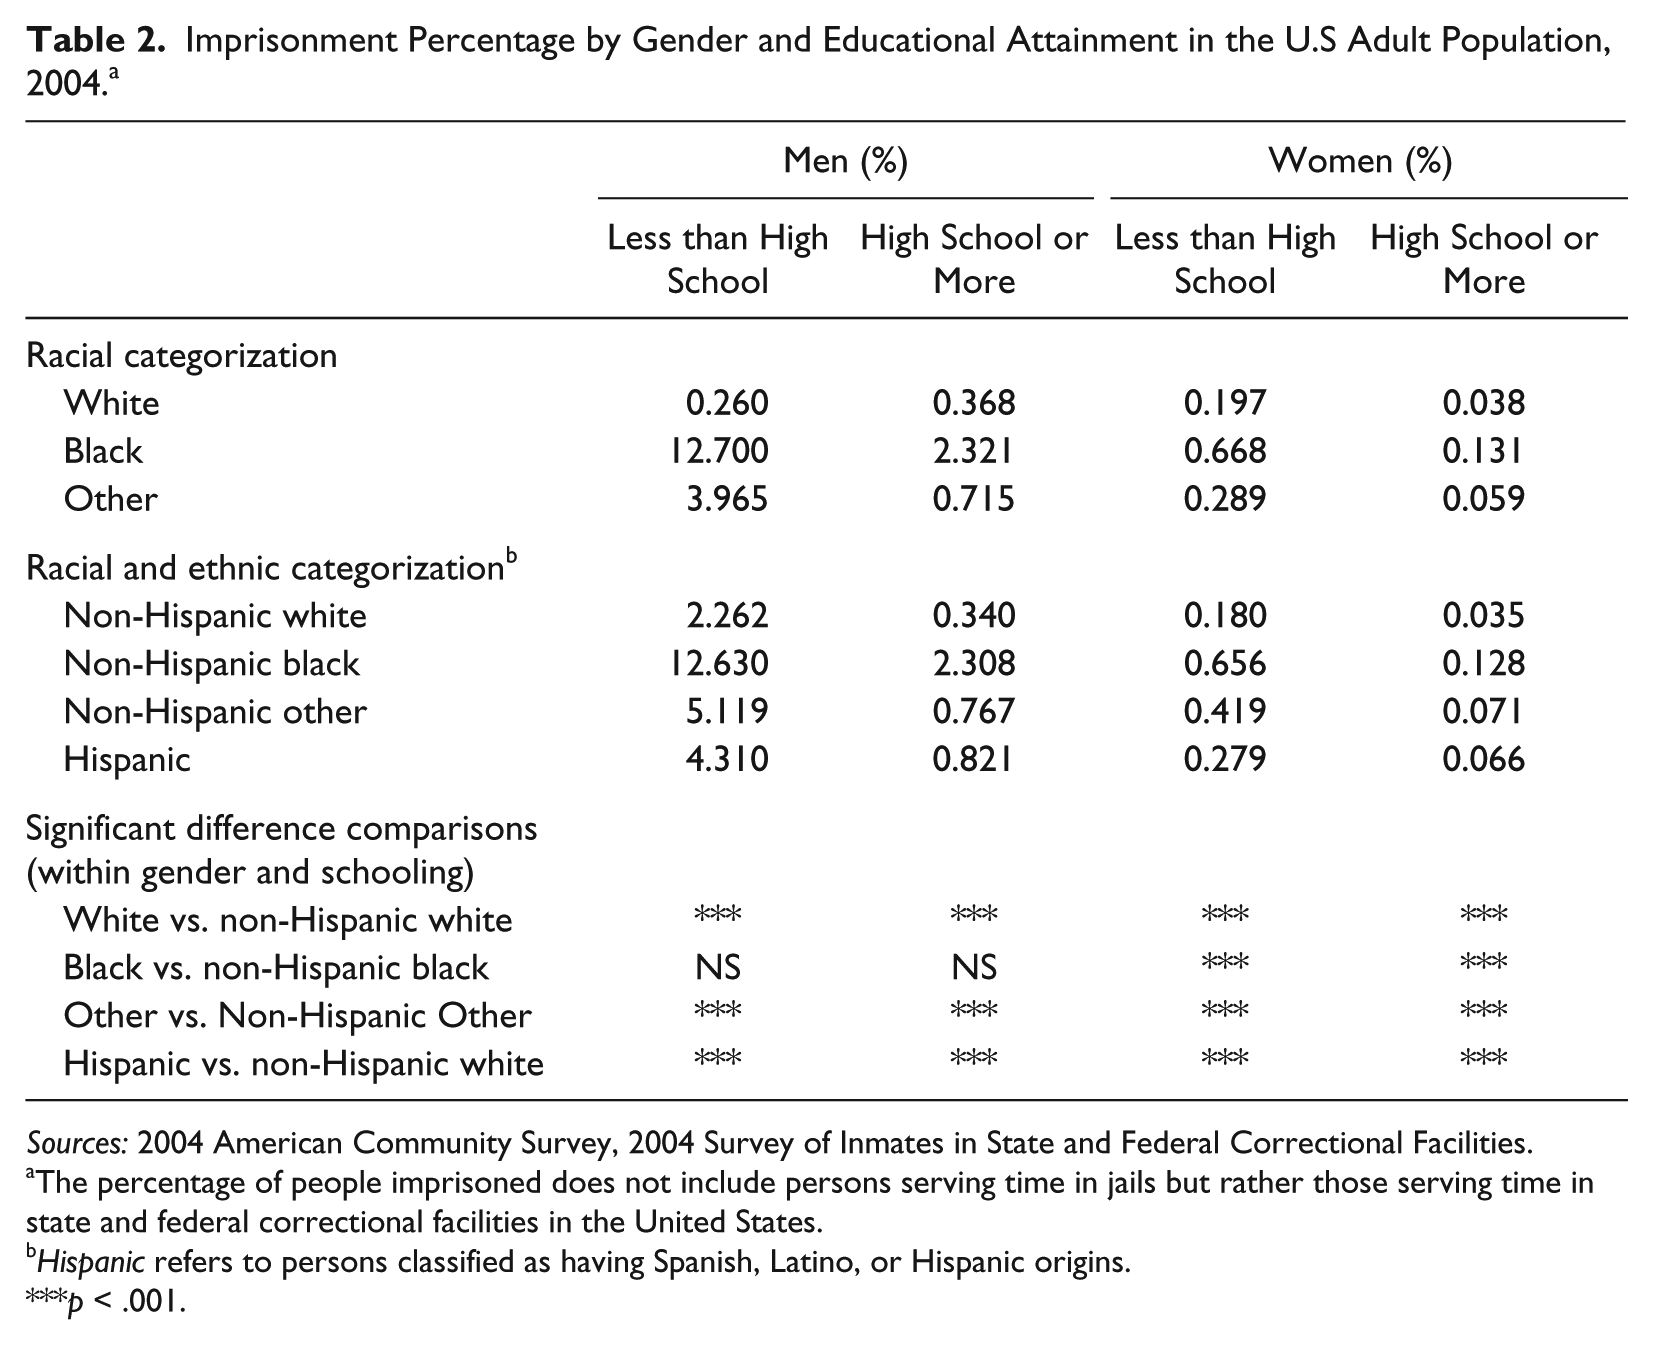
Table 2 displays the percentage of adults imprisoned, controlling for gender and educational attainment, comparing the racial categorization with the categorization that includes ethnicity. Each column represents a partition of the different combinations of gender and education attainment (persons without high school degrees vs. persons with at least a high school degree) for each group within the race and race and ethnicity categorizations. First, for each group, regardless of categorization, persons without high school degrees had a much higher percentage of imprisonment than persons with high school degrees. Second, women consistently had lower percentages of imprisonment than their male counterparts. These findings are expected based on the criminological literature, which documents that persons of color, men, and persons with low socioeconomic status make up a higher proportion of persons in prison (Beck and Karberg 2001; Harlow 2003; Wilson 1993).
Imprisonment Percentage by Gender and Educational Attainment in the U.S Adult Population, 2004. a
Sources: 2004 American Community Survey, 2004 Survey of Inmates in State and Federal Correctional Facilities.
The percentage of people imprisoned does not include persons serving time in jails but rather those serving time in state and federal correctional facilities in the United States.
Hispanic refers to persons classified as having Spanish, Latino, or Hispanic origins.
p < .001.
Our main query, however, is whether racial categorization alone is significantly different than the racial categorization that takes ethnicity into account. The third section of each column provides the results of statistical testing for four tests within each of the partitions: white versus non-Hispanic white, black versus non-Hispanic black, other versus non-Hispanic other, and Hispanic versus non-Hispanic white. We conducted the last comparison, Hispanic versus non-Hispanic white, because much data used to examine social inequalities that do not measure ethnicity include persons of Hispanic origin in the white category. We wanted to test this underlying assumption when we include persons of Hispanic origin with persons classified as white. Each comparison was significantly different (p < .001) with the inclusion of ethnicity. The imprisonment percentage in the categorization that included ethnicity was significantly lower than the categorization that included only race for persons classified as white and black. It follows that the percentage of imprisonment of Hispanics was significantly higher than non-Hispanic whites; non-Hispanic other was significantly higher than its racial counterpart other in each grouping.
Although looking at the percentage of imprisonment is informative about differences that occur with the inclusion of ethnicity, it provides only the absolute differences and does not parse the contribution each of the factors—gender, education, race, and ethnicity—make to the percentage of adults incarcerated. In Table 3, we use logistic regression to parameterize the relative importance of the factors listed above and complicate ethnicity through five models. The first model includes traditional categorizations of race and ethnicity, in which Hispanics are one category, and then non-Hispanics are separated by race. The second model relaxes the assumption of all Hispanics belonging to the same racial category, thereby introducing three new groups: Hispanic white, Hispanic black, and Hispanic other. The three remaining models (models 3 to 5) continue with the six racial and ethnic classifications, controlling for gender in the third model, adding controls for age in the fourth, and adding a control for educational attainment in the final model.
Odds of Incarceration in the United States with Hispanic Disaggregation, 2004.

Sources: 2004 American Community Survey, 2004 Survey of Inmates in State and Federal Correctional Facilities.
Hispanic refers to persons classified as having Spanish, Latino, or Hispanic origins.
p < .001.
Model 1 displays the expected racial and ethnic hierarchy for the proportion of persons in each group, where each group is significantly higher than the referential group, non-Hispanic whites. The odds of Hispanics being in prison in 2004 were more than 3 times those of non-Hispanic whites (odds ratio = 3.21), and the odds of non-Hispanic blacks’ being in prison were more than 7 times higher those of than non-Hispanic whites (odds ratio = 7.68). In the second model, we disaggregate people of Hispanic origin into three racial categories: white, black, and other. The results for non-Hispanic black and non-Hispanic other remain the same. The odds of being in prison for Hispanic whites are similar to the odds for the aggregate group (3.43 vs. 3.21). However, the odds of Hispanic blacks’ being in prison soar over every racial and ethnic group, where the odds are more than 12 times greater than for non-Hispanic whites. Although the direction was the same for all Hispanic racial groups, the magnitude was higher with the addition of race. Model 3 adds gender, which actually increases the odds ratios for each racial categorization (except Hispanic other), but most notably for non-Hispanic blacks and Hispanic blacks. The odds ratio increases from 7.67 to 8.31 for non-Hispanic blacks and from 12.12 to 13.13 for Hispanic blacks. These findings, in addition to prior literature (Steffensmeier et al. 1998), suggest an interaction of race/ethnicity and gender. We ran additional models with interactions for gender and race/ethnicity (not shown) and found that inclusion did not change the overall story.
Models 4 and 5 introduce age and education, respectively. Persons aged 18 to 34 years have higher odds of imprisonment than persons aged 35 to 64, and persons aged 65 or older have lower odds of imprisonment than persons aged 35 to 64. The inclusion of age also reduces race and ethnicity coefficients substantially. However, the addition of education drastically changes the magnitude of the race and ethnicity coefficients, as shown in model 5. A high school diploma lowers the odds of incarceration. The inclusion lowers the odds ratio for non-Hispanic blacks to 5.56 and the odds ratio for Hispanic blacks to 7.35. Thus, the story not only changes, but our findings illuminate a new story that is not typically articulated: non-Hispanic blacks are not the most vulnerable group with respect to imprisonment; rather, Hispanic blacks are more vulnerable to prison.
State versus Federal Correctional Facilities
Thus far, our examination has combined federal and state correctional facilities. Although the majority of people serve their sentences in the state correctional system (approximately 87 percent), a substantial remainder serve their sentences in federal facilities. If a crime is routed through the federal system, it indicates that the person or people charged with the crime will likely experience harsher punishment. The decision to allocate offenses to state versus federal courts is decided by prosecutors and/or investigating agents. However, who makes the decision varies from state to state. Is there a difference in the percentage of imprisonment when we control for type of facility and type of crime?
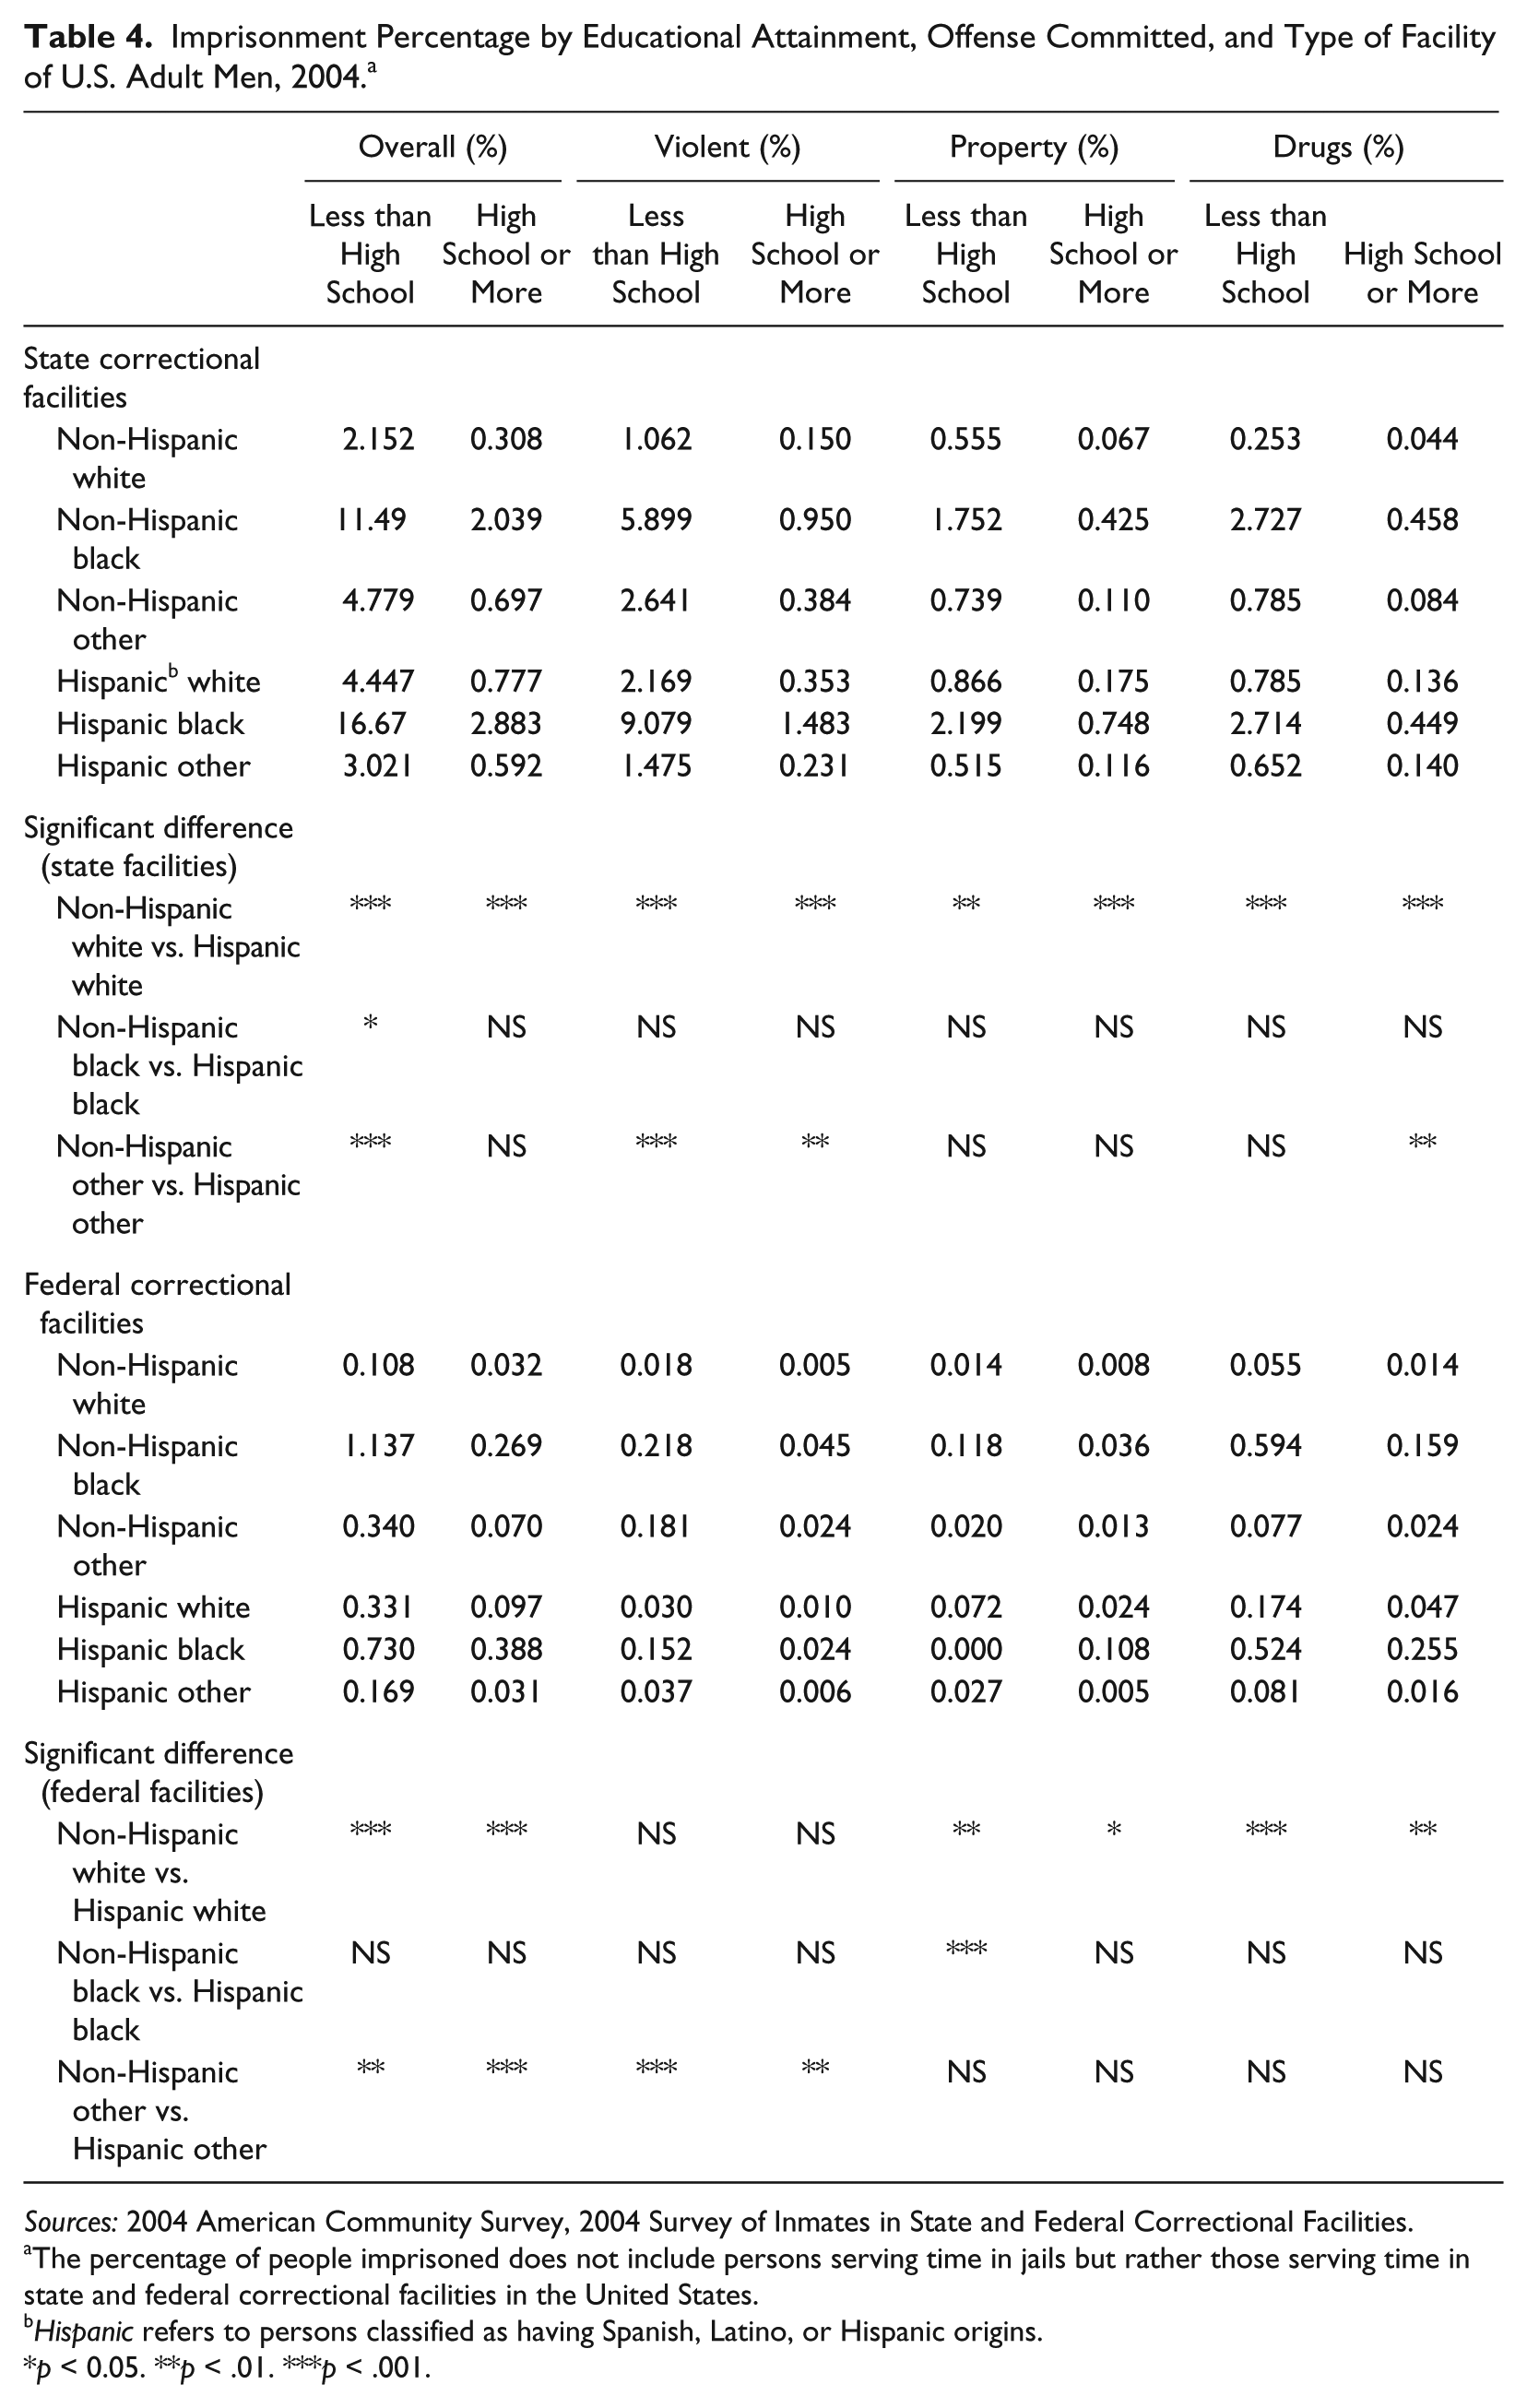
Table 4 presents the percentage of men incarcerated in state and federal correctional facilities who are citizens. We control for education, ethnicity, race, and facility type. We also test for significant differences between Hispanic and non-Hispanic racial groups. One of the most surprising findings is that Hispanic blacks had the highest percentage of the men in prison among all groups when we restricted our analysis to men in state correctional facilities. Among Hispanic black men with less than a high school education, almost 17 percent were incarcerated in a state correctional facility in 2004. The proportion of non-Hispanic black men is significantly lower with 11.5 percent incarcerated in 2004. These findings demand a pause. Almost 1 in 5 Hispanic blacks with less than a high school education and more than 1 in 10 non-Hispanic blacks with less than a high school education were in state correctional facilities. For state correctional facilities overall, there are significant differences within racial groups between Hispanics and non-Hispanics with less than a high school education. When we restrict this comparison to men with a high school education or more, the differences are no longer statistically significant except among whites. The proportion of non-Hispanic whites in prison in 2004 was less than half that of Hispanic whites.
Imprisonment Percentage by Educational Attainment, Offense Committed, and Type of Facility of U.S. Adult Men, 2004. a
Sources: 2004 American Community Survey, 2004 Survey of Inmates in State and Federal Correctional Facilities.
The percentage of people imprisoned does not include persons serving time in jails but rather those serving time in state and federal correctional facilities in the United States.
Hispanic refers to persons classified as having Spanish, Latino, or Hispanic origins.
p < 0.05. **p < .01. ***p < .001.
The most common groupings of types of crime are violent, property, and drug. To determine the level of variation within populations, we estimated the proportion of men in prison by the type of crime committed into the three primary groupings in Table 4. Regardless of education, there were significantly higher proportions of Hispanic whites incarcerated than non-Hispanic whites across the three types of crime. However, there were no significant differences between non-Hispanic blacks and Hispanic blacks when we stratified by type of crime. Still, with violent and property crimes, the proportion of Hispanic blacks incarcerated far superseded that of non-Hispanic blacks; with drug offenses, there was no significant differences between the two groups.
Compared with state facilities, federal correctional facilities have much smaller populations, which is reflected in the proportion of people in the ethnic and racially constructed groupings. Although whites were significantly different by ethnicity in property- and drug-related crimes, non-Hispanic blacks and Hispanic blacks were significantly different only among persons who had at least a high school education and committed property-related crimes. Overall, there was an added penalty to being Hispanic among whites. But there were not many significant differences among the black groups. Furthermore, there was a consistently higher percentage of Hispanic blacks imprisoned in state correctional facilities. Again, this was an unexpected finding, because much of the discourse surrounding incarceration focuses on African American men. When we do not consider race and ethnicity, we miss a remarkably important finding: overall, the proportion of black Hispanic men in prison significantly exceeds that of non-Hispanic black men. We do not discount the reality of the disproportionate incarceration of African Americans in the United States. At the same time, this study stresses the reality that there are other populations in the United States whose fates are far less visible because of different social constructions of race and ethnicity.
Discussion
Summary
The complexity of race and ethnicity affects the reliability of two key contributions in the discipline of sociology: (1) its description of inequalities and (2) explanations of why inequalities exist. Unfortunately, conceptual understandings of race as a fluid social construction that changes with time and context have not readily translated empirically. Social scientists rely heavily on secondary data, which may not always capture the complexity and heterogeneity of race and ethnicity in their measurements. However, that does not mean that useful insights cannot be gleaned from these data, especially when such data allow examination of outcomes by different racial and ethnic categorizations. Although a more expansive treatment of race and ethnicity has implications for other social institutions such as health and education, this article’s primary focus was incarceration. Less is known about the distribution of incarceration across social and demographic groups and how incarceration varies in relation to gender, race, age, and indicators of social class such as education and employment (Pettit 2012:6). Using the proportion of people imprisoned as an example, we investigated differences that can emerge in interpretations and conclusions when a more heterogeneous understanding of race and ethnicity is adopted.
At the same time, this article extends beyond providing a case study of how racial and ethnic categories can change a story. The novelty of the article rests in two important ideas. First, there exists heterogeneity within the Hispanic population that we still know very little about. There is a wealth of scholarship showing that Hispanic presence does not increase violent crime in neighborhoods; but rather, the presence of Hispanics ameliorates the level of violent crime (Martinez, Stowell, and Cancino 2008; Martinez, Stowell, and Lee 2010; Stowell, Martinez, and Cancino 2010). There is also scholarship on inequalities in sentencing that Hispanics experience in federal courts (Lopez and Light 2009); however, this work includes people who are not citizens, and the comparisons are made among all Hispanics, non-Hispanic blacks, and non-Hispanic whites. Our results showing a higher proportion of Hispanic blacks in state correctional facilities compared with non-Hispanic blacks is a novel contribution. At the same time, this finding may not be surprising given the “triple consciousness” Hispanic blacks experience (Flores and Román 2009). Much of the conversation regarding prisons focuses on young African American men; however, our findings demand an expansion of the conversation to include Hispanic blacks. There were few significant differences between the percentage of people imprisoned between these two groups, and one of the two significant differences showed that among blacks with less than a high school education, Hispanic blacks had a significantly higher percentage of men in state correctional facilities compared with non-Hispanic blacks.
Second, our use of incarceration as an illustration lends itself to understanding the potential influence the inclusion and exclusion of the incarcerated has on understanding of sociological phenomena. Disadvantaged populations disproportionately disappear from national surveys because of incarceration, thereby either inflating or deflating scholarship on social inequalities. This work does not end with race or ethnicity, but rather it is the beginning of a longer conversation. Although there are many people not physically bound by de jure social control, there are still less formalized, less visible structural factors that restrict social and economic mobility. These less visible barriers are as important to identify and study as the physical prisons that currently house more than two million Americans.
Future Research and Implications
The previous studies that have examined incarceration by race and ethnicity have, by and large, accepted the categorizations provided and not sought to question how different ways of categorizing race and ethnicity may affect outcomes. A major reason for this limitation of previous studies is that the data did not allow examinations beyond black-white dichotomies. The studies, like our own study, were limited by the racial and ethnic categories present in the data, which do not always capture the fluidity and blurring of the color line. Thus, it may be helpful to revisit previous research questions that examined incarceration by race and ethnicity and replicate these studies using new data that allow different racial and ethnic categorizations to establish if and how descriptions and explanations of inequality change with varying definitions of race and ethnicity.
The fact that our article is framed along Du Bois’s color line, the ambiguity of the line(s), and the variability of the census’s racial/ethnic categories recalls the objective/subjective tension in research on race and ethnicity. This article highlights the consequences of the ways we construct race in incarceration specifically, but the lessons extend to other areas. For example, if we were interested in examining disparities in educational attainment by race alone, we would find that in 2013, among white persons aged 25 years and older, 11.2 percent did not have high school diploma or General Educational Development certificates, but 32 percent had at least a bachelor’s degree (U.S. Census Bureau 2013). Among Hispanics, 33.8 percent did not have high school diplomas, and only 15 percent had bachelor’s degrees or more. Disaggregating Hispanics from whites and examining non-Hispanic whites leads to a decline in the percentage without a high school diploma (7.1 percent) and an increase in the percentage with at least a bachelor’s degree (35.2 percent) (U.S. Census Bureau 2013). Hence, even with this brief consideration of educational attainment, the inclusion of ethnicity alters the discourse surrounding educational inequalities.
Variations between and within populations do not end with Hispanic ethnicity. For example, populations from Africa and from the Caribbean have different histories and experiences than African Americans. Yet researchers often do not distinguish between the stories of blacks in America (Ford and Harawa 2010; Vickerman 2007; Waters 1991; Waters and Eschbach 1995; Williams and Jackson 2000). These “new” blacks tend to have higher levels of educational attainment, employment, and annual household incomes, to have lower poverty rates, and are more likely to be married than their African American counterparts (Dagadu and Christie-Mizell 2014, Griffith et al. 2011; Kent 2007; Williams et al. 2007). Thus, we would expect that they are far less likely to go to prison. If this is the case, the imprisonment numerator is made up largely of African Americans, yet the denominator includes all blacks, thereby masking the different experiences of blacks in America.
Routine statistical analyses that incorporate the constructs of race and/or ethnicity are thought to provide a stable and widely accepted language to give voice to debates surrounding disparities in certain social phenomena such as incarceration and educational attainment, thereby establishing findings deserving of further inquiry and interventions. However, this very process suggests an inconsistency. As social facts, these objects are often thought of as beyond the debates, as indisputable, and above the fray. An unfortunate consequence of statistics’ being so embedded in our work is that the concepts, constructs, or variables in analyses are elevated to a level free of questioning; attributes, such as race, become objective and facts, removing all of the social interactions and history that gave rise to the creation of race. However, the constructs themselves, which are reference points in the debate, need also to be subjected to debate.
Social scientists must continue to strive toward better considerations of race and ethnicity to provide more nuanced understandings of the experiences of individuals and groups. As social scientists, we have a responsibility not to just accept social facts but to interrogate the social facts. If we do not, we continue the propagation of dangerous facts. Such facts are dangerous not only because they ultimately question the validity and integrity of scholarship but also because these facts have real consequences for the lives of individuals, families, communities, and ultimately our society writ large. By definition, social facts take on a life beyond the initial analyses and observations, because they are elevated to a status exempt from inquiry. With that in mind, more nuanced data can lead to better policies, contributing to the dismantling of racist ideologies and structural discrimination.
Footnotes
Acknowledgements
We would like to acknowledge Leslie Rodriguez for her contribution to an earlier version of this article.
Funding
The author(s) disclosed receipt of the following financial support for the research, authorship, and/or publication of this article: This study was supported in part by grant 68146 from the Robert Wood Johnson Foundation Center for Health Policy at Meharry Medical College. The content is solely the responsibility of the authors and does not necessarily represent the official views of the Robert Wood Johnson Foundation.