



Abstract
Socially constructed race groups have boundaries that define their membership. I study temporal trends and group-specific patterns in race and ancestry responses provided for children of interracial marriages. Common responses indicate contemporary definitions of race groups (and perhaps emerging groups); uncommon responses reveal socially defined limits of race group membership. I leverage dense, nonpublic, Census Bureau data from 1960 to 2010 to do this and include a more diverse set of families, a longer time span, and more accurate estimates than prior research. I find that the location of race group boundaries varies over time and across 11 distinct family types. Since mixed-heritage responses became possible in 1980, they have been common in most groups. Part Asians have almost always been reported as multiracial or mixed ancestry. A number of (non-Asian) mixed-heritage children are described as monoracial on the census form, particularly children with American Indian heritage. Over time, part whites are decreasingly reported as monoracially white (white race with no nonwhite ancestry). Black heritage is reported for part blacks, but monoracial black responses became nonmodal by 1980. Part Pacific Islanders show similarities to part Asians and part American Indians. Given the predominance of multiracial and mixed-ancestry Asian responses since 1980, Asian multiracial may be an emerging socially recognized race category. Black multiracial shows a similar pattern. Monoracial responses (especially common among white–American Indians and black–American Indians) create important but hard-to-measure complexity in groups’ compositions.
Parents in interracial unions are theoretically faced with many options for reporting their children’s heritage in daily life and on official forms. These options, however, are limited by social and personal constraints (Song 2003), such as the socially constructed boundaries of race groups. In this research, I give empirical insight into race groups’ boundaries over a 40-year period in the United States. I study race and ancestry responses given for/by people with interracially married coresident parents at five points in time to address three questions. First, are mixed-heritage children reported as mixed when possible? Specifically, are they most often reported as belonging to one race group, two race groups, or something in between (a race/ancestry combination)? Second, how have the distributions of responses changed over time (between 1960 and 2010)? And third, what group-specific patterns emerge when looking at children from 11 types of interracial marriage?
Society has subtle rules or norms about what it takes to be seen and socially accepted as a member of each race group. Without supportive reflected appraisals (Cooley 1902), an identity can be difficult to maintain. Racial formation projects (Omi and Winant 1994), historical group interactions (Cornell 1990; Gullickson and Morning 2011), family and individual actions, and other social forces determine the character of criteria for belonging to each group and the extent to which people are pushed by group members and outsiders to respect these criteria (see Tilly 2004). I aim to shed light on race group boundaries: where they have been drawn in the past and implications for their futures. The broader purpose of this research is to uncover patterns in the social processes that convert a newborn child of mixed heritage into an adult who reports a particular race or set of races and who might or might not report the mixed heritage.
Race groups are defined by outsiders and experienced by insiders in relation to one another (Kim 1999). Interracial marriages give researchers an empirical opportunity to see how the boundaries of two groups interact. Two race groups’ membership rules can overlap such that a person who has heritage in both groups can be accepted as a member of each group without caveat. For example, the general rules of “white” and “American Indian” appear to overlap, such that people who have both heritages are socially permitted to make a wide variety of race claims, including monoracial claims. Indeed, the “white” population includes some with American Indian heritage, and the “American Indian” population includes some with white heritage (Liebler 2010a). This hidden diversity undermines depictions of our society that describe a clear divide between, for example, whites and nonwhites (see Lee and Bean 2007) or whites and honorary whites (Bonilla-Silva 2004). It may also open the door to race response change when a person is asked their race in another context because multiple responses are plausible (see Liebler et al. 2014; Liebler, Bhaskar, and Porter forthcoming).
When membership rules of two groups intersect unequally, people who have both heritages may feel constrained to identify a certain way. For example, a person with black and Japanese heritage might get negative interpersonal feedback when claiming “Japanese with black ancestry” but have little trouble supporting a claim of “black with Japanese ancestry.” Unequal intersections may be revealed using ancestry responses in conjunction with race responses.
Constraints can be uncomfortable and not everyone abides by any rule. Some people of mixed heritage feel that they must navigate a “borderland” in which no single-race response can fit with ease (Anzaldúa 2007; C.-Y. Cheng and Lee 2009; ProjectRACE n.d.; Rockquemore 1999; Root 1996); parents of children with mixed heritage might anticipate or reflect these feelings in their children’s census answers. If component race groups are believed to include only those of unmixed heritage (e.g., white; Haney López 2006) or are seen as having contrasting values (C.-Y. Cheng and Lee 2009), a multiracial report seems particularly likely. If some multiracial responses become particularly common, a racial formation project (Omi and Winant 1994) may emerge to solidify the category as widely socially recognized. 1
By identifying predictors of which single race was reported for the child of an interracially married couple, previous researchers have shed light on enacted boundaries of long-standing single-race groups (Brunsma 2005; Kana’iaupuni and Liebler 2005; Liebler 2004; Liebler and Kana’iaupuni 2003–2004; Qian 2004; Saenz et al. 1995; Xie and Goyette 1998). 2 Other researchers have studied multiracial responses or multiple measures of heritage, describing patterns of identification in less established groups (Bratter 2007; Gullickson and Morning 2011; Jones and Smith 2003; Liebler 2010a, 2010b; Rockquemore and Brunsma 2002; Roth 2005).
My work speaks to this research tradition and expands it in four ways. I document a more complete range of mixed-heritage responses (using both race and ancestry) for children in each parent race pairing to gain more nuanced information about where race group boundaries have formed and may be developing (see Burton, Nandi, and Platt 2010). I include 11 parent race pairings, including five double-minority pairings which have not been studied before, allowing each race group to be studied from multiple angles. I study the period from 1960 to 2010, rather than focusing on a single year. I also use the large samples and detailed response information in nonpublic census and American Community Survey (ACS) data, including unsolicited multiple-race responses given in 1980 and 1990. These innovations allow me to provide the most complete picture yet of the ways race group boundaries have been drawn, have changed, and may be developing in the United States.
Terminology
I use several terms that require clarification. Race and ancestry are socially constructed categorical concepts tapped by separate census questions (see Appendix A for wording and Appendix B for categories on each year’s questionnaire). Race is thought to be ascribed by others, based on phenotype and ancestral origins, actively socially constructed, and extremely socially consequential. The Census Bureau and most sociologists do not consider race to be based on a scientific categorization system (Lewontin 1972; U.S. Bureau of the Census 1976:15–19). Because of its social and legal importance, a race question is always included on census forms. Race groups were federally defined in 1977 (Office of Management and Budget [OMB] 1977) and revised in 1997 (OMB 1997). Census categories have followed the OMB’s “major race groups,” which are currently white, black or African American (“black” here), American Indian or Alaska Native (“American Indian” here), Asian, and Pacific Islander. Census forms also include a residual “other” race category. Note that Hispanic origin is not considered a race by the federal government, and I do not treat it as a race in this research. 3 A person’s ancestry is expected to be a reflection of his or her family tree, consisting of his or her (or ancestors’) ethnic groups (e.g., Sicilian, Han) or countries of origin (e.g., Italy, China). Individuals’ ancestry responses are particularly unstable over time (Lieberson and Waters 1993) and are often uncodable or missing, so I utilize ancestry reports cautiously.
I use mixed heritage to describe a person with family origins in more than one race group, whether or not they report those varied origins (Farley 2004; Hout and Goldstein 1994; Pew Research Center 2015; Waters 1990). I use multiracial to indicate that two or more races were reported, mixed ancestry to indicate a singular race response with contrasting ancestry (e.g., white with Han ancestry), and monoracial for persons with no indication of mixed racial heritage. A first-generation multiracial person is someone who has monoracial parents of different races. Categorizing a person as “mixed heritage” versus “monoracial heritage” is an inherently flawed process involving difficult coding decisions and questionable assumptions (see Appendix C for coding choices). I use the terms first generation, single race, monoracial, and multiple race in reference to responses to census questions that were probably answered by one of the child’s parents; 4 I have no substantiated information about the family tree, who filled out the questionnaire, or what was meant by the responses.
Hypotheses Based on Prior Research
When deciding how to report the race and ancestry of someone with mixed heritage (particularly oneself or one’s child), a person likely takes into account factors such as phenotype, socialization, experiences, interactions, family dynamics, and perceived socioeconomic and/or psychological benefits and disadvantages. If broader social forces did not constrain identification, we might see no societywide patterns in race responses as people used individual- and family-specific factors to make a free choice in accordance with their mind-sets and networks. However, broader social forces do affect race responses (and these forces change over time). Direct feedback and subtle pressures guide mind-sets and networks to develop in particular ways. A mixed heritage person (or their parent who is filling out the census form) might avoid a particular race/ancestry report because social interactions and reflected appraisals have not supported this identity claim (Cooley 1902; Davis 2001; Robertson 2013). Patterns in the race claims made for thousands of mixed-heritage people can reveal previously hidden social constraints. In the next section, I explain my expectations about which race/ancestry responses were common and which were rarely used to describe these children of intermarriage.
Report Mixed Heritage?
Is a mixed-heritage child reported as monoracial (only one parent’s group is mentioned), multiracial (with both parents reported equally), or something in between (mixed ancestry)? Over the course of the decades covered by this study, there have been important changes in the ways in which people could have been reported as mixed. In 1960 and 1970, only one race response per person was solicited and recorded in the data; all people were administratively forced to choose a monoracial response. In 1980 and 1990, the respondents were instructed to choose only one race response, but a secondary race group could be reported in the ancestry question offered later in the questionnaire. Reporting mixed heritage through the combination of race and ancestry shows one parent’s race as privileged over the other’s (the latter being reported as ancestry). Before 2000, unequal representation was required by the census form instructions, but beginning in 2000, the instruction to “mark one or more” races allowed parents equal billing if they reported the child as both races.
Several forms of internal and external pressures can encourage a monoracial response, including family dynamics that privilege one parent’s family of origin (e.g., mothers as kin keepers or fathers as patriarchs). Fewer people than expected reported multiple races in Census 2000 (Farley 2004). Single-race identity enhances a sense of group belonging (Rockquemore and Brunsma 2007) and minimizes a person’s sense of being a “marginal man” (Park 1928; Stonequist 1937). A single-race report might be provided in order to convey a sociopolitical message about where resources should be allocated, especially for people associated with a tribe (see U.S. Census Bureau 2008), in which case a parent of mixed heritage who self-reports as monoracial might apply the same reasoning to the child.
Despite these pressures, I see two reasons to expect that most of the children in this study will be reported as mixed heritage when possible. First, many first-generation mixed-heritage people argue that they should not be categorized as entirely to one group; they reserve the right to self-categorize and often claim multiple races (e.g., S. Cheng and Lively 2009; Korgen 1998; ProjectRACE n.d.; Rockquemore 1999; Rockquemore and Brunsma 2007; Root 1996; Tashiro 2011). These voices are part of the “multiracial” race project (Omi and Winant 1994; ProjectRACE n.d.), which seems to have reduced social willingness to enforce rigid race membership criteria and allowed people more room to self-define. Second, out of concerns of fairness, accuracy, minimizing conflict, and/or awareness of psychological benefit, interracially married coresident parents may prefer to have both races equally represented in the report for the child (ProjectRACE n.d.; Sillars and Kalbflesch 1989). These preferences may outweigh their consideration of socially imposed norms of who “belongs” in which group, allowing them to take a step toward revising those norms. I hypothesize that since it became possible in 1980, children of interracially married parents have a strong tendency to be reported as multiracial or of mixed ancestry.
Change over Time in Mixed Responses?
In my second research question, I ask, How have the responses changed over time and with important changes in how the questions were asked? The early years included in this study—1960 and 1970—give a baseline; they reveal which monoracial response was most common for each group when there was no way to indicate mixed heritage to the Census Bureau. In 1960 and 1970, interracial marriages were relatively rare, and for most race pairings, there were few role models who identified as multiracial; both socially and procedurally, parents were pushed to choose a single race for their child. Since then, intermarriage has become more common (Qian and Lichter 2011), and bureaucratic restrictions on identification have lessened (OMB 1997). Americans’ conception of race seems to have shifted to a more nuanced and culture-based understanding that questions the legitimacy of rigidly enforcing race group membership criteria. All of these factors make room for mixed identities and responses, so I expect that mixed-heritage responses have been increasingly common from 1980 to 2010 among children of interracially married parents.
There was a major procedural change between the 1990 census (which solicited single-race responses) and the 2000 census (when multiple race responses were first sought on the form). Because of changes in the questionnaire, I expect that mixed-heritage responses show a particular increase between 1990 and 2000.
Group Differences in Common Responses?
In my third research question, I ask, How and why is the distribution of responses different across the parent race combinations represented in this study? Race categories and race assignment are socially constructed large-scale social processes as well as personal decisions (influenced by these processes), such as how to present oneself or one’s child. Because of variation in group histories and racial formation projects, the race groups included in this study (listed in Appendix B) vary widely in what members and outsiders see as the limits of membership. Thus, in addition to the hypotheses above, I expect cross-group variation in the extent to which each single-race group is claimed or eschewed.
Whites
Although groups in the United States may move toward recognition as white (Gordon 1964; Haney López 2006; Painter 2010; Roediger 2005), whiteness can be less claimable at the individual level. The emphasis on purity within the social construct of whiteness (Haney López 2006; Lee and Bean 2007) is so strong that many laws were passed with the intention of minimizing the number of multiracial part-white people (e.g., by limiting social interaction between people of different race groups; see Spickard 1991). For part-white people of mixed heritage, self-identification as white can also have negative social implications: it is described negatively as “passing” and is seen as an affront to minority pride (Davis 2001; Russell, Wilson, and Hall 1992). Because of these social constraints, I expect that it has been relatively rare for a child of an interracially married white parent to be reported as monoracially white.
Part-white children in the earlier years of this study may have a different response pattern. In midcentury America, the costs of color were still very high, and parents socialized before the social movements of the 1960s may have attempted to reduce their children’s costs by presenting them as white. Thus I expect that “monoracial white” responses for children of mixed heritage were more common in 1960 and 1970 than in later years.
Asians
Several Asian groups exhibit strict membership criteria such that Asians of mixed heritage have not been accepted as truly Asian (King-O’Riain 2004; Song and Hashem 2010; Spickard 2001). Mixed-heritage Asian–whites in Britain report that language fluency and cultural trappings are required for an “authentic” claim of Asian race and that these are very difficult to acquire (Song and Hashem 2010). These social restrictions lead me to expect that a child of a Japanese, Chinese, or other Asian parent and a non-Asian parent has tended not to be reported as monoracially Asian. The processes may differ across Asian groups as a reflection of their immigration, incorporation, and intermarriage histories, so I present results separately by group to the extent possible.
Blacks
Historically, rules of membership in the black race group have been clear and enforced in the United States—a part-black person has been considered racially black in the legal system, by “social others,” and by other blacks (Cornell 1990; Davis 2001). Other race groups’ boundaries can be particularly guarded with respect to part blacks. When interviewed, however, part-black people often reveal a multiracial “internal identity” (self-perception, in the language of Harris and Sim 2002) and “expressed identity” (self-presentation), even when “observed identity” (observer’s interpretation) is monoracial black (Guo et al. 2014; Khanna 2011; Rockquemore and Brunsma 2007; Root 1996; Song and Hashem 2010). Taking into account both social constraints and personal feelings, I hypothesize that a child of an interracially married black parent has often been reported as monoracially black and rarely as monoracially nonblack.
Indigenous people
The social rules about who should be considered indigenous (American Indian, Alaska Native, or Native Hawaiian) are complicated. In some ways, there are strict and enforced membership criteria, but in other ways, membership can be self-defined with little social coercion.
Restrictive membership criteria stem from political and fiscal relationships with federal and tribal governments, which (with help from interested individuals) patrol the boundaries of membership in these groups; who counts as “real” can be hotly contested (Garroutte 2003; Hagan 1985; Robertson 2013). American Indian tribes are nations with written citizenship rules—a person is either an enrolled tribal citizen or not (see Robertson 2013). American Indians who give a monoracial response may be using the race question to affirm this legal status (see U.S. Census Bureau 2008) and may not be intending to describe their family tree as unmixed. Monoracial Native Hawaiians and Alaska Natives may also be referencing political allegiances rather than family trees. If proof of indigenous heritage is not available, the family may avoid reporting the child as indigenous to avoid embarrassing social consequences (e.g., Bauerlein 2012). 5 In sum, I expect that children of interracially married indigenous people have tended to be reported as monoracial—either wholly indigenous or nonindigenous.
At the same time, others with more remote family histories and levels of cultural knowledge also claim membership in indigenous groups (with varying degrees of success in gaining legitimacy; see Jacobs 2015 and Sturm 2011). Pacific Islanders and others in Hawaii are famous for welcoming multiracialism (Rohrer 2008; Smith 1934; Spickard 2001; Spickard and Fong 1995) and for having a personal “consciousness of multiplicity” (Spickard 2001:23) that encourages mixed-race identities. Therefore, I also propose the opposite hypothesis to the above: because of the proportion of families with generations of mixed heritage, the presence of ongoing group conversations about authenticity, and traditions of openness toward multiracially-identified relatives, I expect that parents of mixed-heritage indigenous children have tended to report their child’s mixed heritage.
Methodology
Data
I use dense nonpublic data (housed in the Census Bureau’s Research Data Centers [RDCs]) from the decennial census long forms of 1960, 1970, 1980, 1990, and 2000 (each with 17 to 25 percent of the U.S. population) and the 2008–2010 ACS, which replaced the 2010 long form (including 4.5 percent of the population in that period). With such dense samples, I have sufficient cases to study detailed race/ancestry responses and can include five types of double-minority families. The nonpublic data also give detail on unsought multiple-race responses to the race question in 1980 (a few codes) and 1990 (many codes).
I begin the study period in 1960 despite the differences in question availability between years. I do this because social rules are continually changing and the description of a longer time span gives more complete evidence about whether and how social forces influence response choices. Since 1960, census responses have generally been provided by someone in the household rather than an enumerator. 6 Enumerators were asked to follow specific procedures for deciding the race to record for mixed-heritage children, while household respondents have been able to make reporting decisions based on the very same personal, family, and societal factors that sociologists would like to understand.
Sample selection
In order to be able to include all 11 family types throughout the period of study, my sample selection criteria maximize sample size. I exclude a small proportion of cases because a parent’s race or the child’s race was imputed by the Census Bureau or the child’s race response did not match either or both parents. My sample in each year consists of coresident children of a married monoracial householder and a different-race, monoracial, opposite-sex spouse. Unfortunately, some family configurations are left out of the study, including cohabiting couples, single-parent families, and families where one spouse was absent (e.g., active military). Married, present parents’ races are more salient in the home and relatively likely to be considered as part of the child’s race response. Thus, children in my study may be relatively likely to be presented as multiracial, as compared to children from the excluded family types.
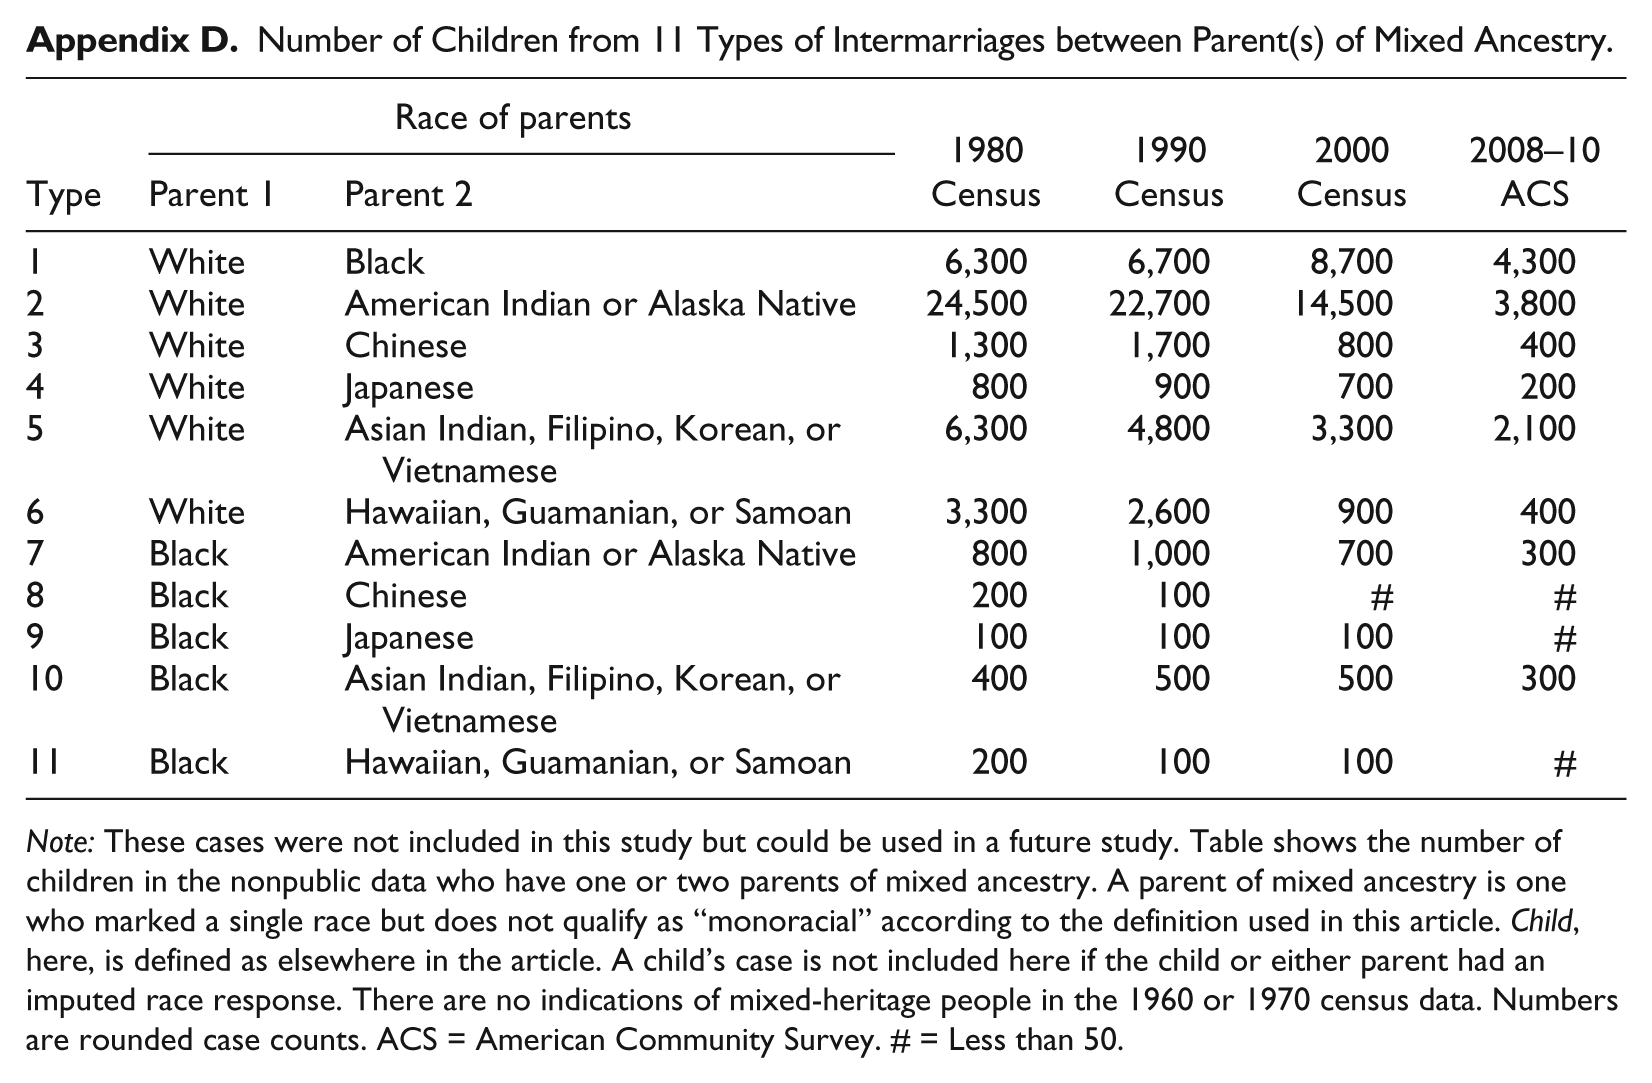
I limit this study to monoracial parents to improve comparability across families, groups, and time. If the parents’ responses reflect their heritages, all children in this study have equal claim to two race groups that are each represented on the questionnaire with a check box within the race question. Future researchers could study children with parents of mixed heritage (see Bratter 2007); these children probably have an uneven connection to the parent race groups and thus have response patterns that differ in interesting ways from those reported here. I excluded a child if his or her parent reported mixed heritage in the ancestry question, but (in Appendix D) I show the number excluded to encourage future research on these families. Additionally many other children have at least one multiple-race parent (in the nonpublic data: 1,900 in 1980; 5,300 in 1990; 238,800 in 2000; and 58,600 in the 2008–10 ACS).
This is a study of the “children” of householders as measured by the relationship question. The question’s categories have not always separated “natural-born” children from adopted children or stepchildren, which introduces some error. My samples include son/daughter (including adopted children and stepchildren) in 1960, 1970, and 1980; natural-born or adopted son or daughter (not a stepchild) in 1990; and natural-born or biological son or daughter (not a stepchild or adopted child) in 2000 and 2008–2010 ACS. I estimate that fewer than 5 percent of the children in the 1960-to-1990 samples are not biologically related to the householder. 7
Because the child might not be biologically related to the householder’s spouse, the child’s reported race will tend to match the race of the householder (usually the father 8 ). In all groups in my samples, children’s race reports do tend to match the race of the householder, whether this is the mother or the father (supplementary analysis not shown). Gendered patterns in intermarriage (Qian and Lichter 2011) mean that this could affect my results. In part-black families, for example, the black parent is often the father (and householder), so his child would tend toward being reported as black. In part-Asian families, the Asian parent is more often the mother (and householder’s spouse), so the child report would tend away from Asian.
I include all children of the householder regardless of age to achieve the numerical threshold needed for disclosure from the RDC. Public data on children like those in my study show that 28 to 34 percent are 18 or older (Ruggles et al. 2010). When I restrict my data to children ages 0 to 17 (in supplementary analyses with nonpublic data), I find similar results. The exception is that adult “children” tend toward monoracial responses, perhaps because older children are more likely to be the product of an earlier union (perhaps a first union), and first unions are less often interracial (see Fu 2010).
In Table 1, I list the 11 parent race combinations and the approximate (unweighted) number of children in the data in each family type. Including double-minority families is rare in prior research and has been cited as an important avenue for expansion (Hall and Turner 2001). Because I include five types of double-minority families, I extend knowledge about the families themselves and also provide multiple indications of the membership criteria for each race group. For example, similarities for children of white–American Indian heritage and black–American Indian heritage point to American Indian group boundaries as the common cause.
Approximate (Unweighted) Number of Children in Data.

Note: See text for sample selection details and see Appendix C for ancestry responses used to define a parent as “monoracial.”
Note that strong conclusions about change over time are not prudent because of cross-time changes in who is in the samples. For example, who is considered a “child” changes as stepchildren and adopted children are gradually identified (and excluded). Parents have had increasing opportunities to report their own mixed heritage (and be excluded). The chances that a stepfamily will be erroneously included in the sample varies as stepfamilies become more common, custody arrangements become more equal, and fathers become less likely to be reported as householders. In sum, comparisons across time points should be done with care. Despite these issues, there are three cross-year comparisons that are relatively sound because of key similarities in question wording: 1960 to 1970, 1980 to 1990, and 2000 to the 2008–2010 ACS.
Measurement
Measuring race
The race question has changed considerably over the years in this study (see Appendix A). Multiple-race responses were first invited in 2000, but multiple-race codes are in the nonpublic data beginning in 1980. The number of race check-box categories has also increased during this period, as shown in Appendix B. I use only parent race categories that were presented as check box answers to maximize the extent to which parents are equally represented.
To achieve sufficient sample size for confidentiality, I present combined results for families with a parent who is Hawaiian, Guamanian, or Samoan (Pacific Islander groups). Similar research on 1990 showed that children of interracially married Pacific Islanders have relatively similar racial identification patterns and that these groups can be combined for analysis (Liebler and Kana’iaupuni 2003–2004). Rather than exclude them for small sample sizes, I analyze families with a parent who is Asian Indian, Filipino, Korean, or Vietnamese and present their combined results. These groups have distinct socioeconomic profiles and immigration histories (Qian and Shah 2015; Takaki 1998) and their joint results should be interpreted cautiously.
Measuring ancestry
In 1980, the Census Bureau began collecting ancestry data with an open-ended question (“What is this person’s ancestry or ethnic origin?”) and coded the first two responses. This question (in Appendix A) was asked in each census since 1980 and is also in the ACS. I code most ancestry responses as suggestive of a particular racial heritage (see Appendix C), following Goldstein and Morning (2000, 2002) and Gullickson and Morning (2011). As listed in Appendix C, I use vague ancestry responses (such as “Asian”) given for children to, for example, code a black–Chinese child as “black with Chinese ancestry.” I code the child based only on the reported race(s) (e.g., X race with no Y ancestry) when all ancestry information was ambiguous, when there was no ancestry response, and when both parents’ races were represented in the race response. Relative to excluding cases with no codable ancestry, by ignoring uncodable ancestry responses I increased the proportion of children coded as monoracial.
Measuring the child’s reported heritage
In the Results, I present the distribution of children’s race/ancestry reports (percentages) within family type and year. Responses that were technically possible but extremely rare are not included in the results. Because only the race question was asked in 1960 and 1970 and no unsolicited race responses were included in the data, the primary variable those years has only two categories: one parent’s single race or the other parent’s single race. In the other four data sets, for each interracially married couple X–Y, I show the proportion of children reported as race X alone, race X with ancestry Y, races X and Y, race Y with ancestry X, or race Y alone.
Results
Social rules defining the boundaries of race groups are reflected in the race and ancestry responses given for/by mixed-heritage children who have equal claim to two socially distinct race groups. I weight my results to represent all children in each family type at the time and present them in two tables: Table 2 for children with one white parent and Table 3 for children with two parents of color. Figures 1, 2, and 3 are visual representations of the same information. I use these results to address my hypotheses.
Child’s Race and Ancestry (in percentages) in Families with Interracially Married Monoracial Householder and Spouse: Six Types of Families with a White Parent and a Nonwhite Parent, 1960 to 2010.
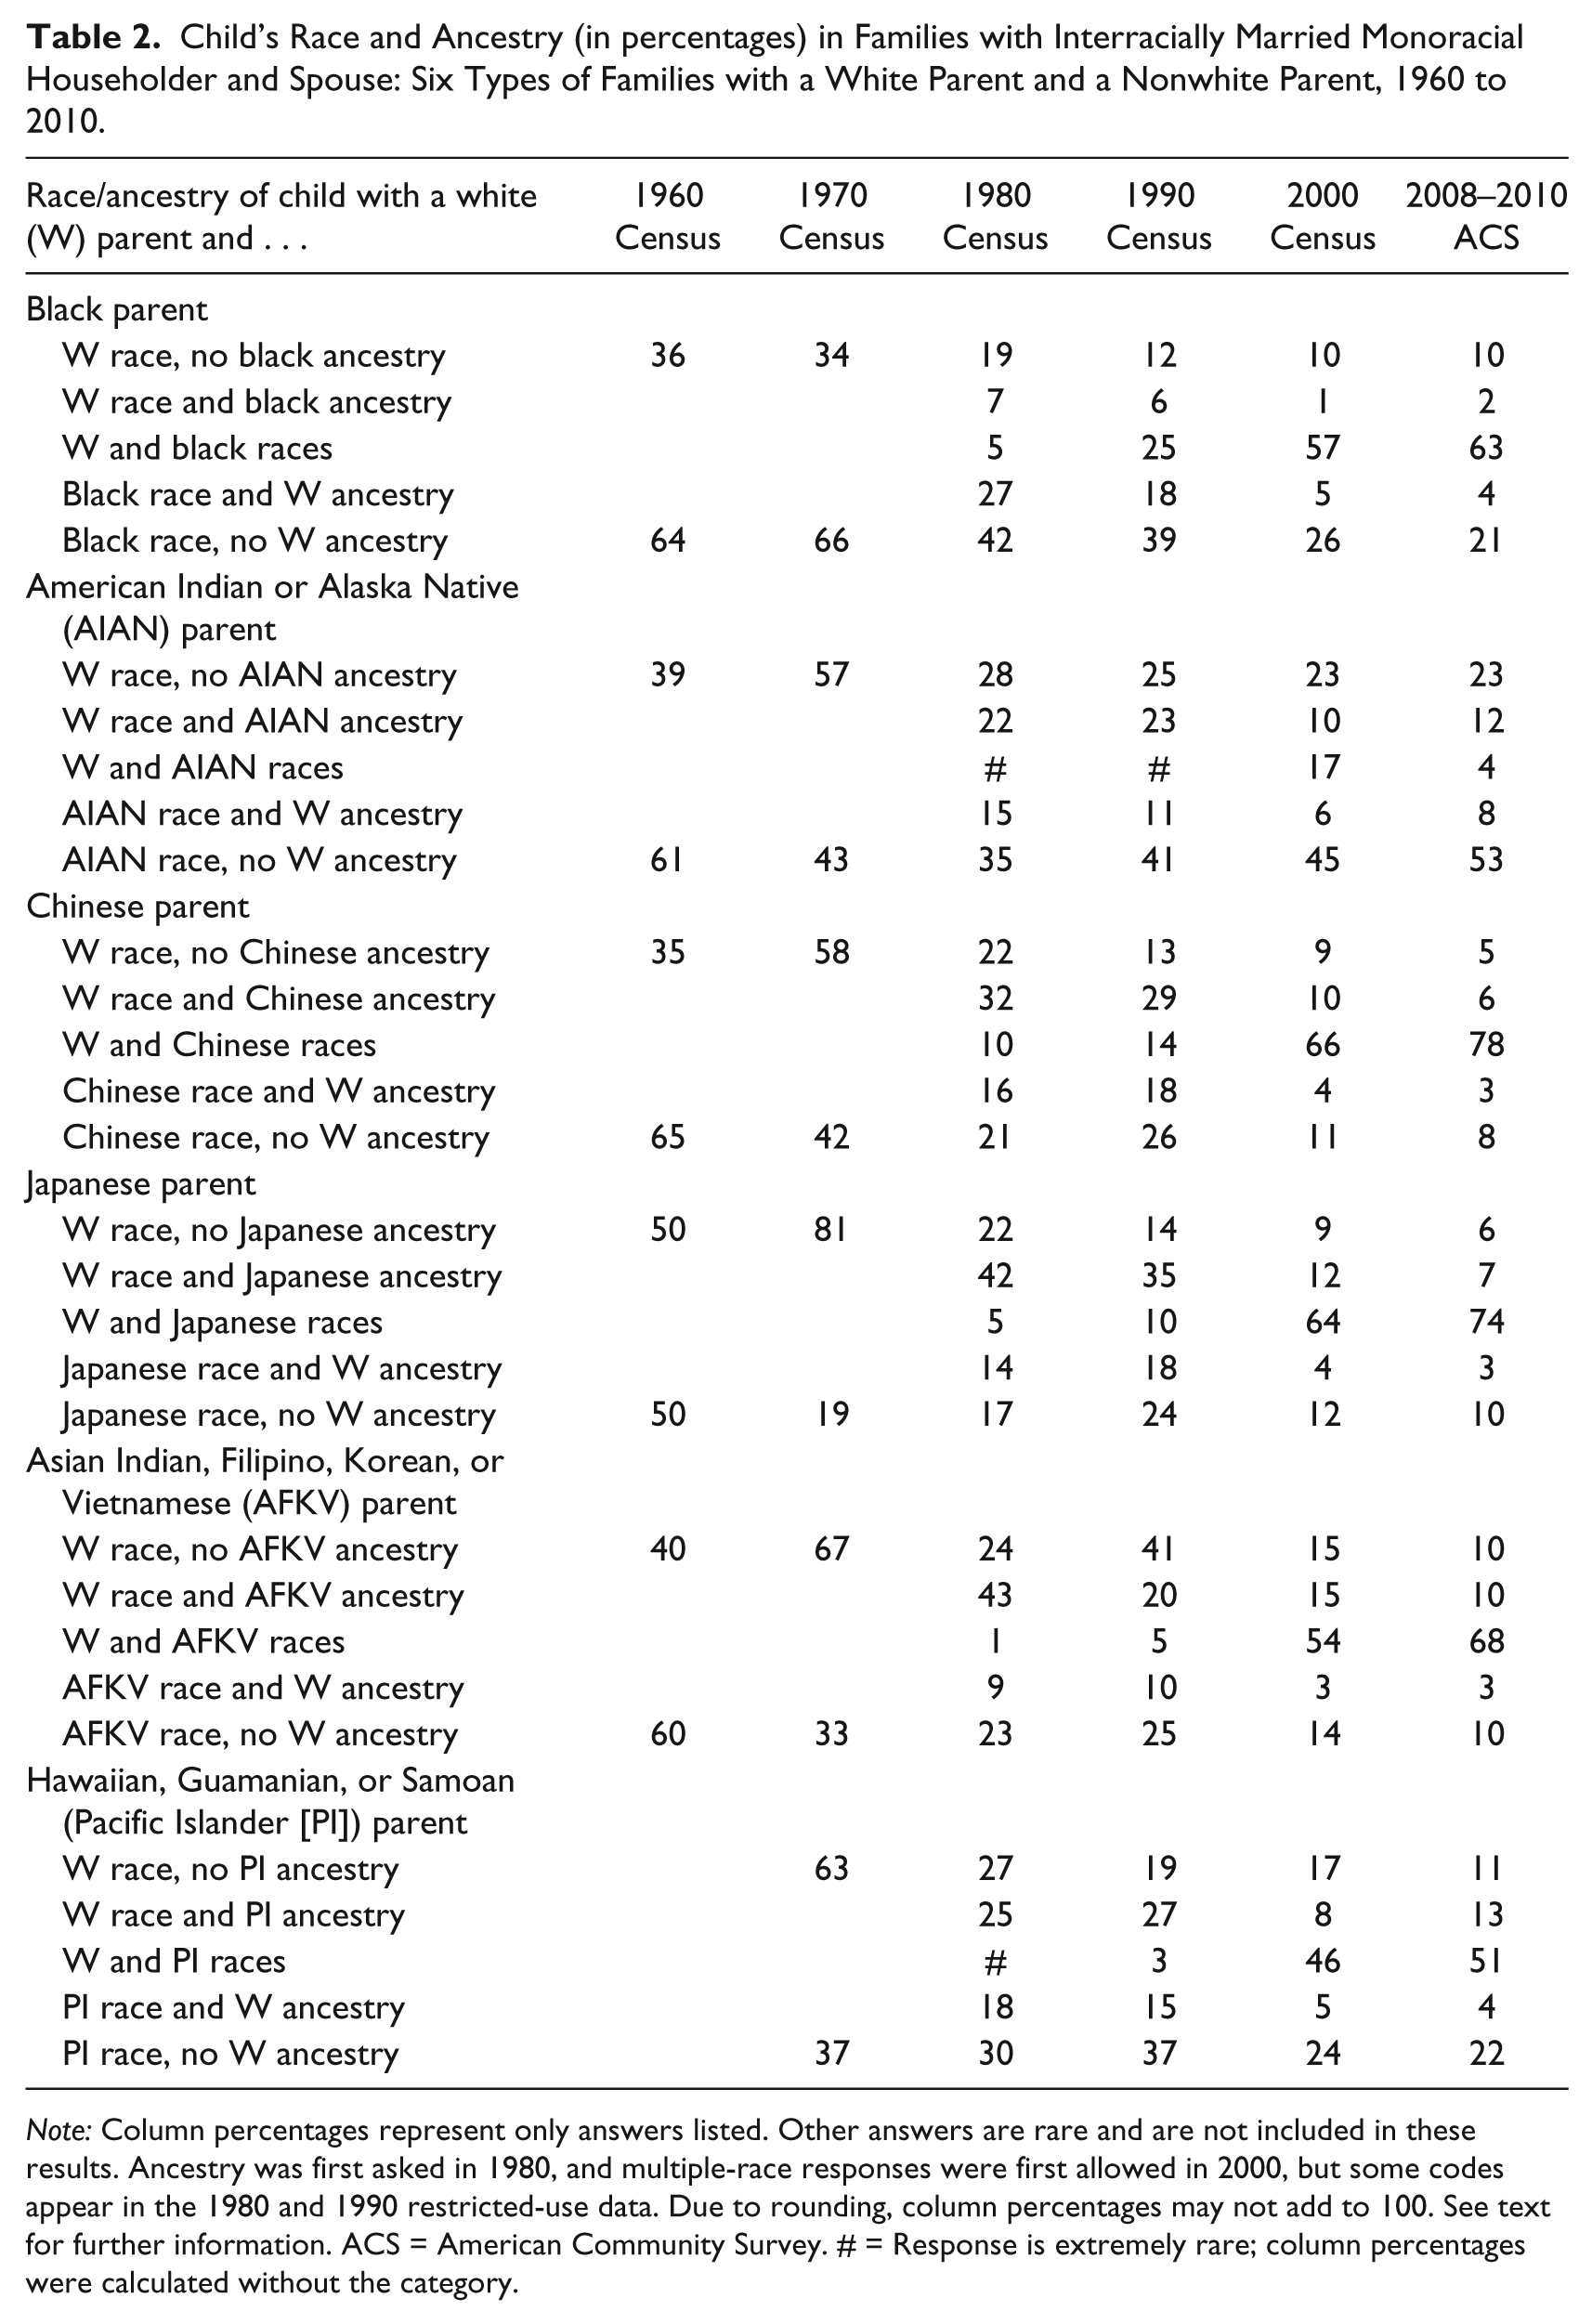
Note: Column percentages represent only answers listed. Other answers are rare and are not included in these results. Ancestry was first asked in 1980, and multiple-race responses were first allowed in 2000, but some codes appear in the 1980 and 1990 restricted-use data. Due to rounding, column percentages may not add to 100. See text for further information. ACS = American Community Survey. # = Response is extremely rare; column percentages were calculated without the category.
Child’s Race and Ancestry (in percentages) in Families with Interracially Married Monoracial Householder and Spouse: Five Types of Double-minority Families with a Black Parent and a Nonblack Parent, 1960 to 2010.

Note: Column percentages represent only answers listed. Other answers are rare and are not included in these results. Ancestry was first asked in 1980, and multiple-race responses were first allowed in 2000, but some codes appear in the 1980 and 1990 restricted-use data. Due to rounding, column percentages may not add to 100. See text for further information. ACS = American Community Survey. # = Response is extremely rare; column percentages were calculated without the category.

Child’s race and ancestry in families with interracially married monoracial householder and spouse: Six types of families with a white parent and a nonwhite parent, 1960 to 2010.
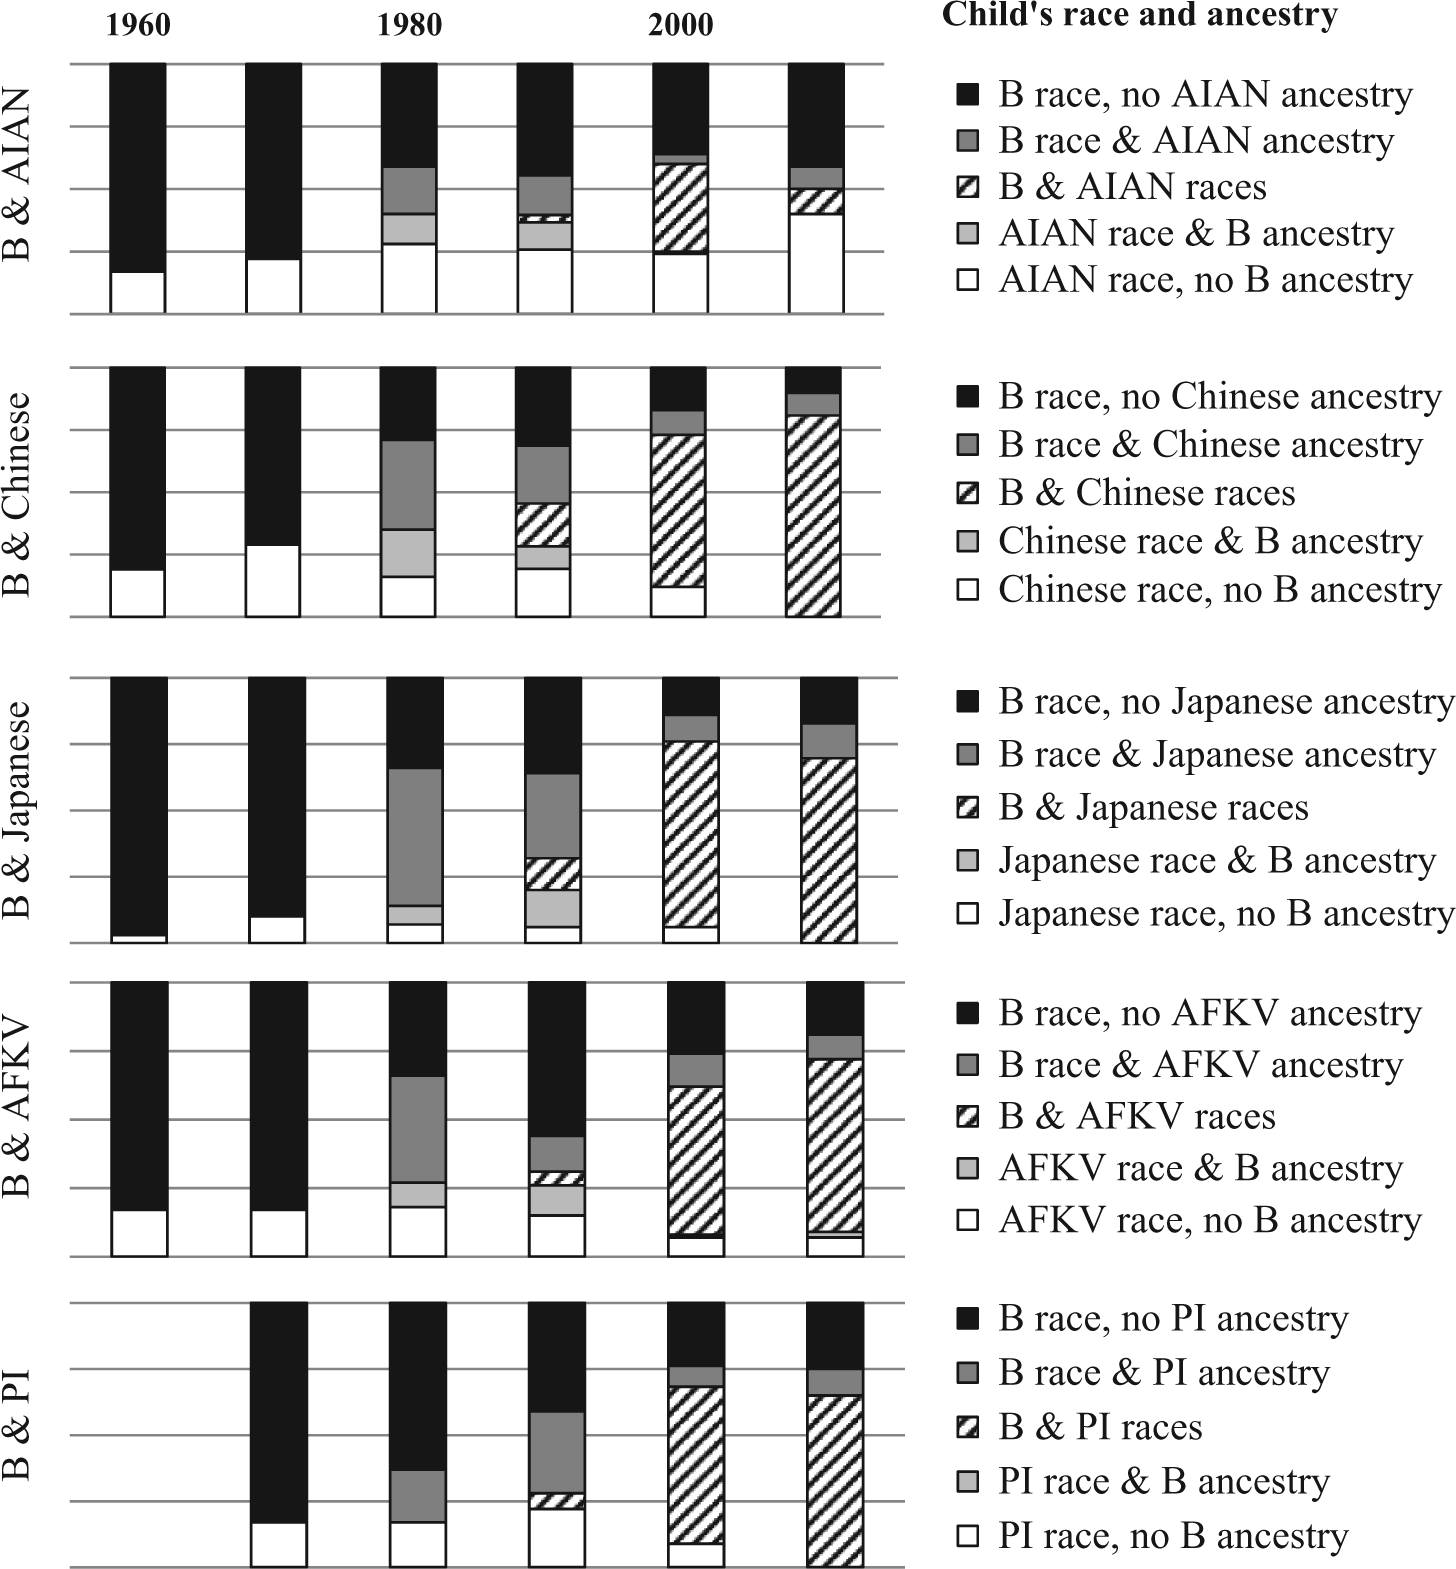
Child’s race and ancestry in families with interracially married monoracial householder and spouse: Five types of double-minority families with a black parent and a nonblack parent, 1960 to 2010.
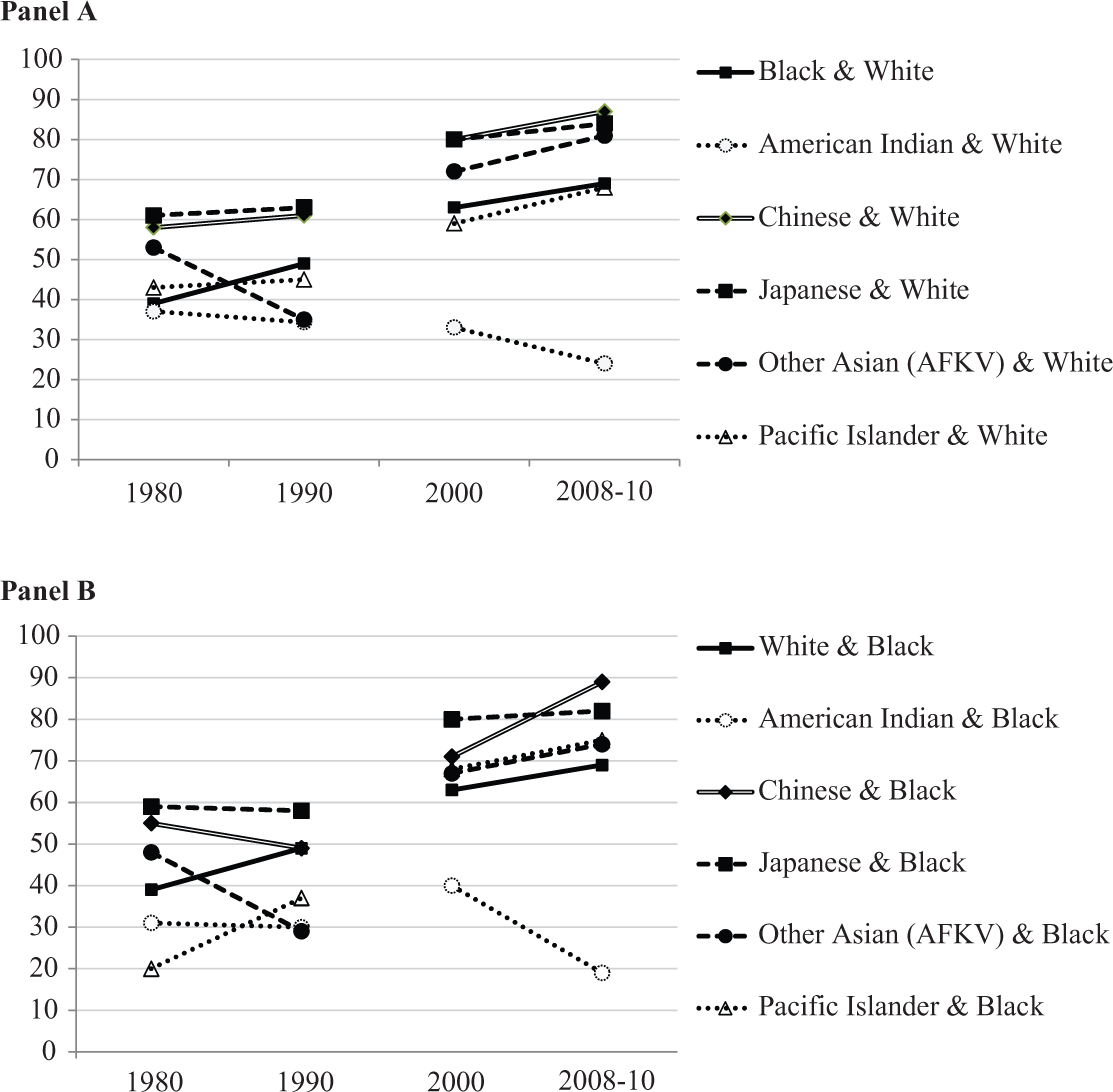
Percentages of children reported as having mixed heritage, 1980 to 2010. Panel A: Mixed-heritage reports among children with a white parent. Panel B: Mixed-heritage reports among children with a black parent.
Focus on Mixed Heritage
I expected that children of interracially married parents would have been predominantly reported as mixed heritage (either mixed ancestry or multiracial) since 1980. On the contrary, the results show that these children’s mixed heritage is often hidden (see Tables 2 and 3 and Figures 1 and 2). Among non-Asians, one third to one half of the children were reported as monoracial—in other words, they were reported as one race with no sign of the other parent’s background in the race or ancestry responses. In these cases, one parent’s group experienced attrition (Duncan and Trejo 2011) while the other parent’s group absorbed a first-generation mixed-race person into its ranks. These results show that the black and American Indian groups have more often absorbed children of mixed heritage, and the white and Asian groups have been receiving few “monoracial” children of mixed heritage. Part-Chinese and part-Japanese children in recent decades have been the exception, with 61 to 80 percent of children reported as multiple race.
I also expected that children would be reported as multiple race rather than a race/ancestry combination. Because multiple-race responses in the data were unsolicited in 1980 and 1990, this hypothesis is best addressed with data from 2000 and later. Results show that multiple-race responses have been more common than mixed-race/ancestry responses in all almost all groups since 2000. Notably, however, in all years since 1980 and in most family types, one tenth to one fifth of families gave a single-race response and used the ancestry question to express their nuanced preferences in a way that privileges one group over the other.
Increase over Time
I expected to see an increase over time in the formal disclosure of a child’s mixed heritage with the idea that strict enforcement of socially constructed rules has fallen out of vogue. Cross-year variation in the types of families in the sample limits the ability to make a strong test of this idea. To make a beginning, in Figure 3 I depict cross-time changes in the proportion of responses that are mixed heritage of any kind.
Between 1980 and 1990, when mixed heritage was reported via the ancestry question or by unsolicited multiple-race responses, there was not a clear upward trend in the prevalence of mixed-heritage reports; mixed-heritage responses were about as common in 1990 as in 1980: between 35 and 60 percent in most groups. In the second period shown (2000 to 2010), there was more of a clear increase in mixed-heritage responses. This later period included more widespread and intricate societywide conversations focused on mixed-heritage people’s need to be socially and officially allowed to self-define as multiracial.
As expected, there was a jump in mixed responses between 1990 (when one race response was requested) and 2000 (when the race question instructed respondents to “mark one or more”). However, because mixed-heritage responses were fairly common already in 1990, the overall increase in mixed-heritage reports in 2000 was moderate. Though the race question wording shifted the specific ways in which this was reported, children of interracially married couples have been reported as mixed heritage since at least 1980.
Group Differences
Beyond a tendency to report mixed heritage, I anticipated cross-group variation in the social construction of race. Specifically, I expected group-specific histories, racial formation projects, and orientation toward other groups to influence patterns in children’s reported racial heritage.
White
I expected few part-white children to be reported monoracially white, with relatively more white responses in the earliest years. In a notable departure from the supposedly dominant “one-drop rule” of blackness (Davis 2001), over one third of black–white children were reported as white in 1960 and 1970. In 1960, a similarly large proportion of American Indian–, Chinese–, and Filipino–white children were also reported as white. After 1970, the pattern shifted away from monoracial white responses; a small and decreasing proportion of part-white children were reported as monoracially white (with the exception of white–American Indians). It is possible that the white race boundary is becoming less permeable (with the exception of white–American Indians) as the “multiracial” option becomes a more viable alternative (ProjectRACE n.d.; OMB 1997).
Asian
In the past half century, part-Asian children have been rarely reported as only Asian. In 1970, when mixed heritage could not be reported, white–Asian and black–Asian children were almost always reported as their non-Asian parent’s race. In later years, monoracial Asian responses remained rare in a way that parallels the white group. Like part whites, socially enforced norms and internalized preferences seem to strongly discourage a monoracial response (whether Asian, white, or black) by/for a part Asian. Importantly for social and statistical reasons, the part-Asian children have not been disappearing from the enumerated Asian group (if ancestry reports are utilized); most have been reported as mixed whenever possible.
Black
Given the social history and legal definitions of blacks in the United States, I expected part-black children to be often reported as monoracially black and rarely as single-race nonblack. My results show that monoracial black responses have been common—about twice as common as monoracial-nonblack responses in most double-minority family types. However, monoracial black has almost never been the modal response; mixed ancestry and multiple race have been widely used. Children of black–Asian and black–Pacific Islander intermarriages are rarely reported as monoracially Asian/Pacific Islander; perhaps the long-standing definition of Asians in contrast to “racial triangulation” with blacks (Kim 1999) has specifically disallowed an Asian-race claim from someone with black heritage.
Indigenous peoples
I proposed two contradictory hypotheses about indigenous children of mixed heritage. The results support one of these: the idea that political standing (e.g., tribal enrollment) encourages monoracial American Indian identification for some and non–American Indian identification for others. The proportion of white–American Indians reported as monoracially American Indian has been high and steady, while the proportion of black–American Indians reported as monoracially American Indian has been increasing. These patterns are in clear contrast to the other nine types of families in which children are increasingly reported as mixed. Very few children with an American Indian parent were reported as multiracial or mixed heritage. Part–Pacific Islander children (some of whom are indigenous Native Hawaiians) are more similar to the other groups in the study but have tended to be reported as single race more often than part-Asian children, lending support to the same hypothesis that political considerations can provide an important and persistent push toward monoracial responses.
Discussion and Implications
People report mixed heritage for a variety of reasons that apply to the children of interracial marriages studied here. Many people of mixed-race heritage report feeling both inside and outside the boundaries of their component groups (e.g., Anzaldúa 2007; Rockquemore 1999; Root 1996; Tashiro 2011) and uncomfortable identifying with just one group. A race group may be socially defined in exclusion or opposition to another group, thus imposing normative constraints against a mixed-heritage person fully identifying with that group. Alternatively, interracially married parents may wish to be equally represented to the outside world and therefore push against imposed group boundary norms (e.g., the “one-drop rule” of blackness).
Most analysts ignore substantial information about a person’s heritage by relying only on an individual’s answer to the race question to identify race group members. This simplification draws a deceptively clean line between race groups. My results show that an analyst using this strategy would identify as mixed heritage only half to three quarters of the children of the interracially married couples studied here (fewer part American Indians; also see Pew Research Center 2015). Researchers and theorists (see Song 2004) hoping to understand the experiences and characteristics of people with ties to a specific group would do better to use the full range of information available, including family members’ race responses and responses to the ancestry question.
Children of interracial marriages are not universally reported as mixed heritage; in all years, a sizable proportion of the non-Asian mixed-heritage children were described as monoracial. This is notable because the children in this study are probably among people most likely to be reported as mixed—they live with parents from two different race groups. Their specific monoracial responses are telling about group boundaries—monoracial white and monoracial Asian responses are rare for white–Asians, black–Asians, and white–blacks, implying that the boundaries of white and Asian are defined in contrast to one another and to the black group. This is consistent with the racial triangulation hypothesis proposed by Kim (1999). Monoracial black responses are common (though not as common as some would predict), highlighting the well-known inclusiveness of the definition of “black.” This is not always reciprocated; for example, there is an uneven overlap between black and Pacific Islander such that a variety of responses are common so long as black is named as a race.
Part American Indians are exceptionally likely to be reported as monoracial (white or black or American Indian). This may reveal a distinct form of group boundary definition due to the sociopolitical context. Government entities and group members have a stake in who is considered American Indian, formal membership criteria are legally defined (Robertson 2013), and some see the identity as more about nation than race (U.S. Census Bureau 2008). My results seem to show that people tend to fall on one side or the other of this boundary. Those white– and black–American Indians who for some reason do not identify as American Indian might find that a monoracial white or monoracial black response is socially acceptable because of overlap in the race group boundaries.
Readers, analysts, and theorists must keep in mind, however, that social forces and personal identities shift such that a person’s race and ancestry response can change over time (Lieberson and Waters 1993; Liebler et al. 2014; Mowen and Stansfield 2015). The people in this study—first-generation mixed-heritage children—are probably among those most likely to change their race/ancestry responses if asked again when different social pressures are in play.
Children of interracially married parents have been reported as mixed heritage since at least 1980 and increasingly so with the change in race question wording. This pattern makes it clear that a “mixed” response is not simply a reaction to the new race question or to recent social change. Instead, families of mixed-heritage children have long been interested in expressing the child’s diverse heritage to outsiders.
Multiracial responses are extremely common among the part-Asian children in this study and also quite common among part blacks. The prior research that highlights the social emphasis on “just black” (e.g., Davis 2001) is focused on the legal and “social other” views of a part-black person’s race. In-home identification (as done in the census) is not so simple, and there is likely more to be revealed by qualitative research (Rockquemore and Brunsma 2007; Tashiro 2011). Demographic predominance is a key to the development of new race groups (Bashi 1998) and could drive racial formation processes (Omi and Winant 1994). Thus, we may see Asian multiracial and black multiracial develop as socially (if not federally) recognized race groups (see King and DaCosta 1996).
Overall, I have shown social patterning in the range of responses deemed plausible for a child who has equal claim to two major race groups. I found that not all response options are used, and there can be change in the set of socially viable claims. Social constraints on mixed-heritage people’s group membership can cause race group attrition and thus affect the size, location, and characteristics of various race populations and how these transform over time. The race data collected in censuses and surveys and analyzed by social researchers, and indeed, the boundaries of the race groups themselves, are affected by race response choices made by people in multiracial families.
Future research can build on these results in at least four ways. First, children whose parents, grandparents, or other ancestors were mixed heritage may have different response patterns than the children in this study because of varying connection to the groups in their family tree. Case counts show that the nonpublic data can support a separate analysis of these children. Second, in a small proportion of cases, siblings’ race/ancestry reports differ, perhaps due to variations in phenotype, friendship groups, experiences, and interest. With more suitable data (e.g., data collected separately for each sibling), a researcher could identify personal factors causing within-family variation in responses. Third, there is room to expand the tradition of multivariate models by predicting a child’s race/ancestry/Hispanic response with focus on diverse family race compositions (e.g., single-parent families and cohabiting couples) and including multiple decades. And fourth, if data were available on the parental race(s) of people who do not live with their parents, a researcher could improve understanding of how these processes play out among adults of mixed heritage.
My results are consistent with prior research, but stretch knowledge about boundaries of race groups in the United States over half a century. I illustrate changes in society during a period when interracial marriage became more common, the “multiracial” race project was established, and the Census Bureau’s question wording was revised. By including double minorities, I expand information about these groups, viewing within-group continuities in how race responses are assigned and delving more deeply into constraints affecting membership in America’s race groups. These expansions are particularly robust, even for rare groups, because the nonpublic census data are dense and contain information about multiple-race and mixed-heritage responses in 1980 and 1990, decades before federal rules acknowledged people of mixed racial heritage.
Footnotes
Appendix
Number of Children from 11 Types of Intermarriages between Parent(s) of Mixed Ancestry.
| Race of parents |
1980 Census | 1990 Census | 2000 Census | 2008–10 ACS | ||
|---|---|---|---|---|---|---|
| Type | Parent 1 | Parent 2 | ||||
| 1 | White | Black | 6,300 | 6,700 | 8,700 | 4,300 |
| 2 | White | American Indian or Alaska Native | 24,500 | 22,700 | 14,500 | 3,800 |
| 3 | White | Chinese | 1,300 | 1,700 | 800 | 400 |
| 4 | White | Japanese | 800 | 900 | 700 | 200 |
| 5 | White | Asian Indian, Filipino, Korean, or Vietnamese | 6,300 | 4,800 | 3,300 | 2,100 |
| 6 | White | Hawaiian, Guamanian, or Samoan | 3,300 | 2,600 | 900 | 400 |
| 7 | Black | American Indian or Alaska Native | 800 | 1,000 | 700 | 300 |
| 8 | Black | Chinese | 200 | 100 | # | # |
| 9 | Black | Japanese | 100 | 100 | 100 | # |
| 10 | Black | Asian Indian, Filipino, Korean, or Vietnamese | 400 | 500 | 500 | 300 |
| 11 | Black | Hawaiian, Guamanian, or Samoan | 200 | 100 | 100 | # |
Note: These cases were not included in this study but could be used in a future study. Table shows the number of children in the nonpublic data who have one or two parents of mixed ancestry. A parent of mixed ancestry is one who marked a single race but does not qualify as “monoracial” according to the definition used in this article. Child, here, is defined as elsewhere in the article. A child’s case is not included here if the child or either parent had an imputed race response. There are no indications of mixed-heritage people in the 1960 or 1970 census data. Numbers are rounded case counts. ACS = American Community Survey. # = Less than 50.
Acknowledgements
I am grateful to the Minnesota Research Data Center (MnRDC) Small Grants Program for financial support and to Marie DeRousse-Wu for helpful research assistance. I thank Caren Arbeit, Julia Rivera Drew, Catherine Fitch, Liying Luo, and the anonymous reviewers for their comments. This research was conducted in the MnRDC, which receives funding from the National Science Foundation (SES-0851417). I also gratefully acknowledge support from the Minnesota Population Center, which is funded by a center grant from the National Institutes of Health (R24-HD041023). A version of this research has been published as Census Bureau Center for Economic Studies discussion paper 12-24.
Author’s Note
Any opinions and conclusions expressed herein are those of the author and do not necessarily represent the views of the U.S. Census Bureau. All results have been reviewed to ensure that no confidential information is disclosed.