
Abstract
The U.S. labor market is increasingly made up of immigrant workers, and considerable research has focused on occupational segregation as an indicator of their labor market incorporation. However, most studies focus on Hispanic populations, excluding one of the fastest growing immigrant groups: foreign-born blacks. Because of their shared race, African and Caribbean immigrants may experience the same structural barriers as U.S.-born blacks. However, researchers hypothesize that black immigrants are advantaged in the labor market relative to U.S.-born blacks because of social network hiring and less discrimination by employers. Using 2011–2015 pooled American Community Survey data, this study is among the first quantitative studies to examine black immigrants’ occupational segregation in the United States. The authors use the Duncan and Duncan Dissimilarity Index to estimate black immigrants’ segregation from U.S.-born whites and blacks and regression analyses to identify predictors of occupational segregation. Consistent with previous work focusing on Hispanic immigrants, foreign-born blacks are highly overrepresented in a few occupations. African and Caribbean immigrants experience more occupational segregation from whites than the U.S.-born, with African immigrants most segregated. Africans are also more segregated from U.S.-born blacks than Caribbean immigrants. Results of the regression analyses suggest that African immigrants are penalized rather than rewarded for educational attainment. The authors find that the size of the coethnic population and the share of coethnics who are self-employed are associated with a decline in occupational segregation. Future research is needed to determine the impact of lower occupational segregation on the income of self-employed black immigrants.
Occupational segregation, the systematic concentration of groups of workers in particular jobs (Gauchat, Kelly, and Wallace 2012), has long been a feature of the U.S. labor market. Despite segregation declines over the past few decades (Blau, Brummund, and Liu 2013), women still occupy a more constrained position in the labor market than men, and black workers are most concentrated in low-paying occupations (Alonso-Villar, del Río, and Gradin 2012). A growing body of evidence suggests that immigrants are similarly clustered in low-skilled occupations (Catanzarite 2000; Hellerstein 2008). However, much of the research is defined by a focus on immigrant men and/or Hispanic populations. Within the small black immigrant literature, the vast majority is qualitative work (e.g., Abdi 2012; Brettell 2011), which provides important evidence of black immigrants’ workplace experiences but necessarily focuses on a single location or specific occupations. This study addresses these gaps in the literature by using quantitative analysis to determine black immigrants’ occupational segregation. To do so, we examine black immigrants’ occupational segregation in the United States using large-scale data and determine whether segregation patterns and predictors vary by region of birth.
The U.S. labor force is increasingly made up of immigrant workers; the foreign-born constitute 17 percent of the labor force, up from 13.3 percent in 2000 (BLS 2017). The black immigrant population has also increased dramatically since 2000: the Caribbean and African populations have increased by 33 percent and 137 percent, respectively, resulting in a 56 percent increase in the total black immigrant population (Anderson 2015). Black immigrants are overwhelmingly adults, have the highest English proficiency of all immigrants (74 percent are proficient English speakers), and hold degrees at similar rates as Americans overall (Anderson 2015). Consequently, black immigrants should be well placed for labor market success in the United States. Indeed, with the largest labor force participation (LFP) rate of any immigrant group (70 percent) (BLS 2017), black immigrants constitute a disproportionately large, and growing, share of the U.S. labor force.
Despite their positive socioeconomic characteristics, black immigrants earn significantly less than other immigrants and U.S.-born whites (Dodoo and Takyi 2002; Hamilton 2014). Few studies examine black immigrants’ occupational outcomes, but those that do show that black immigrants experience occupational inequalities (Thomas 2014) leading to high rates of overeducation that have negative implications for their economic well-being and that of their children (Tesfai 2017; Thomas 2015). Both African (Covington-Ward 2017) and Caribbean (Branker 2017) immigrants work in jobs they know have no long-term future because employers have negative perceptions of their skills. This is true even among the second generation, who describe discrimination as occurring at key points in their career (Imoagene 2018). Hamilton, Easley, and Dixon’s (2018) study suggests that occupation is one of the most important factors in black immigrants’ socioeconomic attainment. What remains unclear is whether previous findings reflect a much broader influence of race on black immigrants’ outcomes that extends to occupational segregation.
There is extensive evidence showing that the labor market context in which black immigrant incorporation occurs is characterized by systematic patterns of racial discrimination that negatively affect blacks’ occupational attainment. This disadvantage is likely to be experienced at various stages of employment. During the hiring process, black applicants are less preferred compared with white applicants (Moss and Tilly 2003). At the same time, when hiring workers for low-skilled jobs, employers exhibit greater preferences for blacks (Stewart and Perlow 2001), leading to occupational segregation. Black immigrant incorporation further occurs in a labor market in which race is a barrier to mobility between occupations. Among the employed, blacks are less likely to be promoted into managerial or supervisory positions compared with whites (Maume 1999). For example, Nigerian immigrants describe never experiencing discrimination in terms of getting a job but report being passed over for promotions (Brettell 2011). Together, hiring and promotion disadvantages contribute to black immigrants’ relative underrepresentation in high-skilled jobs (Queneau 2009).
Preferences for hiring and promotion likely vary by gender. Intersectionality theory states that each person belongs to multiple social categories simultaneously and that group identities are based on the intersections of race, nativity, and gender (Ghavami and Peplau 2012). Ideas of race and ethnicity are constructed with gendered meanings (Browne and Misra 2003), therefore women occupy different positions in society (Alonso-Villar, Gradin, and del Río 2013). Although studies find both occupational racial/ethnic segregation within genders and occupational gender segregation within race/ethnicity (Mintz and Krymkowski 2010), results may obscure the specific situation of black immigrant women (del Río and Alonso-Villar 2015). Taken together, occupational segregation research findings point to a need for studies examining whether black immigrants’ occupational segregation reflects a disadvantage associated with their nativity, race, and gender.
In this study, we investigate black immigrant men’s and women’s occupational segregation and conduct regression analyses measuring differences in predictors of black immigrants’ segregation patterns. Specifically, we use 2011–2015 U.S. American Community Survey (ACS) data to examine the following questions: (1) Do black immigrants’ occupational segregation patterns mirror that of U.S.-born blacks? (2) Are black immigrants, like Hispanic immigrants (Catanzarite 2000) and (to a lesser extent) U.S.-born blacks (Semyonov and Herring 2007), restricted to low-skill occupations? (3) Are black immigrant women’s segregation patterns different from that of immigrant men? Finally, (4) are there differences in occupational segregation among black immigrants?
Background
According to human capital theory, occupational differences among groups are attributable to workers’ education and skills (Cotter, Hermsen, and Vanneman 2003). Women, immigrants, and racial minorities are all considered disadvantaged on the labor market because they have less human capital (Schrover, van der Leun, and Quispel 2007), with the sources of disadvantage varying by group. Sex differences in human capital are largely limited to job training and work experience (Reskin and Bielby 2005; Tomaskovic-Devey 1993) because men monopolize privileged positions in the workplace (Reskin 1988) and there are gendered assumptions regarding workplace power relations (Tomaskovic-Devey and Skaggs 2002). Thus, women may self-select into female-dominated occupations (Becker 1981) because they require less investment in training (i.e. less human capital) (Cotter et al. 2003).
Although women’s human capital disadvantage is based on differences in skill investment, immigrants’ disadvantage is attributable to foreign credentials. Degrees obtained in the home country may be a poor match to the U.S. labor market or may be of poorer quality than U.S. equivalents. Controlling for human capital significantly reduces the segregation of minority groups with large shares of recent immigrants (Alonso-Villar et al. 2012). However, black segregation levels only increase after controlling for human capital. A smaller share of blacks’ occupational segregation can be attributed to human capital than Hispanics and Asians (Gradin 2013), and little of blacks’ occupational segregation is explained by low educational attainment (Hellerstein 2008). These results indicate that blacks and whites with similar human capital characteristics experience very different employment outcomes.
After controlling for human capital, occupational segregation based on race (Hellerstein 2008), gender (Gradin 2013), and nativity (Chiswick and Miller 2009) still remains. Consequently, human capital alone cannot explain occupational segregation. Theoretical work focuses largely on two explanations for occupational segregation: the social networking model and discrimination.
Social Networking Model
Individuals look for jobs through formal and informal searches. In a formal search, individuals use employment agencies or classified ads to look for employment (Granovetter 1974). During informal searches, in contrast, individuals obtain information through interpersonal relationships (Marsden and Gorman 2001). In its focus on the informal job search, the social networking model refers to how individuals are channeled into certain jobs through their friends, family, and acquaintances.
Immigrant social networks are based largely on ethnic ties comprising the social capital they can draw on to obtain employment (Portes 1995). Consistent with social networking theory (Ellis and Wright 1999), research indicates that coethnic ties contribute to immigrants’ employment throughout their metropolitan area labor markets (Sanders, Nee, and Sernau 2002). Networks not only help immigrants find jobs, but employers prefer to hire workers using networks because it saves time and money (Ellis, Wright, and Parks 2007). Individuals recommend only coethnic group members who are hard working and reliable (Waldinger and Lichter 2003), decreasing hiring costs.
Although coethnic social networks lead to immigrant employment, these networks concentrate immigrants in particular sectors of the labor market (Ellis and Wright 1999). U.S.-born minorities experience similar disadvantages because their networks are different and more restricted than U.S.-born whites (Bonacich 1973). Using social networks reduces occupational prestige and increases their chances of being employed in a workplace composed largely of minority workers (Falcon and Melendez 2001). The occupational disadvantage of using social networks seems most consistent for blacks. Use of social networks only increases blacks’ likelihood of entering a racially homogenous job (Elliott 2001).
Because of the combination of their race and nativity, black immigrants may be the most segregated group in the United States labor market. However, there may be variation within this group. Most social networks are based largely on preferences for individuals similar to themselves (homophily) (McDonald 2011), and although homophily is usually applied to social networks’ gender, race, and nativity characteristics, it also applies to skill level. Thirty-five percent of Africans older than 25 years had college degrees or higher in 2013 (compared with 20 percent of Caribbean immigrants) (Anderson 2015). Africans’ high educational characteristics may mean that their coethnic social networks include more highly educated individuals, leaving them less segregated from whites in the workforce.
Gender may also affect the utility of black immigrants’ social network. Although networks are largely discussed in a gender-neutral form, gender plays an important role in the jobs accessed through social networks. Ethnic networks tend to be gender segregated. Because women’s networks contain fewer men (Marsden and Gorman 2001), their networks consist mostly of information about jobs into which women are segregated (Hanson and Pratt 1991). Among immigrants, the social networks providing men and women with job information are only distantly related, therefore immigrant women are more likely to enter occupations with immigrant women regardless of nativity than into jobs with coethnic men (Wright and Ellis 2000). Consequently, black immigrant men and women are clustered in different occupations (Hamilton et al. 2018).
Discrimination
Informal job searches rarely lead to better jobs (Mouw 2003) and network processes have long been implicated in the reproduction of labor market inequality (McDonald 2011). Discrimination highlights that labor markets are embedded in social structures, therefore gender, race/ethnicity, and nativity all serve to separate workers (Hudson 2002). Statistical discrimination, in which hiring is based on real or imagined stereotypes of groups (Mouw 2002), is considered a key mechanism through which stereotyping creates segregation (Kaufman 2002).
Because blacks constitute a minority of the workforce, discrimination likely plays an important role in steering them into predominantly black occupations (Tomaskovic-Devey 1993). There is consistent evidence of racial discrimination in employers’ hiring decisions (Pager and Shepherd 2008) leaving racial minorities concentrated in jobs with less stability and fewer opportunities for advancement (Parcel and Mueller 1983; Smith 2002). Although U.S.-born minorities are thought to come into competition with immigrants because of segregation in low-skill jobs (Catanzarite 2000), there is little overlap in predominantly U.S.-born black and predominantly immigrant occupations (Gleave 2017; Liu 2013). This may be because U.S.-born blacks are the dominant workforce in public sector occupations (Rosenfeld and Tienda 1999), in which stringent hiring practices reduce the likelihood of hiring discrimination (Waldinger 1996). Because of citizenship requirements (U.S. Office of Personnel Management 2018), many public sector occupations are inaccessible for many immigrants.
Mechanisms of statistical discrimination play an important role in building and preserving a segmented labor market because women, minorities, and immigrants are channeled toward underprivileged labor market segments (Colic-Peisker and Tilbury 2006). Labor market segmentation is gender based (Liu 2011), in part because of the importance of social networks in finding work. At least half of U.S. workers obtained their jobs through personal contacts (Marsden and Gorman 2001), but women are often viewed as illegitimate social group members in workplaces (Burt 1998). Consequently, women have fewer connections to influential individuals (McGuire 2002) and are limited to marginal sectors of the economy (Liu 2011). Not only is the U.S. stratification system gendered, it is also racialized. Darker skin tone is significantly associated with ethnic concentration among Hispanic workers (Morales 2008) and among women, blacks are most occupationally segregated from white men (Cotter et al. 2003).
Two things stand out as particularly salient in discussing black immigrant occupational segregation. First, although Waters, Kasinitz, and Asad (2014) suggested that the combination of social network hiring and discrimination by white employers leads to a black immigrant labor market advantage relative to U.S.-born blacks, this advantage may not be true of all black immigrants, because social networks vary across groups. Most research uses pre-2000 data, before the increase in the African immigrant population. African immigrants’ educational characteristics may lead to vastly different occupational segregation patterns than Caribbean immigrants. Second, little research thus far has examined gender differences in black immigrant occupational segregation. Race and nativity are both recognized as key factors in explaining occupational segregation, yet the extent to which this process is gendered is still unclear (Schrover et al. 2007). We address these gaps by using ACS data to explore whether black African and Caribbean immigrants’ occupational segregation mirrors that of U.S.-born blacks. By including regression analyses measuring occupational segregation, we also examine whether socioeconomic differences across groups explain variation in occupational segregation between U.S. and foreign-born blacks.
Data and Methods
Data
We use pooled 2011–2015 ACS data made available through the Integrated Public Use Microdata Series (Ruggles et al. 2015) to determine non-Hispanic black immigrant occupational segregation in the United States. Data include only employed individuals ages 25 to 64 who are not in school. We also limit the sample to individuals living in the top 10 settlement areas for non-Hispanic black Caribbean and sub-Saharan African immigrants, resulting in a total of 14 metropolitan areas accounting for 62 percent of the country’s African population and 83 percent of Caribbean immigrants in the United States (Atlanta; Baltimore; Boston; Bridgeport, Connecticut; Dallas; Hartford, Connecticut; Houston; Los Angeles; Miami; New York; Orlando; Philadelphia; Tampa; and Washington, D.C.). 1 We focus on these metropolitan areas because of black immigrants’ extreme clustering. Nearly 65 percent of Caribbean immigrants live in the New York and Miami metropolitan areas (Zong and Batalova 2016), and more than one quarter of Africans live in the New York, Washington, D.C., and Atlanta metropolitan areas (Zong and Batalova 2017). As Gleave (2017) noted, black immigrant segregation patterns in places with small black immigrant populations can skew results, possibly because of small group representation in the models. Furthermore, because of black immigrants’ extreme concentration, segregation results obtained at the national level are unlikely to resemble the lived experiences of black immigrants.
Methods
Our analyses measure black immigrants’ occupational segregation using the Duncan and Duncan (1955) Dissimilarity Index (DI) calculated with person weights. The DI is the appropriate measure to estimate average distances between individuals of different groups (Catanzarite 2000) and is calculated as follows:

In this general equation, mi (bi) represents the number of all employed members of the majority group (black immigrants) in the ith occupation, and M (B) represents the total majority (black immigrant) labor force. We define occupation using the ACS occ2010 variable, which has 493 categories. The resulting DI values represent the proportion of the black immigrant population that would have to change occupations for the occupational distribution of the majority group and black immigrants to be the same. A segregation value of 0 indicates complete integration, and a value of 1 indicates complete segregation.
To determine if black immigrants’ occupational segregation is statistically significant, we calculate 95 percent confidence intervals for each DI by estimating DI values 80 additional times using replicate weights. The DI values calculated using person weights and replicate weights are then used to calculate the standard error using the following formula (Minnesota Population Center 2018):

Xr represents DI values using each replicate weight, and X represents the DI calculated using the person weight. Using this standard error, we calculate 95 percent confidence intervals (CIs) for each DI. CIs are considered statistically significant if they do not contain zero. No CIs in this analysis include zero, so all occupational segregation coefficients are significant at the 5 percent level.
We use the DI to measure black immigrant segregation from U.S.-born non-Hispanic whites (whites) and U.S.-born non-Hispanic blacks in the aggregate, by gender, and women’s segregation from U.S.-born white and black men. We measure segregation from white workers because jobs dominated by white workers have the highest salaries and occupational status (Semyonov and Herring 2007). Thus, integration with whites serves as a proxy for full labor market incorporation. Immigrants, like U.S.-born blacks, are highly concentrated within the U.S. labor market, yet the pattern of coexistence between U.S.-born blacks and immigrants varies by gender. Black women increasingly work with immigrant women, but there is a pattern of competition and ethnic succession among U.S.-born black and immigrant men (Parks 2010). By measuring black immigrants’ segregation from U.S.-born blacks, we determine if these patterns occur for immigrants who are the same race as U.S.-born blacks and if segregation from whites is a result of occupational clustering by race.
To determine the extent to which human capital and social networks play a role in the occupational segregation patterns observed, we also conduct linear regression models at the metropolitan area level using replicate weights to determine statistical significance. Because we measure segregation at the metropolitan area level, we collapsed the data by metropolitan statistical area (MSA) and nativity group before conducting regression analyses. Our dependent variable is the MSA-specific occupational segregation experienced by group members, and our independent variables are group-level indicators in each metropolitan area and MSA-level characteristics (percentage working in government jobs). Because immigrants are more likely to be able to make use of social networks in places with large coethnic populations, we control for the proportion of the metropolitan-area population that is the same race/nativity. To address human capital differences between groups, we control for the average education of the coethnic group. Among the foreign-born, human capital is also based on where they complete their education, so we include the percentage of the group that completed their education in the United States. In addition, we control for average years in the United States, the percentage who speak English at least very well, and the percentage of U.S. citizens of each group in the metropolitan area. Finally, we include measures of self-employment (percentage of the same nativity group in the area that is self-employed) and unemployment (percentage of the same nativity group in the area that is unemployed).
Results
Descriptive Statistics
Table 1 presents demographic and socioeconomic characteristics of U.S.-born whites and blacks and black African and Caribbean immigrants in black immigrants’ major settlement areas. Although black immigrants constitute only 3 percent of the population in these places, they account for nearly two thirds of African immigrants and more than 80 percent of Caribbean immigrants in the United States. 2 Given the concentration of the black immigrant populations in these places, coethnic social networks likely play a role in their occupational choices. The impact of social networks depends on the gender composition of race/nativity groups, and there is quite a bit of variation across groups. Approximately 60 percent of employed U.S.- and Caribbean-born blacks are women (compared with just under half of U.S.-born whites and African immigrants). Although African immigrants are more highly educated than both U.S.- and Caribbean-born blacks, they are disadvantaged in terms of immigration-related characteristics. Caribbean immigrants are more likely to speak English at least very well, to have spent more time in the United States, and to have completed their education in the United States than the African-born.
Descriptive Characteristics in Major African and Caribbean Immigrant Settlement Areas (Employed Adults Ages 25–64 Not in School).
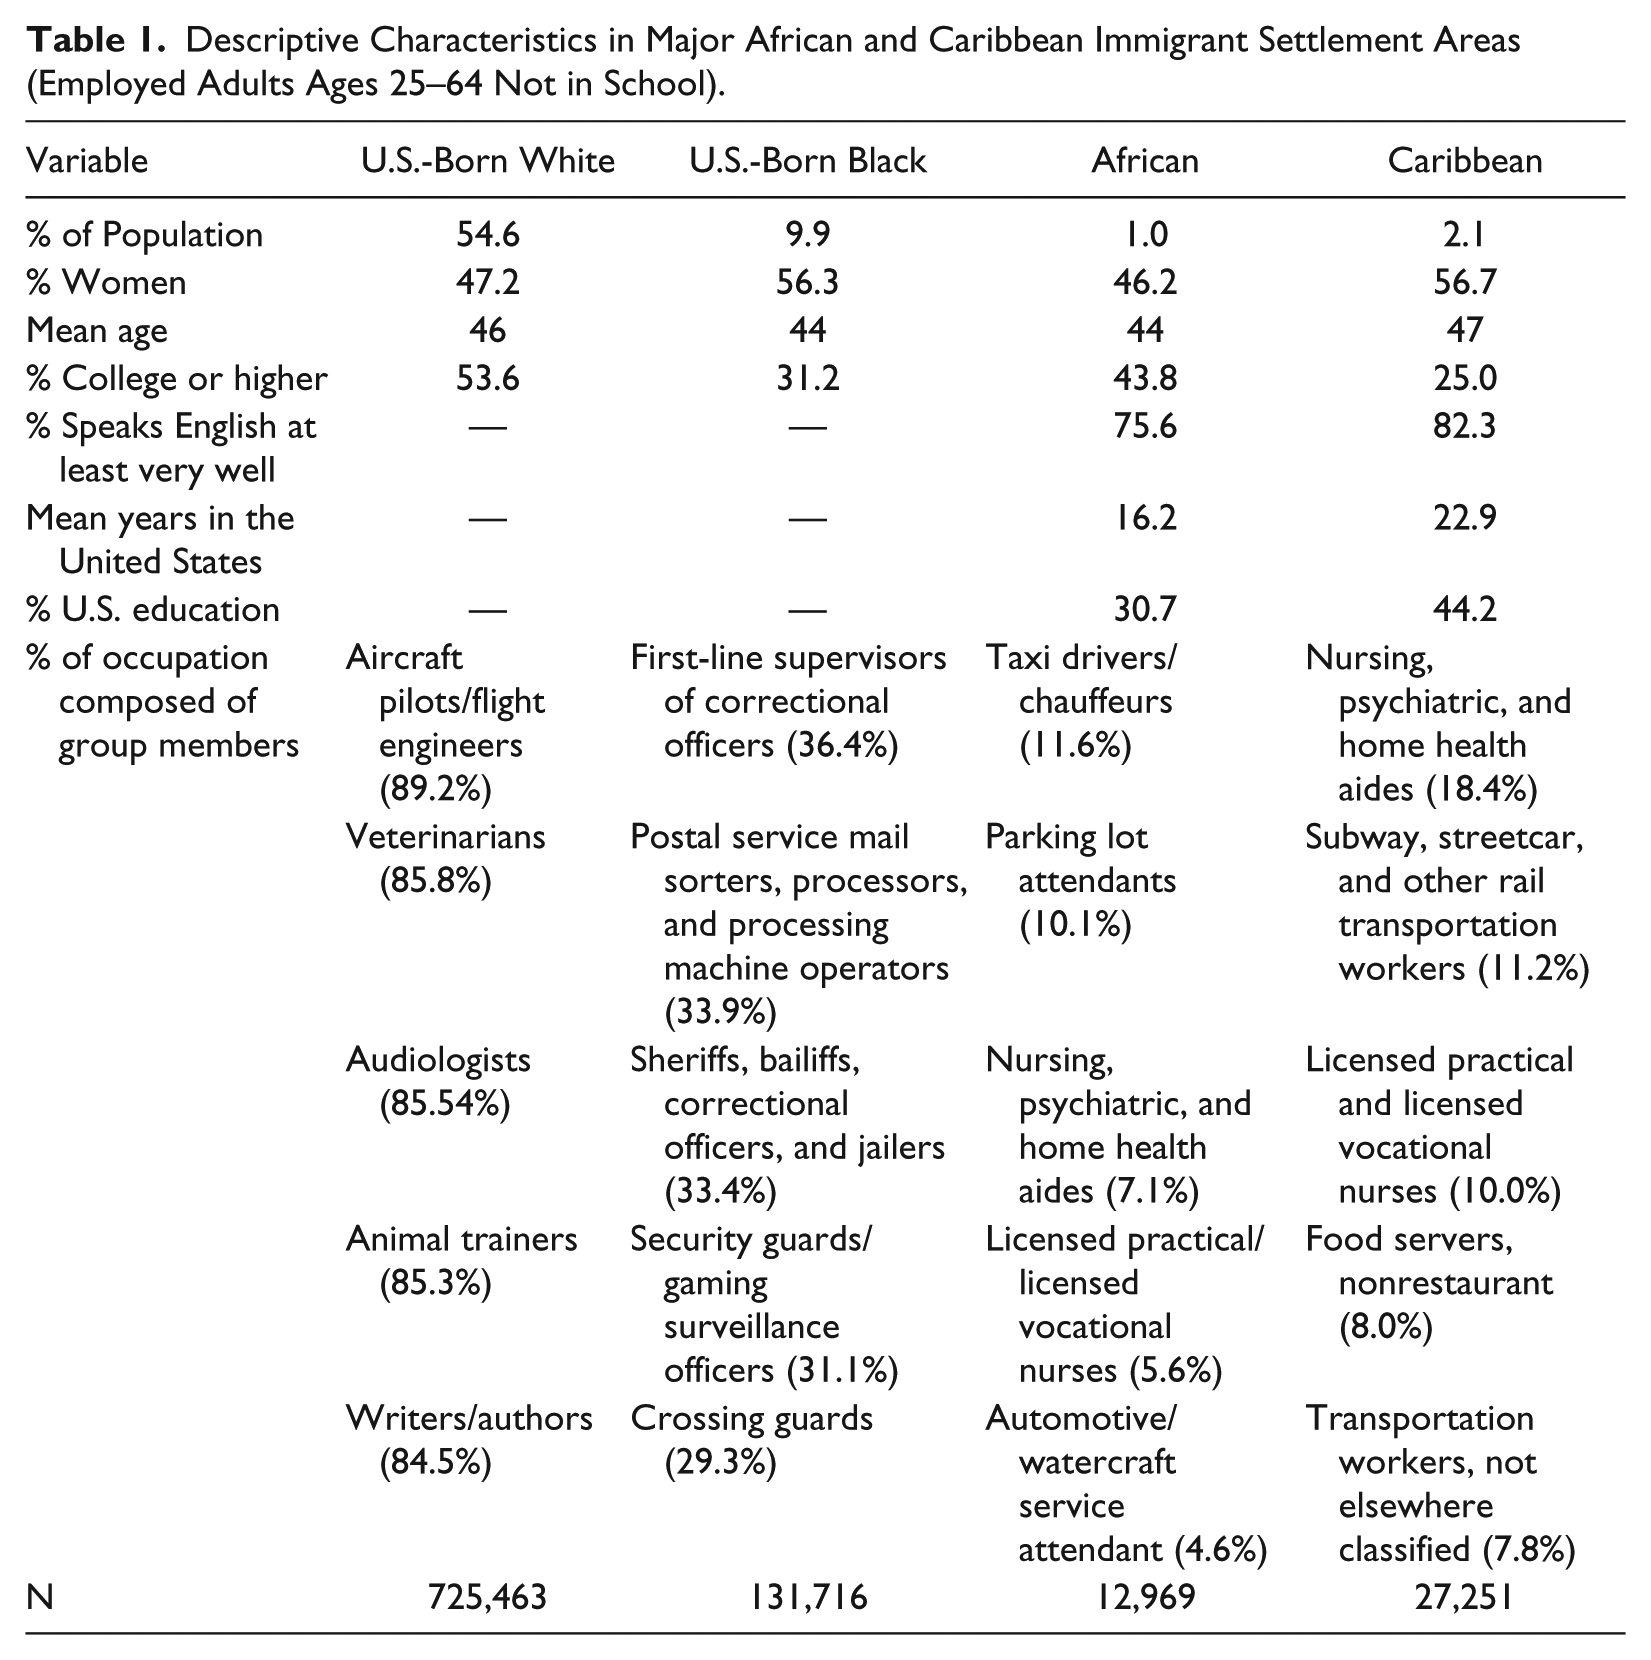
Black immigrants’ divergent human capital and immigration characteristics may play a role in the occupations in which they work. Consistent with previous research (Hamilton et al. 2018; Waldinger 1996), three of the five occupations in which U.S.-born blacks are overrepresented are public sector occupations. U.S.-born blacks’ concentration in these occupations is approximately three times their representation in these metropolitan areas. African immigrants are less concentrated than U.S.-born blacks, but their concentration is much larger than one would expect without occupational segregation. African immigrants constitute only 1 percent of the population of the sample but constitute 12 percent of their top occupation (taxi drivers and chauffeurs). African (and Caribbean) immigrants do not overlap with U.S.-born blacks in any of their top occupations, but Caribbean immigrants’ occupations overlap to a greater degree with those of African immigrants. Both groups are overrepresented in medical care work, largely because of women’s concentration in these occupations (Appendix A). Black immigrant men, in contrast, work predominantly in transportation-related fields.
Occupation varies by gender as well as skill level. Only one third of adults in the United States have at least a bachelor’s degree (Ryan and Bauman 2016), therefore we define those with college degrees or more as high skilled (and those with less than a high school education as low skilled). Those who have completed high school or some college are considered moderately skilled. Among the U.S.-born, there is no overlap of low-skilled, moderately skilled, and high-skilled blacks’ most common occupations (not shown). The same is not true of the African-born. Low- and moderately skilled African immigrants work as parking lot attendants at high rates, and taxi driver or chauffeur is one of the most common occupations for African immigrants regardless of skill level. African immigrants’ concentration in these professions regardless of educational attainment suggests that they are unable to translate their human capital into less segregated occupations that are more highly paid.
DI Measures
Figures 1 to 3 present the results of segregation analyses calculating DI values. In the aggregate (Figure 1), U.S.-born blacks are least segregated from whites, while African and Caribbean immigrants experience approximately the same level of segregation from whites at just over 0.4. African immigrants are more segregated from U.S.-born blacks than Caribbean immigrants (DI = 0.30 vs. DI = 0.26). This is expected given the educational characteristics of U.S.-, Caribbean-, and African-born blacks. Although on average, black immigrants are more likely to have a college degree than U.S.-born blacks, this is due to the educational characteristics of African immigrants (Anderson 2015).
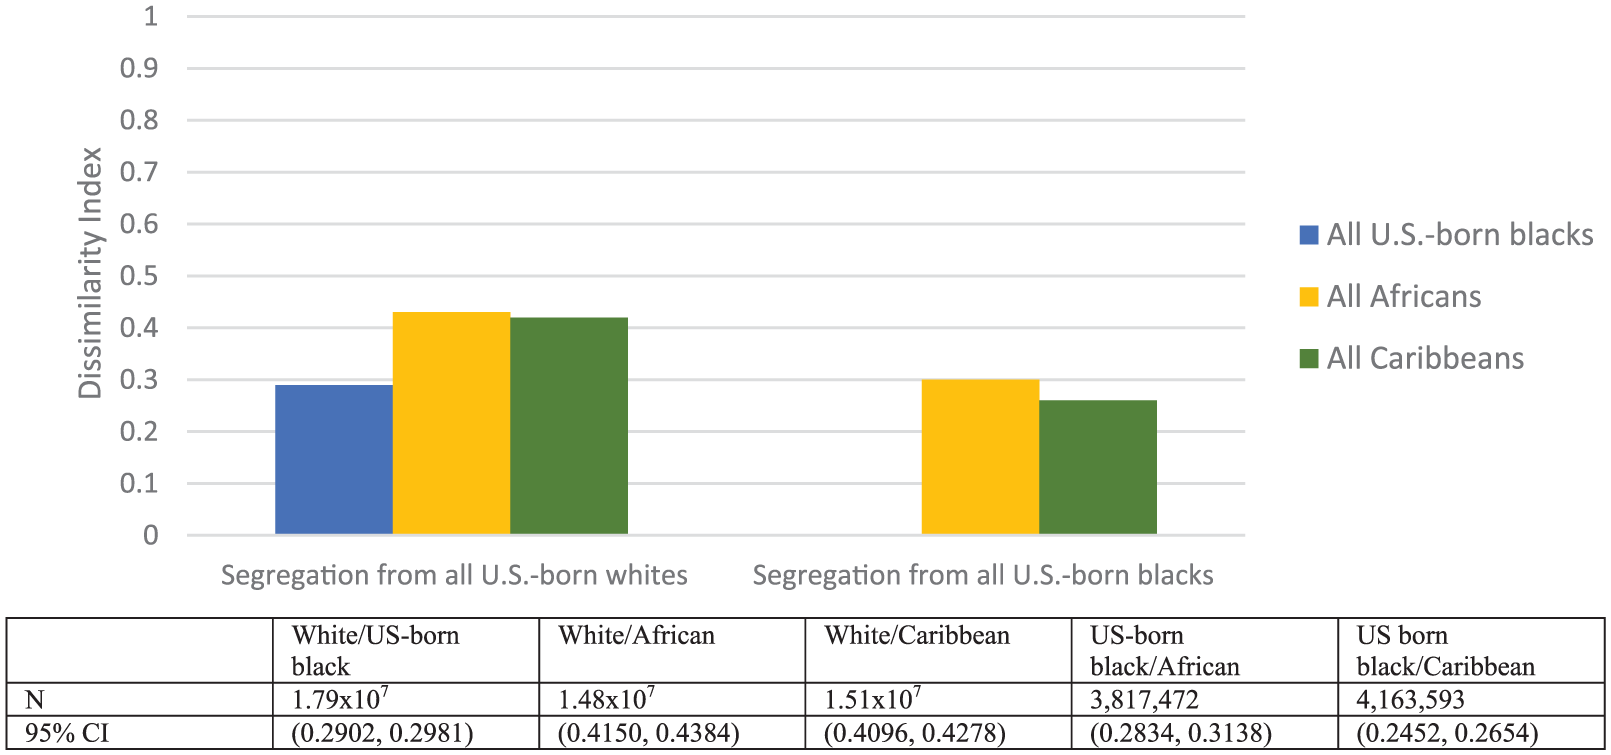
Race/nativity occupational segregation among adults (ages 25–64, not in school, and employed) in major African and Caribbean immigrant settlement areas.
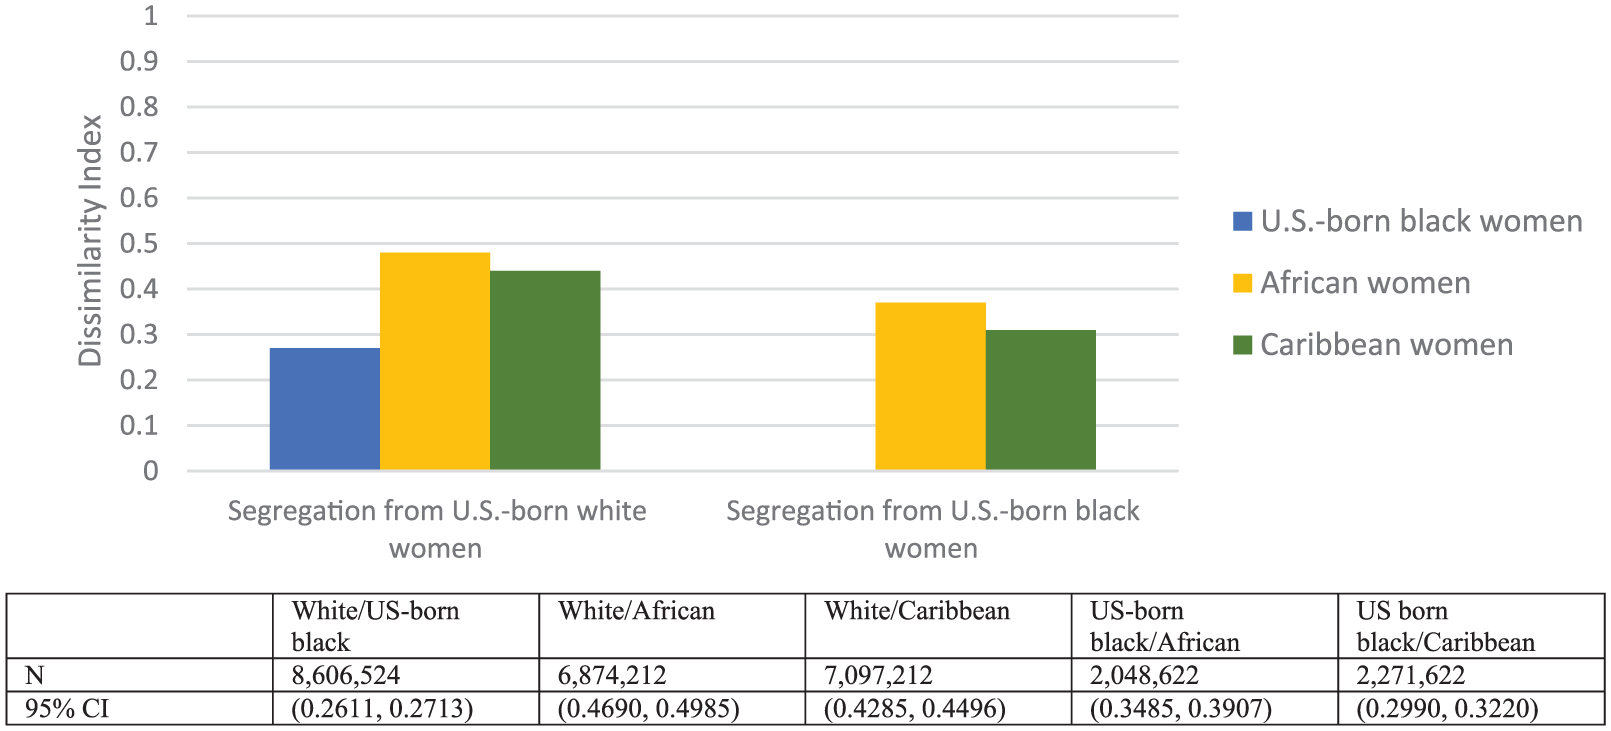
Race/nativity occupational segregation among women (ages 25–64, not in school, and employed) in major African and Caribbean immigrant settlement areas.
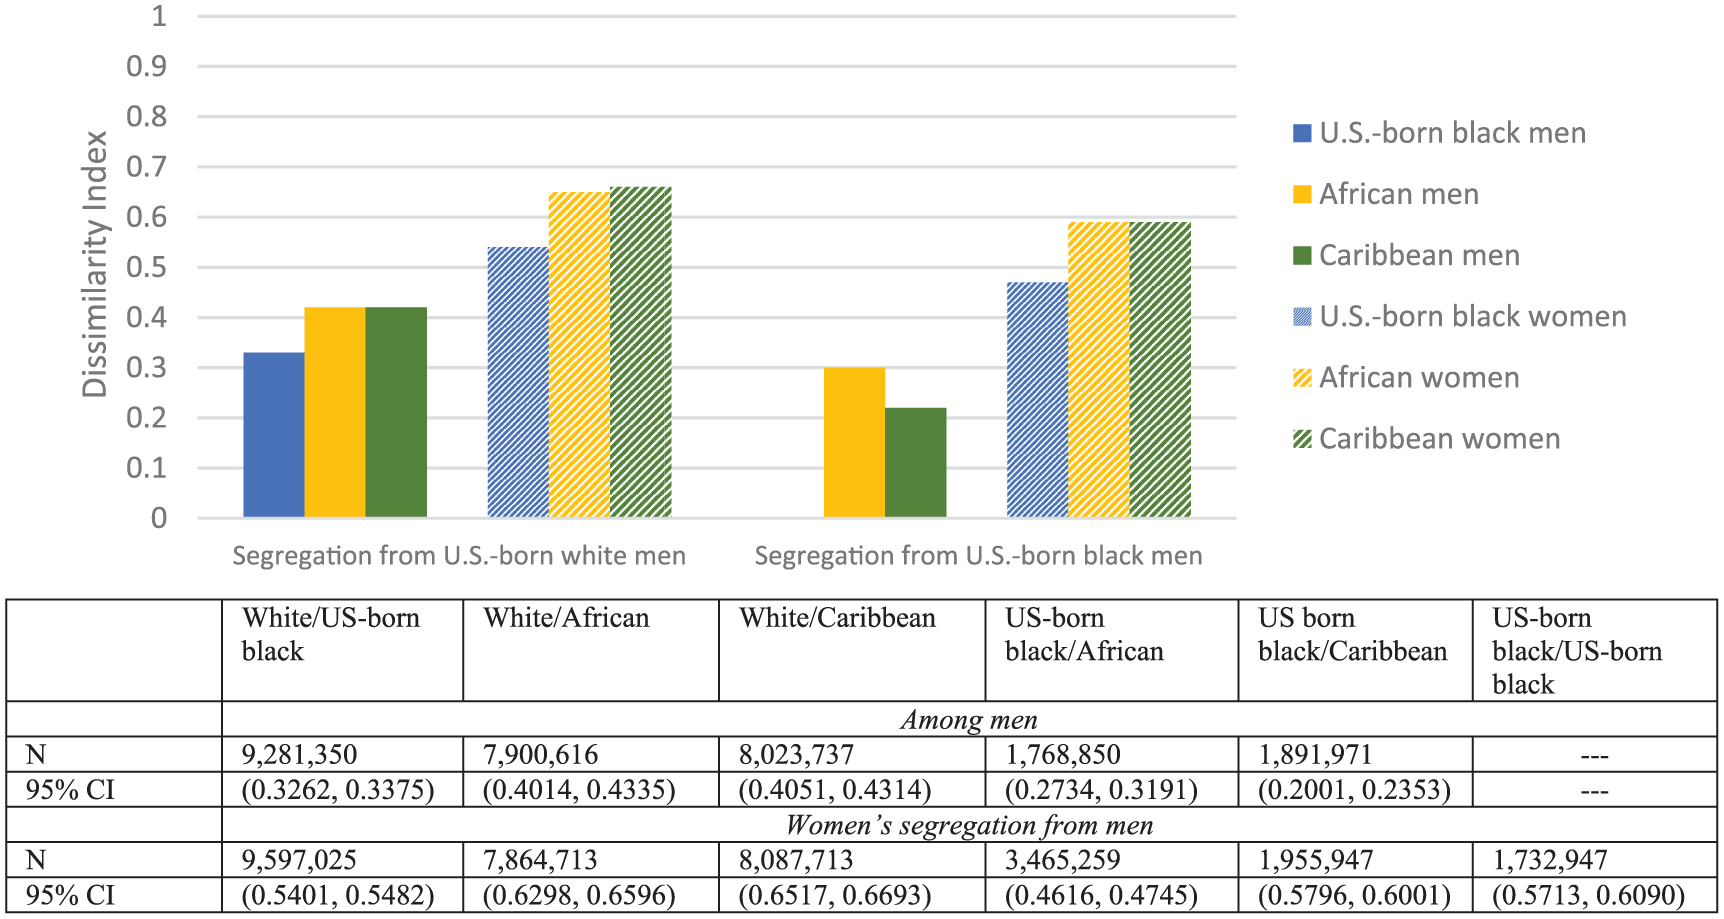
Occupational segregation from U.S.-born white and U.S.-born black men among adults (ages 25–64, not in school, and employed) in major African and Caribbean settlement areas.
Occupational Segregation by Gender
Occupational segregation patterns observed in the total population continue in analyses focusing on women (Figure 2). African women are most segregated from both U.S.-born white and black women. Nearly half of African women would have to change occupations to achieve complete integration with white women, and approximately 40 percent of African immigrants would need to do so to be completely integrated with U.S.-born blacks. Although black women are more occupationally segregated from white men than are other women (Cotter et al. 2003), we find that this varies across black women. Figure 3 shows that among black women, the U.S.-born are least segregated from white men. U.S.-born black women’s DI is 0.54, compared to DI values of 0.64 and 0.66 for African and Caribbean-born women. Lower rates of segregation from white men indicate that U.S.-born black women are more likely to be employed in jobs with higher pay (Dickerson 2008; Hudson 2002). As expected, black men’s occupational segregation from white men is lower than that of black women, but their segregation patterns are similar. The U.S.-born are less segregated than African and Caribbean immigrants.
Occupational Segregation by Skill and Gender
Although African men and women are most segregated from both U.S.-born whites and blacks, skill level may play a role in the patterns observed. Therefore, we also calculated DI values by skill (Appendix B). We find that occupational segregation from U.S.-born whites and blacks declines with skill level for all groups, but African immigrants are still most segregated from whites (and blacks) within each skill level (Appendix B). Among women, Caribbean women are less segregated from the U.S.-born than Africans, with the exception of those with less than a high school degree. In analyses measuring segregation from men, we find that nearly 80 percent of low-skilled African and Caribbean immigrant women would need to change jobs to achieve complete integration with low-skilled white men. Even among the high-skilled, black immigrant women have DI values of approximately 0.55. Although segregation from U.S.-born black men is slightly lower, (the DI is approximately 0.7 for the low and moderately skilled), results show that the combination of gender, race, and nativity leaves black immigrant women most segregated regardless of skill.
Regression Analyses
Demographic characteristics related to immigration have a significant relationship with labor market outcomes (Davila and Mora 2000). To determine the extent to which these characteristics affect African and Caribbean occupational segregation, Tables 2 and 3 present regression analyses of occupational segregation from U.S.-born white and black workers, respectively. Both tables present results of three regression models (men and women combined, among men, and among women) with all race/nativity groups included to determine whether there is a significant difference in occupational segregation rates between black groups. We also run analyses focusing on African immigrants alone and Caribbean immigrants alone to determine whether predictors have a different impact on African and Caribbean immigrants.
Coefficients from Linear Regression Models of Non-Hispanic Black Metropolitan Area–Level Occupational Segregation from White Workers in Major African and Caribbean Immigrant Settlement Areas (Employed Adults Ages 25–64, Not in School).

p < .05. **p < .01. ***p < .001.
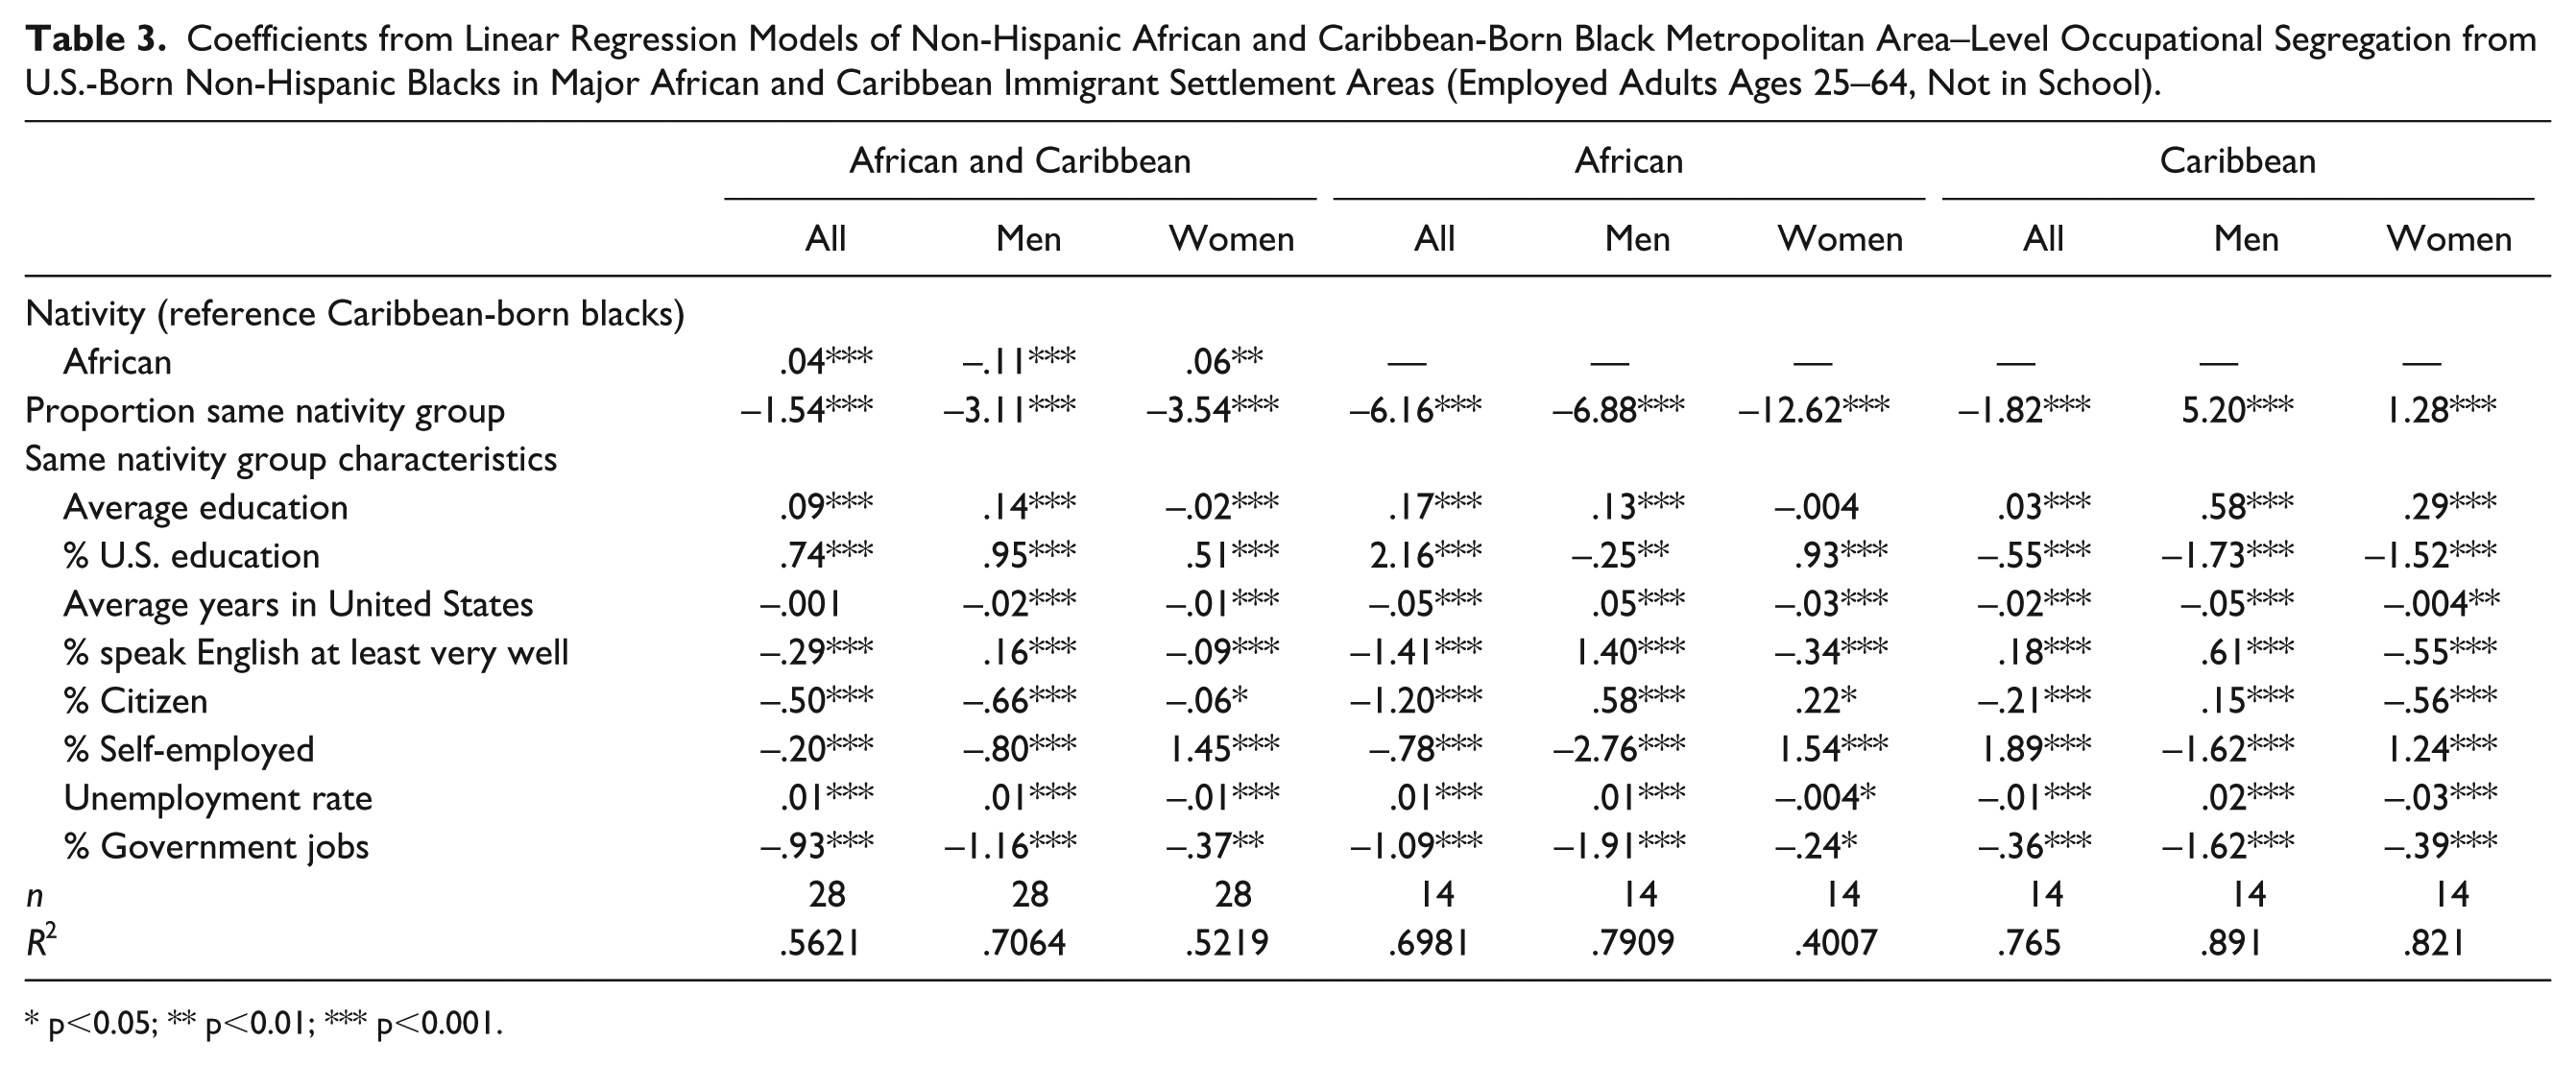
Coefficients from Linear Regression Models of Non-Hispanic African and Caribbean-Born Black Metropolitan Area–Level Occupational Segregation from U.S.-Born Non-Hispanic Blacks in Major African and Caribbean Immigrant Settlement Areas (Employed Adults Ages 25–64, Not in School).
p<0.05; ** p<0.01; *** p<0.001.
Segregation from U.S.-Born White Workers
The results of analyses including all three black groups (left three columns of Table 2) show that even after controlling for socioeconomic characteristics, black immigrants’ occupational segregation from U.S.-born white workers is significantly larger than that experienced by U.S.-born blacks. As in Figures 1 to 3, the coefficients of African and Caribbean immigrants are nearly identical. In models including both men and women (and models by gender), we find that as the coethnic population proportion increases, occupational segregation from whites decreases indicating that having a coethnic social network in the metropolitan area helps reduce black groups’ occupational segregation.
As socioeconomic characteristics may have a differential impact on African and Caribbean immigrants’ occupational segregation patterns, the columns in the center and on the right of Table 2 present analyses of regression analyses run for African and Caribbean immigrants separately. Focusing first on Africans (the center three columns), we find that the only characteristic associated with a reduction in occupational segregation for both men and women is the coethnic population proportion in the metropolitan area. The impact of coethnic population is particularly high for African women, suggesting that they either rely more heavily on social networks to find work, or relationships among coethnic women are more likely to lead to working in more integrated occupations.
Although African immigrants are more highly educated than both U.S.- and Caribbean-born blacks, this does not translate to lower occupational segregation. In fact, as their average educational attainment in the metro area increases, African immigrant occupational segregation increases. Instead, among African women, characteristics related to assimilation reduce occupational segregation: years in the United States, percentage who speak English at least very well, and percentage who are citizens all have negative coefficients. Together with the large and highly significant coefficient for coethnic group, these results indicate that it is not only the presence of a coethnic group but the level of incorporation among that coethnic group that leads to labor market integration. Among men, we find a different pattern. Immigration-related characteristics are associated with an increase in occupational segregation. Although human capital and social networks are most discussed in the occupational segregation literature, our results show that self-employment is the way black men escape working in segregated occupations. These results are similar to studies finding that minorities and immigrants turn to self-employment when they are unable to find work in the larger labor market (Chaudhary 2015).
Like Africans, Caribbean immigrants’ occupational segregation declines with an increase in their coethnic population proportion in the regression model including both men and women. However, education (not immigration-related characteristics) plays a larger and more significant role in reducing Caribbean immigrants’ occupational segregation from white workers. As percentage who completed their education in the United States increases, there is a large decline in the occupational segregation experienced by Caribbean men and women (coefficients of −1.43 and −0.46, respectively). As in the models focusing on African women, increased English proficiency, citizenship, and time in the United States are also associated with a decline of Caribbean women’s occupational segregation.
Segregation from U.S.-Born Black Workers
Table 3 presents the results of regression models predicting segregation from U.S.-born blacks. In models including both African and Caribbean immigrants (left three columns), African immigrants’ high segregation from blacks relative to the Caribbean-born (Figures 1–3) are largely a result of differences in socioeconomic characteristics across groups. African men are actually significantly less segregated from U.S.-born black men than Caribbean-born black men after controlling for socioeconomic characteristics.
Once again, we find that when African and Caribbean immigrants live in places with higher concentrations of their coethnic groups, they are less segregated from the U.S.-born. Models including both African and Caribbean immigrants show that segregation from blacks is driven less by educational characteristics and more by immigration characteristics and self-employment patterns, but this varies by immigrant group. Just as in the models measuring segregation from white workers, African immigrant women’s segregation reduces with time in the United States and higher English proficiency, and African immigrant men are less segregated when they are self-employed. The direction of Caribbean immigrants’ coefficients is also similar to those found in Table 2 suggesting that predictors of African and Caribbean immigrants’ segregation from the U.S.-born are the same regardless of the race of the U.S.-born.
Conclusions
On the surface, black immigrants’ socioeconomic and labor market characteristics suggest that they are well integrated in the U.S. labor force. Black immigrants in the aggregate have higher LFP rates than U.S.-born whites (70 percent vs. 63 percent) (BLS 2017, 2018). African immigrants, the fastest growing immigrant group in the United States, are among the most highly educated and are just as likely as the U.S.-born to be employed in management, business, science, and arts occupations (Zong and Batalova 2017). Research also shows that in the aggregate, black immigrants do not experience a double disadvantage of race and nativity when it comes to overeducation (De Jong and Madamba 2001). However, we find that black immigrants are severely overrepresented in a few occupations. Not only are African and Caribbean immigrants segregated from white workers, they are significantly more segregated than U.S.-born blacks.
At first glance, our results seem at odds with the positive labor market outcomes described in previous work. However, our findings serve to highlight the importance of investigating a variety of outcomes to determine immigrants’ labor market success and disaggregating black immigrants by their sending regions. For example, De Jong and Madamba (2001) showed that on average, black immigrants do not experience a double disadvantage in the labor market, but this may be because black immigrants in the aggregate reflect the characteristics of Caribbean immigrants, the larger black immigrant population. When disaggregated, research shows that African immigrants are more likely to be overeducated than Caribbean- and U.S.-born blacks and Asian immigrants, experiencing larger wage penalties than other groups as a result of this occupational mismatch (Tesfai 2017).
Disaggregating black immigrants into their sending regions is also important for determining the predictors of occupational segregation. No independent variable consistently has a similar impact on African and Caribbean immigrants’ occupational segregation. Although scholars have found a persistent negative relationship between the size of the metro area’s minority population and that group’s economic outcomes (vonLockette and Johnson 2010), we find the opposite pattern. Our results confirm findings from qualitative research. Chaumba (2016) found that as the size and diversity of Zimbabwean immigrants’ social network increased, their likelihood of underemployment declined. When social capital is shown to have a positive effect, the effect is attributed to the use of weak ties (Nakhaie and Kazemipur 2013). Our findings suggest that as the size of the African and Caribbean immigrants’ coethnic population increases, the diversity of the coethnic population and likelihood of weak ties in the labor market increases, leading to greater occupational integration.
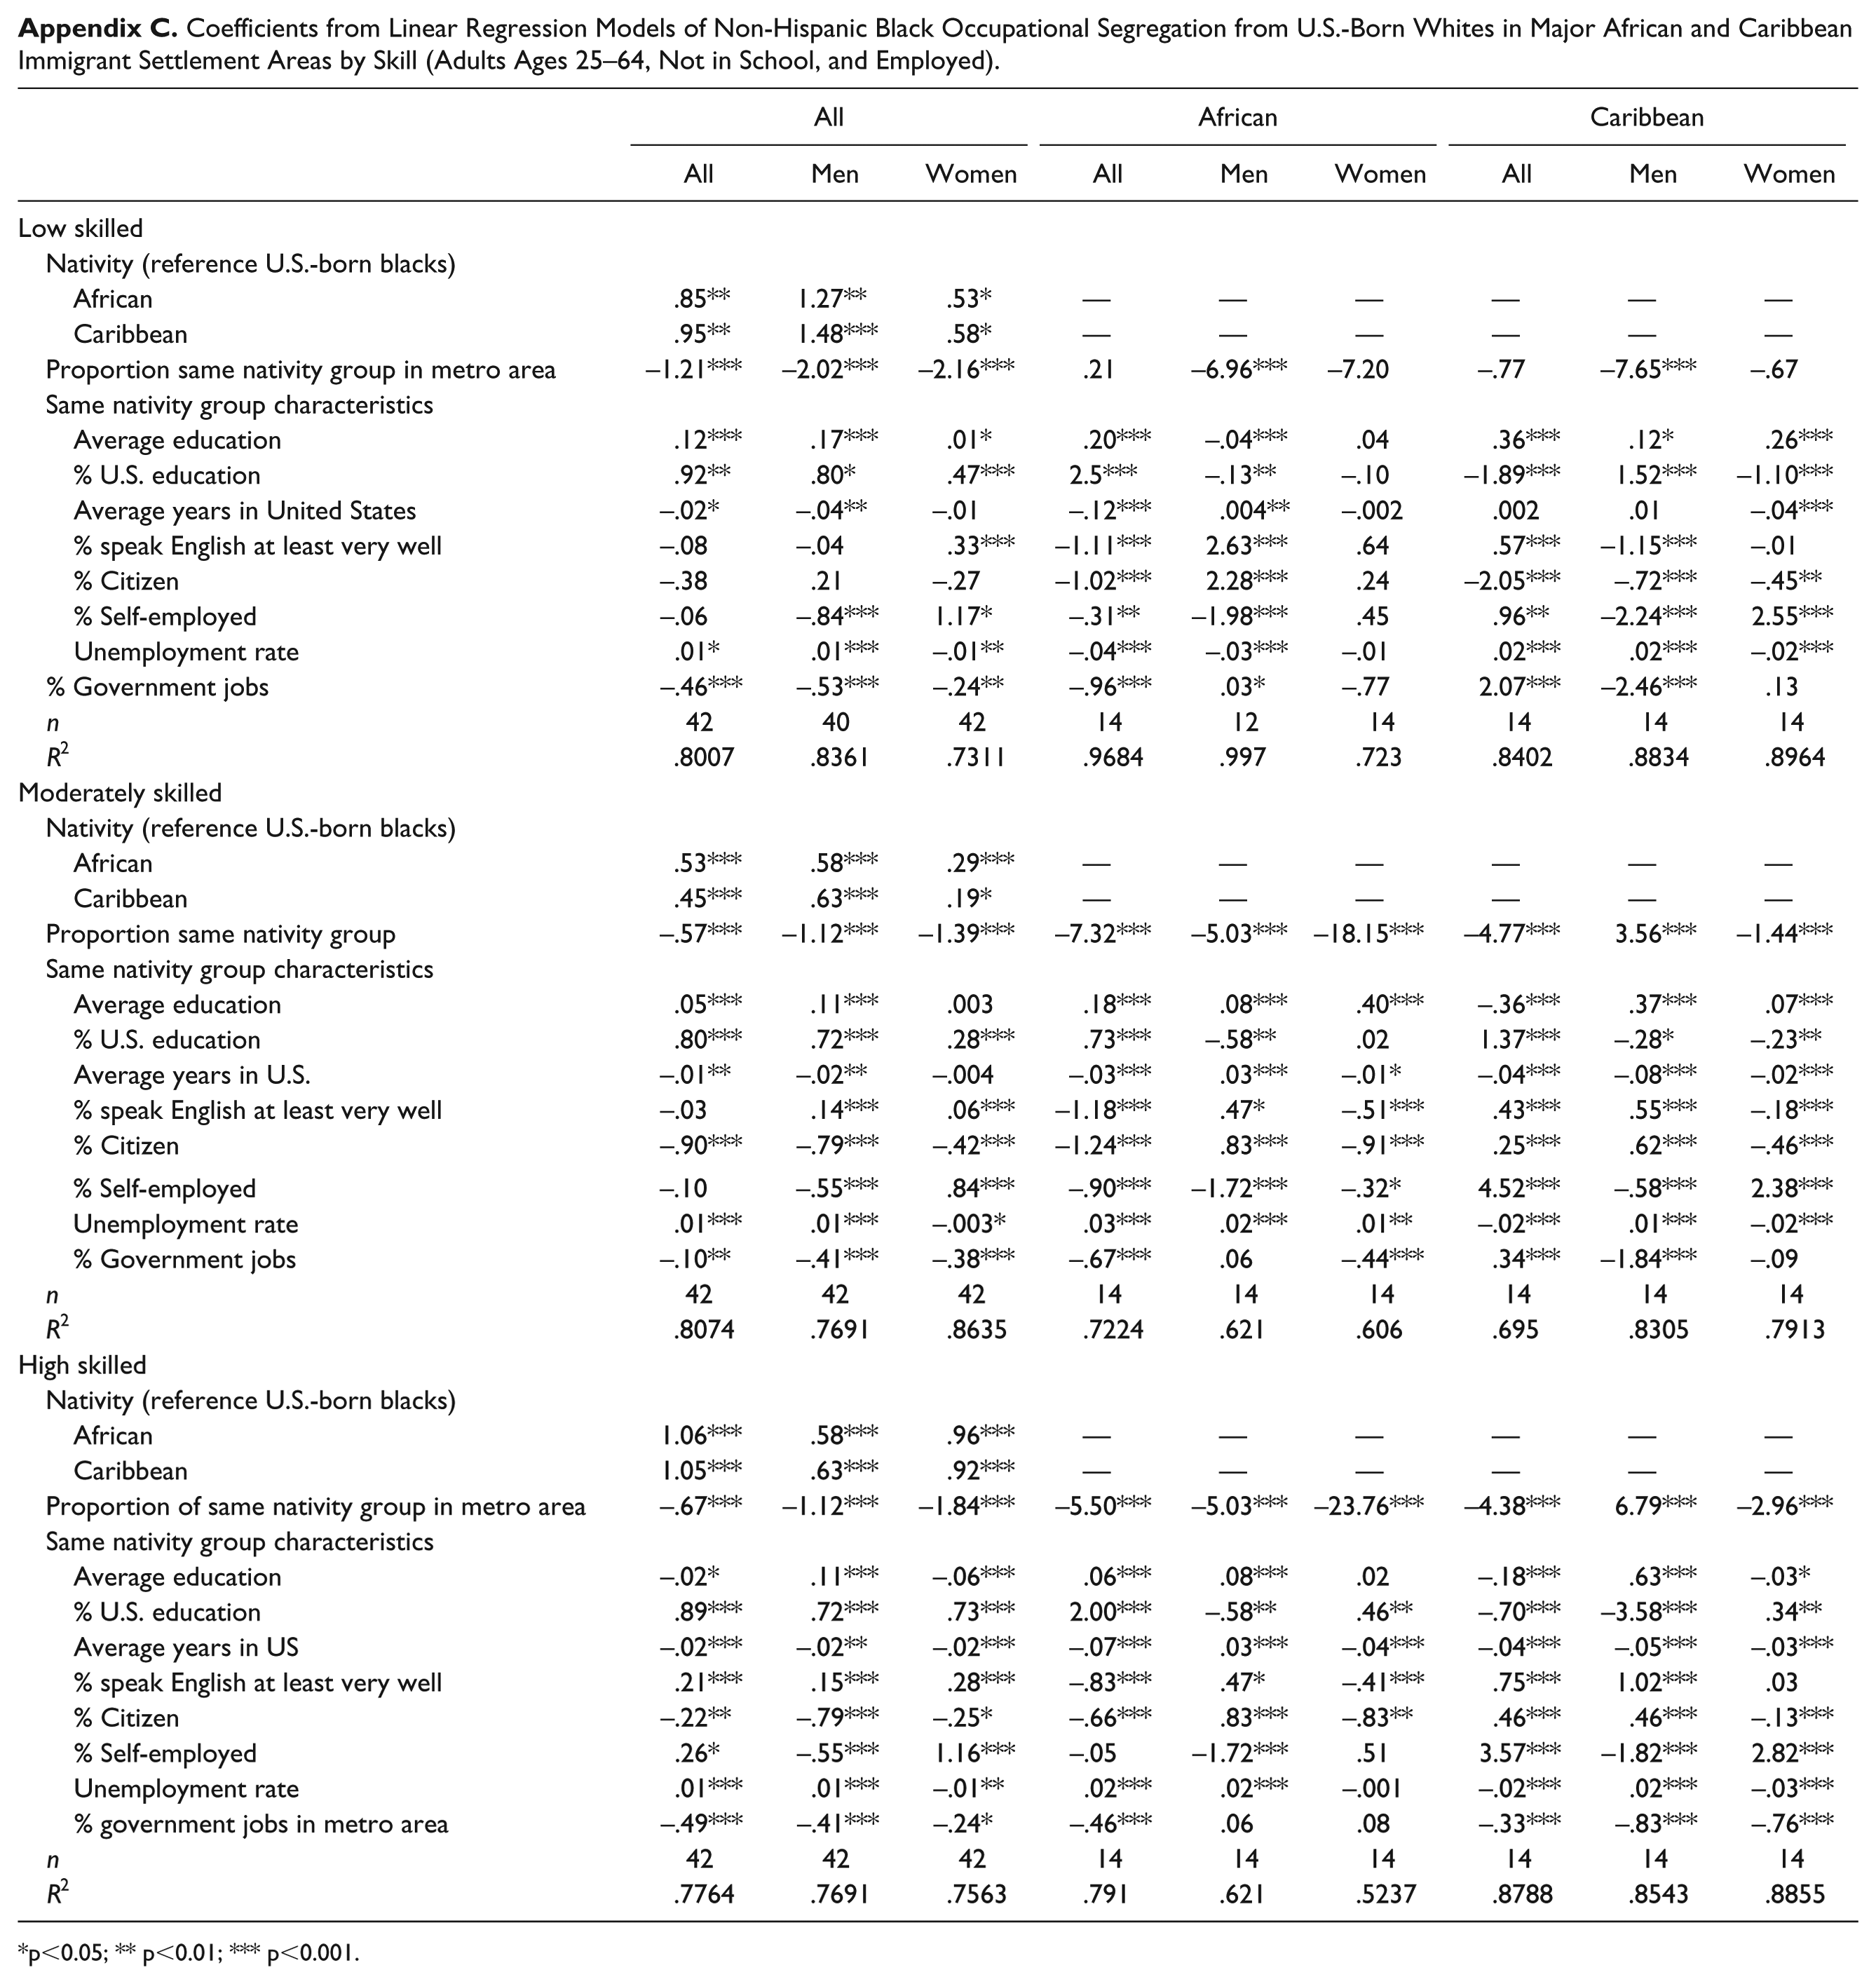
Descriptive statistics show that African immigrants make up 14 percent of all parking lot attendants, one of the most common occupations, even among the highly skilled. The overlap in African men’s most common occupations across skill level indicate that there are barriers to African immigrants’ occupational mobility, which is confirmed in the regression analyses. Increases in educational attainment do not lead to a decline in African men’s occupational segregation. In fact, segregation increases as human capital increases except at the lowest skill level (Appendix C). Although increased education also leads to increased segregation for Caribbean immigrants, there is no overlap in their most common occupations across skill level. Like U.S.-born blacks (Alonso-Villar et al. 2012), African immigrants seem to be penalized rather than rewarded for their educational attainment.
Among women, results of regression analyses show that measures of assimilation lead to decreased occupational segregation for African and Caribbean immigrants, but the impact is smaller for Caribbean women. The difference in the impact of immigration characteristics reflects the findings in previous work. Although Caribbean immigrants find that indicators of their foreignness can be beneficial to them in the labor market because it distinguishes them from U.S.-born blacks (Kasinitz 1992; Vickerman 2001), for African women the meanings attached to immigration characteristics put them at a disadvantage (Showers 2015). African immigrants cite discrimination on the basis of their ethnic background as a barrier to advancement in the U.S. labor force (Showers 2015); our results suggest that discrimination plays a large role in their occupational segregation. Nearly all regression analyses focusing on African immigrants have R2 values lower than those of corresponding analyses focusing on Caribbean immigrants. That is, the independent variables explain a smaller percentage of African occupational segregation, suggesting that they experience more discrimination in the labor market. Discrimination can occur at both hiring and promotion. At the hiring stage, African immigrants may be disadvantaged by having more “foreign-sounding” names. In many cases, recruiters and employers discriminate substantially by name, using names as a signal of language and/or social skills necessary for a job (Oreopoulos 2011).
African immigrants’ names may communicate more than region of birth, they may also suggest their religion. Recently, higher percentages of Muslim immigrants originate from sub-Saharan Africa. Sixteen percent of Muslim immigrants to the United States were born in sub-Saharan African (Pew Research Center 2013), and African immigrants constitute 9 percent of foreign-born Muslims in the United States (Pew Research Center 2017). If given a slightly negative piece of information, managers assign substantially lower salary and future career progression to those with Muslim-sounding names (Park et al. 2009), therefore Africans may be disadvantaged in both the application and promotion processes.
Although the predictors of African and Caribbean immigrants’ occupational segregation from whites are quite different, one thing they have in common is that even after controlling for socioeconomic characteristics, they remain highly segregated. However, the same is not true for their segregation from blacks. Although African immigrants are more segregated from U.S.-born blacks than Caribbean immigrants in the initial segregation analyses, controlling for socioeconomic characteristics narrows this gap for women and reverses this pattern among men. These results suggest that the barriers to working in racially integrated workplaces are different from those leading to occupational segregation from U.S.-born blacks.
Overall, our results show that black immigrants are highly segregated from U.S.-born white workers and also segregated from U.S.-born blacks (though to a lesser extent). Employment plays a crucial role in immigrant integration because of its association with status (Chaumba 2016). Although the repercussions of segregation from men and white workers (and white men) on wages are well established, it is unclear whether a wage penalty based on black immigrants’ segregation from U.S.-born blacks also exists. Future research is needed to determine whether African and Caribbean immigrants’ occupational segregation from blacks leads to a wage penalty or if working separately from U.S.-born blacks results in higher wages. Furthermore, given the importance of self-employment in reducing African men’s occupational segregation, future research should also examine the impact of lower occupational segregation on self-employed black immigrants’ incomes.
Supplemental Material
Supplemental_Appendix – Supplemental material for Dimensions of Inequality: Black Immigrants’ Occupational Segregation in the United States
Supplemental material, Supplemental_Appendix for Dimensions of Inequality: Black Immigrants’ Occupational Segregation in the United States by Rebbeca Tesfai and Kevin J. A. Thomas in Sociology of Race and Ethnicity
Footnotes
Appendix
Coefficients from Linear Regression Models of Non-Hispanic Black Occupational Segregation from U.S.-Born Whites in Major African and Caribbean Immigrant Settlement Areas by Skill (Adults Ages 25–64, Not in School, and Employed).
| All | African | Caribbean | |||||||
|---|---|---|---|---|---|---|---|---|---|
| All | Men | Women | All | Men | Women | All | Men | Women | |
| Low skilled | |||||||||
| Nativity (reference U.S.-born blacks) | |||||||||
| African | .85** | 1.27** | .53* | — | — | — | — | — | — |
| Caribbean | .95** | 1.48*** | .58* | — | — | — | — | — | — |
| Proportion same nativity group in metro area | −1.21*** | −2.02*** | −2.16*** | .21 | −6.96*** | −7.20 | −.77 | −7.65*** | −.67 |
| Same nativity group characteristics | |||||||||
| Average education | .12*** | .17*** | .01* | .20*** | −.04*** | .04 | .36*** | .12* | .26*** |
| % U.S. education | .92** | .80* | .47*** | 2.5*** | −.13** | −.10 | −1.89*** | 1.52*** | −1.10*** |
| Average years in United States | −.02* | −.04** | −.01 | −.12*** | .004** | −.002 | .002 | .01 | −.04*** |
| % speak English at least very well | −.08 | −.04 | .33*** | −1.11*** | 2.63*** | .64 | .57*** | −1.15*** | −.01 |
| % Citizen | −.38 | .21 | −.27 | −1.02*** | 2.28*** | .24 | −2.05*** | −.72*** | −.45** |
| % Self-employed | −.06 | −.84*** | 1.17* | −.31** | −1.98*** | .45 | .96** | −2.24*** | 2.55*** |
| Unemployment rate | .01* | .01*** | −.01** | −.04*** | −.03*** | −.01 | .02*** | .02*** | −.02*** |
| % Government jobs | −.46*** | −.53*** | −.24** | −.96*** | .03* | −.77 | 2.07*** | −2.46*** | .13 |
| n | 42 | 40 | 42 | 14 | 12 | 14 | 14 | 14 | 14 |
| R2 | .8007 | .8361 | .7311 | .9684 | .997 | .723 | .8402 | .8834 | .8964 |
| Moderately skilled | |||||||||
| Nativity (reference U.S.-born blacks) | |||||||||
| African | .53*** | .58*** | .29*** | — | — | — | — | — | — |
| Caribbean | .45*** | .63*** | .19* | — | — | — | — | — | — |
| Proportion same nativity group | −.57*** | −1.12*** | −1.39*** | −7.32*** | −5.03*** | −18.15*** | −4.77*** | 3.56*** | −1.44*** |
| Same nativity group characteristics | |||||||||
| Average education | .05*** | .11*** | .003 | .18*** | .08*** | .40*** | −.36*** | .37*** | .07*** |
| % U.S. education | .80*** | .72*** | .28*** | .73*** | −.58** | .02 | 1.37*** | −.28* | −.23** |
| Average years in U.S. | −.01** | −.02** | −.004 | −.03*** | .03*** | −.01* | −.04*** | −.08*** | −.02*** |
| % speak English at least very well | −.03 | .14*** | .06*** | −1.18*** | .47* | −.51*** | .43*** | .55*** | −.18*** |
| % Citizen | −.90*** | −.79*** | −.42*** | −1.24*** | .83*** | −.91*** | .25*** | .62*** | −.46*** |
| % Self-employed | −.10 | −.55*** | .84*** | −.90*** | −1.72*** | −.32* | 4.52*** | −.58*** | 2.38*** |
| Unemployment rate | .01*** | .01*** | −.003* | .03*** | .02*** | .01** | −.02*** | .01*** | −.02*** |
| % Government jobs | −.10** | −.41*** | −.38*** | −.67*** | .06 | −.44*** | .34*** | −1.84*** | −.09 |
| n | 42 | 42 | 42 | 14 | 14 | 14 | 14 | 14 | 14 |
| R2 | .8074 | .7691 | .8635 | .7224 | .621 | .606 | .695 | .8305 | .7913 |
| High skilled | |||||||||
| Nativity (reference U.S.-born blacks) | |||||||||
| African | 1.06*** | .58*** | .96*** | — | — | — | — | — | — |
| Caribbean | 1.05*** | .63*** | .92*** | — | — | — | — | — | — |
| Proportion of same nativity group in metro area | −.67*** | −1.12*** | −1.84*** | −5.50*** | −5.03*** | −23.76*** | −4.38*** | 6.79*** | −2.96*** |
| Same nativity group characteristics | |||||||||
| Average education | −.02* | .11*** | −.06*** | .06*** | .08*** | .02 | −.18*** | .63*** | −.03* |
| % U.S. education | .89*** | .72*** | .73*** | 2.00*** | −.58** | .46** | −.70*** | −3.58*** | .34** |
| Average years in US | −.02*** | −.02** | −.02*** | −.07*** | .03*** | −.04*** | −.04*** | −.05*** | −.03*** |
| % speak English at least very well | .21*** | .15*** | .28*** | −.83*** | .47* | −.41*** | .75*** | 1.02*** | .03 |
| % Citizen | −.22** | −.79*** | −.25* | −.66*** | .83*** | −.83** | .46*** | .46*** | −.13*** |
| % Self-employed | .26* | −.55*** | 1.16*** | −.05 | −1.72*** | .51 | 3.57*** | −1.82*** | 2.82*** |
| Unemployment rate | .01*** | .01*** | −.01** | .02*** | .02*** | −.001 | −.02*** | .02*** | −.03*** |
| % government jobs in metro area | −.49*** | −.41*** | −.24* | −.46*** | .06 | .08 | −.33*** | −.83*** | −.76*** |
| n | 42 | 42 | 42 | 14 | 14 | 14 | 14 | 14 | 14 |
| R2 | .7764 | .7691 | .7563 | .791 | .621 | .5237 | .8788 | .8543 | .8855 |
p<0.05; ** p<0.01; *** p<0.001.
Supplemental Material
Supplemental material for this article is available online.
Notes
Author Biographies
References
Supplementary Material
Please find the following supplemental material available below.
For Open Access articles published under a Creative Commons License, all supplemental material carries the same license as the article it is associated with.
For non-Open Access articles published, all supplemental material carries a non-exclusive license, and permission requests for re-use of supplemental material or any part of supplemental material shall be sent directly to the copyright owner as specified in the copyright notice associated with the article.