



Abstract
Intermarriage is an important indicator of immigrant integration trajectories and the rigidity of ethnoracial boundaries. Although questions of Middle Eastern and North African (MENA) integration and social exclusion occupy a central place in public discourse, little is known about their marriage patterns. The authors use the 2017 American Community Survey to estimate patterns of coethnic, panethnic, and intergroup marriages for MENA populations. Compared with other immigrant groups, rates of intermarriage are relatively high, and there is little evidence of “panethnic” patterns of marriage. However, more recent marriages have become less exogamous. Hierarchical age-period-cohort models suggest that this is driven by changing patterns among more recent cohorts, with some evidence of a post-2001 period effect among men. Compositional changes in the country of origin account for some, but not all, of these cohort effects. The findings highlight the importance of further research on MENA Americans to understand their unique social experiences of the U.S. ethnoracial hierarchy, particularly in the context of increasing racialized anti-Arab and anti-Muslim discrimination after 2001.
Scholarship on marriage patterns has been central to understanding changing ethnic and racial boundaries in the United States (Gordon 1964; Hirschman 1983; Kalmijn 1998). Intermarriage rates have been used to both track the integration trajectories of various immigrant populations and measure the rigidity of social boundaries and racial discrimination across contexts. Although such questions about the integration patterns and social boundaries faced by Middle Eastern and North African (MENA) immigrants and their descendants have become increasingly critical in contemporary public discourse and debates about immigration in the United States, this population has rarely been incorporated into research on intermarriage. Studying marriage patterns of MENA Americans can advance understanding of their social experiences in a changing social and political environment.
Analyzing population dynamics for MENA Americans is challenging because of a variety of conceptual uncertainties, methodological challenges, and data limitations. Relative to other ethnoracial groups, MENA Americans are a small population whose composition has changed—in terms of nationality, socioeconomic background, reason for migration, and religion—over time. These groups are difficult to identify in conventional data sources, in part because of their ambiguous racial histories. The Office of Management and Budget defines individuals of MENA ancestry as racially “white,” which can render them “statistically invisible” in many data records and often overlooked in scholarship focused on interracial marriage trends (Naber 2000). Conceptualizations of the “Middle East” lump together groups that are ethnically distinct, including Arabic-speaking populations from North Africa and the Arab peninsula, as well as non-Arab populations that inhabit Arab-majority regions or nearby countries of Iran and Afghanistan. Moreover, their experiences are influenced by religion—in terms of identity formation and experiences of Islamophobic discrimination (despite their varied religious backgrounds)—yet data on religious identification are rarely available.
Recent trends suggest that addressing these omissions may be important to understanding contemporary ethnoracial boundaries in the United States. Scholars have long argued that MENA Americans’ formal classification as white does not capture their social experiences within the U.S. ethnoracial hierarchy (Love 2017; Maghbouleh 2017, 2020; Selod 2014). Particularly after September 11, 2001, individuals with MENA ancestry have experienced racialized discrimination and social exclusion that renders them symbolically “nonwhite,” with consequences for social and economic outcomes (Gould and Klor 2015). Although such discrimination is sometimes framed in terms of religion (i.e., Islamophobia) or ethnicity (i.e., anti-Arab discrimination), its racialized practice affects non-Muslim and non-Arab members of the MENA population. The degree to which such social boundaries and experiences of discrimination manifest in barriers to intergroup marriage, and whether those barriers have changed over time, is currently unclear.
We seek to address two related questions in this article. First, how often do immigrants from MENA countries and their descendants marry coethnics, individuals with different MENA ethnicity (i.e., a panethnic marriage), or members of other groups within the general U.S. population? Previous research revealed relatively high rates of intermarriage for Arab Americans in a pre-2001 environment (Kulczycki and Lobo 2002). Our study provides a contemporary update and expands the population of focus to include non-Arab Middle Eastern populations, while also examining rates of coethnic and panethnic marriage. Second, how have rates of intermarriage changed over time? We use data on year of marriage in the American Community Survey (ACS) to estimate temporal trends and control for the demographic composition of the MENA population. Because year-of-marriage trends raise questions about underlying influences of age, period, and cohort effects, we use hierarchical age-period-cohort models to assess whether changes in population composition and a shifting social environment have changed marriage patterns for these groups.
Background
MENA Populations in the United States
The social experiences of individuals with ancestry from the Middle East and North Africa have been historically related, in part, to the characteristics of different waves of immigration from the region. 1 For instance, although the first wave of MENA immigration to the United States (beginning in the late 1880s and continuing until the mid-1920s) consisted primarily of less educated Arab Christians from the Ottoman province of Syria, 2 later MENA immigrants consisted of highly educated elites from Egypt and Iraq (Cumoletti and Batalova 2018). 3 Since passage of the 1965 Immigration and Nationality Act, the MENA population in the United States has further increased in size and diversity. Between 1980 and 2010, the MENA immigrant population nearly quadrupled, from about 220,000 to about 861,000, and today the MENA population stands at nearly 1.2 million (Cumoletti and Batalova 2018). MENA immigrants today also come from a greater variety of countries, including both historical countries of origin such as Iraq, Syria, and Egypt and new countries of origin such as Lebanon, Saudi Arabia, Jordan, Yemen, Kuwait, Morocco, and Sudan (see Table 1), and are increasingly Muslim (Cumoletti and Batalova 2018).
MENA Immigrant Population by Year for 1960, 1980, 2000, and 2017.
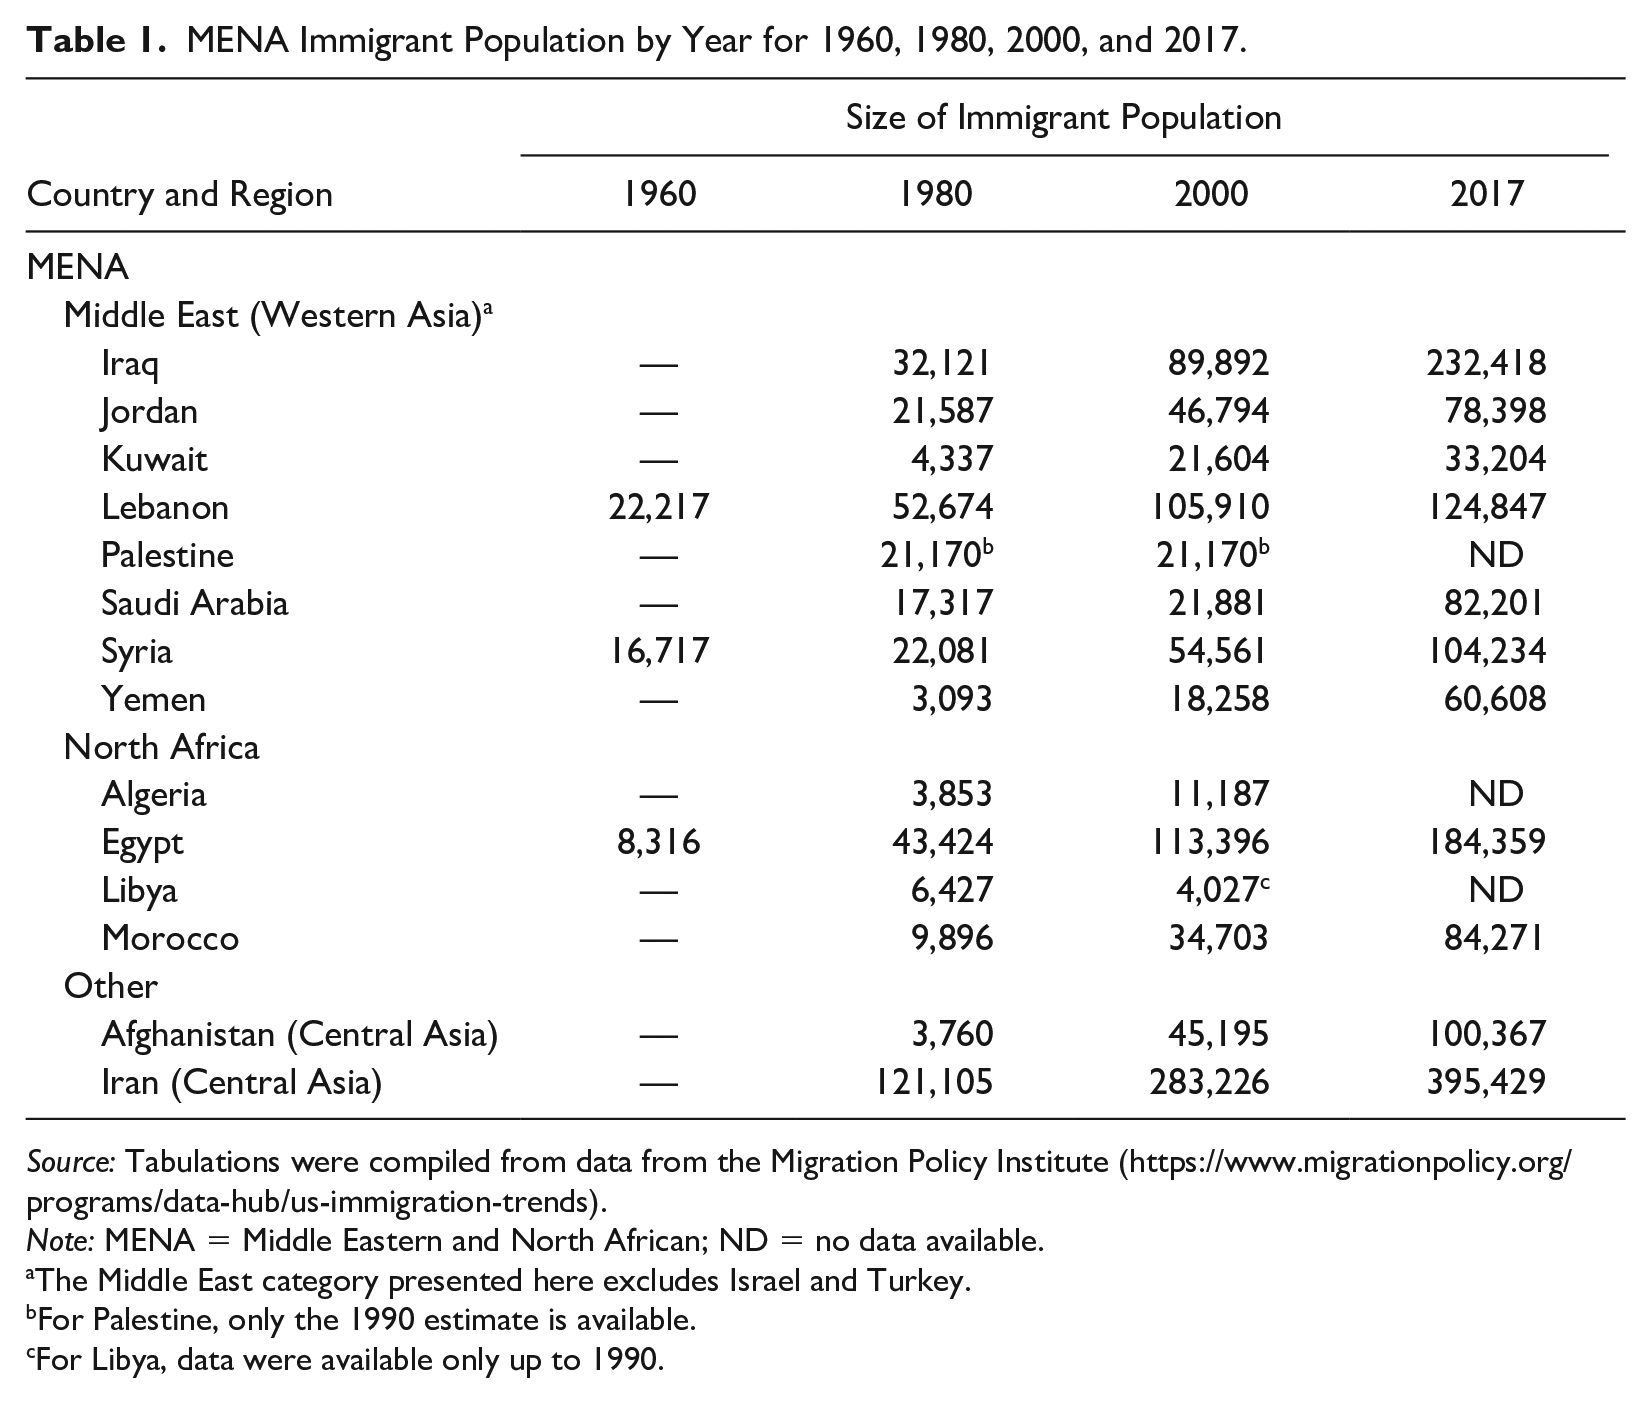
Source: Tabulations were compiled from data from the Migration Policy Institute (https://www.migrationpolicy.org/programs/data-hub/us-immigration-trends).
Note: MENA = Middle Eastern and North African; ND = no data available.
The Middle East category presented here excludes Israel and Turkey.
For Palestine, only the 1990 estimate is available.
For Libya, data were available only up to 1990.
The ways in which MENA Americans have experienced the U.S. ethnoracial hierarchy, in terms of both formal classification and interpersonal interactions, have also shifted over time. Beginning in the late 1800s, individuals of Arab, Iranian, and Afghan descent were plaintiffs in landmark cases that adjudicated boundaries of whiteness in the legal system, with the Office of Management and Budget formally institutionalizing their racial identity by defining individuals with ancestry from the Middle East or North Africa as white in 1978 (Haney López 1996). Despite formal classification as white, the social experiences of these groups have not always matched their legal standing. Various Arab and non-Arab populations from the Middle East often experience discrimination and interactional discourse that frames them as “brown” or “nonwhite,” and increasingly their self-conceptions of their place in the U.S. ethnoracial hierarchy recognize their ambiguous location at the margins of whiteness (Maghbouleh 2017, 2020; Zopf 2018).
Although groups from the Middle East and North Africa balance a variety of ethnic, religious, and national identities, race theory and scholarship have become increasingly important for understanding their shared social experiences (Bakalian and Bozorgmehr 2011). Recently, Arab and MENA American political organizations have lobbied for a new census category that would distinguish them from non-Hispanic whites (Wiltz 2014), representing a key project in sociohistorical processes of racial formation (Omi and Winant 2014). A growing body of sociological literature documents how anti-Muslim and anti-Arab discrimination in the United States has become racialized—anchored to essentialist assumptions and markers of physical traits—to draw boundaries around seemingly heterogeneous populations from the Middle East, North Africa, and South Asia (Ahmad 2004; Love 2017; Maghbouleh 2017, 2020; Selod 2014).
These boundaries have arguably hardened since the attacks of September 11 and the social and political responses that followed. For instance, recent survey research by the Pew Research Center (2017) showed that about 25 percent of U.S. adults feel that the majority of Muslims living in the United States are “anti-American,” while another 24 percent think that “some” Muslims are “anti-American.” The Pew Research Center (2017) also found that there was recognition of this hostility, with nearly 70 percent of U.S. adults reporting that Muslims face “a lot of discrimination,” compared with African Americans (59 percent) and Hispanic Americans (56 percent). In addition, measurable indicators of discrimination against MENA populations in the United States, such as hate-crime incidents and employment discrimination lawsuits, have increased substantially in the years since 2001 (Disha, Cavendish, and King 2011).
As a result, many groups from the Middle East are rendered simultaneously “invisible” in the ethnoracial hierarchy via top-down racial formation processes formalized in legal recognition and institutional categorization and “hypervisible” via bottom-up racialization experiences that place them at the limits of whiteness as a social category (Maghbouleh 2017). Such changes in the context of reception for MENA groups raise classic sociological questions about how social boundaries between groups develop and change over time and how they shape social outcomes for immigrants and their descendants.
Race, Ethnicity, Intermarriage, and Intergroup Dynamics
Intermarriage has long been used as a measure to capture the rigidity or permeability of racial and ethnic boundaries within heterogeneous societies (Gordon 1964; Telles and Esteve 2019). In terms of intergroup dynamics, intermarriage has been viewed as the ultimate outcome of assimilation, showing the acceptance of outside groups’ members into the most intimate and primary relationship of family (Bean et al. 2009; Gordon 1964; Kalmijn 1998). 4
Classical assimilation theory posits that as immigrant groups adapt to the cultural norms of the majority population, and become more integrated into mainstream social institutions, their rates of intermarriage with U.S.-born whites will increase (Alba and Nee 1999; Gordon 1964; Park and Burgess [1921] 1970; Waters and Jiménez 2005). Although this model has been effective in describing how diminished institutional barriers between early waves of ethnically, economically, and culturally distinct European immigrant groups eventually led to increased intermarriage across these groups and with other U.S.-born whites, it remains an open question how useful it is in explaining marriage outcomes of more recent immigrant groups, in particular those considered racially, religiously, or otherwise socially distinct.
Many scholars have suggested demographic reasons for why increased and continuing immigration may lead to reduced levels of intermarriage among newer immigrant groups (Clark 1998; Lee and Fernandez 1998). At the most basic level, increased immigration and the growth of a group’s size may provide greater choice to marry within the group. In addition, continued migration may enhance the ability of newer immigrant groups to maintain ethnic solidarity and increase its salience in marriage decisions (Alba and Nee 1999). Greater solidarity within the group may also help restrict intermarriage through informal and formal sanctions to those who cross ethnic, racial, or religious barriers.
Increased immigration and the growth in the overall population of these groups may also engender greater hostility toward them, thus strengthening barriers between these groups and others (Blumer 1958; Quillian 1995). With respect to intermarriage, increased negative attitudes toward these groups and their members and reduced social contact across groups may decrease the likelihood of members outside these groups seeing members potential marriage partners. Some scholars further contend that shared experiences of exclusion or rejection from the majority, alongside similar religious, language, or cultural norms may lead relatively similar ethnic groups to form larger panethnic groupings, whereby new identity and interactions can be created and in which adherence to the norms of the mainstream can be resisted (Espiritu 1992; Rosenfeld 2001).
In addition to these demographic related effects on intermarriage, there are other social changes that may influence levels of intermarriage. Although it is true historically that groups that were considered racially distinct faced greater discrimination that hindered assimilation processes, there have been important changes in race relations within American society that affect the receptivity of minority groups (Alba and Nee 1999). The civil rights legislation of the 1960s, the dismantling of legally sanctioned discrimination, and the general shift in public opinion have all contributed to the reduction of formal barriers between groups.
Although there is a growing and more nuanced quantitative literature on intermarriage for racial minorities in the United States, one group that remains particularly understudied is MENA Americans. In one of the few studies that examined MENA intermarriage, Kulczycki and Lobo (2002) found that U.S. Arab Americans tend to intermarry at relatively high rates and that intermarriage was higher for the native-born, those with higher levels of education, and those who were younger. However, these findings were based on a cross-sectional analysis of the 1990 census, leaving unclear temporal patterns of MENA intermarriage, particularly after September 11, whereby greater overt hostility to Arab American and Muslim groups may be hardening social boundaries against them. In fact, more recent scholarship has shown a “9/11 effect” on intermarriage. Specifically, Gould and Klor (2015) found reduced rates of intermarriage among likely Muslim immigrants living in states with higher rates of anti-Muslim hate crimes. However, this study limited its analysis to foreign-born immigrants from Muslim-majority countries, leaving unexplored whether their findings applied more generally to all MENA groups or more broadly to U.S.-born members of these groups.
Studying the intermarriage patterns of MENA-ancestry individuals in the United States thus allows us to study a politically and demographically important group that provides theoretical insight of the role of race and ethnicity in the maintenance or dissolution of social boundaries. Furthermore, analyses of how MENA-ancestry intermarriage patterns have changed over time and across immigrant generations provide critical understanding into the impact of historical context for assimilation trajectories.
Data and Methods
We examine marriage patterns for MENA immigrants and their descendants using individual-level Integrated Public Use Microdata files for the ACS (Ruggles et al. 2019). The ACS is an ongoing nationally representative survey conducted by the U.S. Census Bureau that includes ancestry questions previously contained in the decennial census. Because the MENA immigrant population is relatively small—less than 1 percent of the U.S. population—we use the 2017 five-year sample, which pools 1 percent samples from 2013 to 2017. The ACS microdata include spousal identifiers that facilitate matching household head and spousal records, as well as other key pieces of information for analyzing marriage trends, including the year of marriage and year of immigration for foreign-born populations. The latter variables allow us to distinguish marriages that occurred after migration for first-generation immigrants.
Sample
Our sample consists of individuals who report Middle Eastern or North African ancestry. The ACS asks respondents to specify one or two ancestry groups, and these are the variables most commonly used to identify Arab and other MENA populations in the United States. 5 Although the Office of Management and Budget defines “white” to include individuals with “origins in any of the original peoples of Europe, the Middle East, or North Africa,” it does not explicitly define the region nor provide a list of countries that encompass it. The “Middle East” is a political and social construction with a variety of geographic definitions and social uses. 6 We rely on a broad geographic definition that includes the Arab-majority countries of Northern Africa and the Arabian Peninsula, as well as the non-Arab-majority countries of Iran and Afghanistan. We classified respondents as having MENA backgrounds if they selected one or more of the following ancestry categories in the ACS: Algerian, Assyrian/Chaldean/Syriac, Egyptian, Iraqi, Jordanian, Kurdish, Kuwaiti, Lebanese, Libyan, Moroccan, Palestinian, Qatari, Saudi Arabian, Syrian, Tunisian, Yemeni, Afghan, Iranian, North African, Middle Eastern, Arab, and Other Arab. 7 We include respondents who select a combination of MENA and non-MENA ancestries in order to avoid underestimating assimilation of previous generations and to maintain a sufficient sample size given the small population. Although Israel is geographically in this region, we excluded Israel in part because of our interest in the intersection of race, ethnicity, and anti-Muslim discrimination. We recoded these categories to distinguish among country-specific ancestries, the general Arab/MENA categories, and those who report multiple different MENA ancestries. Our final analysis relies on a sample of 19,555 individuals who were married only once and whose spousal data are available.
Measures
Our dependent variable is a measure of marriage pairings. We classify marriages into three types. We classify a marriage as “coethnic” if the spouse selects the same country-specific ancestry category as the respondent (e.g., both the respondent and spouse identify as “Lebanese” or “Iranian”, etc.). We classify a marriage as “panethnic” if the marriage is not coethnic, but the spouse identifies an ancestry from a different MENA country than that of the respondent. The MENA-ancestry responses that are not tied to a specific country—North African, Arab, Middle Eastern, Other Arab—are considered “panethnic” by default. Finally, we measure “intermarriage” as marriage to a non-MENA spouse.
We use data about the year of marriage to estimate temporal trends in patterns of intermarriage. This information is not a perfect proxy for period data because it may be influenced by survivorship bias if there are systematic patterns in divorces or deaths that may cause the characteristics of remaining marriages at the time of the survey to differ from new marriages in a reported year. However, we limit our sample to only first marriages to partially account for this. In addition, as a sensitivity test we compared our baseline intermarriage rates with samples from the 1980, 1990, and 2000 censuses, finding comparable trends. To tease out age, period, and cohort effects that may be driving temporal patterns, we combine data on the year of marriage with another variable measuring age at marriage to decompose possible temporal trends from age effects. For instance, we can compare rates of intermarriage for 20-year-olds married in the 1980s and 20-year-olds married in the 2000s. In addition, we use age at the time of the survey to categorize respondents into cohorts, distinguishing five-year birth cohorts between 1953 and 1998.
We control for several individual-level variables related to the unique demographic characteristics of immigrant populations, as well as common determinants of marriage rates and patterns. These include nativity status, race, ancestry, metropolitan status, region of the country, total family income, and education. For nativity status, we distinguish between first-generation immigrants married more than two years after migration, the 1.5 generation (foreign-born respondents who migrated before age 11), and those born in the United States. We measure education as a categorical variable with levels for less than high school, high school degree, some college, bachelor’s degree, and advanced degrees. We code the ACS race question into five categories: non-Hispanic White, non-Hispanic Black, Asian, other, and multiracial. 8
Analysis
The first step of our analysis is focused on estimating marriage patterns. We calculate general rates of coethnic marriage, panethnic marriage, and intermarriage for both men and women, stratified by immigration status. Because the marriage market for immigrants may extend to their origin countries, we exclude marriages of first-generation immigrants who married before migration, or less than two years after migration, in order to avoid overestimating the rates of postmigration endogamy (Qian, Lichter, and Tumin 2018). In addition to cross-sectional analysis, we use information about year of marriage to estimate temporal trends in marriage patterns for both men and women.
The second stage of our analysis further explores temporal trends for U.S.-born MENA Americans from the first stage. We use age at marriage, year of marriage, and year of birth to explore the influence of age, period, and cohort, respectively. Although age-period-cohort analysis often requires repeated cross-sectional data, the retrospective nature of the ACS questions allows us to model the data as if they were collected in the year of marriage, mimicking a repeated cross-sectional design.
Disentangling age, period, and cohort effects when analyzing temporal trends is methodologically challenging. In our analysis, as in most age-period-cohort problems, each variable can have a theoretical effect on the outcome of interest. Marriage decisions change with age, and it is possible that rates of intermarriage also vary depending on the age at which a person marries. Rates of intermarriage also may change over time, and the history of MENA immigration suggests certain periods—the 1970s and the era after 2001 in particular—may have changed the context in which marriages occur. However, it is possible that temporal events do not change marriage patterns for everyone, but only for younger cohorts that are more likely to be unmarried and in their formative years, relative to preceding cohorts. Despite the theoretical importance of each measure, the linear dependency of each variable on the others (i.e., period – age = cohort) hinders statistical analysis of their relative influence.
There are a number of approaches to addressing the age-period-cohort identification problem, typically involving adjustments that “disrupt” the linear relationships between each of the components. Recent methodological developments have incorporated cross-classified multilevel mixed-effects models that do not treat the variables as linearly related at the same level of analysis (Yang and Land 2006, 2016). Whereas age is considered an individual-level variable, cohort and period can be treated as second-level contexts in which individuals reside. These hierarchical age-period-cohort models are suitable to individual-level survey data and the inclusion of covariates that may account for effects at any level, although hierarchical age-period-cohort models may not fully address the identification problem for all data generation situations (for a discussion of critiques, see Bell and Jones 2014, 2015).
Because individuals can be nested in both periods and cohorts, a cross-classified mixed-effects baseline model is estimated using the following equation:

The probability of individual i in cohort j and period k intermarrying is represented by π. Random intercepts for cohort and period effects are included as uj and vk. Age at marriage is grand-mean-centered and included as a level 1 variable. A term for age squared is also included to reduce the collinearity of the variables. We include only individuals married between the ages of 18 and 49 in the regression analysis. Periods are measured as two-year intervals between 1980 and 2017. The two-year bin was selected to provide sufficient numbers of marriages for analysis per period while being sensitive to temporal change (e.g., the average length of engagement is more than one year). Cohorts are measured in five-year intervals from 1953 to 1998.
Our baseline regression model assesses the relative influences of age, period, and cohort. In our second model, we account for compositional changes that may coincide with temporal trends in marriage. Migration patterns from the Middle East have changed over the historical period of interest, with more recent migrants coming from different origin countries, with different demographic profiles, and under different circumstances. We control for ancestry with a dummy variable that distinguishes Lebanese and Syrian ancestry from other MENA-ancestry categories. Because Lebanese and Syrian migrants accounted for much of the early-wave non-Muslim immigration, this helps account for compositional changes. We also include controls for race, education, metropolitan status, and region of the United States.
Results
The rate of intermarriage for MENA Americans is relatively high compared with other ethnic and racial populations. Figure 1 shows the percentage of ACS respondents married to spouses without MENA ancestry. First-generation immigrants are the least likely to intermarry among the groups, yet 33 percent of men and 26 percent of women who married after migration (i.e., not counting foreign-born marriages that occurred outside of the United States or within two years of migration) married non-MENA spouses. Foreign-born respondents who came to the United States before age 11 (i.e., the 1.5 generation) have higher rates of intermarriage, with nearly half of men and 40 percent of women marrying non-MENA spouses. For U.S.-born respondents who identify with one of the MENA-ancestry categories, rates of intermarriage were more than 74 percent. The rate of intermarriage for the U.S.-born MENA population is nearly double the rates for U.S.-born Hispanics and Asians, approximately 37 percent and 40 percent, respectively, in our sample. 9 Descriptively and cross-sectionally, the MENA population appears highly exogamous, with a trajectory that suggests relatively rapid intergenerational assimilation. Nearly 90 percent of intermarriages within the MENA population were to non-Hispanic white spouses.
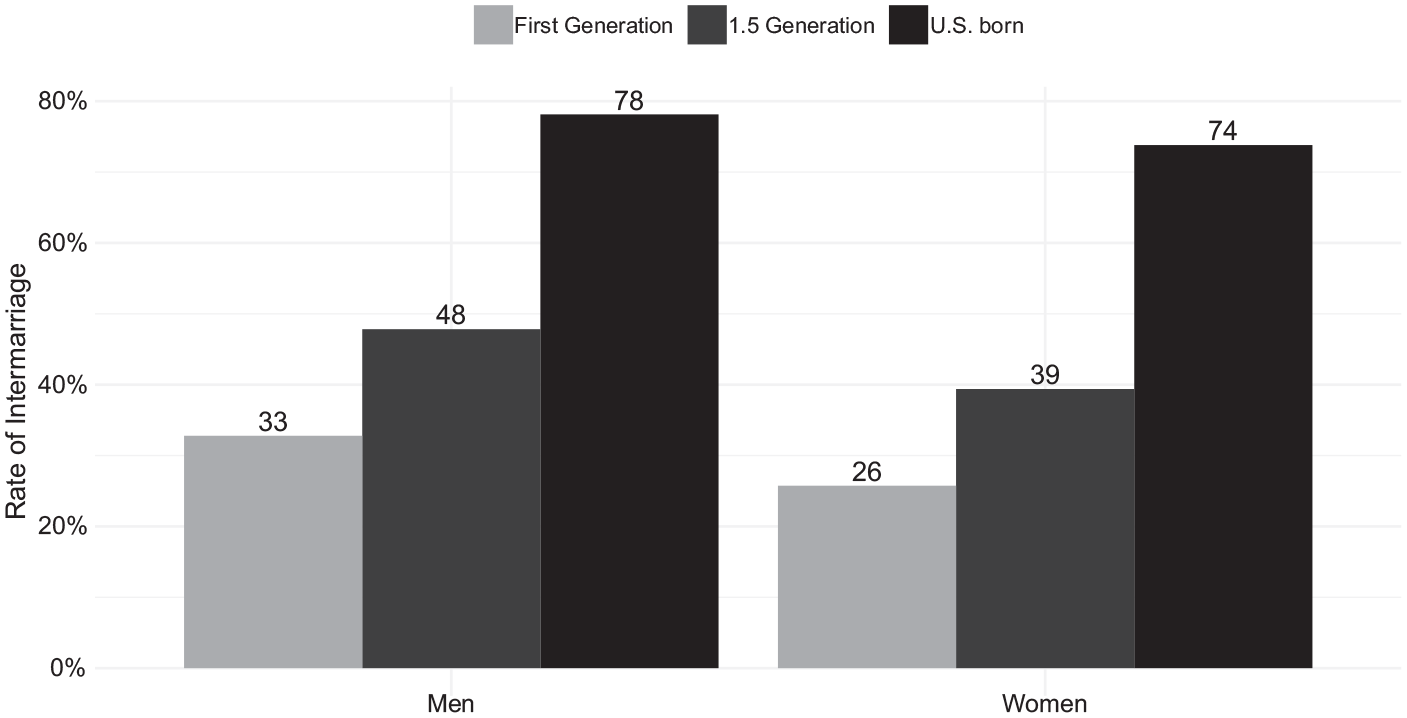
Intermarriage Rates by generation and sex for individuals with Middle Eastern and North African ancestry.
To clarify characteristics of endogamous marriages, we further examine the proportion of marriages to spouses with ancestry from the same country of origin (i.e., coethnic marriages) relative to marriages to spouses from another Middle Eastern or North African ancestry, which would approximate a “panethnic” pairing. For instance, if both the respondent and spouse identify Iraqi ancestry in either the first or second ancestry identification question, we consider it a coethnic marriage. As shown in Table 2, coethnic marriage is the most common configuration of intragroup marriage, accounting for 34 percent of marriages for men and 31 percent of marriages for women. Panethnic marriages—in which a respondent with ancestry from a MENA country is married to a spouse with ancestry from a different MENA country—is less common, accounting for only 13 percent of marriages for both men and women. This is likely an overestimate, as it includes panethnic ancestry categories by default. If the general MENA and Arab ancestry categories are excluded, roughly 5.5 percent of marriages are panethnic. Such panethnic pairings are more common among respondents with ancestry from Arab-majority countries.
Marriage Type by Sex and Ancestry Group.
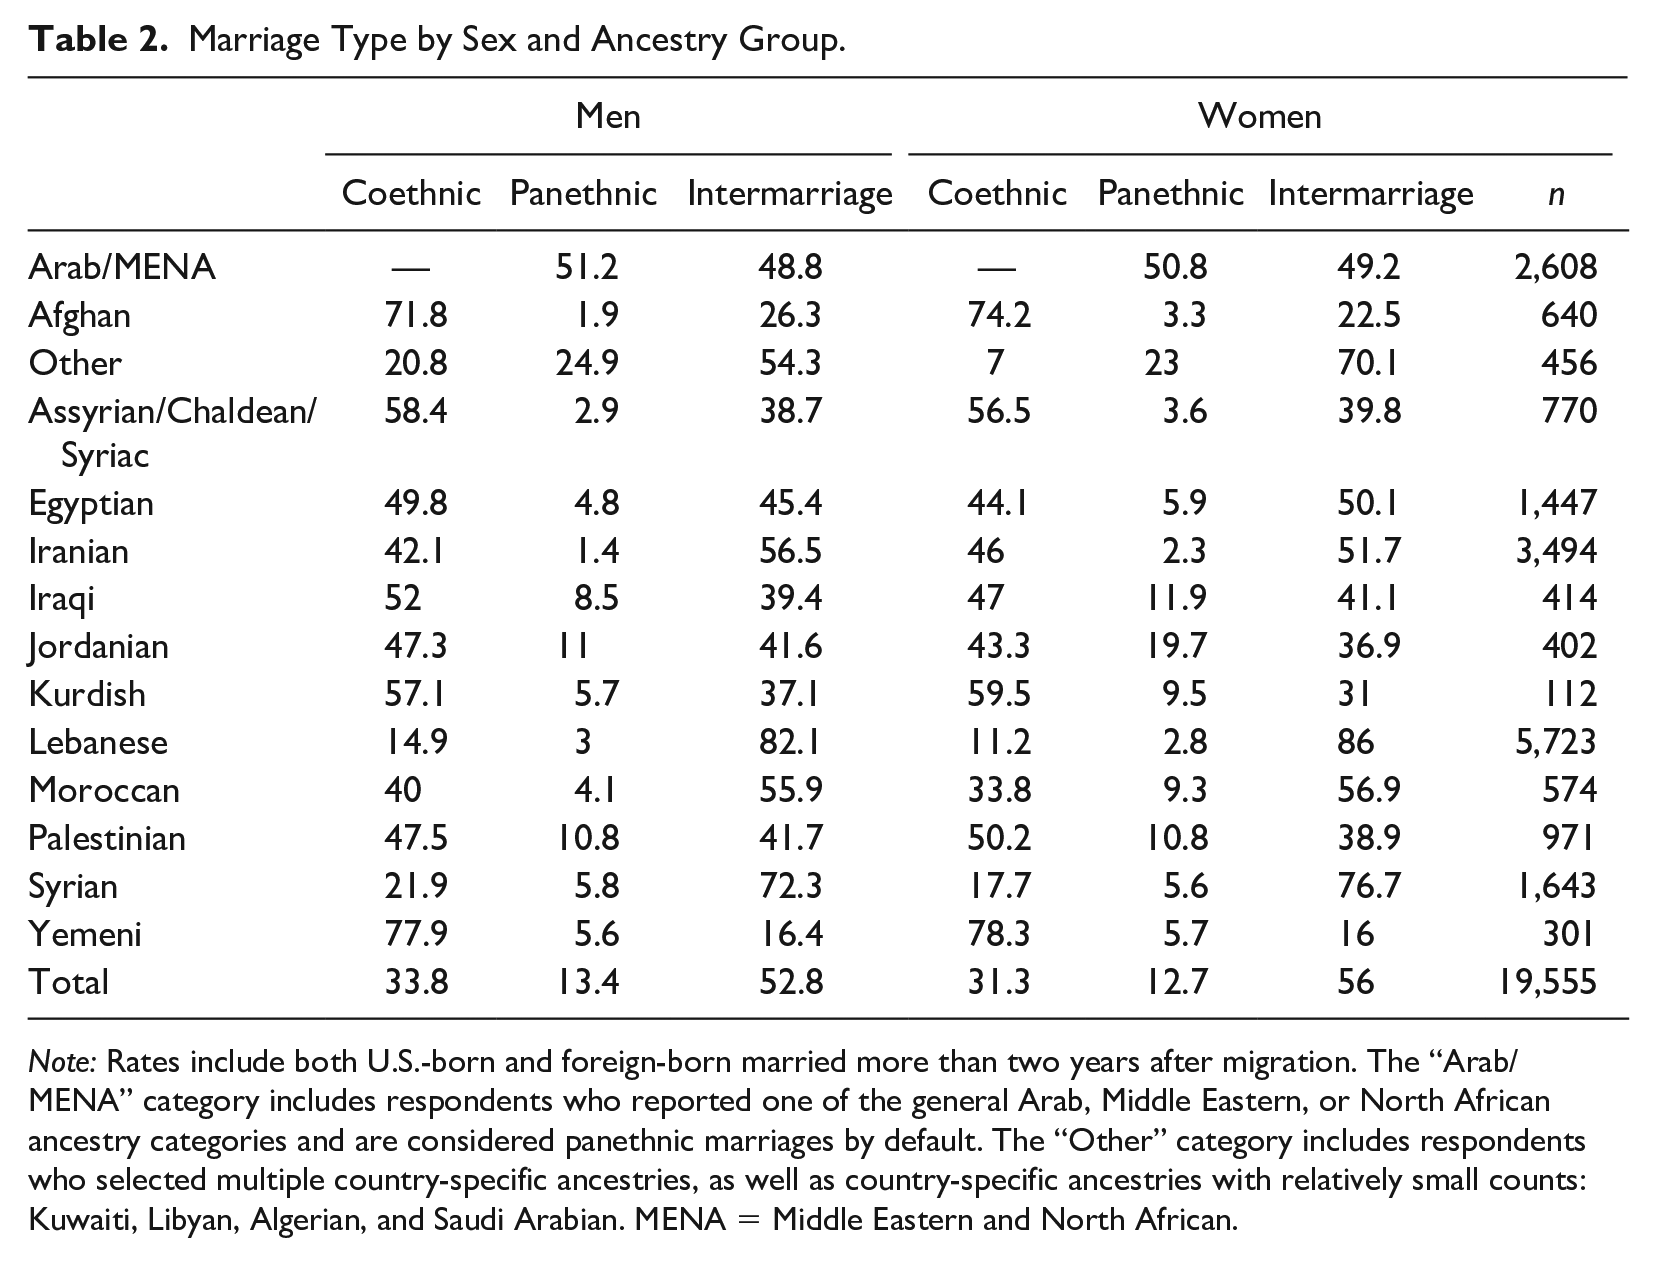
Note: Rates include both U.S.-born and foreign-born married more than two years after migration. The “Arab/MENA” category includes respondents who reported one of the general Arab, Middle Eastern, or North African ancestry categories and are considered panethnic marriages by default. The “Other” category includes respondents who selected multiple country-specific ancestries, as well as country-specific ancestries with relatively small counts: Kuwaiti, Libyan, Algerian, and Saudi Arabian. MENA = Middle Eastern and North African.
There is considerable heterogeneity in marriage patterns within the MENA group, however. Lebanese Americans have the highest rate of intermarriage (82 percent for men and 86 percent for women) and the lowest rate of panethnic marriage (roughly 3 percent) among the MENA-ancestry populations. In general, the largest groups—Lebanese, Syrian, and Iranian—have some of the highest rates of intermarriage. This is in some ways demographically counterintuitive, as often a larger coethnic population increases opportunities for endogamy. Although some of the groups with the lowest rates of intermarriage are from migration waves that are more likely to be Muslim and possibly include a larger number of refugees (e.g., Iraq, Afghanistan), the small sample sizes at the subgroup level warrant caution. In addition, some of the larger groups, such as Lebanese and Syrians, are also part of earlier waves that are more likely to have third-plus-generation respondents, whom we would expect to have higher rates of intermarriage, but we cannot distinguish generational differences among U.S.-born populations in the ACS data. Examining multiple responses to the ancestry question may provide a rough proxy. Nearly half of respondents with Lebanese or Syrian ancestry also reported non-MENA ancestry, a rate that was substantially higher than other MENA-ancestry categories. In general, respondents with mixed-background ancestry were much more likely to intermarry, with more than 90 percent of such U.S.-born respondents marrying non-MENA spouses, compared with 61 percent for men and 54 percent for women with only MENA-ancestry responses.
Despite the high overall rate of intermarriage, we find evidence suggesting that the rate is declining over time among the U.S.-born population. Figure 2 uses the year-of-marriage variable as a proxy for temporal changes in marriage patterns and shows a clear trend of lower rates of intermarriage among newer marriages. Beginning with marriages formed in the early 1990s, rates of intermarriage have declined for both U.S.-born men and women. 10 This degree of decline in intermarriage is unique to the MENA population. General trends have been in the other direction: recent marriages for U.S.-born members of all other major ethnic and racial groups have been either more exogamous than marriages in the past or relatively similar in recent decades (see Figure A2 in the Online Supplement). 11 However, given the collinearity between year of marriage and current age (i.e., recent marriages disproportionately reflect trends of younger cohorts), it is possible that the association is driven by differences in cohorts rather than a period effect.
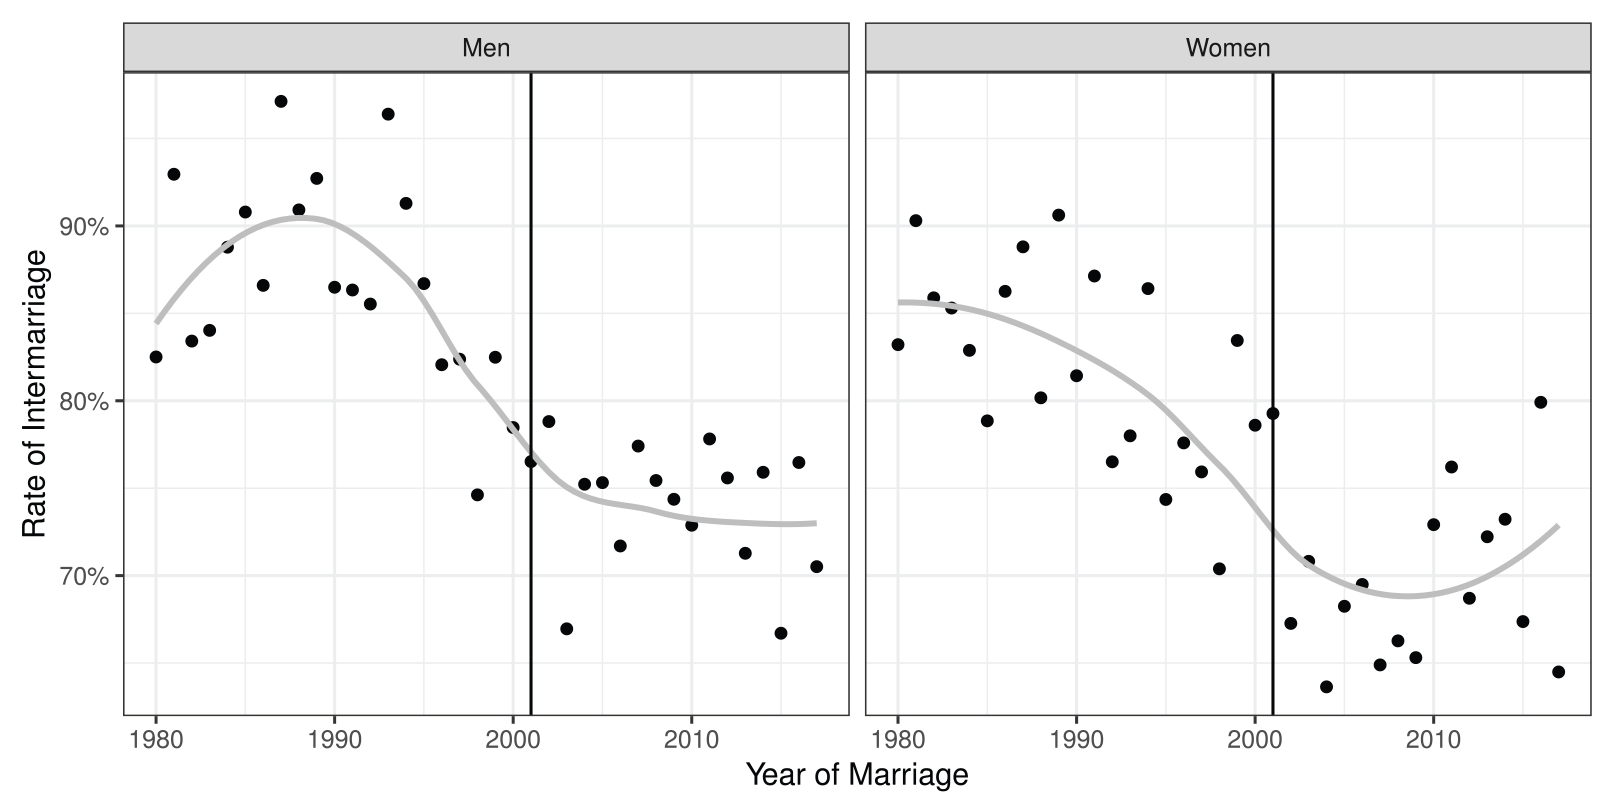
Intermarriage rates by year of marriage for U.S.-born Middle Eastern and North African men and women.
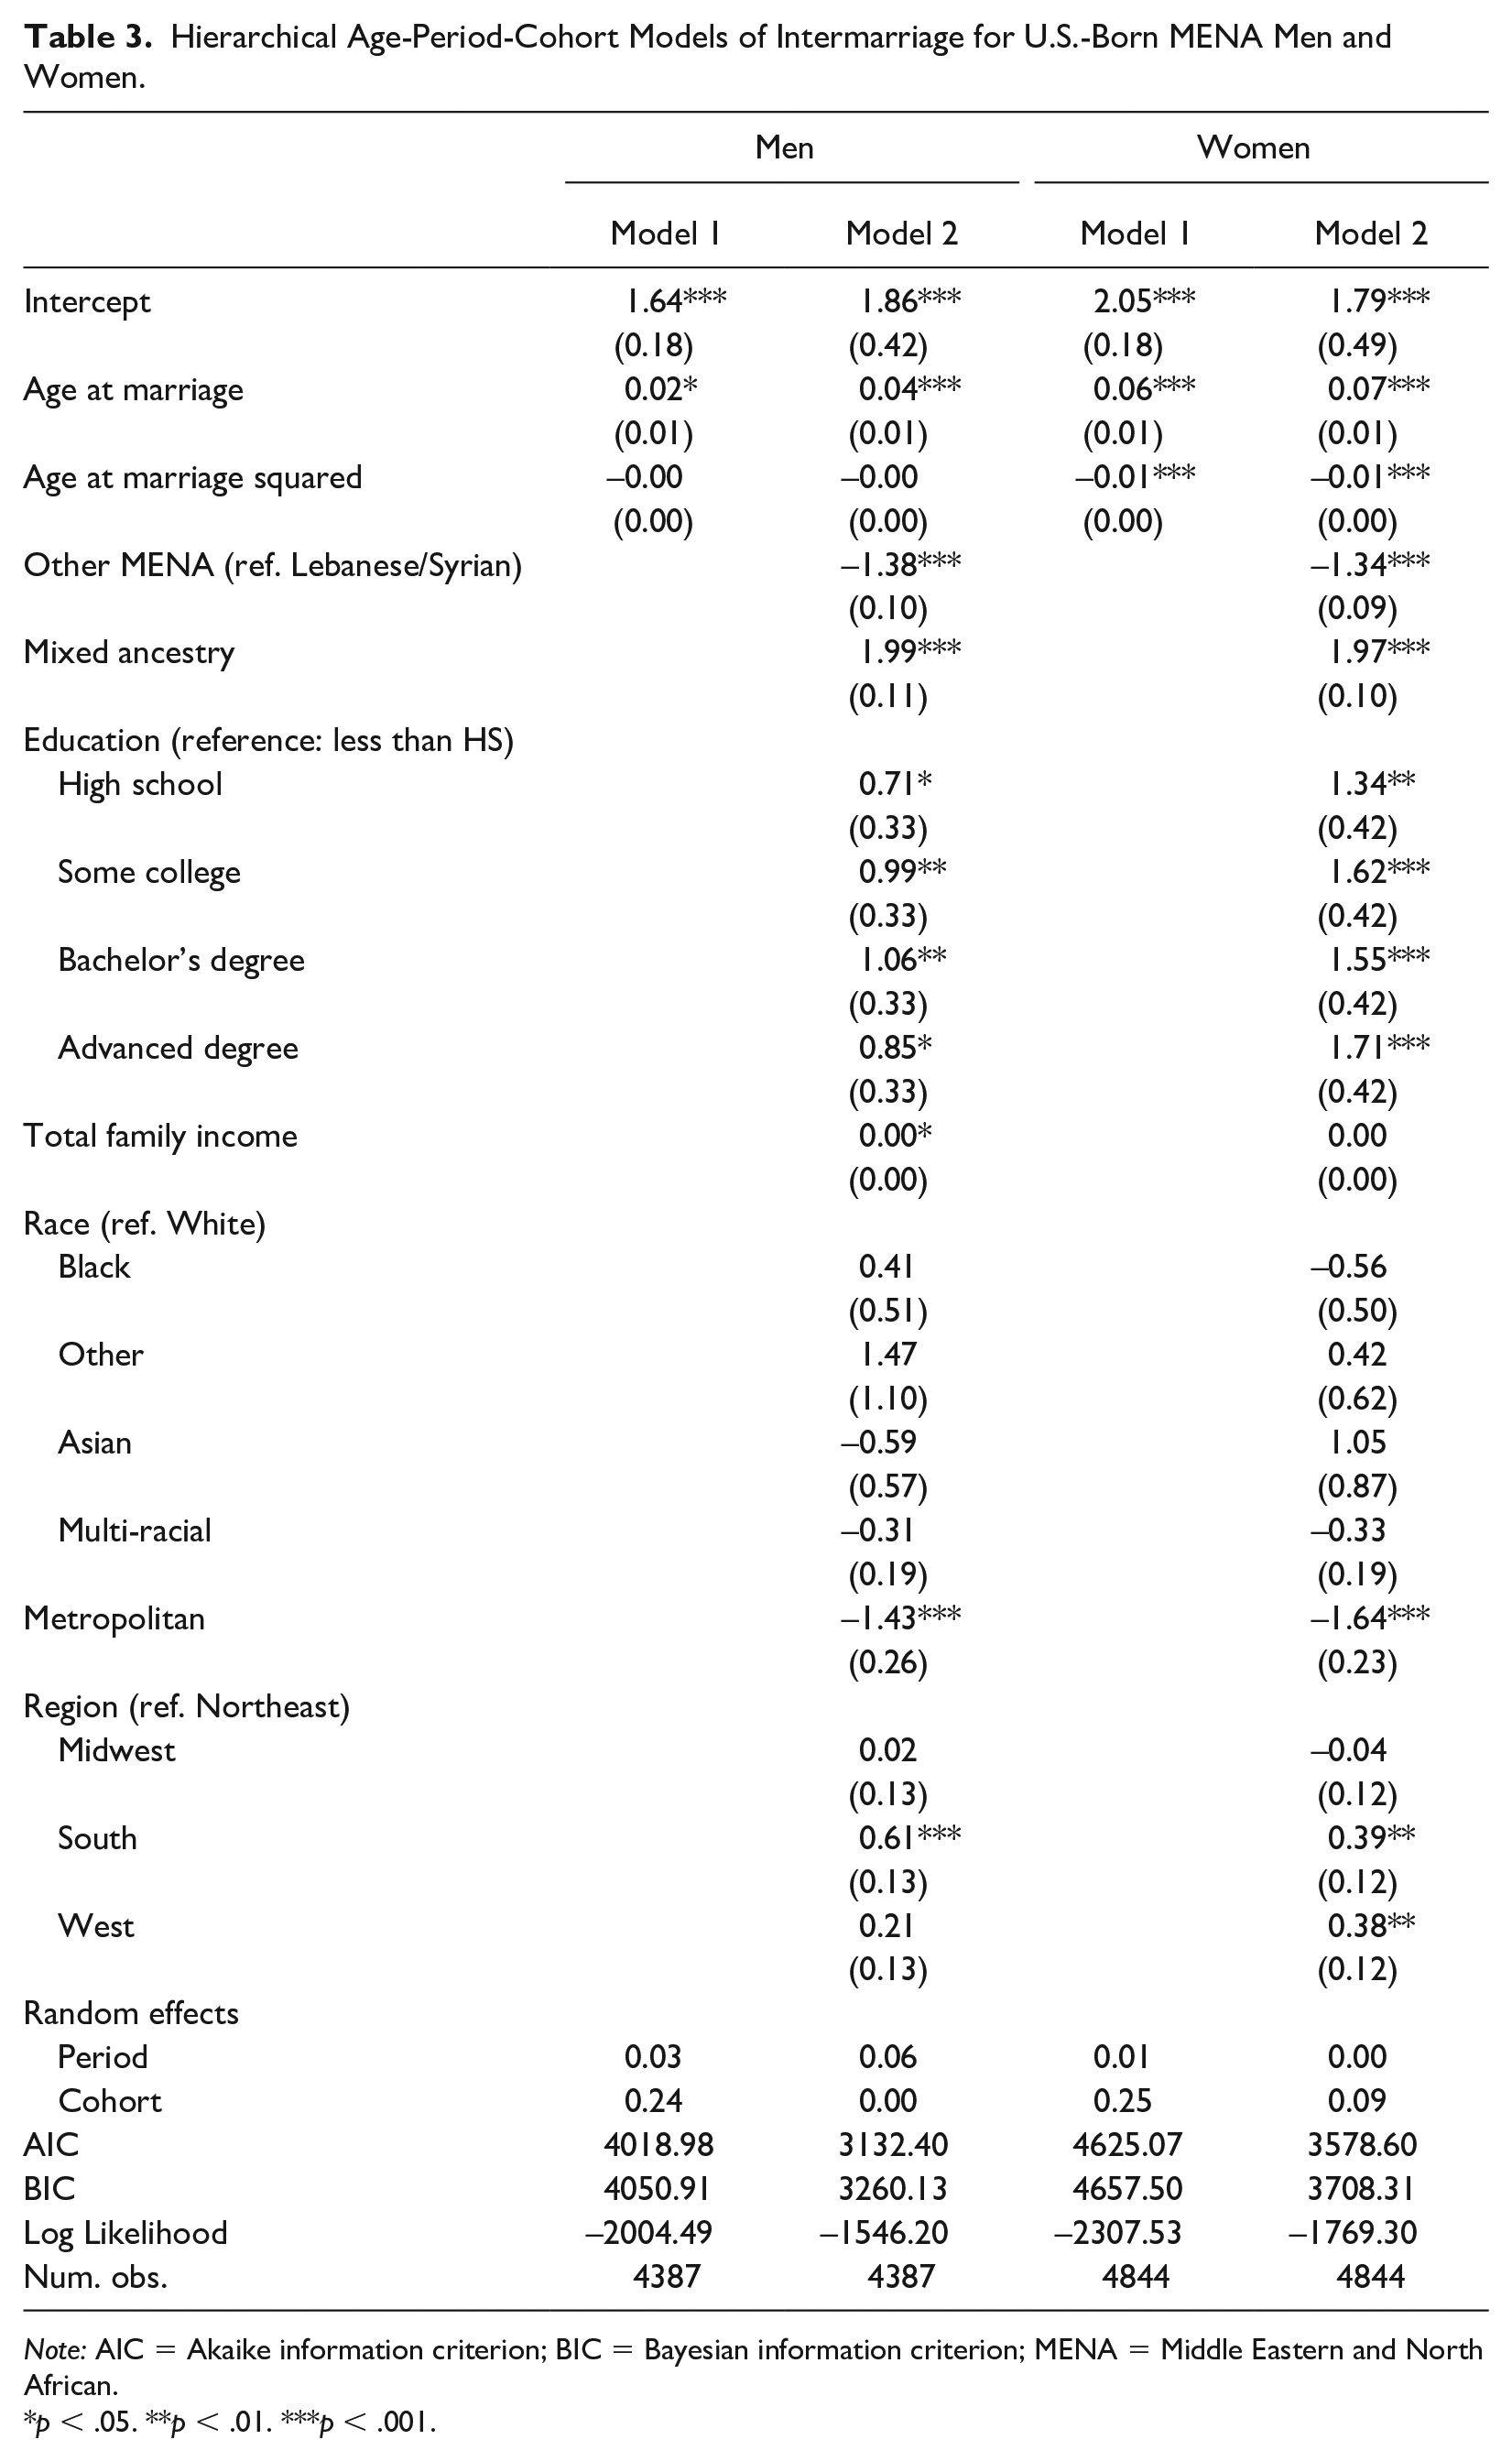
Our first step in analyzing these patterns involves decomposing age, period, and cohort effects. Model 1 in Table 3 is a baseline hierarchical age-period-cohort model. For both U.S.-born MENA men and women, age is positively associated with intermarriage. Individuals who marry younger are less likely to intermarry, and supplemental analysis suggests the decline in intermarriage is driven primarily by younger individuals. In marriages formed in the 1970s, for instance, rates of intermarriage were more similar among all age groups. However, younger MENA Americans have become less exogamous over time, with recent marriages exhibiting a positive age association with intermarriage.
Hierarchical Age-Period-Cohort Models of Intermarriage for U.S.-Born MENA Men and Women.
Note: AIC = Akaike information criterion; BIC = Bayesian information criterion; MENA = Middle Eastern and North African.
p < .05. **p < .01. ***p < .001.
The two trends just outlined—declining rates over time combined with heterogeneity between ancestry groups—raise questions about the influence of composition and societal changes on patterns of marriage pairings. There are two likely explanations for the observed trend. One is compositional: it is possible that year of marriage is not just a temporal proxy but rather correlates with demographic differences, such as changes in the composition of the MENA immigrant population over time. The second explanation contextualizes the trend in a changing social environment. Declining rates of intermarriage may reflect stronger social boundaries or reactive identity, as Arab and Middle Eastern populations have experienced racialized discrimination, particularly after 9/11.
After controlling for the two other measures, the temporal trend appears to be driven primarily by cohort changes (variance component of .25). Figure 3 plots the random effects for period and cohort levels in the baseline model. For both men and women, the relative decline appears to have begun approximately with cohorts born in the 1970s. In addition, rates of intermarriage are lowest for the cohort born 1988 to 1992 among men and for the cohort born 1992 to 1998 among women. In comparison, very little of the variation initially associated with year of marriage is related to period effects (variance components of .03 for men and .01 for women). It is also worth noting that for men, there is a negative shift in the random effect between periods in 2003 and 2004, relative to the preceding period. This could be evidence of a “September 11 effect,” in that the effect lags the event by approximately the average length of engagements. This effect is relatively small and did not continue in the periods that followed.
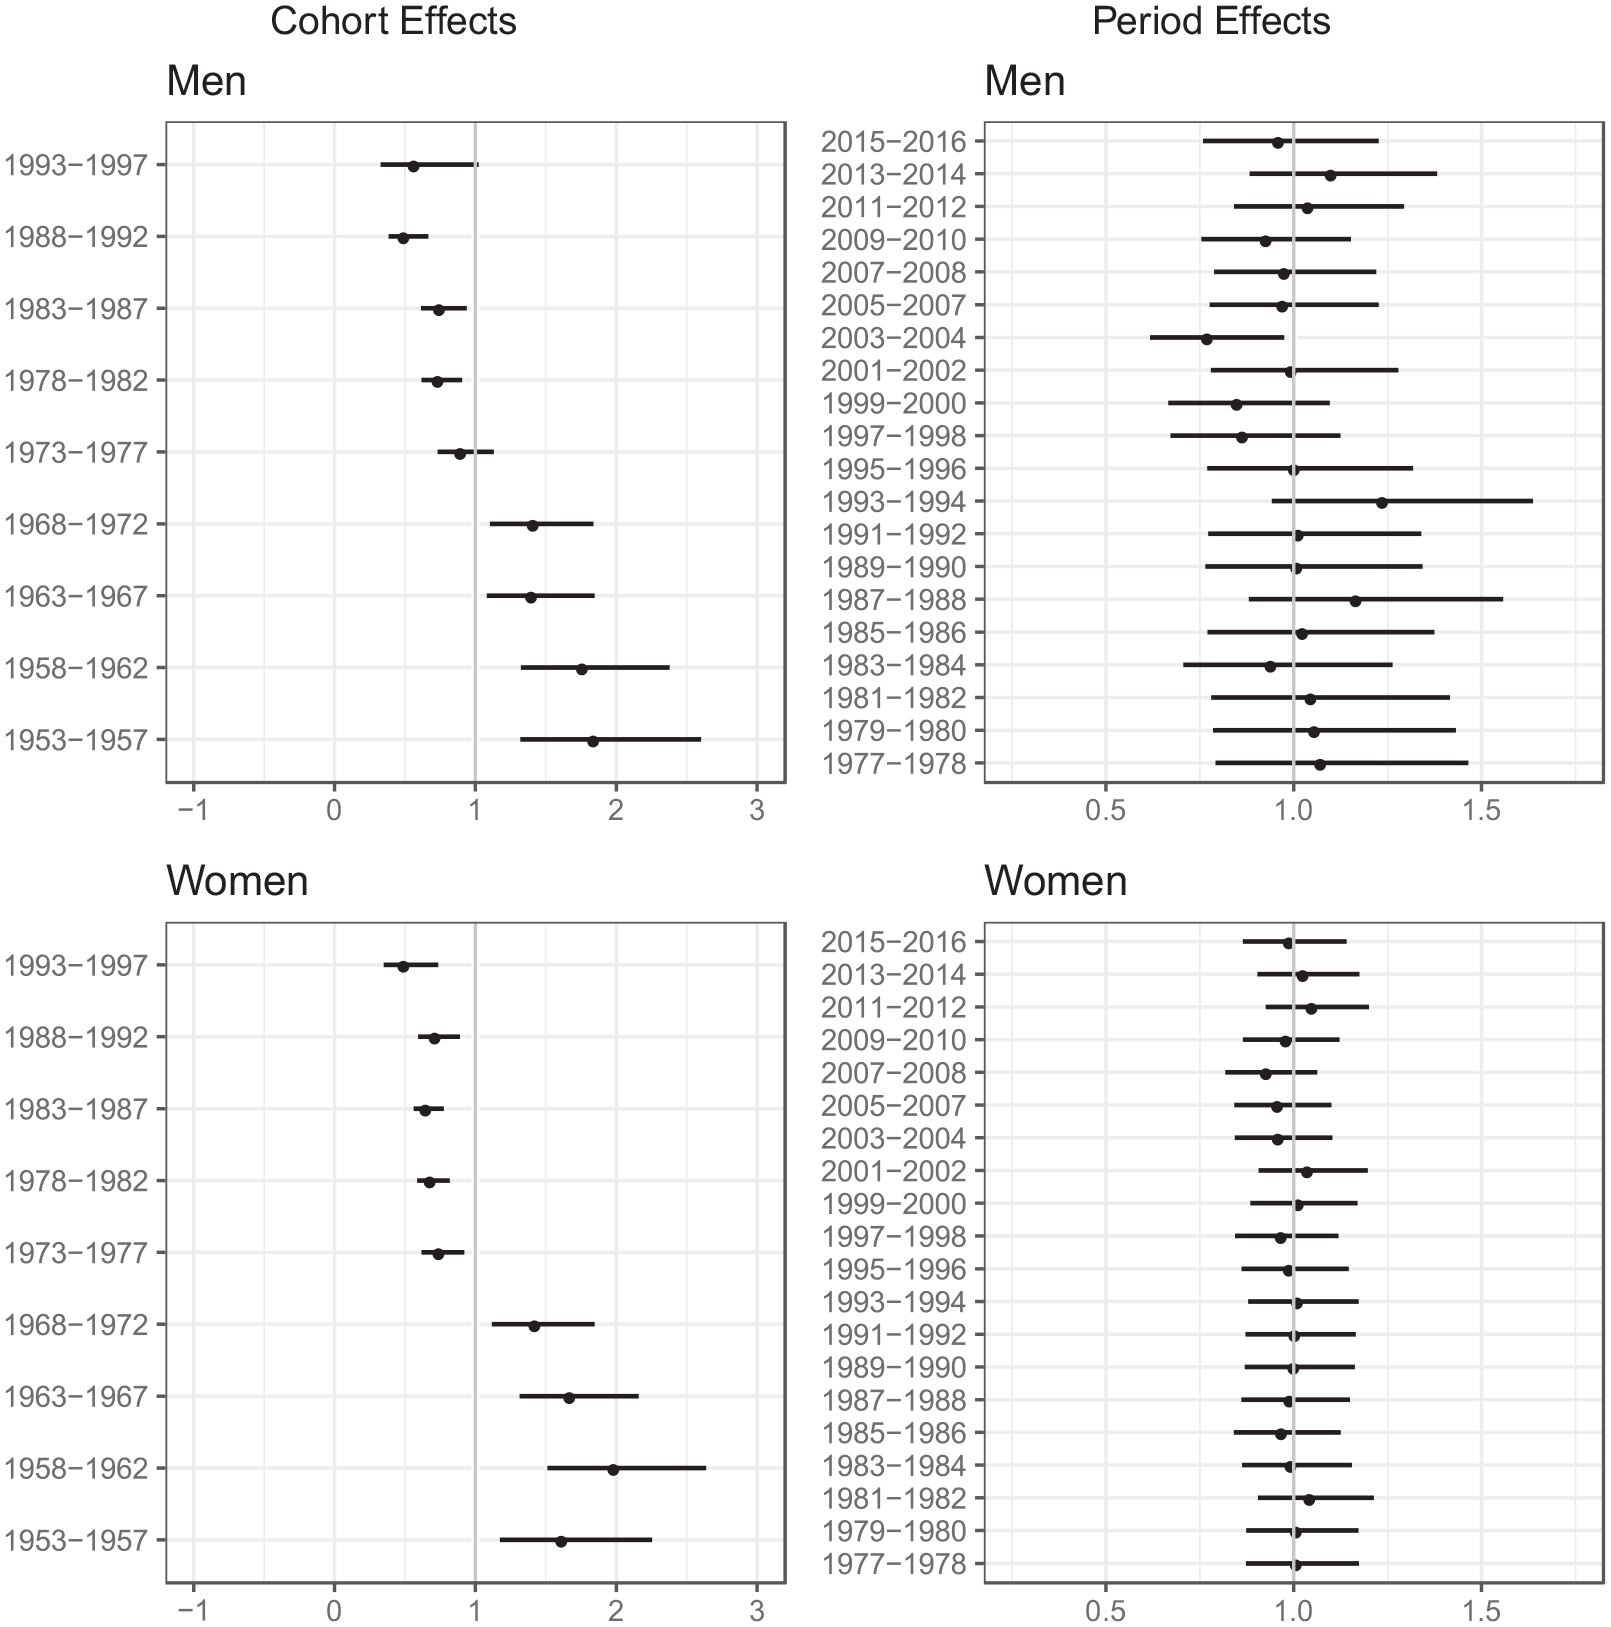
Cohort and Period Random Effects on Probability of Intermarriage for U.S.-Born Middle Eastern and North African Men and Women.
In model 2, we add a full set of controls for both self-identified race and specific ancestry group, as well as other social and demographic characteristics. These controls account for much of the cohort effect found in model 1, and the ancestry variable is primarily responsible for the level 2 reduction in variance. A portion of the temporal trend is related to the changing composition of the broader MENA population. Among the U.S.-born sample, marriages have shifted over time from predominately Lebanese and Syrian Americans, with intermarriage rates near 90 percent, to other MENA populations with lower rates of intermarriage. This compositional change partly explains the overall decline in rates of intermarriage, although even in the full model, recent marriages among younger cohorts are still predicted to be less exogamous.
The models also highlight some important within-group variation. The probability of intermarriage was lower in metropolitan areas relative to nonmetropolitan areas, suggesting marriage market characteristics affect partnering opportunities. More than 90 percent of MENA respondents in our sample live in metropolitan areas, leaving few opportunities for coethnic marriages in nonmetropolitan settings. Rates of intermarriage also increase with education for both men and women and were higher in the South and West regions of the United States.
There are also distinctions among different origin groups, with Lebanese or Syrian Americans being significantly more likely to intermarry than other MENA-ancestry groups. Although we relied on a binary ancestry indicator (0 = Syrian/Lebanese, 1 = other MENA) for the sake of parsimony, supplemental analysis using expanded ancestry categories shows that Yemeni respondents were the least likely to intermarry (see Table A3 in the Online Supplement). The Syrian/Lebanese distinction is important because they represented the majority of the U.S.-born MENA population married in the 1980s but also because early-wave Lebanese and Syrian migrants were primarily Christian. 12 Although we cannot distinguish individual-level religious differences in the available data, it is worth noting that the general cohort trends persist after controlling for country ancestry, supporting the view that intermarriage has been declining. Moreover, supplemental analysis suggests rates of intermarriage have declined with Lebanese and Syrian populations, as well.
Discussion
Our analyses of MENA intermarriage patterns reveal three important findings. First, migrants from MENA countries, and their descendants, intermarry at high rates. The U.S.-born MENA population has particularly high rates of intermarriage, higher than rates for comparable Hispanic and Asian populations. This suggests a relatively strong overall assimilation trajectory.
Second, there is very little evidence of “panethnic” marriage ties among this population. Intermarriage is more common outside of the group than to MENA ancestry of a different ethnicity or nationality. This finding, along with the degree of heterogeneity within the MENA category, suggests that frameworks of “panethnic” identify formation may not apply to this population, at least when it comes to marriage. However, this does not preclude other forms of panethnic ties, such as political organization, that may make the MENA category salient in the context of the U.S. ethnoracial hierarchy.
Finally, rates of intermarriage appear to have declined in recent years, particularly among more recent cohorts of U.S.-born Americans with MENA ancestry. There are several possible drivers of this trend. First, a portion of the decline is likely explained by the changing composition of the population. Lebanese and Syrian immigrants, for example, are among the most exogamous of all MENA-ancestry groups, yet their relative representation in U.S.-born MENA marriages has declined from more than 80 percent of marriages formed in the 1970s to less than 50 percent of MENA marriages in the 2010s. It is unclear whether their high rates of intermarriage in the sample are due to more third-plus-generation respondents among these groups, or if early waves of Christian Arab immigrants faced few social barriers to integration due to their religious identification.
Another related explanation focuses on the compositional effects related to religious, rather than racial, endogamy. To the extent that more recent cohorts of MENA immigrants and their children represent groups that are more likely to marry within their faith(s), this may explain the declines in intermarriage by younger cohorts of MENA Americans. Yet research on other religious groups in the United States has shown that interfaith marriage has become more common, especially among younger cohorts (McClendon 2016; Pew Research Center 2015; Sherkat 2004). However, as previously noted, the ACS does not allow us to examine the religion of respondents. Furthermore, compositional changes do not fully account for the lower rates of intermarriage among younger cohorts, suggesting social changes may be partially driving the trend.
A third explanation is that declines in intermarriage may reflect social boundaries and discrimination that increasingly hinder assimilation in the post-2001 era. There is evidence of a brief post-9/11 effect for MENA men, measured as a period effect from 2003 and 2004. This is the only significant period effect in the model, and it aligns with other evidence of discrimination primarily against MENA men in the years immediately after the attacks. It is worth noting that nearly all marriages for cohorts born after the mid-1970s took place after 2001, making it difficult to fully disentangle period and cohort effects. The cohort-based declines in intermarriage may be further evidence of a post-2001 social change rather than a contradiction of that explanation.
These findings stand out in comparison with research on marriage among other immigrant populations. The rate of intermarriage for the U.S. MENA population is higher than that of any other group. This may be due in part to the small relative size of MENA populations, which limits their opportunities for endogamy. But it may also reflect their unique social position and history in the United States. Arab and other Middle Eastern have been considered formally “white” by the Office of Management and Budget and other institutions. This may have provided opportunities for social mobility and intergroup marriage that were not available to other minority populations. At the same time, it has left them “invisible” in many government records and in scholarship on racial boundaries and intermarriage.
The decline in rates of intermarriage is also unique, as is the pattern of younger MENA Americans’ being less exogamous than their older peers. Demographic and discrimination explanations for this change may be complementary, rather than contradictory. Newer cohorts may have different marriage preferences related to their national origins or religious backgrounds, but they may also experience greater discrimination and social exclusion because of those same characteristics. Racial boundaries have often been drawn in conjunction with religious differences, as was the case with early twentieth-century Catholic and Jewish migrants from Ireland, Spain, and Central and Eastern Europe (Kennedy 1952). Scholars have increasingly argued that formally recognized “whiteness” does not accurately capture the social experience of MENA Americans. Arab and Middle Eastern Americans have experienced interpersonal discrimination, government surveillance, and other acts of symbolic exclusion that have created “racialized” boundaries between them and other non-Hispanic whites (Love 2017; Maghbouleh 2017, 2020; Selod 2014). Although this has become more pronounced since the attacks of September 11, the racialization or “orientalization” of MENA Americans preceded 2001. This context of racialized social exclusion may partially explain the other unique findings from this research. Although other groups have become more exogamous in cases in which boundaries have weakened, U.S.-born MENA Americans may have become less so as boundaries have arguably hardened.
It is important to interpret these findings in the context of substantial methodological and theoretical limitations associated with studying Arab and Middle Eastern populations. Although previous studies have relied on similar ancestry or country groupings in census data to define Arab or Middle Eastern populations, the available data lack information that would allow testing differences by religion. This is an important omission that could affect both marriage decisions and experiences of social boundaries. We do not know if what appear to be intergroup marriages are religiously endogamous or vice versa. We also do not know if shifts in social boundaries may have differentially affected marriage patterns for Muslim and non-Muslim MENA populations. The post-2001 backlash has, on its surface, been directed at Muslims as a religious group. Yet qualitative scholarship suggests that both Muslim and non-Muslim populations from the Middle East have experienced racialized discrimination tied in part to physical appearance, rather than religious cultural markers. Still, the shift from primarily Christian to primarily Muslim migration from these countries likely plays a role in marriage trends, particularly after 2001. Even if other factors are similar, individuals descending from early waves of immigration are more likely to be third-plus generation, for which we would expect higher intermarriage, but we are unable to disaggregate the U.S.-born population by generation in the ACS data.
It is also challenging to assess numeric rates of intermarriage for such a small population. Studies of marriage trends often rely on loglinear modeling or similar methods that account for relative population size in the context of marriage market interactions. However, these approaches are ineffective at predicting rates of interactions for extremely small populations for which geographic marriage market data are unavailable and population-constrained predictions may be unrealistic. In general, small populations have fewer opportunities for endogamy than larger ones. Yet the within-group heterogeneity, timing of the changes, and persistence of the findings after controlling for demographic factors all suggest that the above trends are not driven by changes in group size alone.
This analysis is limited in ways that are common to age-period-cohort analysis (i.e., the inherent challenges of collinearity), but also in ways that are unique to studying marriage trends. There is debate about the application of hierarchical models to solve the age-period-cohort identification problem (Bell and Jones 2014, 2015; Reither, Land, et al. 2015; Reither, Masters, et al. 2015). However, critics often caution that hierarchical age-period-cohort models are biased toward period effects, which does not appear to be the case in our analysis. Although our models point to cohort explanations, the cohorts that saw the initial shifts in intermarriage rates, starting in the 1970s, were also the first to have the majority of marriages take place after 2001. Because marriage patterns for cohorts are often determined across a relatively narrow age range, it may not be possible to have true period effects that are seen across all cohorts and age groups, unless measured by another metric. Despite the limitations in teasing out period and cohort explanations, it is clear that marriage patterns among MENA Americans have changed in ways that are unique and warrant further research.
Our research offers an initial step toward incorporating MENA Americans into scholarship on marriage as an indicator of group dynamics. Contrary to political discourse, the trajectory of MENA immigrants and their descendants, as indicated by marriage patterns, appears to be one of relatively rapid assimilation. Yet intersections of race, country of origin, and gender play a role in the patterns of marriage within and between groups, which appear to be changing for younger cohorts that are marrying in a changed social environment. Although MENA Americans are often subsumed under the white racial category in official documents and institutionalized racial classification systems, their marriage dynamics suggest that they warrant study as a population with distinct social experiences within the U.S. ethnoracial hierarchy. Further research is needed to fully understand how these experiences have changed in an increasingly exclusionary and racialized social context.
Supplemental Material
Online_Supplement – Supplemental material for Changing Boundaries of Whiteness? Demographic and Social Determinants of Middle Eastern and North African Marriage Trends in the United States
Supplemental material, Online_Supplement for Changing Boundaries of Whiteness? Demographic and Social Determinants of Middle Eastern and North African Marriage Trends in the United States by Elyas Bakhtiari and Deenesh Sohoni in Sociology of Race and Ethnicity
Footnotes
Acknowledgements
We would like to thank Cai Yong, Nazli Kibria, and the anonymous reviewers for helpful feedback, comments, and ideas that improved the development of this article.
Supplemental Material
Supplemental material for this article is available online.
Notes
Author Biographies
References
Supplementary Material
Please find the following supplemental material available below.
For Open Access articles published under a Creative Commons License, all supplemental material carries the same license as the article it is associated with.
For non-Open Access articles published, all supplemental material carries a non-exclusive license, and permission requests for re-use of supplemental material or any part of supplemental material shall be sent directly to the copyright owner as specified in the copyright notice associated with the article.
