



Abstract
Of course, ensuring safe environments in the U.S. educational system is paramount. It is also evident, however, inequalities associated with immigration, race/ethnicity, and situational context can impede school safety pursuits. Although prior research has revealed a pattern between “downward” assimilation and increased experiences with student-level violence and disorder for the children of racial/ethnic immigrants (i.e., first- and second-generation), investigations about school-level rates of violence and disorder associated with the context of reception remain uncertain. Our study seeks to contribute to the research about immigration, racial/ethnic inequality, education, and violence by examining the associations between context, school violence, and crime, and the schooling of children of immigrants by drawing on a context of reception conceptual framework to address three research questions. First, is there an association between an increasing proportion of children of immigrants and school crimes (i.e., violence, property damage, and substance use)? Second, are there differences linked to the context of reception (i.e., urban, suburban, town, and rural) in the association between the increasing proportion of children of immigrants and school crime? Third, are there racial/ethnic differences in the association between the increasing proportion of children of immigrants and school crimes in distinct contexts? Findings indicate that the children of racial/ethnic minority immigrants have significantly distinct associations with rates of school violence and crime across all contexts; however, there are important and distinctive nuances that are presented and examined.
It is well-established that crime and violence that occur at school is detrimental for the educational process of all students as well as the collateral damage from these events has life-long detrimental consequences (Durán 2013, 2018; Rios 2011, 2017; Shedd 2015). Violence and crime that occur at school have received much social, educational, and policy concerns because schools are institutions of socialization that facilitate development and educational progress for all youth (Rios 2011, 2017; Shedd 2015; Welch and Payne 2010, 2012); however, this social, developmental, and educational process is only intensified for the children of immigrants. School is where the children of immigrants (i.e., first and second generation) not only learn about U.S. values, beliefs, and behaviors but also about their social and cultural role in society (Kao, Vaquera, and Goyette 2013; Suárez-Orozco, Suárez-Orozco, and Todorova 2010; Zhou 2009). This is why many scholars have investigated the role of schools concerning the assimilation process for the children of immigrants within the United States. Although prior research demonstrates that the children of immigrants have increased commitment to pursue educational goals, stronger bonds to school, and less likely to engage in violence and crime (Kao et al. 2013; Kubrin and Desmond 2015; Peguero 2009, 2011; Suárez-Orozco et al. 2010), it is also evident the children of immigrants reside in under-resourced and marginalized communities and attend disadvantaged schools with disorder, racial/ethnic discrimination, and diminished educational resources (Kao et al. 2013; Portes and Rumbaut 2014; Suárez-Orozco et al. 2010). To that end, most of the prior research about violence and crime at school as well as the schooling of children of immigrants has primarily focused on urban contexts.
Research on immigration, assimilation, and adaptation has focused on how characteristics of immigrants and their children are associated with later outcomes. However, more recent research has increased focus on the characteristics of the host communities and contexts where immigrants and their children arrive. Generally, the notion of contexts of reception includes the economic, social, political, legal, and violent aspects of host communities (Filindra, Blanding, and Coll 2011; Golash-Boza and Valdez 2018; Portes and Rumbaut 2014; Zhou 2009). As noted in these studies, educational institutions are an important element of contexts of reception for immigrants and their children. Although immigrants migrate to the United States in hope of upward economic mobility for themselves and educational opportunities for their children, immigrants and their children arrive and quickly face racism, nativism, discrimination, crime, and violence as part of their reception in their pursuits of employment and educational pursuits (Kao et al. 2013; Portes and Rumbaut 2014; Suárez-Orozco et al. 2010; Zhou 2009). Considering that there are increasing numbers of immigrant families migrating to suburban and rural communities and contexts, it is important to investigate the contexts of reception for the children of immigrants in non-urban schools regarding crime and violence.
Our study extends prior research about immigration, schools, and youth violence by examining the associations between place and context, school crime (i.e., violence, property damage, and substance use), and the schooling of children of immigrants by drawing on a context of reception conceptual framework. Utilizing the nationally representative 2015–2016 School Survey on Crime and Safety (SSOCS), the study addresses three overarching research questions.
Findings indicate that the context of reception is connected with the relationship between immigration and school crime; however, important and distinctive nuances are presented and examined. Finally, our study discusses implications for the complex relationship between the context of reception, immigration, and school crime especially considering the importance of providing a safe and healthy educational learning environment for all students.
Immigration, Race/Ethnicity, Context of Reception, and Schools
Alejandro Portes and Rubén G. Rumbaut (2014) depict how well immigrants and their children incorporate into the U.S. society and economy is influenced by the “context of reception.” That context of reception either welcomes or derails them upon arrival and places them on a path toward “upward” or “downward” socioeconomic and educational mobility. This context of reception is comprised of many contextual factors such as government policies, relationship to the dominant societal or cultural group, opportunities to succeed in the educational system or the labor market, and community characteristics such as disorder, violence, and crime. In addition, Portes and Rumbaut (2014) highlight that contexts of reception can vary depending on geographic location and histories associated with immigration such as being an urban gateway and new suburban or rural immigrant destination.
Approximately 43 million residents, or 13 percent of the total U.S. population, are foreign-born. Twenty-five percent of all youth in American schools have at least one immigrant parent and that percentage is expected to increase to 33% by 2040 (U.S. Census Bureau 2017). According to the U.S. Department of Education (2015), there are approximately 840,000 immigrant students and more than 4.6 million students have at least one parent who is an immigrant. In response to this growing population of children of immigrants within U.S. schools, there have been many studies investigating and understanding the correlates and factors associated with the educational progress and success for the fastest-growing segment of the U.S. school population—the children of immigrants. Consequently, immigrant generation, race/ethnicity, and context of reception is a key that influences the school experiences of children of immigrants (Filindra et al. 2011; Kao et al. 2013; Suárez-Orozco et al. 2010).
Immigrant generation matters when examining the educational and school experiences of racial/ethnic minority students. In other words, there are evident distinctions between first-, second-, and third-plus-generation students’ experiences within the school, particularly for racial/ethnic minorities. First-generation immigrant students have strong relationships with teachers, that relationship steadily deteriorates across generations and lessens students’ chances for success in school; third-plus-generation immigrant students are more likely to be exposed to school violence and punishment than their first- and second-generation counterparts (Peguero 2009, 2011; Peguero and Bondy 2015, 2020; Peguero and Shekarkhar 2011). Segmented assimilation theorists highlight the possibility of a “downward” assimilation process that could facilitate the increased risk of educational failure as the children of immigrants undergo the assimilation process (Kao et al. 2013; Portes and Rumbaut 2014; Suárez-Orozco et al. 2010). It is the concept of “downward” assimilation that raises significant policy, research, and social concerns about the economic, social, and educational experiences of the children of immigrants. Because of the deterioration of public schools, the rise in drug use and violence, and the adversarial discourse about immigration that the children of immigrants endure in U.S. schools, it is believed that the educational progress and success of the fastest-growing segment of the U.S. student population is being derailed (Filindra et al. 2011; Kao et al. 2013; Suárez-Orozco et al. 2010; Zhou 1997, 2009). Segmented assimilation theorists suggest that as the children of immigrants assimilate or become “Americanized,” they are at greater risk of educational and economic failure and marginalization (Zhou 1997, 2009). Furthermore, these theorists suggest that racial/ethnic inequality and discrimination contribute to why some of the children of immigrants are facing educational barriers and hurdles that restrict progress and success within U.S. schools.
The race/ethnicity of the majority of contemporary immigrants set them apart from the previous waves of immigrants who were primarily from Europe. For the current wave of immigrants, many of them have never experienced prejudice associated with particular skin color or racial type in their country of origin (Portes and Rumbaut 2014; Zhou 1997, 2009). Immigrants and their children are confronted with the reality of racial/ethnic stratification and discrimination in U.S. schools (Filindra et al. 2011; Kao et al. 2013; Suárez-Orozco et al. 2010). Barriers and hurdles of educational success and school safety for students in immigrant families are inextricable with racial/ethnic inequality in U.S. schools. Consequently, the trajectories of the children of immigrants can be influenced by race/ethnicity. The children of racial/ethnic minority immigrants report that racism, discrimination, and biased treatment are daily parts of school experiences (Filindra et al. 2011; Kao et al. 2013; Suárez-Orozco et al. 2010). Race/ethnicity is known to be associated with students having less access to educational resources, receiving less attention from teachers and administrators, being placed on lower educational tracks and steered toward low-paying employment, having poor perceptions of school justice and fairness, and weaker bonds to school, and being more likely to be suspended and expelled from school (Bondy, Peguero, and Johnson 2019; Filindra et al. 2011; Kao et al. 2013; Peguero and Bondy 2015, 2020; Suárez-Orozco et al. 2010); however, this assimilation, racialization, and criminalization process apparent within schools is undoubtedly part of students’ school experiences and lives. To that end, it is also apparent that school location and context of reception for the children of immigrants play an important role in their school experiences.
The children of immigrants are historically and currently more likely to reside in urban communities that are characterized by poverty, unemployment, crime and violence, isolation, and discrimination (Portes and Rumbaut 2014; Zhou 1997, 2009). There is also an increasing trend of immigrants and their children migrating to rural communities also with limited economic resources and employment opportunities (Brown, Jones, and Becker 2018; Cervantes, Alvord, and Menjívar 2018; Kao et al. 2013; Lee and Hawkins 2015; Portes and Rumbaut 2014). Considering that schools often reflect the communities to which they are embedded, it is important to discuss and understand the context of reception schools have for the children of immigrants. School-level contextual characteristics are emerging to be an important factor in regard to the school experiences of the children of immigrants. Contexts of reception include the legal, economic, social, and political aspects of host communities that manifest at different nested ecological levels (Filindra et al. 2011; Golash-Boza and Valdez 2018; Lee and Hawkins 2015; Portes and Rumbaut 2014). Schools are an essential element of contexts of reception for immigrant families. Studies have examined how a wide variety of policies shape contexts of reception for immigrant students, affecting their opportunities and outcomes. These include federal law regarding children’s right to education regardless of documentation status, state-level policies about the extent to which immigrants are included in state welfare programs, and school-level policies about how teachers engage and instruct the children of immigrants and their families (Filindra et al. 2011; Golash-Boza and Valdez 2018; Portes and Rumbaut 2014). For instance, on one hand, schools can also play a positive role in engaging immigrant families and their children through several channels, such as developing culturally responsive events, creating communicative bridges with families, and supporting a schoolwide recognition of the unique assets newcomer students and their families bring; on the other hand, schools can also have a negative role in engaging immigrant families and their children through many channels, such as restricted access to educational opportunities and extracurricular activities, implementing stringent surveillance and punishment policies or practices, and sustaining an anti-immigrant climate of harassment and biased treatment (Durán 2013, 2018; Ee and Gándara 2020; Garver and Noguera 2015; Kao et al. 2013; Peguero 2009, 2011; Peguero and Bondy 2015, 2020; Peguero and Shekarkhar 2011; Rios 2011, 2017). What remains unknown, however, is the association between the schools’ context of reception and crime for the children of immigrants.
Immigration, Race/Ethnicity, Context, and School Crime
Of course, schools are primarily sites of formal learning and education; however, the school is also an environment or situational context that may ensure or undermine safety for their students (Rios 2011, 2017; Shedd 2015; Welch and Payne 2010, 2012). As noted, school violence and crime have received much social, educational, and policy concerns because schools are institutions of socialization that facilitate development and educational progress for all youth (Rios 2011, 2017; Shedd 2015). A school context of violence and crime impedes the educational process of all students, and the subsequent collateral damage from these events has life-long detrimental consequences (Rios 2011, 2017; Shedd 2015). Although understanding the relationship between school crime and immigration is complex, there are two predominant ways of understanding how the community and school context may be sites that can insulate or promote violence and crime for the children of immigrants.
First, considering the community context, the patterns of “downward” assimilation and distinctions via immigrant generation in comparison with youth community deviance, violence, and crime are evident. First- and second-generation immigrant youth are less, while third-plus-generation immigrant youth are more, likely to hit someone; throw objects at someone; carry a weapon; be involved in a gang fight; pickpocket or snatch a purse; be involved in gang activity, substance use, and risky sexual behavior; and exhibit aggressive and violent behavior (Desmond and Kubrin 2009; Jiang and Peguero 2017; Kubrin and Desmond 2015; Ousey and Kubrin 2018; Sampson 2008). There are individual and contextual factors that have been proposed as to why assimilation may be equivocating to increased deviance for youth. The children of immigrants are often “law-abiding” because many immigrant parents, as well as their immigrant children, are socialized with native cultural beliefs of respecting authority (e.g., police, parents, teachers) and being obedient; on the contrary, third-plus-generation youth have more engagement in deviance, violence, and crime (Ousey and Kubrin 2018; Peguero and Bondy 2015, 2020; Rengifo and Fratello 2015; Sampson 2008; Zhou 1997, 2009). Moreover, immigrants have optimistic attitudes about upward mobility for themselves as well as their children; however, that optimism tends to erode by the third-plus generation due to racism, discrimination, biased treatment, and blocked opportunities (Kao et al. 2013; Peguero and Bondy 2015, 2020; Portes and Rumbaut 2014). Contact and interactions with deviant, violent, and criminal youth increase as the children of immigrants assimilate (Desmond and Kubrin 2009; Jiang and Peguero 2017; Kubrin and Desmond 2015; Sampson 2008). The process of becoming American is presumed to be one of becoming deviant and assimilating the American phenomenon and tradition of a “moral rejection of authority” (Zhou 1997). Research also demonstrates that the proportion of immigrant residents and social and physical disorders are associated with engagement with deviance and crime for the children of immigrants (Desmond and Kubrin 2009; Jiang and Peguero 2017; Kubrin and Desmond 2015; Sampson 2008). Thus, community social disorder (e.g., a high population of deviant youth, a culture of deviance, gang prevalence) and physical disorder (e.g., graffiti, litter, deteriorating buildings) may be community contextual factors that contribute to youth violence and deviance.
Second, considering the school context, school is a place where deviance, violence, and crime could be conveyed by students who are interacting with well-behaved or misbehaved students. The children of immigrants are more likely to attend marginalized and disadvantaged schools with increased levels of disorder, discrimination, and diminished educational resources (Ee and Gándara 2020; Garver and Noguera 2015; Gonzales 2016; Kao et al. 2013; Peguero and Bondy 2015). Thus, misbehavior may be normative and part of the school’s environment or contextual climate and influence the behavior and exposure to disorder and violence of children of immigrants. The children of immigrants are more likely to attend schools with increased levels of school security, law enforcement presence, and schools with increased levels of school strictness (Ee and Gándara 2020; Garver and Noguera 2015; Gonzales 2016; Peguero 2011; Varela et al. 2018). Moreover, place and contextual factors also may be playing a role in the insulation or occurrence of deviant, violent, or criminal behavior. Concerning this particular study, understanding the school’s context of place as well as the connection with racial/ethnic inequality is inextricable.
Racial/ethnic inequality plays an important role in factors that contribute to school disorder, violence, or crime across different contexts. The promise of Brown v. Board of Education was never fully realized. Today, few schools have diverse student demographics within their school. More than half of the schools that were under court desegregation orders in 1990 have been released from judicial supervision, with the result that such schools are steadily resegregating (Lewis and Diamond 2015; Shedd 2015; Tyson 2011). In addition, urban, suburban, and rural divides remain in the resources allocated to schools in each of these school contexts locales (Lewis and Diamond 2015; Shedd 2015; Tyson 2011). Racial/ethnic segregation in schools is fueled by racial/ethnic segregation within communities, as well as the unequal representation of racial/ethnic groups across urban, suburban, and rural contexts. Racial/ethnic minorities are more likely to reside in urban areas with considerably more structural socioeconomic barriers and disadvantages as well as disorder, violence, and crime in comparison with their White counterparts in suburban contexts (Durán 2013, 2018; Lewis and Diamond 2015; Portes and Rumbaut 2014; Wilson 1987, 2009). Community and educational racial/ethnic inequalities impose serious barriers and challenges to implementing school safety and equity. Situational contexts of disorder, violence, crime, and injustice in the community overlap and are symbiotic with schools (Durán 2013, 2018; Garver and Noguera 2015; Peguero and Bondy 2015; Rios 2011, 2017; Shedd 2015). The implications of racial/ethnic segregation and resource inequality for the ability to provide safe school environments are evident.
Current Study
As presented in our study’s discussion about the conceptual argument and prior research, context matters for immigration reception, racial/ethnic educational inequality, and school violence and crime. Although there is a pattern of “downward” assimilation for the children of racial/ethnic immigrants associated with victimization, misbehavior, exposure to delinquent friends, and punishment at school at the student level, investigations about the relationships between the context of reception, race/ethnicity, and school-level crime remain uncertain. In turn, our study will draw on nationally representative data to address three proposed research questions. First, is there an association between an increasing proportion of children of immigrants and school crimes (i.e., violence, property damage, and substance use)? Second, are there differences linked to the context of reception (i.e., urban, suburban, town, and rural) in the association between the increasing proportion of children of immigrants and school crime? Third, are there racial/ethnic differences in the association between the increasing proportion of children of immigrants and school crimes in distinct contexts? Our study will contribute to research about immigration, schools, and violence by examining the associations between context, school crime, and the schooling of children of immigrants by drawing on the context of reception conceptual framework.
Method
Data Source
Our study uses data from the restricted-use SSOCS. This ongoing U.S. Department of Education effort collects data from principals in a random sample of approximately 3,000 U.S. public schools. School population is stratified into four instructional levels, four types of locale settings, and four enrollment size categories. To obtain a reasonable sample size of lower enrollment schools while giving a higher probability of selection to higher enrollment schools, the sample is allocated to each subgroup in proportion to the sum of the square roots of the total student enrollment in each school in that stratum. The sample design also over-samples middle and high schools. The SSOCS includes data on the number of violent incidents and thefts that occurred in each school, as well as how many of these incidents were reported to the police. Our study draws from the restricted-use 2015–2016 SSOCS data on 2,090 public schools, which also has links to the Common Core of Data (CCD). CCD is a program of the U.S. Department of Education’s National Center for Education Statistics (NCES) that annually collects data from all public schools, public school districts, and state education agencies. CCD data are supplied by state education agency officials and include descriptive information about school districts and their schools, including data on student demographics. The availability of immigration, race/ethnicity, context, and public school crime, as well as nationally representative data make these data particularly fitting to answer our proposed research questions.
Dependent Variables
As conducted in prior school crime research utilizing SSOCS (see Devlin and Gottfredson 2018; Fisher, Higgins, and Homer 2019), three different measures of school crime were utilized because nature, contextual circumstances, and type of injury from these three crime classifications are incredibly distinct. Violent school crime (α = .69) is a count measure that was constructed by summing principals’ responses to eight questions about the frequency of violent crime at public school. These eight questions include the total number of recorded incidents of (1) rape or attempted rape, (2) sexual assault other than rape, (3) robbery with a weapon, (4) robbery without a weapon, (5) physical attack or fight with a weapon, (6) physical attack or fight without a weapon, (7) threats of physical attack with a weapon, and (8) threats of physical attack without a weapon. Property school crime (α = .51) is a count measure that was constructed by summing responses to two questions about the frequency of property crime at public school. These two questions include the total number of recorded incidents of (1) theft/larceny and (2) vandalism. Substance school crime (α = .49) is a count measure that was constructed by summing two question responses about the frequency of substance abuse crimes at public school. These two questions include the total number of recorded incidents of distribution, possession, or use of (1) illegal drugs and (2) alcohol. These three school crime measures were constructed as in prior SSOCS studies (see Devlin and Gottfredson 2018; Fisher et al. 2019) and include incidents occurring before, during, and after normal school hours.
Independent Variables
Our independent variables of interest include school context, the proportion of children of immigrants, and racial/ethnic school composition.
School context identifies whether the school was located in an urban, suburban (reference), town, or rural area, as defined by NCES.
The children of immigrants variable is measured as the percentage of students in the school who have either limited or no English proficiency, based on CCD data. This measure is used to approximate the proportion of children of immigrants in the school. One limitation of using this measure in such a manner is that some U.S.-born children also have limited English proficiency. However, researchers have pointed out that students who have either limited or no English proficiency are predominately first or second generation (Kao et al. 2013; Peguero 2011). This means that any U.S.-born students with limited English proficiency are most likely the children of immigrants (i.e., the second generation).
CCD data were also used to construct five variables that capture the racial/ethnic composition of the school. These variables measure the percentage of students in the school who are (1) Black American, (2) Latina/o/x, (3) Asian, (4) Multiracial, and (5) White. The Latina/o/x category in the CCD includes all students with Hispanic/Latina/o/x ancestry, regardless of their racial/ethnic identification. According to a directive from the U.S. Department of Education (2007), it is required that educational institutions report aggregated racial/ethnic data. As a result, Federal databases do not include the necessary school-level data to examine patterns for racial/ethnic subgroups. It is acknowledged that these quantitative measures are limited and arguably problematic. In the ideal, prior research indicates the importance of “deracializing statistics” and models that should present race/ethnicity and immigration beyond racial reasoning (Zuberi 2001; Zuberi and Bonilla-Silva 2008). In addition, the limitations of pan-racial/ethnic terms are also limiting and dismiss the distinct realities and subjugations within racial/ethnic group classifications (Brown and Jones 2015; Irizarry 2015). The faulty logic underlying most statistical analyses could be remedied if race/ethnicity is placed within a social context and if researchers understood that the history of race relations is not benign, but rather representative of oppressive structural forces, including conquest, slavery, and coerced labor that inform current day structural oppression (Zuberi 2001; Zuberi and Bonilla-Silva 2008). Although including such contextual data in our study’s analyses as ideal, the decision to move forward with the available data, but acknowledge the limitations, was made for the readers and researchers to consider them accordingly.
Control Variables
Prior research has identified numerous school characteristics associated with school crime and/or the school experiences of children of immigrants and racial/ethnic minority students. These include security measures, the presence of police and/or security guards, discipline, community crime, school type, size, student-teacher ratio, disadvantage, underachievement, special education, the proportion of male students, attendance, and region (Devlin and Gottfredson 2018; Fisher et al. 2019; Garver and Noguera 2015; Kao et al. 2013; Peguero 2009, 2011; Peguero and Bondy 2015, 2020; Rios 2011, 2017; Shedd 2015; Welch and Payne 2010, 2012). Thus, these control measures are included in our analysis.
Security measures refer to procedures the school practices to ensure a safe environment. A school security procedure index (ranging from 0 to 12) was constructed by summing the number of security measures Principals identified as practices of their schools. This includes, for example, controlling access to school buildings during school hours or performing one or more random metal detector checks on students.
Police present is a dichotomous variable that measures whether at least one sworn law enforcement officer, including any school resource officer, was present in the school at least once a week.
Security guards measures the number of additional security guards or security personnel, aside from sworn law enforcement officers, who were present in the school at least once a week.
Disciplinary actions measures the number of sanctions recorded at the school. Principals were asked to indicate how many expulsions, transfers to alternative schools, out-of-school suspensions lasting 5 or more days, and other disciplinary actions (e.g., suspension for less than 5 days, detention) were taken in response to students who committed specific offenses, such as physical attacks or drug possession. These numbers were combined to capture the total number of disciplinary actions taken by school administrators.
Community crime captures the level of crime in the community where the school is located. Principals were asked whether the community experienced a “high,” “moderate,” or “low” level of crime. Because of the frequency distribution, we created a dichotomous variable that combines schools in communities with high/moderate crime (=1) into one category separate from schools in communities with low crime (=0).
School type is a categorical measure based on CCD data. Categories, which were defined by NCES, capture whether the school is an elementary school (reference category), middle school, high school, or combined school (e.g., elementary/middle school).
School size is measured by the total number of students enrolled in the school.
Student-teacher ratio divides the number of students by the number of teaching staff (based on full-time-equivalency).
School disadvantage is measured as the percentage of students in the school who receive free or reduce priced lunch.
Underachievement represents the Principals’ estimate of the percentage of students (out of those who were present) who were below the 15th percentile on standardized tests.
Special education is based on the Principals’ report of the percentage of students at their school who receive special education services under the Individuals with Disabilities Education Act (IDEA).
Male students measure the percentage of students who are male.
Attendance is a measure of the school’s average daily attendance (i.e., percent of students present) as provided by the Principal.
Region identifies whether the school was located in the Northeast, South (reference), Midwest, or West.
Analytic Strategy
Due to the complex nature of the SSOCS sample design, survey weights included in the SSOCS were used to obtain population-based estimates and to minimize bias arising from nonresponse and sampling error. All estimates were produced using the “svy” prefix command in Stata, which accounts for the complex structure of the SSOCS survey design, and the subpop option, which is specifically for survey analysis of subgroups. SSOCS also includes imputed values (via sequential hot-deck imputation) for all of the variables used in our analyses. Our study implemented a series of negative binomial regression models. These types of statistical analyses are ideal for count data (like the number of violent, property, and substance crimes at school) that have nonnegative integers, are highly skewed as some counts will be very low (i.e., some schools will have few incidents of crime), and have heteroscedastic error terms. Tests for overdispersion (the variance is greater than the mean) showed that negative binomial regression was appropriate for all dependent variables.
The analyses proceeded in several steps. Table 1 presents weighted descriptive statistics for the variables in our study by school context (i.e., urban, suburban, town, and rural). Next, we used negative binomial regression models to predict the relationship between immigration and school crime. For each outcome and school context, we estimated three models. For Model 1, we estimated the weighted bivariate association between immigration and school crime. Next, we added our measures of racial/ethnic composition and other school characteristics in Model 2. And in Model 3, we included terms that captured the interaction between immigration and our school racial/ethnic composition measures. Coefficient and incident rate ratios for our key independent variables are displayed according to the school context. Table 2 includes results for school in urban contexts, Table 3 includes results for schools in rural contexts, Table 4 includes results for schools located in towns, and Table 5 includes results for schools in the suburbs. Full model results are included as Appendices A to D.
Descriptive Statistics by Context.

Note. Significant differences compared with suburban schools denoted with asterisks. Significance is based on chi-square tests (for categorical variables) and Welch’s t-tests (for continuous variables).
p ≤ .05 (two-tailed test).
Negative Binomial Regression Estimates and IRRs for Schools in Urban Locales.
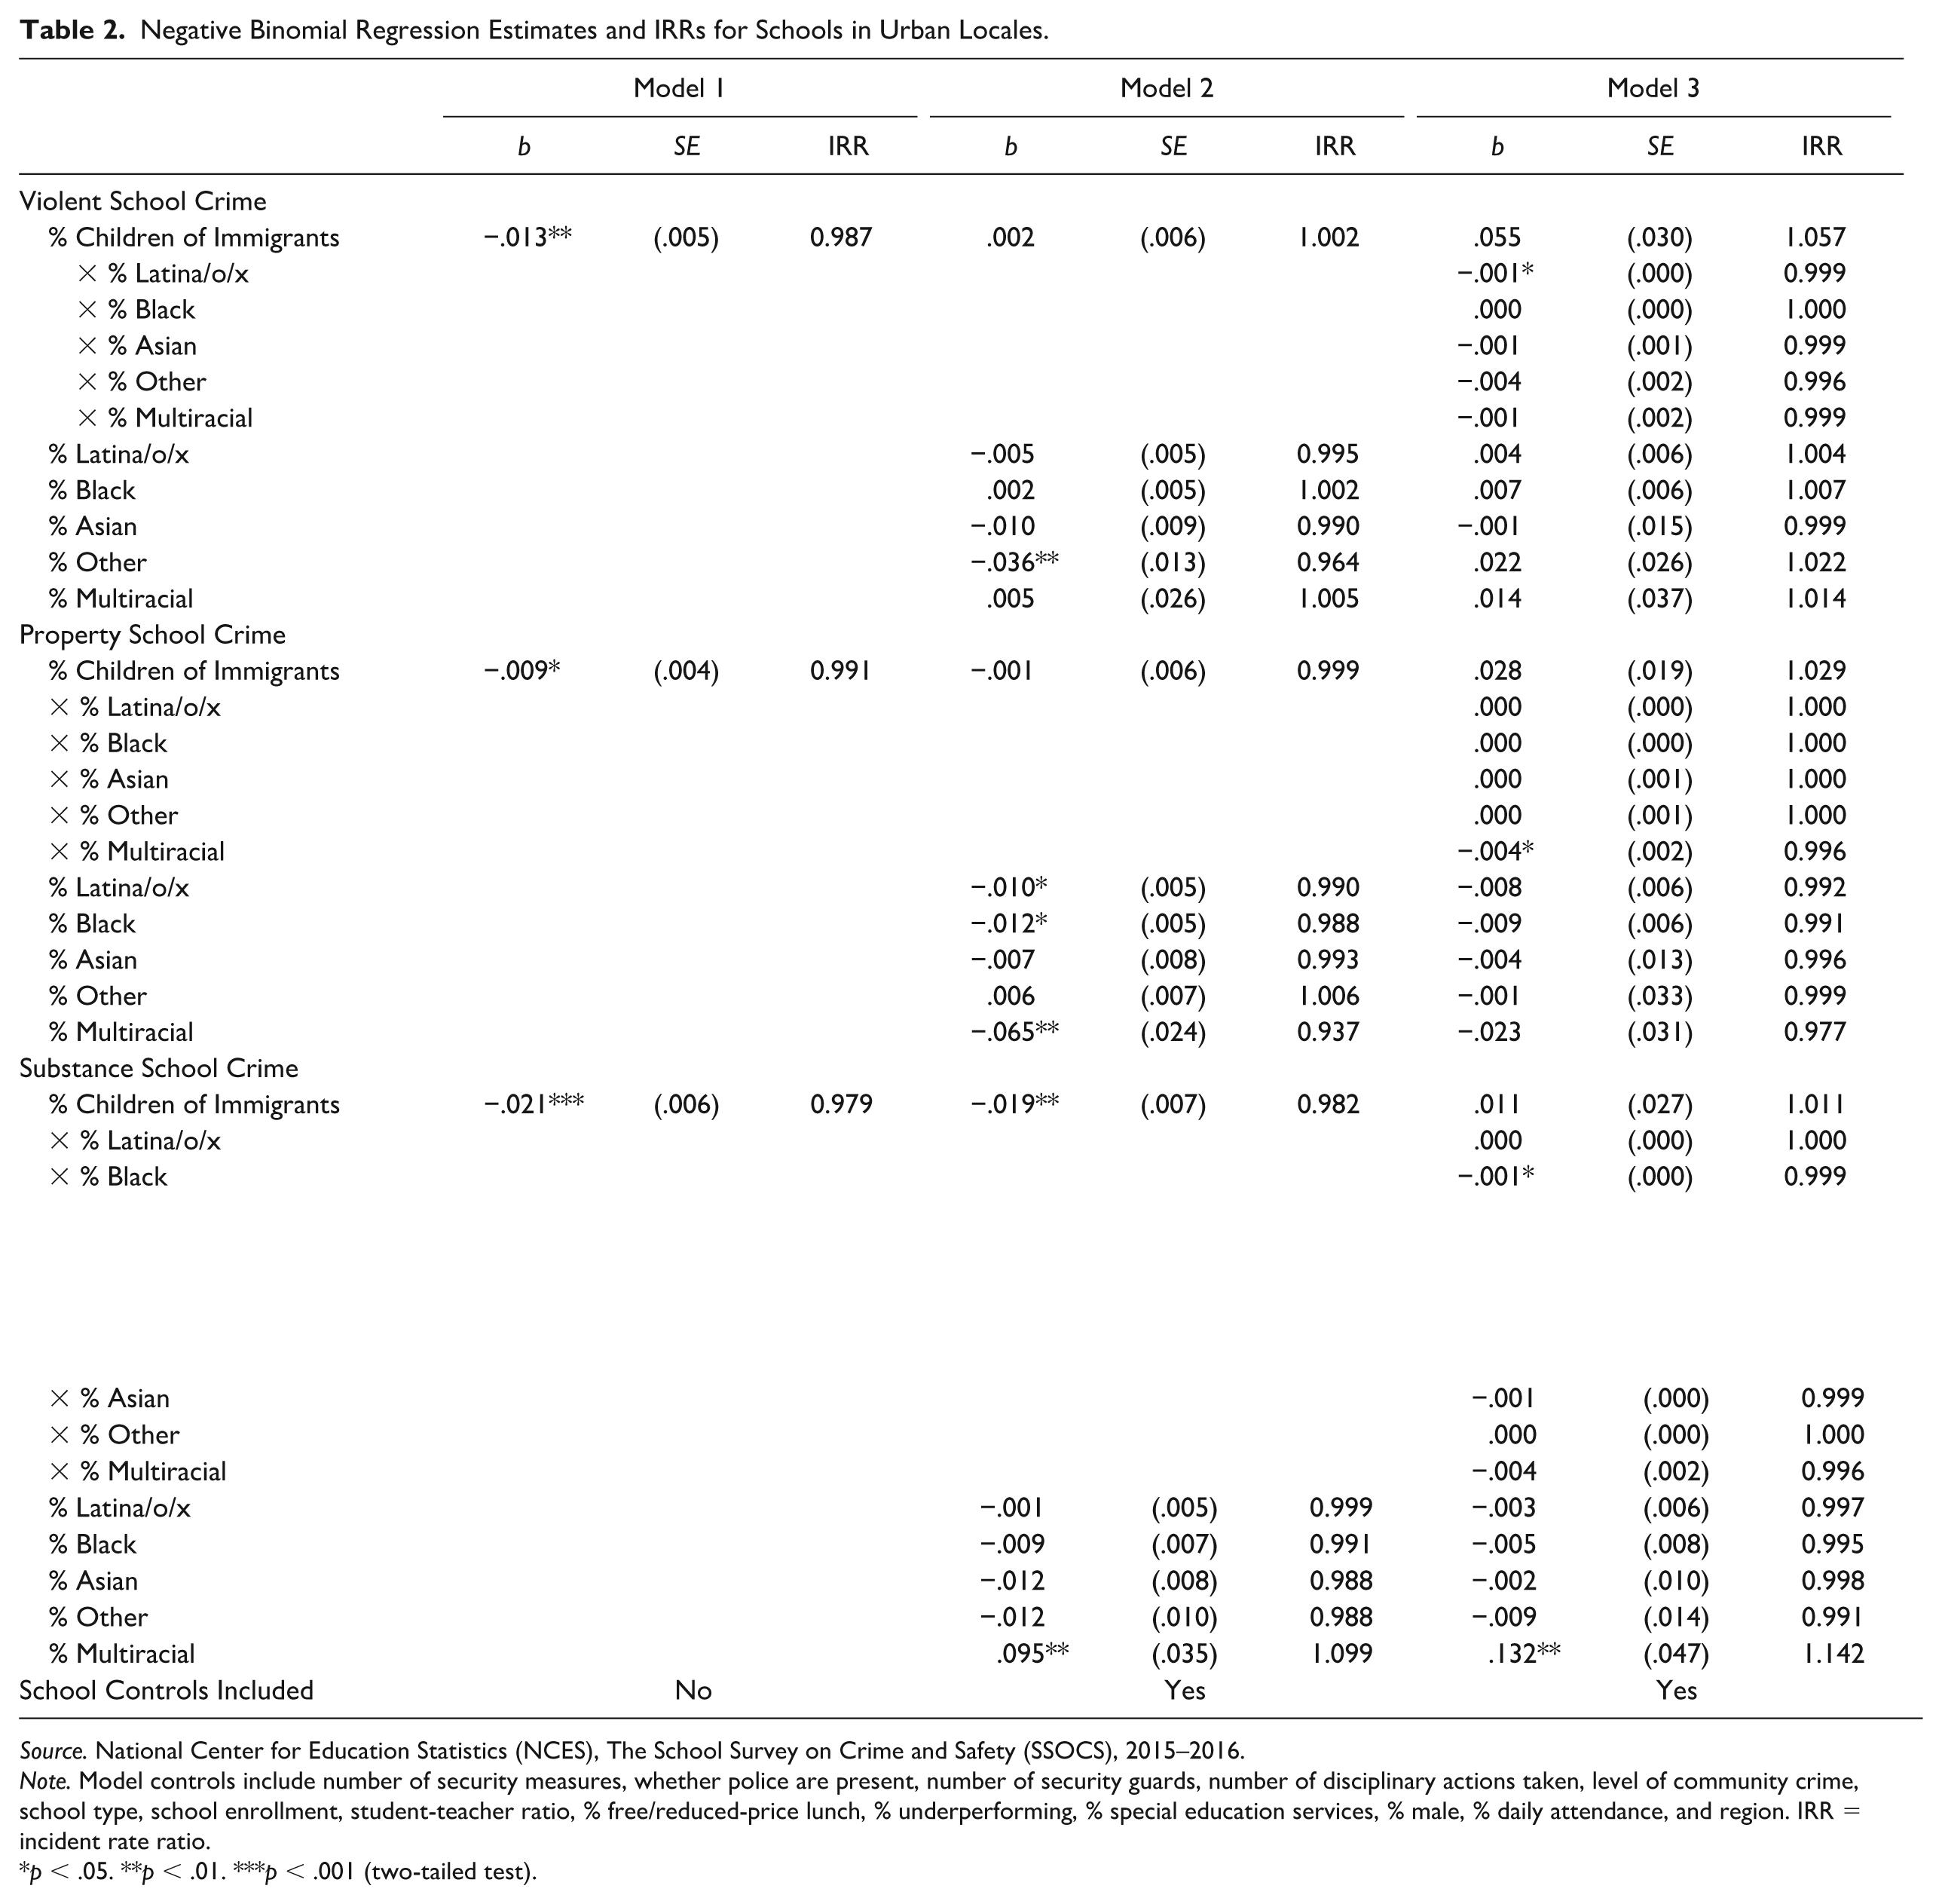
Source. National Center for Education Statistics (NCES), The School Survey on Crime and Safety (SSOCS), 2015–2016.
Note. Model controls include number of security measures, whether police are present, number of security guards, number of disciplinary actions taken, level of community crime, school type, school enrollment, student-teacher ratio, % free/reduced-price lunch, % underperforming, % special education services, % male, % daily attendance, and region. IRR = incident rate ratio.
p < .05. **p < .01. ***p < .001 (two-tailed test).
Negative Binomial Regression Estimates and IRRs for Schools in Rural Locales.

Source. National Center for Education Statistics (NCES), The School Survey on Crime and Safety (SSOCS), 2015–2016.
Note. Model controls include number of security measures, whether police are present, number of security guards, number of disciplinary actions taken, level of community crime, school type, school enrollment, student-teacher ratio, % free/reduced-price lunch, % underperforming, % special education services, % male, % daily attendance, and region. IRR = incident rate ratio.
p < .05. **p < .01. ***p < .001 (two-tailed test).
Negative Binomial Regression Estimates and IRRs for Schools in Towns.

Source. National Center for Education Statistics (NCES), The School Survey on Crime and Safety (SSOCS), 2015–2016.
Note. Model controls include number of security measures, whether police are present, number of security guards, number of disciplinary actions taken, level of community crime, school type, school enrollment, student-teacher ratio, % free/reduced-price lunch, % underperforming, % special education services, % male, % daily attendance, and region. IRR = incident rate ratio.
p < .05. **p < .01. ***p < .001 (two-tailed test).
Negative Binomial Regression Estimates and IRRs for Schools in Suburban Locales.

Source. National Center for Education Statistics (NCES), The School Survey on Crime and Safety (SSOCS), 2015–2016.
Note. Model controls include number of security measures, whether police are present, number of security guards, number of disciplinary actions taken, level of community crime, school type, school enrollment, student-teacher ratio, % free/reduced-price lunch, % underperforming, % special education services, % male, % daily attendance, and region. IRR = incident rate ratio.
p < .05. **p < .01. ***p < .001 (two-tailed test).
Results
Descriptive Statistics
We find some variation in the average amount of school crimes reported across local contexts. According to Table 1 results, violent crimes are the most common types of crimes reported by schools, followed by property crime, and then substance crime. Schools in urban contexts report a significantly more violent crime on average than schools in suburban locales (14.7 crimes compared with 9.5) but have similar levels of school property crime (4.1 compared with 3.3) and substance crime (2.1 compared with 1.8). In contrast, schools in rural contexts report, on average, about 6.0 violent crimes, 2.3 property crimes, and 1.1 substance crimes, all significantly lower than average levels of crime in suburban schools. Schools in towns also have slightly more violent crime and less substance crime than schools in the suburbs, although not significantly more or less so.
The racial/ethnic and immigrant status composition of students also varies according to schools’ local context. Results show that schools in urban locales have a significantly higher percentage of students from immigrant families on average than schools in suburban areas, while for schools in towns and rural areas, the percentage is significantly lower. For example, children of immigrants make up more than 19 percent of students on average, in urban schools, compared with around 13 percent of students in suburban schools, 9 percent of students for schools located in towns, and 6 percent of students for schools in rural areas. Schools in urban areas also have significantly higher percentages of both Latina/o/x students (34 percent vs. 25 percent) and Black students (25 percent vs. 11 percent) on average than schools in the suburbs, as well as a significantly lower percentage of White students (30 percent vs. 54 percent). Whereas schools in towns and rural areas have significantly smaller proportions of Latina/o/x students (approximately 19 percent and 10 percent, accordingly) than schools in suburban locales. Rural schools also have a significantly lower share of Black students than suburban schools (8 percent vs. 11 percent).
Urban School Crime and the Children of Immigrants
Turning first to schools in urban locales, results from Table 2 demonstrate either a negative relationship or no relationship at all between the percentage of students who are children of immigrants and school crime. Bivariate estimates for children of immigrants in Model 1 negatively predict all three school crime outcomes. Specifically, we find around a 1 percent decrease in the incident rate of violent and property school crime and 2 percent decrease in the incident rate of substance school crime for every 1 percent increase in the proportion of students in the school who are children of immigrants.
Model 2 includes variables capturing a host of school characteristics. Net these factors, we find that the percent of students from other racial/ethnic groups (i.e., Native American and Pacific Islander) negatively predicts the rate of violent school crime. We also find that the percent of Latina/o/x, Black, and multiracial students negatively predict the rate of school property crime. The presence of multiracial students also emerges as a significant predictor of substance school crime, although in the opposite direction, with the incident rate increasing by around 10 percent for every 1 percent increase in the proportion of students who are multiracial. Once we control for school characteristics, the percent of children of immigrants no longer significantly predicts either the rate of violent or property school crime in urban schools. However, we find almost no change in the relationship between the percent of children of immigrants and substance school crime in urban contexts net school controls.
Model 3 results focus on interactions between the percent children of immigrants and the racial composition of urban schools. Although the main effect of percent of children of immigrants is insignificant for all three outcomes, significant interactions suggest a negative relationship between percent of children of immigrants and school crime for schools with particular racial compositions. For violent school crime, the strength of this negative relationship appears to be contingent on the proportion of Latina/o/x youth in the school. For instance, for every 1 percent increase in the percent children of immigrants, we estimate around a 1.9 percent decrease in the incident rate of violent school crime in schools that are 30 percent Latina/o/x, and a 3.8 percent decline in the rate of violent crime in schools that are 60 percent Latina/o/x.
We find similar patterns for property and substance school crime. In the case of property crime, the negative relationship between immigration and crime in urban schools is contingent on the proportion of the student body that is multiracial. For instance, for every 1 percent increase in the percent of children of immigrants, we estimate around a 1.5 percent decrease in the rate of property school crime in schools that are 4 percent multiracial, and a 3 percent decline in schools that are 8 percent multiracial. And for substance school crime, this relationship is contingent on the proportion of Black students. So, for every 1 percent increase in the percent children of immigrants, we estimate around a 2.1 percent decline in the substance crime rate in schools that are 30 percent Black, and a 4.3 percent decline in schools with student bodies that are 60 percent Black.
Rural School Crime and the Children of Immigrants
Next, we turn to results for schools located in rural contexts in Table 3, which like urban schools demonstrate either a negative relationship or no relationship at all between the percentage of students who are children of immigrants and school crime. In Model 1, percent of children of immigrants fails to significantly predict violent, property, or substance crimes in rural schools. The absence of a relationship between percent of children of immigrants and school crime also holds after accounting for a host of school characteristics in Model 2. We do, however, find a statistically significant, positive association between the percent of students from other racial/ethnic groups and the rate of violent school crime, net school characteristics. Specifically, we estimate around a 1.4 percent increase in the rate of violent crime for every 1 percent increase in other racial/ethnicity students. In contrast, we find that the percent of Asian students negatively predicts the amount of property crime in rural schools, while the percent of Black students negatively predicts the rate of substance crime.
Model 3 results include no significant interactions between the percent of children of immigrants and school racial composition for either violent or substance crime in rural schools. We do, however, find significant interactions for the percent of Latina/o/x students and the percent of multiracial students, both of which negatively predict property crime in rural schools. In schools with no Latina/o/x or multiracial students, the relationship between immigration and property school crime is insignificant. However, a negative relationship between the percent of children of immigrants and school property crime emerges and strengthens as the proportion of students who are Latina/o/x or multiracial increases. For instance, for every 1 percent increase in the percent children of immigrants, we estimate around a 1.1 percent decrease in the incident rate of property crime in rural schools that are 15 percent Latina/o/x and a 2.2 percent decrease in schools that are 30 percent Latina/o/x. Likewise, for every 1 percent increase in the percent children of immigrants, we estimate around a 4 percent decline in the incident rate for property crimes in schools that are 3 percent multiracial and a 7.9 percent decline in schools that are 6 percent multiracial.
Town School Crime and the Children of Immigrants
Table 4 includes estimates for models predicting crime rates in schools located in towns. In Model 1, the percent of children of immigrants fails to significantly predict violent or property school crime in towns. Both patterns persist even after accounting for a host of school characteristics in Model 2. We do, however, find a statistically significant, negative association between the percent of Latina/o/x students and property school crime in towns, with the incident rate declining by 1.2 percent for every one percent increase in the percent of Latina/o/x students.
There is also no bivariate association between the percent of children of immigrants and substance school crime in towns. But a positive association emerges after we account for school characteristics in Model 2. Accordingly, for every one percent increase in percent children of immigrants, we estimate around a 2.2 percent increase in the incident rate of substance school crime. Results, however, also indicate significant, negative associations for the percent Latina/o/x students and percent Black students, with every 1 percent increase in each translating to around a 1.2 or 1.7 percent decline in the rate of substance school crimes, respectively.
Model 3 results include significant interactions between the percent of children of immigrants and school racial composition measures for both violent and substance school crime. In schools with no Black or multiracial students, the relationship between immigration and violent school crime in towns is insignificant. However, a negative relationship between the percent of children of immigrants and school property crime emerges and strengthens as the proportion of students who are Black or multiracial increases. Accordingly, for every 1 percent increase in the percent children of immigrants, we estimate around a 1.7 percent decrease in the incident rate of violent crime in schools that are 10 percent Black and a 3.4 percent decrease in schools that are 20 percent Black. This reduction, nevertheless, is mitigated by the positive association between the main effect coefficients for percent Black violent school crime in towns. Likewise, for every 1 percent increase in the percent children of immigrants, we estimate around a 2.8 percent decline in the rate of violent crime in schools that are 3 percent multiracial, and 5.4 percent decline in schools that are 6 percent multiracial.
Conversely, the interaction between the percent of children of immigrants and percent multiracial positively predicts substance school crime in towns. Although the main effect of coefficient for percent children of immigrants also appears to positively predict substance school crime, notably, it loses significance once insignificant interactions are removed from the prediction model. This significant interaction suggests that the positive relationship between immigration and substance school crime may be larger in schools with more multiracial students.
Suburban School Crime and the Children of Immigrants
Last, we turn to results for suburban schools presented in Table 5. According to bivariate results in Model 1, percent of children of immigrants does not significantly predict violent, property, or substance crime in schools in suburban locales. For violent school crime, the coefficient for percent children of immigrants remains statistically insignificant even after controls are added to the model (see Model 2). However, both percent Latina/o/x and percent Other race students negatively predict violent school crime. For instance, for every 1 percent increase in the percent Latina/o/x, we predict a 0.5 percent reduction in the incident rate of violent crime in a suburban school. And for every 1 percent increase in the percent Other race/ethnicity students, we predict a 3.6 percent decline in the rate of violent school crime. Whereas percent of multiracial is positively associated with violent crime in suburban schools.
A significant relationship between immigration and property crime in suburban schools emerges in Model 2, which controls for school characteristics. Specifically, every one percent increase in percent children of immigrants is associated with a 2 percent increase in the incident rate for property school crime. In contrast, we find a statistically significant, negative association between the percent of Latina/o/x and property school crime. Here, we predict a 1.5 percent decline in the school property crime rate for every 1 percent increase in Latina/o/x students.
We also do not find a significant bivariate relationship between immigration and substance school crime in suburban contexts. And this relationship also remains insignificant even after the inclusion of controls in Model 2. However, in Model 2, percent Asian is negatively associated with substance school crime, such that the rate is reduced by 1.8 percent for every one percent increase in the share of students who are Asian. Substance school crime is the only outcome for suburban schools that includes a significant interaction in the model. In suburban schools with no Latina/o/x students, the relationship between immigration and substance school crime is insignificant. However, a statically significant, positive interaction points to the emergence of a positive relationship between immigration and school substance crime in suburban schools with higher shares of Latina/o/x students. Accordingly, for every 1 percent increase in the percent children of immigrants, we estimate around a 1.1 percent increase in the incident rate of substance crime in suburban schools that are 25 percent Latina/o/x and a 2.2 percent increase in schools that are 50 percent Latina/o/x.
Discussion
We sought to contribute to the research about immigration, racial/ethnic inequality, education, and violence by investigating the associations between context, school crime, and the schooling of children of immigrants by drawing on a context of reception conceptual framework to address three research questions.
First, we examined the relationship between the proportion of children of immigrants and school crimes. Earlier studies have shown that children of immigrants are more likely to attend disadvantaged schools with higher levels of disorder and violence (Ee and Gándara 2020; Garver and Noguera 2015; Gonzales 2016; Kao et al. 2013; Peguero and Bondy 2015). The school’s environment or contextual climate may, therefore, influence the behavior of and exposure to crime for children of immigrants. In general, our findings indicate that a higher proportion of children of immigrants was negatively associated with violent crimes in schools, net of other school characteristics. This means that schools with a higher proportion of children of immigrants have significantly less violent crime at school. Results for property and substance crime in school, on the contrary, find no significant interaction between the proportion of children of immigrants and crime. Overall, these findings provide further evidence that there is no association or a negative association between immigration and school crime.
Second, we examined the relationship between the proportion of children of immigrants and school crimes across different contexts of reception (i.e., urban, suburban, town, and rural). While schools are places that can insulate or promote violence and crime for the children of immigrants, other contextual factors may also play a role in the interaction between school violence and crime for the children of immigrants. Studies have shown that the context of reception can have a significant impact on the experiences of children of immigrants in schools. However, the association between the schools’ context of reception and crime for the children of immigrants remains unknown (Filindra et al. 2011; Golash-Boza and Valdez 2018; Lee and Hawkins 2015; Portes and Rumbaut 2014). To address this gap in the literature, we explored whether there was a variation in the relationship between immigration and school crime based on the context of reception. Net of school characteristics associated with school crime, our findings indicate no variation across the different contexts of reception in the relationship between children of immigrants and violent crime. The negative association between the proportion of children of immigrants and violent crime in schools is consistent across urban, rural, town, and suburban contexts. Results for property crime in schools also find no variation across the different contexts of reception in the relationship between children of immigrants and property crime. There was no significant interaction found between the proportion of children of immigrants and property crime in urban, rural, town, and suburban contexts. Results for substance crime at school also find no significant interaction across all contexts of reception with one exception—a significant interaction between the proportion of children of immigrants and substance crime in schools in suburban contexts.
Third, we examined the racial/ethnic differences in the association between the increasing proportion of children of immigrants and school crimes in distinct contexts. As guided by the context of reception research, the complexities and variability associated with the context of place in regard to race/ethnicity, immigration, and school crime are evident in our study. Most research that explore the connections between race/ethnicity and school crime has primarily been focused on urban contexts; however, it is clear that the context of immigration is complicating the prior understanding of “race and place” in regard to schools, crime, and youth violence. As the population of immigrants and their children residing in non-urban communities increases, the need to understand the context of reception as well as the history of educational racial/ethnic segregation or inequality becomes ever more pressing. Our study’s findings that highlight the significant and distinctive interactions between race/ethnicity and context only confirm prior context of immigration research that the historic and persistent racial/ethnic educational and school inequities across U.S. schools and communities are also affecting the schooling, educational opportunities, and racialization of the children of immigrants (Aranda and Vaquera 2015; Ee and Gándara 2020; Golash-Boza and Valdez 2018; Sáenz and Douglas 2015).
Implications
Our findings have several important implications for the context of reception framework: (1) we provide a significant contribution to the literature and (2) extend a context of reception framework into an investigation of the relationship between school violence, immigration, and racial/ethnic inequalities, successfully bridging research in several areas, sociology of education, immigration, and criminology. This speaks to the strength/utility of the framework. As immigration pathways and destinations have expanded to include residential areas outside of traditional urban locales, immigrants have presumably encountered novel contexts of reception that lack comparable social and ethnic networks or resources typically found in large metropolitan areas. In a welcoming context, in which immigrant groups have social and ethnic networks available to them, they will ostensibly encounter a favorable set of circumstances, yet in contrast, without such resources or support available to them, they may contend with a set of conditions that can have a detrimental effect on their well-being. Research on the context of reception has revealed social institutions such as schools are an essential feature of the contexts of reception immigrants encounter in the United States. Overall, this increased movement of immigrants to rural, town, and suburban locales does not indicate higher odds of violent or property crime reporting in schools. Our study demonstrates the opposite with a few notable exceptions. Utilizing locale to measure the context of reception, based on prior research, we characterize urban communities as containing positive contexts of reception and the others as negative contexts of reception.
Findings from our study also highlight major implications for policy regarding enhancing school safety for immigrant students in the United States. Immigrant students are likely to attend low-resourced schools, and they are likely to be exposed to delinquent and criminal activities in their schools, which evokes major concerns for the students and parents. Because students’ perceptions of school safety are strongly correlated to students’ achievement and social functioning (Katschnig and Hastedt 2017; Peguero and Bondy 2015, 2020), enhancing school safety is essential. Over the past several years, numerous approaches have been identified and implemented in schools to address crime and violence. However, one serious barrier to developing and implementing effective policy is disagreements between the policymakers, school officials, parents, and teachers concerning school safety, which is likely to occur. Consequently, resources for addressing the problems are being allocated to less important areas. To effectively put school safety policies in place, they also need to be reflective of the unique problems and needs of immigrant students and their parents. As suggested by Tamara Katschnig and Dirk Hastedt (2017), consistent communications need to occur among students, parents, and school officials before considering school safety policies and measures. The most important step to developing policies to increase school safety is not merely adopting a punitive approach (e.g., “zero tolerance”) or additional security measures, but to first understand that school crimes are serious, and it would take an entire school community to address them.
Limitations and Future Directions
Our study is not without its limitations. First, as noted earlier in the “Method” section, is the use of pan-ethnic categories that often obscure important intra-group variation in experiences with xenophobia, racism, as well as historic and geographically bounded state-sanctioned violence and domination. For example, pan-ethnic categories such Latina/o/x and Asian can problematically flatten contemporary experiences with institutionalized racism and inequalities by not accounting for the varied wealth and status possessed by individual groups when they arrive at the United States (Kao et al. 2013), the deleterious effects of anti-black and anti-indigenous racism (Brown and Jones 2015; Irizarry 2015; Sáenz and Douglas 2015), or discrimination based on religious minority status. Such an omission can also minimize the effect of disproportionate criminalization and vilification of specific immigrant groups, such as Central American and Mexican origin immigrants and unaccompanied minors (Chouhy and Madero-Hernandez 2019), on the relationship between school crime, immigration, racial/ethnic inequality, and context of reception. Researchers should be aware of the limitations of pan-ethnic categories and how they may encourage an incomplete or flawed interpretation of their data and results. Unfortunately, the data available to us did not allow for pan-ethnic categories to be disaggregated and historically or socially contextualized to account for such undoubted variation across the respondent groups.
Second, another limitation to the data is missing information on the documentation status of respondents. The immigrant population in the United States is diverse and destination communities can vary remarkably, not only in terms of economics and the presence of ethnic networks to support newcomers, but also in terms of the degree of cultural and social openness in a given community or policies that support immigration (Gonzales 2016). Unlike their documented peers, undocumented students and those who are members of mixed-status families in the United States encounter a unique degree of uncertainty, fear, and institutional surveillance in social institutions such as schools. Knowing a respondent’s documentation status would enable a more nuanced understanding of the relationship between the percentage of immigrant student population and crime in schools, racial/ethnic inequality, and how this may vary by the context of reception. Without access to such data on documentation status in our study, we are unable to parse out these nuances and illuminate the distinct experiences of the most vulnerable segment of the immigrant population. Future research should include documentation status in their analyses; however, it is important to emphasize that collecting data on documentation status may exacerbate the fear, uncertainty, and vulnerability already experienced by this segment of the immigrant population and should, therefore, be undertaken with great care to protect the identities and well-being of research participants.
Immigration enforcement policies and practices are affecting students and schools in various ways. Students are fearful, anxious, and stressed about their family and home situations making it challenging for some students to focus or even attend school (Aranda and Vaquera 2015; Ee and Gándara 2020; Golash-Boza and Valdez 2018). With increases in immigration enforcement raids and deportations, immigrant students who have undocumented family members are more concerned about their family remaining intact rather than school attendance, school work, grades, graduation, and/or college (Aranda and Vaquera 2015; Ee and Gándara 2020; Golash-Boza and Valdez 2018). Our study is limited in addressing the impact the current immigration enforcement policies and practices have on the context of reception and its relationship between immigration and school crime. Future research examining immigration enforcement policies and its relationship to immigration, school crime, and the context of reception is needed.
Because our study is limited in addressing immigration enforcement concerning school crime, the possibility of immigrant threat concerning school sanctions also remains unclear. As our findings indicate with a higher proportion of immigrant students, there is a less violent crime at school. However, as scholars have noted, public perceptions of immigrants, particularly undocumented immigrants, is one of criminality and immigrants as a criminal threat (Armenta 2017; Kubrin, Zatz, and Martinez 2012). These false notions influence criminal stereotypes of immigrants that can possibly affect immigrant students and their experiences with school punishment. Research examining the possibility of immigrant threat and school punishment could provide an opportunity for racial threat and school sanctions theories (see Welch and Payne 2010, 2012) to be applied to immigrant students and their experiences with school punishment. Furthermore, it can address how public perceptions of immigrant criminality can influence school punishment policies, practices, and campus culture.
Of course, the role of place in regard to racial/ethnic inequality is being exacerbated by the growing number of charter and private schools (Lewis and Diamond 2015; Pearman and Swain 2017). As school choice broadens in the United States, the complexities and disparities associated with race/ethnicity, school safety, and educational opportunity can only deepen segregation. Although examining school choice is a limitation of SSOCS, context of reception and the public discourse that perpetuates the myth of the immigrant criminal contributes to parents’ fear for sending their children to school where there is a growing immigrant population (Lewis and Diamond 2015; Pearman and Swain 2017). Notions of “white flight” and school choice should guide future research to investigate the connections between school choice, immigration, and safety.
Despite these data limitations, the study findings remain an important contribution to the research on school crime, the children of immigrants, and the context of reception, and suggests future lines of research about the context of reception and school safety and violence. One such line is to pursue a more comprehensive understanding of the relationship between immigration, school violence, and racial/ethnic inequalities that account for individual groups’ contemporary and historic relationship to power, the state, and capital.
Conclusion
Overall, findings from our study highlight the importance of developing school safety measures or amending the existing ones in U.S. school districts. Problems that racial/ethnic minorities and immigrants are confronted with include racism and xenophobic sentiments of the mainstream U.S. students and teachers, which likely impede educational attainment and socio-emotional growth. Developing effective and culturally relevant school safety programs and measures are the first necessary step toward improving the academic achievement of racial/ethnic minority and immigrant students and more importantly, promoting a more equitable school climate.
Footnotes
Appendix
Negative Binomial Regression Models for Schools in Suburban Locales.

| Violent School Crime | Property School Crime | Substance School Crime | ||||||||||||||||
|---|---|---|---|---|---|---|---|---|---|---|---|---|---|---|---|---|---|---|
| Model 1 | Model 2 | Model 3 | Model 4 | Model 5 | Model 6 | Model 7 | Model 8 | Model 9 | ||||||||||
| β | SE | β | SE | β | SE | β | SE | β | SE | β | SE | β | SE | β | SE | β | SE | |
| % Children of Immigrants | 0.001 | (0.005) | 0.007 | (0.006) | −0.004 | (0.015) | 0.004 | (0.005) | 0.020* | (0.008) | 0.012 | (0.022) | −0.008 | (0.007) | 0.009 | (0.006) | −0.032 | (0.019) |
| × % Latina/o/x | 0.000 | (0.000) | 0.000 | (0.000) | 0.000* | (0.000) | ||||||||||||
| × % Black | 0.001 | (0.000) | 0.000 | (0.000) | 0.001 | (0.000) | ||||||||||||
| × % Asian | −0.001 | (0.000) | 0.000 | (0.000) | 0.000 | (0.000) | ||||||||||||
| × % Other | −0.003 | (0.003) | 0.002 | (0.002) | −0.002 | (0.002) | ||||||||||||
| × % Multiracial | 0.002 | (0.002) | 0.002 | (0.003) | 0.004 | (0.003) | ||||||||||||
| % Latina/o/x | −0.010** | (0.004) | −0.011* | (0.004) | −0.015** | (0.005) | −0.013* | (0.006) | −0.002 | (0.004) | −0.005 | (0.005) | ||||||
| % Black | 0.007 | (0.005) | 0.002 | (0.005) | −0.005 | (0.006) | −0.006 | (0.007) | −0.004 | (0.005) | −0.007 | (0.005) | ||||||
| % Asian | −0.011 | (0.007) | −0.003 | (0.009) | −0.016 | (0.008) | −0.013 | (0.011) | −0.018** | (0.006) | −0.018* | (0.008) | ||||||
| % Other | −0.033* | (0.015) | −0.027 | (0.015) | 0.001 | (0.026) | −0.009 | (0.027) | −0.013 | (0.010) | −0.007 | (0.010) | ||||||
| % Multiracial | 0.049* | (0.022) | 0.036 | (0.022) | −0.023 | (0.029) | −0.044 | (0.042) | −0.007 | (0.025) | −0.030 | (0.031) | ||||||
| Security Measures | 0.000 | (0.050) | 0.024 | (0.051) | 0.007 | (0.053) | 0.009 | (0.052) | −0.027 | (0.034) | −0.018 | (0.035) | ||||||
| Police Present | −0.006 | (0.158) | −0.014 | (0.155) | 0.083 | (0.187) | 0.082 | (0.185) | 0.300 | (0.157) | 0.299 | (0.158) | ||||||
| Security Guards | −0.070* | (0.032) | −0.075* | (0.032) | −0.049 | (0.041) | −0.048 | (0.042) | −0.022 | (0.023) | −0.023 | (0.023) | ||||||
| Disciplinary Actions | 0.025*** | (0.007) | 0.025*** | (0.006) | 0.009* | (0.004) | 0.009* | (0.004) | 0.009* | (0.005) | 0.009 | (0.005) | ||||||
| Community Crime | 0.197 | (0.198) | 0.151 | (0.193) | 0.250 | (0.214) | 0.255 | (0.208) | 0.181 | (0.165) | 0.144 | (0.164) | ||||||
| Middle School | 1.133*** | (0.175) | 1.144*** | (0.169) | 1.512*** | (0.226) | 1.510*** | (0.225) | 3.543*** | (0.391) | 3.594*** | (0.408) | ||||||
| High School | 0.435* | (0.193) | 0.476* | (0.190) | 1.737*** | (0.248) | 1.731*** | (0.250) | 4.814*** | (0.404) | 4.859*** | (0.425) | ||||||
| Combined School | 0.938* | (0.404) | 1.105* | (0.445) | 2.461** | (0.757) | 2.448** | (0.731) | 3.676*** | (0.468) | 3.781*** | (0.489) | ||||||
| School Enrollment | 0.001*** | (0.000) | 0.001*** | (0.000) | 0.001*** | (0.000) | 0.001*** | (0.000) | 0.001*** | (0.000) | 0.001*** | (0.000) | ||||||
| Student-Teacher Ratio | −0.006 | (0.007) | −0.007 | (0.006) | 0.002 | (0.007) | 0.003 | (0.008) | −0.014* | (0.006) | −0.015** | (0.006) | ||||||
| % Free/Reduced Lunch | 0.014** | (0.004) | 0.015** | (0.004) | 0.007 | (0.005) | 0.006 | (0.005) | 0.009* | (0.004) | 0.010** | (0.004) | ||||||
| % Underperforming | −0.005 | (0.005) | −0.005 | (0.005) | −0.002 | (0.006) | −0.003 | (0.006) | 0.003 | (0.004) | 0.003 | (0.004) | ||||||
| % Special Education | 0.007 | (0.010) | 0.002 | (0.009) | 0.014 | (0.012) | 0.013 | (0.012) | −0.002 | (0.007) | −0.002 | (0.007) | ||||||
| % Male | −0.003 | (0.010) | −0.003 | (0.010) | −0.019 | (0.014) | −0.019 | (0.013) | 0.006 | (0.005) | 0.005 | (0.006) | ||||||
| % Daily Attendance | 0.003 | (0.004) | 0.002 | (0.006) | 0.010 | (0.006) | 0.009 | (0.007) | 0.002 | (0.005) | 0.002 | (0.005) | ||||||
| Northeast | −0.258 | (0.211) | −0.261 | (0.206) | −0.419 | (0.386) | −0.427 | (0.387) | −0.473* | (0.214) | −0.505* | (0.216) | ||||||
| Midwest | 0.419* | (0.202) | 0.436* | (0.195) | −0.048 | (0.324) | −0.038 | (0.320) | −0.060 | (0.189) | −0.045 | (0.190) | ||||||
| West | 0.183 | (0.199) | 0.295 | (0.204) | 0.798* | (0.342) | 0.715* | (0.351) | 0.419* | (0.175) | 0.475** | (0.182) | ||||||
| Constant | 2.237*** | (0.088) | −0.260 | (0.707) | −0.098 | (0.832) | 1.150*** | (0.084) | −1.362 | (0.877) | −1.186 | (1.064) | 0.676*** | (0.091) | −4.575*** | (0.697) | −4.418*** | (0.733) |
| Alpha | 3.076 | (0.237) | 1.658 | (0.152) | 1.631 | (0.151) | 4.593 | (0.392) | 2.023 | (0.223) | 1.994 | (0.220) | 9.823 | (0.735) | 0.844 | (0.108) | 0.836 | (0.109) |
Source. National Center for Education Statistics (NCES), The School Survey on Crime and Safety (SSOCS), 2015–2016.
p < .05. **p < .01. ***p < .001 (two-tailed test).
Acknowledgements
We wish to extend our deepest gratitude to the editors and blind reviewers for the helpful comments and constructive suggestions throughout the development of this research manuscript. Appreciation is conveyed for the support offered by the Racial Democracy, Crime and Justice Network (RDCJN), and Latina/o/x Criminology (LC).
Funding
The author(s) disclosed receipt of the following financial support for the research, authorship, and/or publication of this article: This research was supported by the National Science Foundation (Grant# NSF-SES-1625703) and in part by Grant 5 R24 HD042849, Population Research Center, awarded to the Population Research Center at The University of Texas at Austin by the Eunice Kennedy Shriver National Institute of Child Health and Human Development. Opinions reflect those of the authors and do not necessarily reflect those of the granting agencies.