
Abstract
Studies related to disproportionate special education identification of students from historically marginalized groups have used increasingly complex analyses to understand the interplay of factors that cause and maintain disparities. However, information regarding the influence of students’ grade level at initial special education placement remains limited. Situated in labeling theory and life course theory, we used discrete-time survival analysis to examine temporal student- and school-level factors related to patterns of placement for minoritized students within one large urban school district. Results showed that gender, race, and socioeconomic status were all factors generally associated with special education identification, and that African American and Latinx students were more likely to be placed into special education later in their school careers. This disproportionality in delayed placement was associated with particular special education labels; for example, African American students identified post-elementary school were more likely to be labeled with emotional disturbance and specific learning disability compared to same-age White peers, and Latinx students were more likely to be labeled with specific learning disability and intellectual disability compared to same-age White peers. These results implicate inequities that emerge at the intersections of age, race, and perceptions of ability that should be considered in future studies of educational equity.
Keywords
Disproportionality in special education identification for students in historically marginalized groups (e.g., students who are not White, economically disadvantaged students, and students whose first language is not English) has been studied for decades (Dunn 1968; Waitoller, Artiles, and Cheney 2010). In this body of work, research has paid close attention to over-identification, given the possibility of perpetuating inequities by providing students with different educational opportunity through labeling and differentiated placements (Shifrer 2013; Sullivan and Artiles 2011). Although overrepresentation may signal obstructions in access to the general curriculum, underrepresentation has also been a cause for concern, as it raises the possibility that students are systematically excluded from services that may provide academical and/or social support (Cooc 2018a; Morgan and Farkas 2016). Artiles (2011: 431–432) described the “racialization of disabilities” as an equity paradox, in that the struggle for disability rights has become a potential source of inequity for racial minority students, and that we must understand the “layering of student identities and the power of cultural practices” in creating and justifying inequities. Thus, this study aims to extend our understanding of disproportionality through a nuanced analysis of the influence of students’ grade level at initial special education placement in one context (i.e., one school district) to better understand these practices.
The contemporary empirical climate of disproportionality research represents a disjointed field. Although bivariate risk indices show that African American students are consistently overrepresented in special education and that Asian American/Pacific Islander (AAPI) students are underrepresented (U.S. Department of Education, Office of Special Education and Rehabilitative Services, Office of Special Education Programs 2020), studies that have included extensive control covariates—particularly socioeconomic and academic measures—have suggested that most student groups (e.g., African American, Latinx, AAPI, and American Indian/Alaskan Native [AI/AN] students) are underrepresented in special education compared to White students of similar academic proficiency and socioeconomic background (e.g., Hibel, Farkas, and Morgan 2010). Although this topic has been fiercely debated (see Blanchett and Shealey 2016; Morgan et al. 2015; Skiba et al. 2016), findings consistently indicate that overrepresentation is associated with racial “differences in academic achievement and/or social class” (Shifrer 2018:398), and some research has suggested systemic early and pervasive biases in educational access and experiences for marginalized students (see Carter and Welner 2013; Ray 2019). These structural inequity studies have implicated racism and xenophobia as embedded in larger contexts that impact schools (see Elder et al. 2021; Ray 2019; Shifrer and Fish 2020; Sullivan and Artiles 2011).
Researchers have also examined how practitioner bias impacts special education referral and identification, and extant studies have underscored the complexity of this phenomenon. Fish (2017) and Cooc (2018b) both demonstrated that practitioners interpreted disability depending on a student’s cultural identity. Fish (2017) found that practitioners referred African American and White students to special education for different reasons—African American boys were more likely to be referred for behavioral challenges, whereas White students were more likely to be referred for academic challenges. Cooc (2018b) found that teachers were more likely to disagree on the presence of a disability when students were African American, boys, and from lower socioeconomic backgrounds, suggesting that teachers’ understanding of behavior and ability are both highly contextualized and based on “subtle race and gender relations” (Vavrus and Cole 2002:87).
However, there is also significant evidence of difference in social etiology related to racialized placement into special education (e.g., Shifrer 2018; Shifrer and Fish 2020). This has been true, in particular, for students labeled under subjective disability categories—those into which classification is more dependent on practitioner judgment (e.g., specific learning disability [SLD])—and categories associated with social stigma and segregation from non-labeled peers (e.g., intellectual disability [ID], emotional disturbance [ED]) compared to categories associated with medical needs (e.g., visual impairment; see Grue 2016) and increased parental advocacy and resources (e.g., autism; see Blanchett 2010; Sleeter 2010). In an analysis of school demographic composition, Fish (2019) indicated that school racial minority enrollment was associated with how students were pathologized and sorted into different disability categories based on sociodemographic identity. For example, African American students in schools with a higher percentage of White students were more likely to be identified under “lower status disability categories” (2019: 2578; i.e., SLD and ID), whereas White students were more likely to be found eligible for “higher status” categories (i.e., autism). These studies indicate an agency–structure dualism (Mehan 1992), in that the practices and policies that lead to disability labels are subject to both larger structures and individual actors within a system, which interact and contribute to differential special education labels (Ahram, Kramarczuk Voulgarides, and Cruz 2021).
WHY TIMING MATTERS
Despite the body of work indicating that race plays a complex role in the process of special education referral and labeling, this body of research remains limited in understanding how student characteristics impact the timing of special education identification (Cruz and Rodl 2018). Studies that have examined only cross-sectional data or data focused on younger students (e.g., Hibel et al. 2010) may suggest lower levels of disproportionality than would identification data from across students’ school careers. These shorter timelines may account for some unexplained differences in disproportionality rates, such as among students labeled with SLD in middle school (see Shifrer 2018).
Although studies have demonstrated underrepresentation of African American and Latinx students prior to school entry, few have examined categorical identification differences in later grades (i.e., beyond the early elementary years). For example, Yeargin-Allsopp et al. (1995) found little difference in the prevalence of ID identification between African American and White preschoolers, but that by first grade African American children were overrepresented in this category compared to White peers. Using data from the California Department of Education, Guarino et al. (2010) found systematic differences in the timing of identification by gender (i.e., girls were less likely to be identified with special needs prior to kindergarten entry than boys) and race (i.e., African American students were less likely than children of other races to be identified prior to kindergarten). Similarly, Morgan et al. (2012) found that at 48 months of age, African American, Latinx, and Asian children were all disproportionately underrepresented (compared to White children) in early intervention/early childhood special education services provided through the Individuals with Disabilities Education Improvement Act (IDEA 2004); this was true both before and after extensive control covariates were included.
Some studies have also highlighted the role of social etiology in relation to special education identification in middle and high school. Cooc (2019) examined the timing of placement for AAPI students and found that, for most subgroups, the probability of receiving services was much lower than that of the overall district and that identification tended to happen later compared to other student groups. Results indicated that “for the overall district, about 10% of students received special education by the end of Grade 3; for nine of the 11 AAPI groups, this occurred around Grade 9” (2019: 187). English learners (Umansky, Thompson, and Díaz 2017) and children with more recent immigration histories (Hibel and Jasper 2012) have also been shown to experience increased odds of special education identification as they progress through school, facing underrepresentation in elementary school but overrepresentation by middle and high school.
Indeed, research indicates that without swift intervention, students who display academic and behavioral support needs early on are more likely to experience negative outcomes, including dropout, poor academic achievement, and suspension from school for disciplinary reasons (e.g., Darney et al. 2013). However, access to high-quality early childhood programs can significantly reduce the need for special education services by third grade, particularly for minoritized students (e.g., Muschkin, Ladd, and Dodge 2015); students placed into special education by kindergarten are more likely to be exited from services than those found eligible in later grades (Blackorby et al. 2010). Thus, understanding patterns and potential biases related to timepoint of entry into special education—and patterns regarding the labels attributed to students at those timepoints—is a critical component of the disproportionality conversation.
STUDY PURPOSE
We examined the odds of special education placement by grade level, which contributes to understanding how disproportionality risk changes over time, given a student’s gender, race, ethnicity, and language background. Our findings specify the changes in odds of placement into special education by grade level, both in general and under specific disability labels, disaggregated by students’ sociodemographic identity markers. Given the importance of local context, this study examined how students’ risk of identification changed across years of schooling within one large, urban school district. The following questions guided this research: (1) How does special education identification risk change across grade levels for marginalized student groups compared to White students? (2) To what extent do student background characteristics explain differences in the timing of special education identification among marginalized students relative to White students? and (3) To what extent does the timing of identification into individual categories differ among marginalized students relative to White students?
CONCEPTUAL FRAMEWORK
To answer these questions, we grounded this work in a conceptual framework that drew upon two theoretical perspectives. Disproportionality scholars have urged researchers to specify theories to guide interpretation of quantitative findings related to complex developmental and environmental processes (Cruz and Rodl 2018; Ravitch and Riggan 2016). Sullivan and Artiles (2011), for example, used structural theory as a means of understanding district structures in relation to racial inequity in special education, whereas Cooc (2019) used acculturation theory to describe the ways in which AAPI parents viewed disabilities and services in relation to underrepresentation of AAPI students. In doing so for this study, we integrated two theoretical perspectives to examine social-etiological differences related to the timing of special education identification: labeling theory and life course theory (LCT). Labeling theory posits that marginalized groups are more susceptible to stigmatizing labels (Becker 1963) as part of the “manner in which society defines and creates deviance” (Raybeck 1988:371), and LCT acknowledges social, economic, and environmental factors (i.e., the financial resources and neighborhood conditions where children live and learn) as underlying drivers of inequalities. Integrating these theories into a conceptual framework allowed for consideration of outcomes from a temporal perspective, viewing students’ developmental trajectories as a product of experiences accrued across their life course. We drew on this framework to interpret the timing of label application—of both special education eligibility in general and under specific disability category labels—and how pathologizing students’ differences perpetuates marginalization and stereotyped perceptions at the intersections of race and (dis)ability (Annamma, Connor, and Ferri 2013). Students at higher risk of receiving stigmatizing labels in the latter half of their school careers are likely to experience different teacher attitudes and perceptions of their abilities and, relatedly, varied types and levels of support across their academic trajectories.
Lauchlan and Boyle (2007) posited that labels can be useful if they lead to specific and purposeful intervention, but that labeling can lead to generalizing a person’s needs and justifying social disadvantage and exclusion. Particular labels may do so through stigma, which Link and Phelan (2001) conceptualized as a connection between an attribute and a stereotype that causes discrimination. In sociological studies of race (Alba 2005; Mora 2014; Omi and Winant 2014), mental health (Martinez et al. 2011), and disability (Artiles, Dorn, and Bal 2016; Bal 2017; Ferri and Connor 2005), legal and social discourse are understood to construct categories, and these categories become linked to stereotyped beliefs that impact social behavior (Harry, Klingner, and Hart 2005; Shifrer 2013). An acknowledgment of stigma, then, is critical in the examination of students’ experiences in the special education system, as particular special education labels have been associated with low expectations from practitioners (e.g., Lambert 2015; Lewis-McCoy 2016) and a high risk of social rejection (Martinez et al. 2011). Therefore, although special education services may provide academic and social support, the requisite disability labels may produce stigma and lower expectations from supporting adults, a tension that Shifrer (2013) described as requiring cost–benefit consideration.
As aforementioned, decades of research point to a complicated perceived hierarchy in the status of given disability labels (Fish 2019; Grue 2016; Tringo 1970). By leveraging LCT in our conceptual framework, we posit that attributing a disability to a student later in their school career may result in stigmatization in comparison with a disability attributed in the younger years. Furthermore, research has suggested that these attributions are not race-neutral (e.g., Bal 2017; Reid and Knight 2006; Sleeter 2010). In the context of disproportionality, special education identification timing is critical, as teachers’ understandings of student needs can be explained by their perceptions of students’ prior knowledge, experiences, and resources. Bal et al. (2014) coined this phenomenon the empty backpack theory, which refers to educators’ perception that some students arrive at school better prepared to access learning opportunities than others. Teachers in their study suggested that “certain students’ backpacks are ‘empty’ when they get to school, while others come with a full backpack” (2014: 334), and some teachers overtly linked these metaphorical empty backpacks to students’ race/ethnicity. Bal et al.’s analysis also indicated less direct associations between students’ race and school preparedness among participants, and their findings suggested that practitioners viewed these perceived deficits as existing primarily among African American students. In other words, practitioners applied a deficit perspective to explain and abdicate at least some responsibility for academic inequities.
Thus, understanding students’ life events as rooted in a dynamic interplay with larger systems (i.e., social determinants of equity, community, economic, and environmental patterns; see Braveman, Egerter, and Williams 2011) is critical in examining students’ life trajectories in relation to the special education system. Our conceptual framework allowed for temporal contextualization of students’ experiences amid cumulative advantages and disadvantages, particularly during sensitive periods of development (Gee, Walsemann, and Brondolo 2012), during which educational events may have a greater impact.
METHOD
To answer our research questions, we employed a discrete-time hazard analysis strategy to describe students’ temporal patterns of placement into special education, and we included high-incidence disability categories in addition to SLD and students’ sociodemographic characteristics. In our analyses, hazard referred to the likelihood that the outcome of interest (i.e., special education identification by category) would occur for a student in a particular grade, given that the event had not already occurred in previous years for that student.
Sample
After securing institutional review board approval, we collected administrative data from a large urban school district in California. We chose to examine a single district rather than use a nationally representative dataset because, as aforementioned, our conceptual framework was rooted in exploring social patterns in relation to local settings, and researchers have long called for a better understanding of the “contextually dependent nature” (Sullivan and Bal 2013:491) of special education services. Data included demographics for all students enrolled in the district from Fall 2010 to Spring 2016. To ensure anonymity to the district, we reported the total sample across all six years. There were 211,276 total student records across those six years, with 59,055 unique students represented in the data and an average of 3.48 observations (i.e., years represented) per student. The longitudinal nature of the data meant that the first cohort of preschool students in 2010 completed fourth grade in 2016, and the last cohort in 2016 had one year of data.
Latinx students comprised the largest group of students within the sample (53 percent, compared to 54 percent statewide and 24 percent nationally), White students accounted for 26 percent (compared to 24 percent statewide and 48 percent nationally), AAPI students comprised 16 percent of the sample (compared to 12 percent statewide and 6 percent nationally), and African American students comprised 4 percent of the sample (compared to 6 percent statewide and 14 percent nationally; California Department of Education 2019; National Center for Education Statistics 2020). Students who were AI/AN and students who declined to state an ethnicity comprised less than 1 percent of the sample. Almost half (47 percent) of the sample’s students qualified for free or reduced-priced lunch (FRPL), and just under 10 percent of the sample qualified for special education services (compared to 8 percent statewide and 13 percent nationally). Roughly a quarter of all students in the sample qualified as emerging multilingual learners (i.e., students learning English; EML), and the majority of these emerging multilingual learners spoke Spanish as a primary language.
To better describe the analytic sample, we calculated special education category-based disparities (i.e., students’ risk and relative risk), each in comparison with a relevant reference category (e.g., White students for race/ethnicity categories). Relative risk was calculated as a ratio of two groups’ risk (e.g., African American students’ risk divided by White students’ risk); values greater than 1 indicate a greater risk of special education identification than the reference category, whereas values less than 1 indicate lower risk relative to the reference category. These results are reported in Table 1.
Demographic Characteristics, Risk, and Relative Risk of the Analytic Sample.
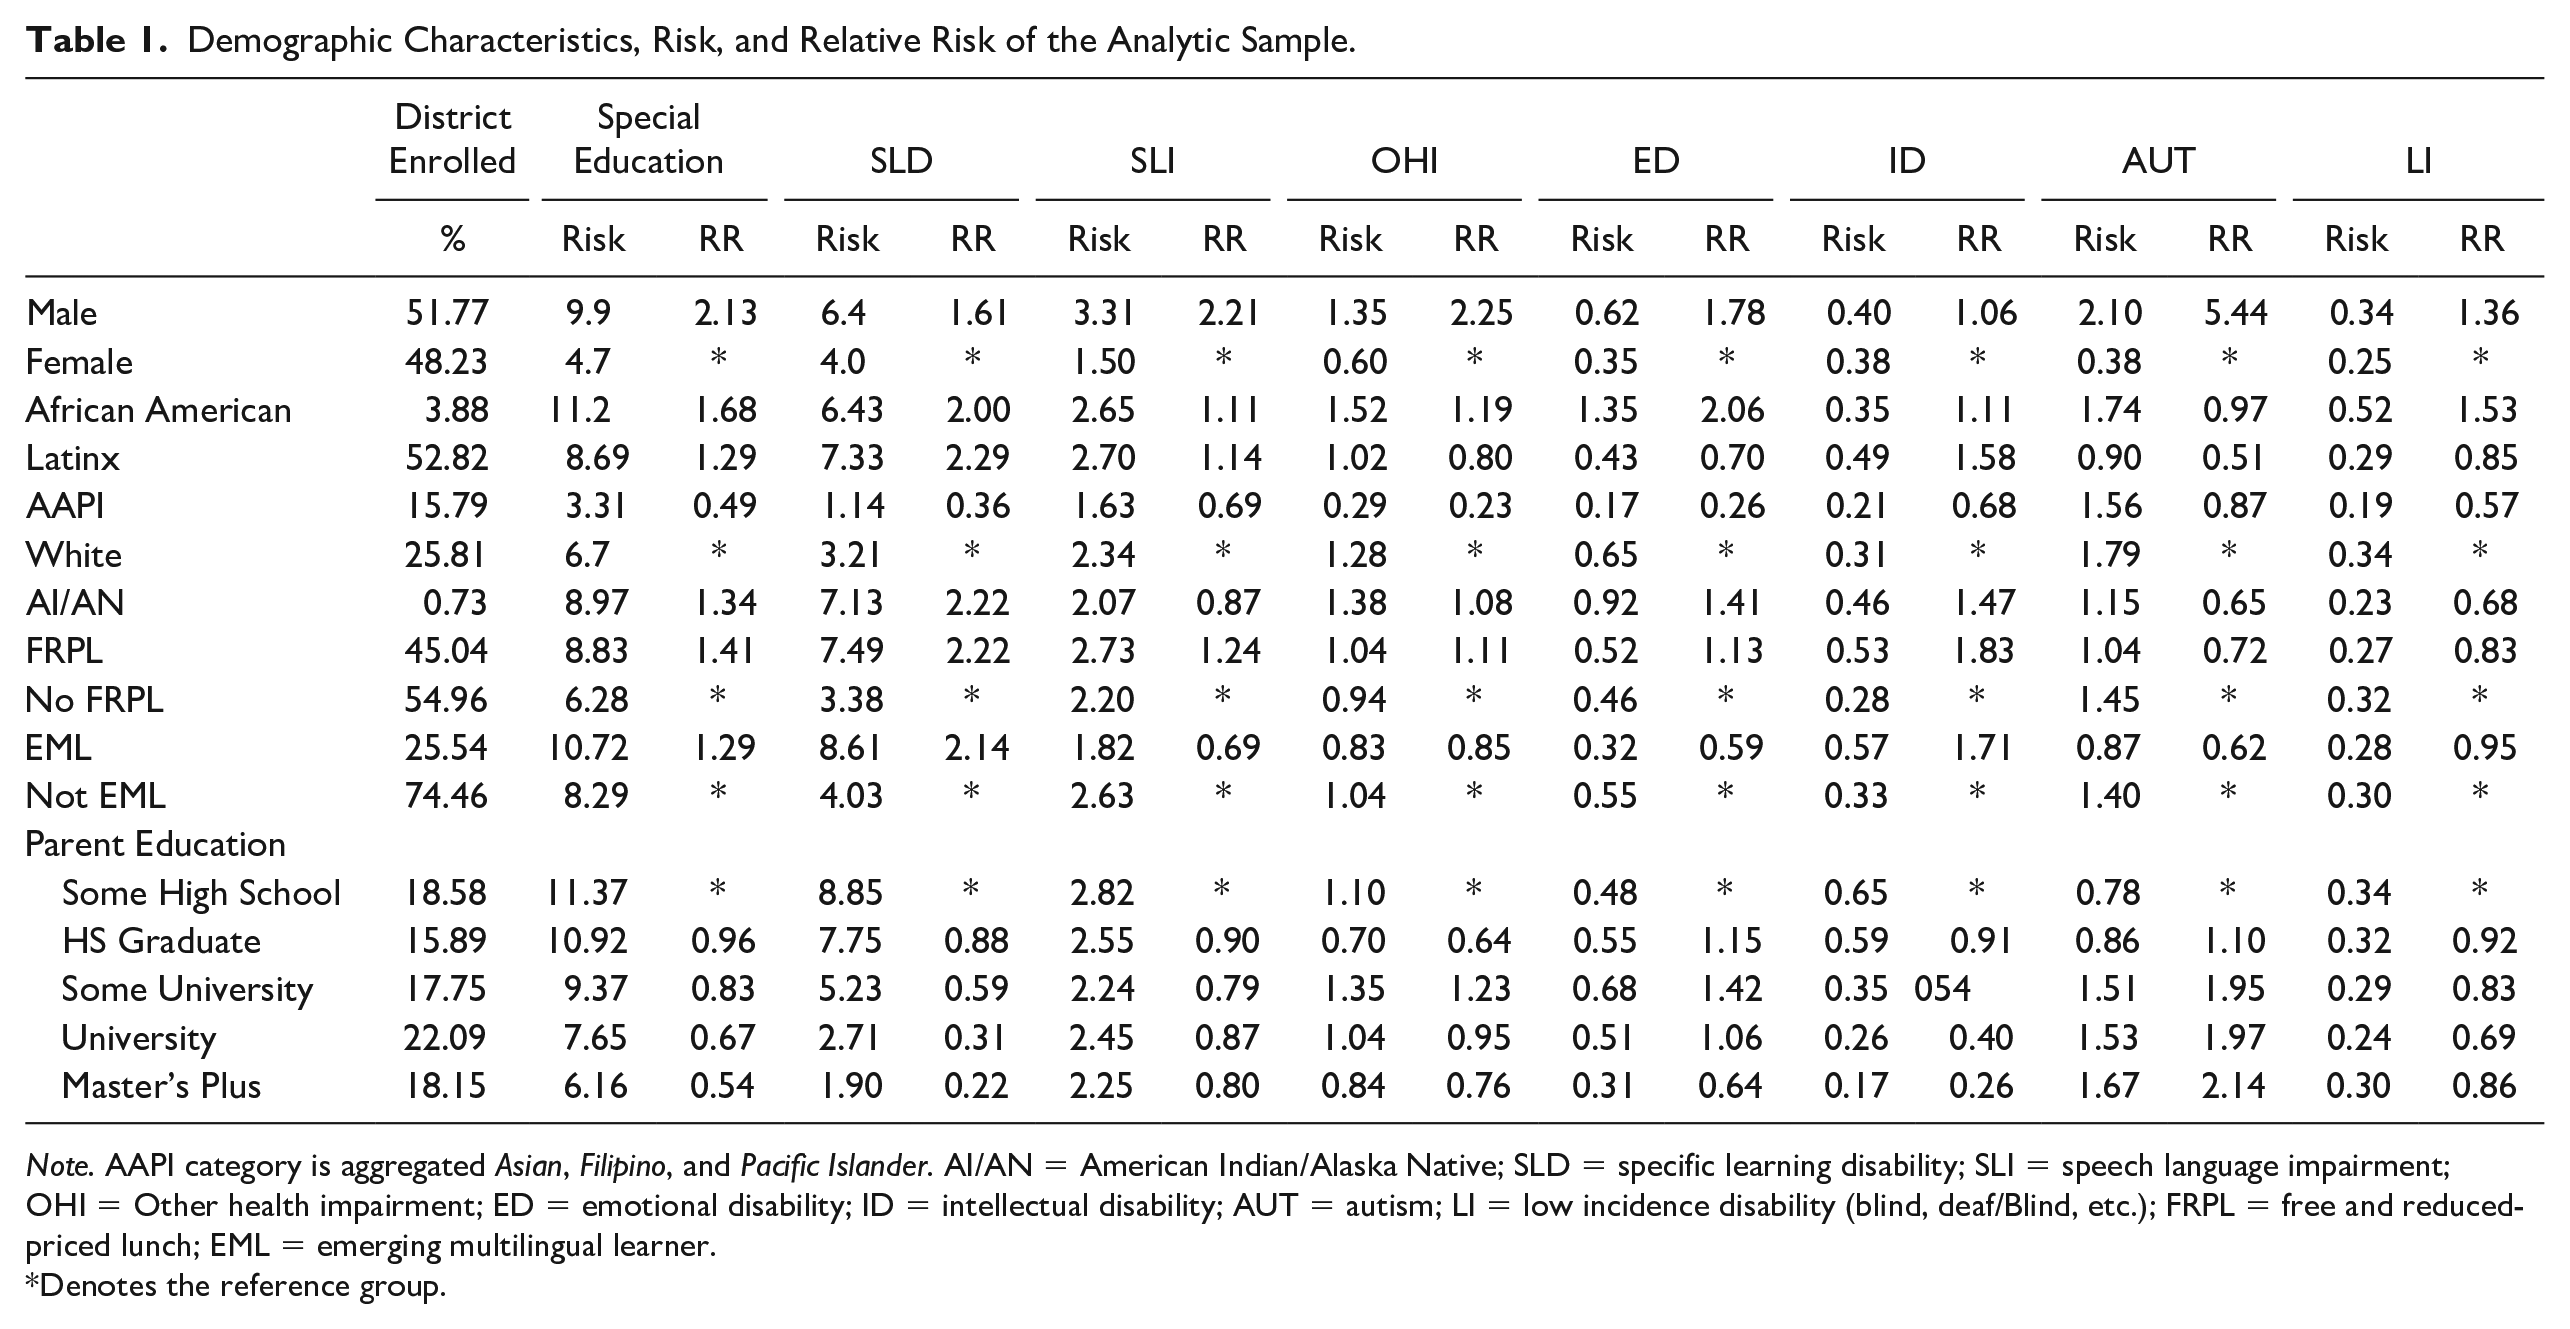
Note. AAPI category is aggregated Asian, Filipino, and Pacific Islander. AI/AN = American Indian/Alaska Native; SLD = specific learning disability; SLI = speech language impairment; OHI = Other health impairment; ED = emotional disability; ID = intellectual disability; AUT = autism; LI = low incidence disability (blind, deaf/Blind, etc.); FRPL = free and reduced-priced lunch; EML = emerging multilingual learner.
Denotes the reference group.
The analytic sample contained data for 41 schools; this included 24 elementary schools, two schools serving students from kindergarten through grade 8, six middle schools, and five comprehensive high schools. The sample also contained four alternative and/or continuation high schools and one early childhood family learning center. The grade-level variable included the following categories: preschool, kindergarten, grades 1 to 12, secondary transition education for students with disabilities between the ages of 18 and 22 years, and continuation high school for those who were credit-deficient at the age of 18 years. To account for school-level variance in our analyses, we introduced a school fixed-effect, described in further detail in the analysis section.
Variables
Dependent variables
The main dependent variables for this study included a set of dichotomous indicators for special education identification—operationally defined as the student having an Individualized Education Program (IEP)—and six dichotomous variables indicating disability category designation. The disability categories included SLD, speech/language impairment (SLI), other health impairment (OHI), ID, ED, and autism. All low-incidence disabilities were grouped into one variable (LI), which included deaf-blindness, deaf/hearing impairment, multiple disabilities, orthopedic impairment, traumatic brain injury, established medical disability, and visual impairment, and although we controlled for this category in our analyses, we did not interpret coefficients for LI due to low cell sizes. These outcome variables were coded as 1 in the grade level that a student received the designation, and we only considered primary diagnoses in our analyses.
Student and family covariates
Student-level predictors that served as control variables included race, dichotomously coded as six variables: White, African American, Latinx, AAPI, AI/AN, other (decline to state, unknown); gender, dummy coded, with girl serving as the referent; EML status, dummy coded with not EML serving as the referent; FRPL, dummy coded, with not FRPL serving as the referent; and parent education level, dummy coded as six variables: some high school, high school graduate, some university, university graduate, master’s plus, and not given, with some high school serving as the referent. For all models, we coded White students as the reference group, in alignment with Sullivan and Artiles’ (2011) argument that White students represent the “dominant group in society who have not had systematic problems with access and opportunity issues” (2011: 1537). The race category of other and parent education level of not given represented less than 1 percent of the sample, so we included these as controls, but due to low cell sizes we did not interpret related results.
As aforementioned, a documented predictor of special education identification is student achievement (Hibel et al. 2010). However, as prior research indicates, this is a factor that introduces endogeneity. As Shifrer (2018: 388) notes, . . . educational performance also var[ies] as a function of social differences, like social class and linguistic status. Racial minorities and males academically underperform relative to counterparts, such that their disproportionate classification with LDs may be consistent with their lower levels of educational performance. (P. 388)
Skiba et al. (2008) also described the substantial overlap between race, poverty, and achievement, in alignment with which we believed including this variable would introduce corollary confounding into the final model. Missing data further complicated the inclusion of academic measures, as students do not take standardized assessments prior to drade 2 in California, and across the years of data, the district switched from the California Standards Tests to the Smarter Balanced Assessment and opted not to assess students in the 2013 school year. Finally, as outlined in our conceptual framework, given that we sought to examine the social etiology of labeling, we did not believe it was appropriate to take academic proficiency into account in our final models. Rather, we conducted a sensitivity analysis using academic variables for which we had data available. This analysis is briefly described in our results section, and full results can be provided upon request.
Analyses
In our analyses, hazard referred to the likelihood that special education identification would occur for a student in a particular grade, given that the event had not already occurred in previous years for that student. Our outcomes of interest (i.e., special education identification and individual disability category label) represent dichotomous variables for event occurrence, so we used a logistic regression framework. Adding predictors to the model enabled us to estimate the relationship between predictors of interest and event occurrence. As recommended by Singer and Willett (2003), we constructed a person-by-period dataset with observations for each student, i; in each grade, j; situated in school, s; until either the event occurred or the student no longer appeared in the data (either because additional years of data were not available or because the student left the district or graduated). We used longitudinal discrete-time hazard analysis (Singer and Willett 2003) to estimate the occurrence of an event across the six years of available data. The following logistic regression equation represents the full model:
where hij is an indicator for the event (IEP) occurring for the first time in grade level j for student i. The discrete-time hazard model expresses the logit of hij as a function of grade level, represented by Dij, the race of the student, represented by βi (i.e., the coefficient of interest), and γxi as a variable vector containing student-level control variables (i.e., gender, FRPL, EML, parent education level), and φs as a fixed-effect controlling for students’ initial school of attendance. We included interactions between the race indicators and the indicator variables for each grade level, thus representing the effects of race covariates on the slope of the logit hazard function (i.e., how the slope changes depending on race at each grade level).
RESULTS
Descriptive Comparisons
Table 1 depicts the risk and relative risk of each racial group compared to White students. These bivariate risk indices showed that African American students were twice as likely as White students to be placed into the SLD category and were overrepresented in all categories except autism. Latinx students were overrepresented in the SLD, SLI, and ID categories and underrepresented in all other categories. AAPI students were underrepresented in all categories, with autism being the closest to proportional with White students. Consistent with prior research, boys were doubly represented in special education compared to girls, students receiving FRPL were overrepresented in special education, and higher parent education level was associated with lower representation in special education for all categories except autism, a category in which this trend was reversed. Students identified as EML were overrepresented in SLD, but underrepresented in SLI, compared to non-EML students.
Figure 1 depicts the proportion of students in special education by grade level for each racial category. AAPI students experienced the highest identification in preschool, with consistently reduced rates across ascending grade levels. Whereas White students experienced an identification peak in fourth and fifth grades, the peak for Latinx and African American students came later, during the middle school years, with an additional slight increase for African American students in third grade.
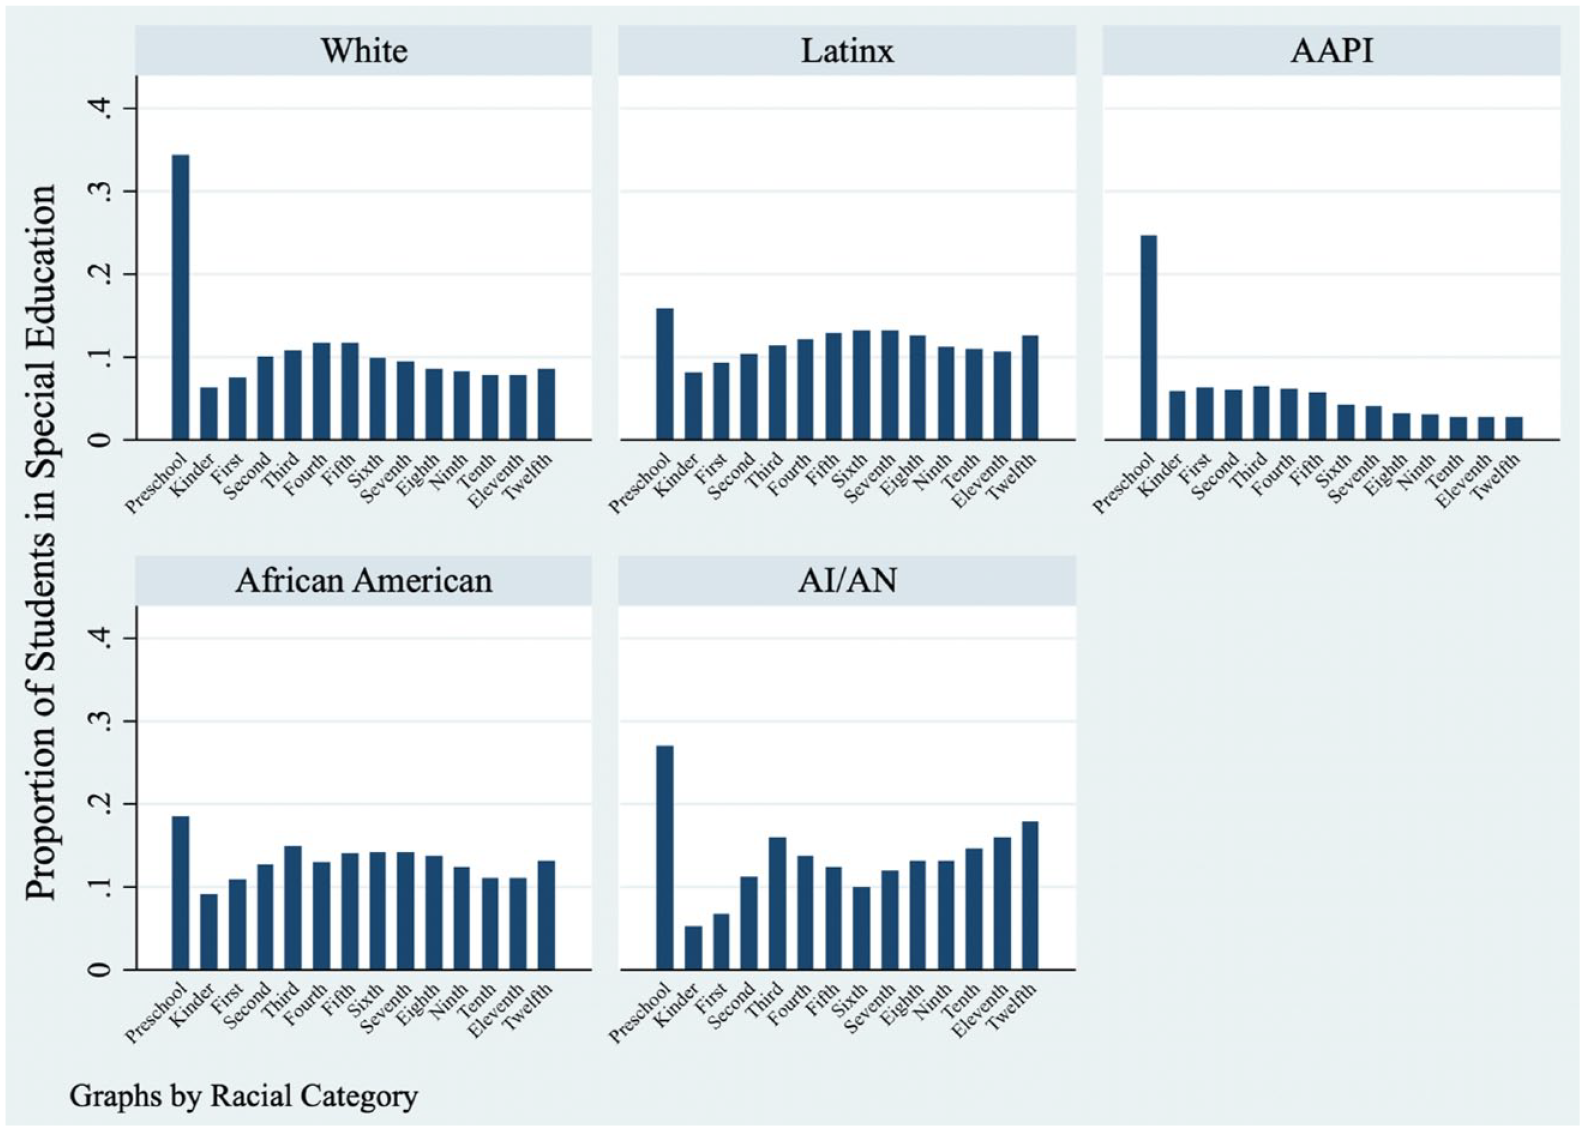
Proportion of students in special education by grade level for each racial group.
LIKELIHOOD OF SPECIAL EDUCATION IDENTIFICATION
We estimated hazard coefficients, exponentiated to odds ratios for each racial category, and these are reported in Table 2. Prior to covariate adjustment, compared to White peers, African American and Latinx students were more likely to be found eligible for special education. As mentioned, AI/AN students are shown in Figure 1 and Table 2, but these results should be interpreted with caution, as this group represented less than 1 percent of the analytic sample.
Discrete-Time Hazard Regression Model: Odds Ratios by Grade Level.
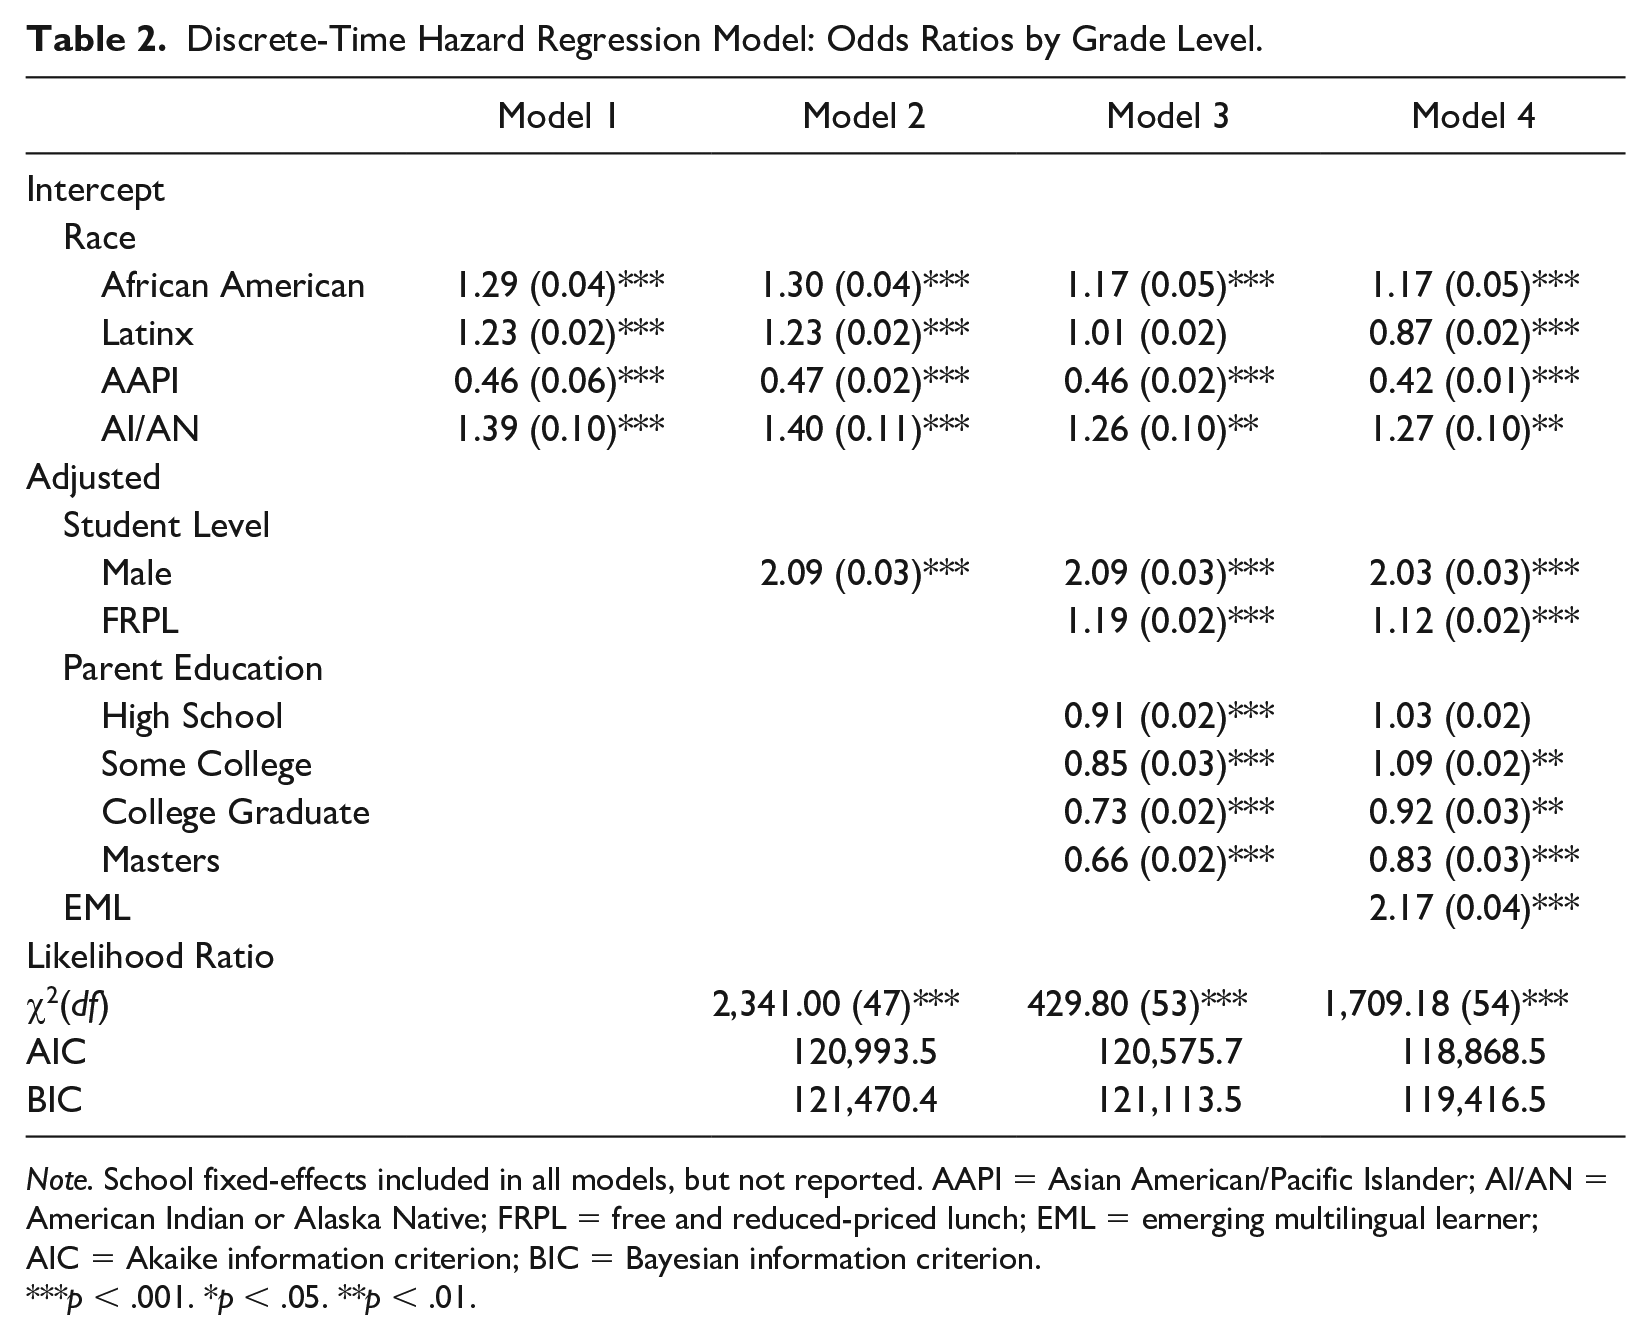
Note. School fixed-effects included in all models, but not reported. AAPI = Asian American/Pacific Islander; AI/AN = American Indian or Alaska Native; FRPL = free and reduced-priced lunch; EML = emerging multilingual learner; AIC = Akaike information criterion; BIC = Bayesian information criterion.
p < .001. *p < .05. **p < .01.
We examined the extent to which student and family background characteristics explained differences in special education identification among African American, Latinx, and AAPI students relative to White students. Table 2 includes hazard ratios for both unadjusted and adjusted models for students with IEPs and examines goodness of fit with each covariate addition (i.e., gender, FRPL/parent education level, and English learner status). We conducted likelihood ratio tests to assess the fit of each addition. As aforementioned, prior to covariate adjustment, African American and Latinx students were overrepresented across timepoints, and adding gender resulted in a better fitting model with a statistically significant result, indicating that boys were more likely to be identified than girls. However, gender did not significantly moderate the effect of race. Adding socioeconomic indicators also resulted in a better fitting model and showed that higher parent education resulted in less frequent identification. Adding socioeconomic variables moderated the odds for African American students, although they remained statistically overrepresented, and FRPL and parent education level fully moderated the effect for Latinx students. Adding a language status covariate indicated underrepresentation for Latinx students—in line with other research (e.g., Hibel and Jasper 2012; Umansky et al. 2017)—indicating that English learners were much less likely to be identified for special education in earlier grades. However, they faced a much greater risk in later grades, and this covariate was likely highly endogenous to the Latinx category in particular. Likelihood ratio tests showed that the final adjusted model was the better fitting model, indicating that student and family factors attenuated the effect of race, particularly for Latinx students.
Placement by Category
Table 3 provides hazard ratios by category, both adjusted and unadjusted, for each racial group, and categorical smoothed hazard estimates are depicted in Figure 2. African American and Latinx students were increasingly overrepresented in SLD, both before and after control covariates, and were equally represented in SLI, although all student groups were more likely to be identified with SLI early and ultimately be exited from services. AAPI students were the least likely to be labeled with OHI, and African American students faced similar odds of identification under OHI in the elementary years but a much higher likelihood in post-elementary years. Boys were also at higher risk for placement in this category. African American students were significantly overrepresented in ED, and Latinx students were significantly overrepresented in ID. ID, as a category, was highly correlated with low-socioeconomic status (SES) covariates, and the autism category showed the opposite association; in other words, students with low SES were more likely to be labeled with ID, whereas students with high SES were more likely to be labeled with autism.
Discrete-Time Hazard Regression Models: Odds Ratios.

Note. Due to small sample size, AI/AN should be interpreted with caution. SLD = specific learning disability; SLI = speech language impairment; OHI = other health impairment; ED = emotional disability; ID = intellectual disability; AAPI = Asian American/Pacific Islander; AI/AN = American Indian/Alaska Native; FRPL = free and reduced-priced lunch.
p < .001. *p < .05. **p < .01.

Smoothed hazard estimates hˆ(t) by race for each disability category.
Timing of Identification
Our primary analysis of interest regarded the timing of identification overall and by disability category. We examined grade-level odds ratios, reported in Table 4, in which we highlighted the largest two simultaneous cells for each group to emphasize the timepoints at which each faced the largest consecutive odds of identification. As outlined in Table 4, in line with prior research, unadjusted models for preschool indicated that African American, Latinx, and AAPI students were underrepresented in identification likelihood compared to White preschoolers (Guarino et al. 2010; Morgan et al. 2012). African American students were more likely to be placed into special education in kindergarten, and Latinx students by first grade. Whereas White students experienced an increase in identification around third and fourth grades, African American students experienced this increase in seventh and eighth grades, and Latinx students experienced this increase in ninth and tenth grades. Unadjusted models also indicated that Latinx students remained overrepresented in special education throughout secondary school. AAPI students were most likely to be identified in early grades, but at a significantly reduced rate compared to White peers.
Odds Ratios by Grade Level.
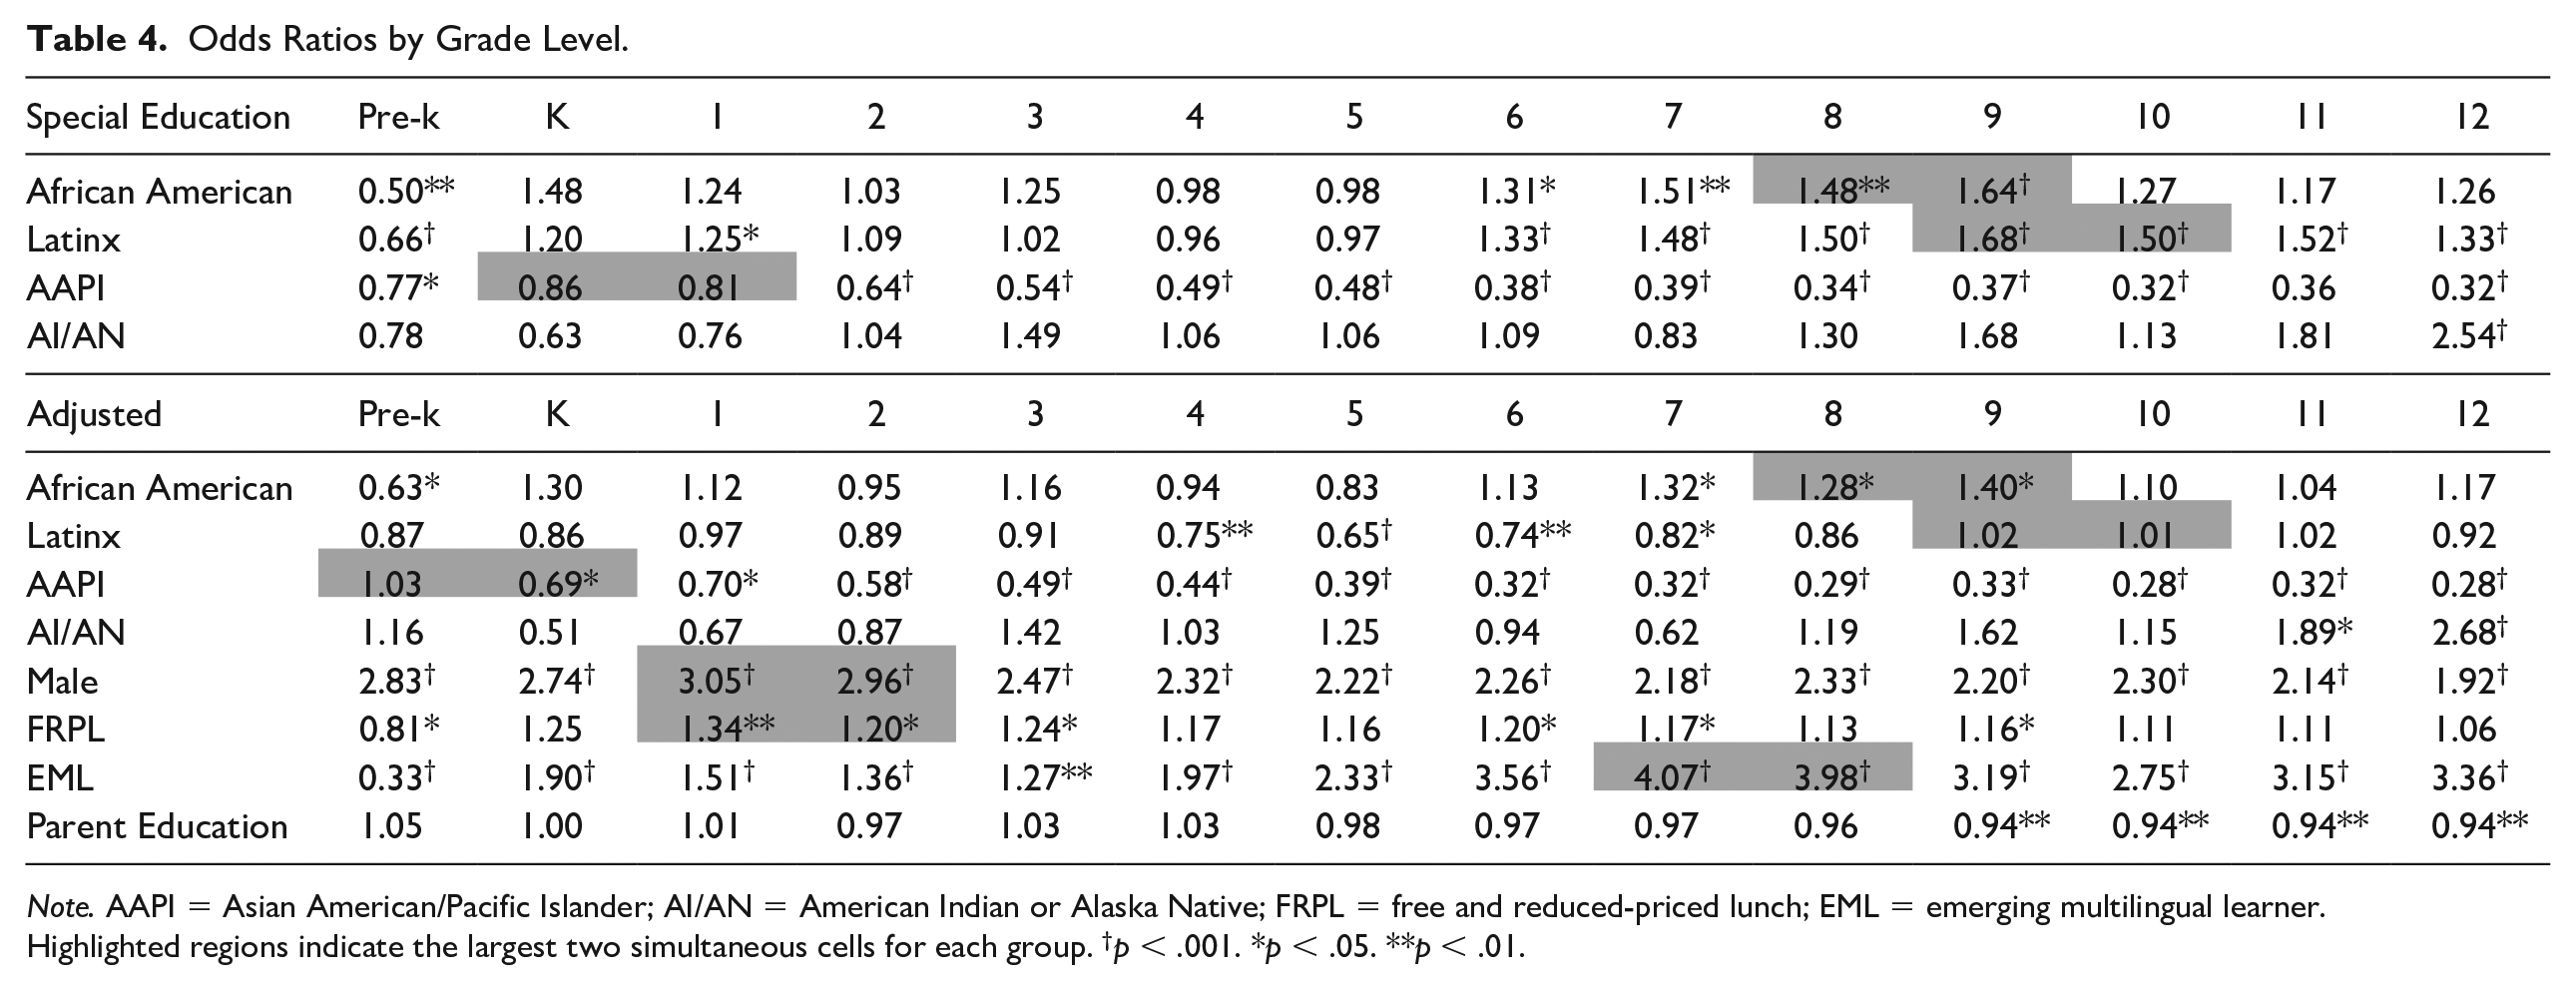
Note. AAPI = Asian American/Pacific Islander; AI/AN = American Indian or Alaska Native; FRPL = free and reduced-priced lunch; EML = emerging multilingual learner.
Highlighted regions indicate the largest two simultaneous cells for each group.
p < .001. *p < .05. **p < .01.
After covariate adjustment, our results indicated that the highest risk of identification for English learners occurred in middle school. Controlling for socioeconomic variables, gender, and school of attendance, African American students faced the largest risk in seventh through ninth grades, compared to White peers, and Latinx students were underrepresented in earlier years and equally represented in secondary years. Because of the confounding effect of EML on the Latinx category, in line with our theoretical framework on labeling theory, we chose not to include EML as a covariate in subsequent categorical models, as these labels represented significant overlap.
We broke these results down by category (odds ratios are provided in Supplementary Table 5 and depicted in Figure 2), given race, gender, and socioeconomic covariates. Compared to White preschoolers, Latinx preschoolers were twice as likely to be given the SLD label, and risk for Latinx and African American students remained elevated throughout middle school compared to White students. All racial groups were either equally or less likely to be identified under SLI throughout elementary school, with Latinx students and boys facing higher risk of SLI in later grades than White girls. Compared to White peers, African American students faced a higher likelihood of an OHI label past fifth grade, with Latinx students experiencing equal likelihood across grade levels compared to White students.
For the ED category, arguably the most stigmatizing in nature (Bal, Betters-Bubon, and Fish 2019; Harry et al. 2005), preschool Latinx students were equally likely as White students of being identified under this category; however, African American students’ risk of ED identification in preschool was 10 times that of White students. Post-preschool, Latinx students were consistently underrepresented in the ED category compared to White peers, and African American students remained overrepresented, with new identification peaking in fifth grade, compared to White students.
Autism represented a category with unique patterns and predictors. AAPI and White students were most likely to be identified under this category in preschool compared to other race groups, and African American students were twice as likely to be identified with autism in kindergarten compared to White kindergarteners, suggesting a slightly later diagnosis in a category for which early identification (i.e., before three years of age) is imperative (Fuller and Kaiser 2019). For the remaining grade levels, White students were the most likely to be labeled with autism. Two unique features of this category, however, were that (1) boys were highly overrepresented across all grades and (2) odds for parent education level reversed compared to other categories. Odds for boys in the autism category were at least triple those of girls at all grade levels, with a peak at 10 times the likelihood in second grade. Increased parent education level at almost every grade represented an increased risk in an autism label, whereas for all other categories, lower parent education represented an increase in risk, indicating the potential impact of parent advocacy in label application.
Sensitivity Analysis
We conducted a sensitivity check for our main findings pertaining to the absence of an academic measure. We compared our final model’s estimates to a model with an indicator for academic measures, including only those with statewide testing scores (i.e., the California Standardized Test for language arts and mathematics) for the first three years of data to examine whether this affected our parameter estimates. Likelihood ratio tests indicated that adding statewide reading achievement scores would produce a slightly better fitting model, χ2(df = 47) = 90,423.82, p < .001, Akaike information criterion (AIC) = 117,536.6; however, our estimates for the Latinx and AA/IN categories remained largely unchanged, suggesting that academic measures specifically impacted outcomes for African American students. In line with LCT, this finding indicates that African American students faced greater impact from social, economic, and environmental factors as potential underlying causes of persistent inequalities, and this remains an important area for future research.
DISCUSSION AND IMPLICATIONS
This research sharpens our understanding of disproportionate special education labeling by examining the influence of eligibility timing on risk with consideration of students’ background factors (i.e., race/ethnicity, gender, and SES). Results indicated that African American and Latinx students experienced higher risk for identification after elementary school, specifically in disability categories associated with educational segregation (Kurth, Morningstar, and Kozleski 2014; Powers, Bierman, and Coffman 2016) and stigma (Martinez and Hinshaw 2016; Shifrer 2013; Sleeter 2010), such as ED and ID. We found that higher parent education was associated with increased likelihood of a low-stigma label (e.g., SLI and autism), whereas lower parent education was associated with high-stigma labels (e.g., ID). By leveraging labeling theory in our conceptual framework, we found that different special education eligibility categories were associated with unique predictors, and that identification was associated with students’ identity markers. Our conceptual framework also leveraged a LCT lens, which prompted this examination of the timepoints at which risk for application of high- and low-stigma labels changed for historically marginalized students. This framework drew upon Ong-Dean’s (2006) discussion of historical disability label shifts, conceptualized as the so-called high and low roads to disability—one comes with relative privilege and one comes with stigma. We argue that timing impacts the road a student travels, and that later diagnoses represent the low road, one more commonly selected for marginalized students, as indicated by our differential risk findings.
This was further demonstrated in the association between parent education level and risk of autism identification. For most disability categories, higher parent education levels were associated with decreased odds of placement; however, for the autism category, as parent education level increased, odds ratios also increased. This unique characteristic supports theories that parent agency and privilege influence which labels are assigned to students. Given that certain labels come with increased resource access, and other labels are more stigmatizing (Fish 2019; Ong-Dean 2006), this is a poignant example of the opportunity hoarding in educational spaces that Diamond and Lewis (2019) conceptualized. Diamond and Lewis analyzed the ways in which school systems center and protect whiteness, often under the guise of race neutrality. The differential labeling and sorting of students into special education categories—based on intersectional, marginalized identity markers—demonstrated in our results exemplifies how educational institutions protect and maintain power hierarchies across race, class, and (dis)ability.
Furthermore, social constructionist explanations regarding the historical emergence of special education categories highlight the manner in which economic and political ideology have led to shifts in who gets identified for what. For example, Sleeter (2010) argued that in the first 10 years of the SLD category’s existence, mainly White middle-class students were given this label when faced with academic failure, but, as schools became less segregated in the 1970s, the social conditions of education changed and the ID 1 category was redefined and thus repopulated. The qualification criterion was reduced from one standard deviation in intelligence quotient below the mean to two, and with that the racial composition of the SLD category shifted: African American students became less represented in ID and more represented in SLD. Some scholars have argued that the dramatic rise in autism prevalence is a product of broader societal shifts, such as increased awareness and greater access to services and networks of influence, and that diagnostic shifts away from high-stigma labels toward autism have been influenced by networks of privilege (i.e., parents with greater social and political capital, and teachers who view these students’ metaphorical backpacks as already filled; Eyal 2013). Given that parent education level was associated with unique identification patterns in the autism category—and that significant patterns in identification timing for high-stigma labels were present for marginalized demographic groups—our results indicate that children’s sociodemographic backgrounds influence their chances of identification under certain disability labels. In other words, power hierarchies associated with these identity markers motivate sorting into particular categories, and this sorting sustains inequities (Diamond and Lewis 2020).
The influence of grade level on identification disproportionality in particular disability categories further substantiates our theory. Similar to Yeargin-Allsopp et al. (1995) and Morgan et al. (2012), our data indicated lower levels of disproportionality in overall identification before kindergarten; however, this disproportionality increased after students entered K–12 schooling and further increased in secondary schooling, particularly in the application of high-stigma labels. Identification odds for African American and Latinx students increased during middle school, a finding that we believe is critical from a life course perspective. Although it has been established that “entry into school marks a period of remarkable transition for children, their families, and their teachers” (Mann, McCartney, and Park 2007:273), adolescence and entry into middle school represent a similarly critical developmental shift for students and their families (Fuhrmann, Knoll, and Blakemore 2015), underscoring the potential impact of special education labeling that occurs during this time period.
Finally, by applying high-stigma labels to already marginalized students later their educational careers, special education eligibility may justify educators’ unsuccessful attempts to fill students’ metaphorical backpacks. Contrarily, low-stigma labels applied earlier on to students who struggle despite being perceived as arriving with a full backpack may be viewed as reflecting a “valid” disability that can be addressed with supports and parent advocacy. As specified in our conceptual framework, LCT contextualizes a student’s experiences within the scope of cumulative advantages and disadvantages that shape outcomes, with particular attention to sensitive periods that occur throughout the lifespan. Life events may have a greater impact on an individual depending on the developmental stage in which they occur, and the interaction between age and exposure is different depending on race and disability category. It may be that deficit perspectives attributed to disability operate differently than deficit perspectives attributed to race, but the intersection of the two appears most problematic in terms of cumulative disadvantage and is thus an important area for future research.
LIMITATIONS
First, this study was limited in that there were small numbers of observations in AI/AN, ID, and low-incidence categories, making obtaining valid estimates difficult; therefore, results related to those categories must be interpreted with caution. Second, this study used data for one school district, which limits the external validity of the findings. Although the purpose of the study was to examine one localized context, this means that we cannot be certain whether similar outcomes exist across school districts. We do, however, assert that the findings be used for comparative purposes with future studies examining other local configurations to better understand the nature of variability and the role of context within disproportionality research. This study was also limited in that we were restricted to the operationalized variables made available to us from the district’s data collection systems. For example, as Cooc (2019) indicated, the AAPI category represents a highly heterogeneous group, with students representing unique language, culture, and immigration backgrounds that we were unable to account for. The Latinx category is also a heterogeneous group with a high level of linguistic and cultural diversity (Mora 2014); future study should disaggregate by Latinx categories to examine differences in these subgroups.
A final limitation is that we examined label application and the ways in which the pathologizing of student differences may perpetuate marginalization and stereotyped perceptions. However, we did not directly measure perceptions or attitudes toward students. Rather, we substantiated our findings through previous research (e.g., Cooc 2018b; Fish 2019; Shifrer 2013) and through our theoretical framing.
FUTURE DIRECTIONS
Sociodemographic studies that examine disproportionality must employ theoretical frames that allow for a contextualized understanding of the systems that impact students’ educational trajectories and acknowledge the impact of systemic marginalization. Through a LCT framework, policy shifts can refocus resources and strategies to achieve a greater emphasis on early supports and access for marginalized students, incorporate earlier detection coupled with intervention, and promote protective factors as students shift from elementary to middle and secondary school settings before the need for labeling arises. We urge future research to examine the impact of shifting away from label-based, discrete services toward more inclusive and integrated student-centered support systems that focus on disrupting entrenched inequities. A critical part of this will include examining practitioners’ roles in this process and related levers for change, including the establishment of evidence-based capacity building that leads to equitable decision-making.
Finally, we suggest future research from a policy perspective. The IDEA (2004) mandates that states and local education agencies monitor and report on special education disproportionality (Zhang et al. 2014), and agencies that demonstrate significant disproportionality by race or ethnicity must use IDEA funds to provide coordinated early intervention services that address root causes (Crain et al., 2017). These funds are required to target students not currently identified for special education for whom the LEA has identified a need for additional supports. Though these regulations stipulate an emphasis on students in kindergarten through grade 3, children who are not yet in kindergarten are ineligible to receive programming from this funding source (IDEA 2004). If disproportionate underrepresentation is more prevalent in early childhood—when interventions have more impact—policy must shift to target equitable access to preschool services as well. In addition, given that disproportionality is also prevalent in later grades, policy must shift to achieve equity as students transition to secondary school. It is critical that understanding of social etiology in the timing of special education identification guides relevant policy, and we believe this research will assist educational leaders in understanding the nuances of inequities within their special education systems, the allocation of resources among and within schools, and programs that can ameliorate systemic inequities.
Footnotes
Supplemental Material
Supplemental material for this article is available online.