
Abstract
This article analyses whether the advertising investment of members of a collective brand depends on the market structure in which it operates and the moderating role of market growth in the collective brand. The central assumption is that the market concentration in a collective brand has a negative influence on the advertising investments made by its members until a concentration threshold is reached, after which its influence on advertising becomes positive. This is because, in a collective brand with either sufficiently low or high market concentration, firms tend to invest more in advertising, to capitalise on the gains in the marginal effectiveness of firm-level advertising generated by generic advertising, than they do in moderate market concentration situations. Finally, the market growth of the collective brand positively moderates the curvilinear relationship between market concentration and the advertising investment of its members. The results obtained support the proposed relationships.
Introduction
The effect of market concentration on advertising investment is a central concern in economics, management and marketing (Farris & Buzzell, 1979; Bagwell, 2007; Tremblay & Tremblay, 2012; Chandra & Weinberg, 2018). A change in an industry’s competitive structure can alter firms’ incentives to invest in advertising. Understanding this effect will provide valuable insights into how firms view advertising. Advertising theories make different proposals about what drives firms to advertise, positing that market concentration has a negative (Marshall, 1890; Becker & Murphy, 1993; Hou & Yao, 2022), positive (Dorfman & Steiner, 1954; Telser, 1964; Chandra & Weinberg, 2018), inverted U-shaped (Buxton et al., 1984; Chen & Lin, 2015; Gisser, 1991; Uri, 1998; Vlachvei & Oustapassidis, 1998; Sá, 2015; Samadzad & Hashemi, 2021) and lazy J-shaped (Lee, 2002; Willis & Rogers, 1998) effect on their advertising spend.
The negative effect is based on viewing advertising as a competitive tool (Marshall, 1890) and as complementary to the product (Becker & Murphy, 1993). The positive effect is based on its positive externalities on rivals (Telser, 1964) and market power (Dorfman & Steiner, 1954). And nonlinear relationships are based on two opposing effects mentioned above operating simultaneously. Despite the relevance of these theories, their applications in the collective brand market structure have been limited until now. Our research specifically addresses this overlooked aspect. We analyse whether the market concentration within a collective brand is an explanatory factor of the advertising investment of its members.
We focus on situations where the brand name of a company coexists with a collective brand whose quality is certified by an external institution. A collective brand is a sign that distinguishes, in the market, the goods and/or services produced by firms belonging to an association; the association guarantees the origin, nature and/or quality of the goods and/or services (see EU Directive 89/104/CEE). Firms cooperate through a collective brand to promote high-quality products (Marette, 2005). The aim in this study is to identify when collective brand members invest in advertising to promote their individual brands. We propose that a U-shaped nonlinear relationship exists between the market concentration within a collective brand and the advertising investment of its members. The specific hypothesis is that firms operating in moderately concentrated markets within a collective brand advertise less than those in either atomistically competitive or highly concentrated markets. According to Zheng, Bar and Kaiser (2010), this may occur because generic advertising carried out by the collective brand generates greater benefits for both the smallest and the largest producers, while potentially disadvantaging the rest of the industry. As a result, the smallest and largest firms within the collective brand invest more heavily in advertising to capitalise on the increased marginal effectiveness of firm-level advertising organised by the collective brand. Thus, we build on the theoretical framework of Crespi (2007) that member’s advertising may reflect a strategic attempt to leverage its marginal effectiveness generated by generic advertising of the collective brand.
Effective management of the market growth is also a critical aspect of advertising investment (Strickland & Weiss, 1976; Uri, 1988; Willis & Rogers, 1998). However, research (see Benavente, 2010) has only suggested that the collective brand market growth acts as a negative moderator in explaining the effect of market concentration on advertising investment. Alternatively, in this study we analyse whether the curvilinear effect of market concentration on firms’ advertising investment is positively moderated by the market growth of the collective brand. We argue that, under conditions of high market growth, when market concentration is either sufficiently low or sufficiently high, firms advertise more, to take advantage of the gains in the marginal effectiveness of the generic-based advertising organised by the collective brand, than they do in situations with moderate market concentration.
The objectives of this study are to examine the relationship between market concentration and the advertising investment of collective brand members and the moderating role of market growth in the collective brand. The empirical analysis was carried out in the Spanish winery industry, which is characterised by the existence of collective brands (i.e., Protected Designation of Origin labels – PDO) and by its variety of brand types (co-existence of individual and collective brands). PDOs in Spain signal superior quality, based on geographical (e.g., raw materials) and human factors (MMAMRM, 2009). These PDOs are used by their member companies under the control and authorisation of the titleholder (the Regulatory Council of each PDO): these certify that the products comply with certain common requisites, especially quality, geographical origin, technical conditions and/or method of production. The co-location of multiple producers within the same industry in a given geographical area can generate various externalities from which peer members may benefit (e.g., Boone et al., 2025), and may affect members’ strategic behaviour, particularly in advertising decisions.
Literature Review
Research in the economics, management and marketing fields suggests that industry concentration influences, with varying effects, firms’ advertising investment (Bagwell, 2007; Chandra & Weinberg, 2018; Farris & Buzzell, 1979). Traditional economic theory posits that industry concentration has a negative effect on advertising spend (Marshall, 1890), proposing that firms use advertising as a competitive strategy, on the basis that greater industry concentration reduces propensity to advertise. Similarly, marketing research has found that an increase in number of competitors in a market prompts firms to raise advertising expenditures, build brand equity and enhance product differentiation 1 (Boulding et al., 1994; Hou & Yao, 2022; Nils-Henrik & Stevik, 1998). Becker and Murphy (1993), taking another economic perspective, argued that market concentration has a negative effect on advertising investment if the advertising is complementary to the product and is perceived as good by consumers (i.e., advertising enhances the utility derived from the product itself 2 ; Norman et al., 2008, p. 719), then firms with market power tend to reduce their advertising, just as they reduce the supply of the product.
A positive effect is observed when a firm’s advertising generates positive externalities for rival firms (Telser, 1964), which happens when its advertising benefits another firm without the advertising firm being compensated (Tremblay & Tremblay, 2012). These positive externalities can be internalised by monopolists, which suggests that more concentrated markets may feature higher levels of advertising. A similar conclusion was drawn from Dorfman and Steiner’s (1954) theoretical model, who argued that goods with higher profit margins are more likely to be advertised. As higher margins are more likely to be achieved by firms with greater market power, this suggests that a positive relationship exists between industry concentration and advertising. In addition, in their theoretical framework, Willis and Rogers (1998) suggested that advertising can increase with market concentration, as higher concentration reduces the incentive for leading firms, offering differentiated products, to compete on price, thereby reinforcing their reliance on advertising.
An alternative, conventional 3 viewpoint suggests that the relationship between market concentration and advertising investment may be non-monotonic, as the two opposing effects described above could operate simultaneously (Chandra & Weinberg, 2018). Based on assumptions of oligopolistic mutual interdependence, and the appropriability of advertising returns, this perspective posits that an inverted U-shaped relationship exists, which suggests that moderately concentrated industries advertise more than do both highly concentrated and atomistically competitive industries (Lee, 2002). In low-concentration industries, it is difficult to internalise the benefits of advertising (Buxton et al., 1984), which leads firms to reduce their advertising. In contrast, an oligopolistic market structure is conducive to advertising, as more concentration allows larger firms to appropriate a greater share of the industry-wide returns from their advertising, thereby encouraging them to increase their advertising spend. However, in highly concentrated industries or monopolies, there is less incentive to competitively advertise. In fact, as concentration increases and the number of firms in the market decreases, advertising efforts may decline due to tacit inter-company collusion (Greer, 1971; Uri, 1988).
Extending the theory of advertising developed by Stigler and Becker (1977), Gisser (1991) proposed that an inverted U-shaped relationship will exist between market concentration and advertising spend as long as larger firms compete (i.e., they do not make an agreement to act jointly/collude). This occurs because large firms reduce their advertising efforts at high levels of concentration, provided the industry’s product demand curve is relatively inelastic. In contrast, if the industry demand curve is relatively elastic, advertising intensity increases monotonically as market concentration increases. Therefore, Gisser (1991) proposed that an inverted U-shaped nonlinear relationship exists in industries with relatively inelastic demand curves and a positive linear relationship in industries with highly elastic demand curves (Chen & Lin, 2015).
Another line of thought builds on the previous argument that the relationship between market concentration and advertising depends on the degree of advertising appropriability. It is posited that a negative, or inverted U-shaped, relationship exists in consumer goods industries, and a positive, or U-shaped, relationship in producer goods industries (Lee, 2002). Buxton et al. (1984) and Uri (1988) showed that an inverted U-shaped relationship exists in consumer goods industries, where a significant proportion of sales are made directly to final consumers, who tend to be more susceptible to the effects of brand image than are producer goods purchasers (Buxton et al., 1984). Conversely, a positive, or lazy J-shaped relationship, was observed in producer goods industries by Willis and Rogers (1998) and Lee (2002), suggesting that market concentration may enhance the relatively low appropriability of advertising in these industries, possibly based on increased economies of scale in advertising (Lee, 2002).
Finally, Norman et al. (2008) demonstrated, in their theoretical model, the existence of an inverted U-shaped relationship between market concentration and advertising investment in homogeneous goods markets, such as agricultural commodities. In homogeneous goods industries, advertising has a limited role in product differentiation, as the products are sufficiently similar that a firm’s advertising investment might increase demand for all component firms. A new mechanism operates in such contexts: free-riding on others’ advertising efforts. The explanation for the existence of this nonmonotonic relationship lies in the dual nature of advertising effects in homogeneous markets. On the one hand, the greater the number of firms advertising, the greater the incentive for others to free-ride. On the other, building on Becker and Murphy’s (1993) insights about the complementary nature of advertising, when a higher number of firms advertise, this increases the likelihood that at least one campaign will become popular and effective. At low levels of market concentration, the negative effect of free-riding dominates. At high levels of concentration, the positive effect of increased creativity diminishes. It is in the intermediate case – markets with moderate concentration – where incentives to invest in advertising are strongest.
While these theoretical models address interesting questions regarding the influence of market structure on a firm’s advertising investment, they do not analyse the role of collective brand market structure. The present study examines market structure within the context of a collective brand, focusing on the U-shaped nonlinear relationship between market structure and the advertising investment of members of the brand. We also analyse the moderating role of the market growth of the collective brand in this relationship. We propose that the competitive situation in a collective brand, that is, market concentration and market growth, influence firms’ advertising investment.
The Relationship Between the Market Concentration of the Collective Brand and the Advertising Investment of Its Members
Members of a collective brand share a collective reputation for quality. Langinier and Babcock (2008) described collective brands as non-rival, congestible (i.e., with many members) and excludable clubs (Benavente, 2010). Their approach is grounded in club goods theory (Buchanan, 1965), which conceptualises a collective brand as a club composed of individual firms that benefit from the shared reputation of the parent brand. However, Benavente (2010) argued that members of these clubs also engage in intra-collective brand competition. While they share the club’s reputation, they are, to some extent, partial rivals due to the phenomenon of congestion (or crowding) among club members.
The OECD maintains a sustained interest in collective brand-related competition issues (OECD, 2000, 2005) to ensure that practices that restrict intra-collective-brand competition do not develop (Benavente, 2010). For example, a Protected Designation of Origin (PDO) excludes sellers who do not produce within a restricted geographical area from operating. This makes this type of collective brand a tool for controlling supply and raises potential antitrust concerns (Marette, 2005). Although some antitrust-based court cases have examined non-competitive practices within collective brands, in most OECD countries there are explicit exemptions for the agricultural sector (Benavente, 2010). Thus, while some collective brand cases have proven and sanctioned uncompetitive behaviours, the prevalence of antitrust exceptions in agriculture is such that most instances of anticompetitive conduct never reach the courts. In any case, researchers have devoted little attention to these aspects, limiting our understanding of individual firms’ advertising behaviour stemming from intra-collective-brand competition.
In a different approach, our study focuses on the advertising investment of individual member firms within a collective brand, which is a U-shaped function of its market concentration; and it is built on the logic of Crespi (2007) that member’s advertising may reflect a strategic attempt to leverage its marginal effectiveness generated by generic advertising of the collective brand.
As collective brands engage in generic advertising (Benavente, 2010) to promote the products of their members, this work builds on prior studies that explored the relationship between generic advertising and a firm’s brand advertising. Generic advertising is common in agricultural product markets (e.g., dairy, pork, almonds; see Zheng, Bar and Kaiser, 2010), where producers cooperate to fund joint campaigns (Isariyawongse et al., 2007). Producers, to increase overall market demand, run campaigns that emphasise the universal qualities of their products. For homogeneous products, these campaigns mitigate the free-rider problem inherent in generic advertising and distribute benefits among producers. In addition, in markets where commodity checkoff programmes operate, it is increasingly common for large producers to use brand advertising to differentiate their products. This raises important questions about the interplay between generic and company advertising.
Isariyawongse et al. (2007) suggested that among the reasons why generic advertising may stimulate firm advertising spend were (1) to counteract the negative impact of generic advertising on product differentiation and (2) to exploit gains in the marginal effectiveness of firm advertising generated by generic advertising (Crespi, 2007). Furthermore, Isariyawongse et al. (2007) also demonstrated that generic advertising induces firms to increase their own advertising when the two advertising types complement each other – that is, when generic advertising raises the marginal returns of individual firm advertising. These findings confirm Crespi’s (2007) conjecture that generic advertising may encourage firms to increase their own advertising, even when this does not increase perceived product differentiation.
A main research line in the generic advertising literature (see Zheng, Bar and Kaiser, 2010) suggests that generic advertising can benefit both the smallest and largest producers but harm the rest of the industry. Essentially, generic advertising, funded via mandatory contributions from all collective members, affects demand, but also raises a firm’s marginal production cost. Thus, the impact of a generic advertising programme on an individual firm’s profits depends on the nature of the demand change it generates (i.e., whether demand becomes more or less elastic) and on the industry’s market concentration. In industries with low concentration, inelastic demand expansion (due to generic advertising) yields greater profits than in moderately concentrated industries. In this case of an inelastic demand shift, production expansion by large firms will exert a more significant downwards pressure on the industry price precisely because the industry demand becomes more inelastic. Therefore, only sufficiently small firms can profitably expand production, shifting output from above-average-sized firms to below-average-sized firms, thereby reducing market concentration. Conversely, in highly concentrated industries, elastic demand expansion generates higher profits than in moderately concentrated industries. An elastic demand shift exerts downwards pressure on the price-cost margin across the entire industry, shifting production from below-average-sized firms to above-average-sized firms, resulting in increased market concentration. Only sufficiently large, that is, sufficiently efficient, firms can profitably adjust to this downwards pressure (Zheng, Bar and Kaiser, 2010). Therefore, depending on market concentration, a generic advertising message that suggests the commodity is a niche or mass product can increase profits.
In industries with sufficiently low market concentration, generic advertising should make demand more inelastic, such that the commodity appears more like a niche product, thereby increasing profits. To achieve this, generic advertising may emphasise the uniqueness of the product (e.g., the ad ‘Milk’s Contribution to Weight Loss’; Zheng, Kinnucan, & Kaiser, 2010). Extending this idea to a collective brand with low market concentration (whose members share the club’s reputation, but remain partial rivals due to the crowding that arises among members), on the basis that smaller firms within the collective brand must pay for generic advertising, we assume that market concentration within the collective brand has a negative effect on firm advertising at low concentration levels. Since generic advertising leads to increased firm advertising when it enhances the marginal effectiveness of firm advertising (Isariyawongse et al., 2007), smaller firms in the collective brand will spend more to capitalise on these gains. This strategic motivation of collective brand members (namely, the desire to enhance the marginal effectiveness of their own advertising) within a low-concentration spectrum constitutes an important reason (beyond product differentiation) why brand-level advertising increases in response to generic advertising expenditures.
However, as the collective brand’s market concentration reaches higher levels, we assume that firm advertising intensity will increase. The generic advertising literature (Zheng, Bar and Kaiser, 2010) suggests that, in highly concentrated industries, generic advertising makes demand more elastic so that the commodity seems to be a mass product, thus increasing profits. To increase elasticity, generic advertising might stress the homogeneous attributes of the product, or emphasise its substitutability by other products (e.g., the ad ‘Eggs: The Perfect Protein’ may make demand more elastic because other foods are also good protein sources). Extending this to a collective brand with high market concentration (whose members share the club’s reputation, avoiding the phenomenon of crowding) – and noting that larger firms in collective brands are required to pay for generic advertising – we assume that market concentration within the collective brand will have a positive effect on firm advertising. Again, to the extent that generic advertising raises the marginal effectiveness of firm advertising (Isariyawongse et al., 2007), larger firms spend more to leverage these gains. In fact, extending the advertising theory developed by Stigler and Becker (1977), Gisser (1991) posited that a positive and linear relationship exists between market concentration and firm advertising for industries with very elastic demand curves (Chen & Lin, 2015). This strategic motivation of collective brand members (enhancing the marginal effectiveness of firm advertising) at a high concentration spectrum is another reason (apart from product differentiation) why brand advertising increases in response to generic advertising spending.
Therefore, we propose that a U-shaped curvilinear relationship exists between collective brand market concentration and firm advertising.
Hypothesis 1 (H1). A firm’s advertising investment will exhibit a U-shaped relationship with the market concentration of a collective brand.
Moderating Role of the Market Growth of the Collective Brand in the Curvilinear Relationship Between Market Concentration and the Advertising Investment of Its Members
The linear influence of market growth on advertising investment has been examined (Strickland & Weiss, 1976; Uri, 1988; Willis & Rogers, 1998). Basically, market growth is a consequence of market dynamism (Willis & Rogers, 1998). A growing market incentivises advertising because, first, the rate of new product introductions is higher, and thus, high initial advertising occurs; and, second, advertising is more effective when incremental sales are not achieved at the expense of competitors. Thus, market growth reflects a life cycle effect associated with the relatively high advertising levels required in the initial growth stage of the product life cycle (Uri, 1988).
Collective brand-focused research has theoretically proposed (see Benavente, 2010) that collective brand market growth has a negative moderating role in the relationship between market concentration and advertising investment, such that high market concentration, with low growth, is positively associated with the advertising investment of member firms, on the assumption that the brand’s reputation for quality is maintained. The underlying logic is that when a collective brand has reached market saturation, in a condition of high concentration, individual firms have an interest in differentiating themselves from other brand members by advertising their own products and maintaining a constant level of quality.
Alternatively, we suggest that collective brand market growth has a positive moderating role in the relationship between market concentration and advertising investment. We take as a starting point Zheng, Bar and Kaiser (2010), who found that the basic goal of generic advertising is to expand market demand. Nonetheless, while demand expansion is usually considered to be the primary objective of generic advertising, the nature of the change in demand can vary (e.g., demand may become more or less elastic), which has implications for firms’ profits, depending on industry market concentration.
We extend this idea by arguing that collective brand market growth has a positive moderating role in the market concentration/advertising investment relationship such that the market concentration of a collective brand influences the advertising investment of its member firms. On the basis that the smaller firms in a collective brand must engage in generic advertising, we assume that high market growth in a collective brand with low levels of concentration drives these smaller firms to advertise more than they would in a low-growth market. This is because smaller firms spend more to take advantage of gains in the marginal effectiveness of the advertising produced by generic advertising (i.e., for a collective brand with low concentration, generic advertising should not only expand demand, but also make demand more inelastic).
Similarly, given that larger firms in collective brands must also engage in mandatory generic advertising, we assume that high market growth in collective brands at high levels of concentration drives them to advertise more than they would in a low-growth market. This is because larger firms spend more to take advantage of gains in the marginal effectiveness of advertising produced by generic advertising (i.e., for a sufficiently concentrated collective brand, generic advertising should not only expand demand but also make demand more elastic).
Consequently, we propose the following hypothesis:
Hypothesis 2 (H2). The market growth of a collective brand positively moderates the curvilinear relationship between market concentration and member firms’ advertising investment.
Methodology and Sample
Methodology
In Dorfman and Steiner’s (1954) optimality condition, the advertising intensity of a profit-maximising firm is a function of its price–cost margins and the elasticity of demand of its advertising expenditure. Applying this condition suggests that beyond the relationship between advertising intensity and profitability, if other elements of market structure – such as market concentration and demand growth – affect advertising intensity, it is because they influence the elasticity of demand with respect to advertising.
In this study, linear mixed-effects regression models are used to test the hypothesised relationships. This approach is particularly well-suited to our dataset, as the observations are nested within higher-level units. Specifically, we observe
We began by estimating a model that includes only control variables selected via a genetic algorithm (e.g., Campayo & Nicolau, 2025; Scrucca, 2013). 4 This method is effective because it optimises model fit by excluding statistically irrelevant control variables, thereby enhancing the precision of the estimates. Initially, we randomly generated a population composed of multiple candidate models with different specifications. These models – also referred to as chromosomes – are represented by binary numerical sequences formed by as many elements (genes) as variables as can be included in the regression. A gene takes the value of 1 if the corresponding variable is included in the candidate model, and 0 otherwise.
To create successive populations, we used two genetic operators: crossover (with an 80% probability) and mutation (with a 10% probability). During crossover, new candidate models are generated by combining the genetic material of randomly paired models from an initial population. Mutation, on the other hand, introduces controlled stochastic variation by flipping the values of genes in a chromosome, thereby changing the inclusion or exclusion status of a control variable.
To select models fit to pass on their genetic material to the next generation, we employed a fitness function operationalised through the Akaike Information Criterion (AIC). Candidate models with lower AIC values are more likely to reproduce – analogous to natural selection in biological organisms. Moreover, to ensure we identified the model that optimally balances goodness-of-fit and parsimony, we adopted an elitist strategy in which the top 5% of models (as ranked by AIC) automatically advance to the next generation. This evolutionary cycle was systematically repeated over 300 generations. The final regression model selected – minimising AIC – can be expressed mathematically as follows:
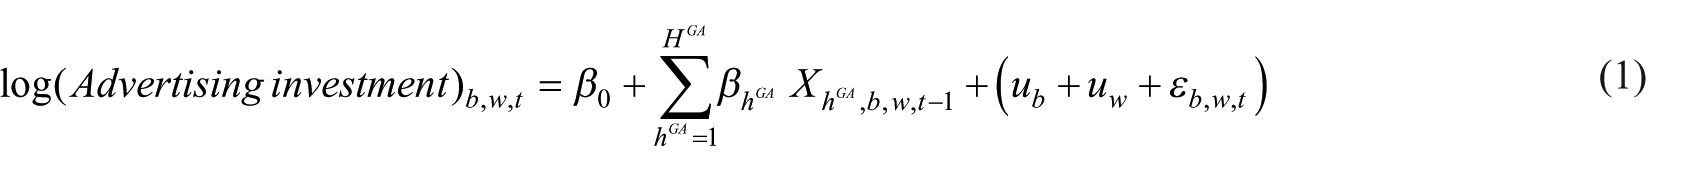
where
To test H1, we estimated the following regressions:


where
We employed the following equation to test H2:

This model allows us to assess the extent to which the market growth attributed to the collective brand moderates the non-linear relationship between HHI and the winery’s advertising investment.
Sample, Data and Variables
The empirical analysis was performed on a sample of firms operating in the Spanish winery industry. The information on the sample and the variables was obtained from several databases. For the sample selection, we used the population of companies registered in section 1102 of CNAE-2009, which is the equivalent of code 2084 of the US SIC classification (wines, brandy and brandy spirits), and is found in the Bureau Van Dijk database. We excluded wineries that mainly produce brandy and other distilled high alcohol products. The final sample used for the empirical application was comprised of 176 wineries operating continually from 2004 to 2014. This sample of firms accounts for more than 60% of the Spanish wine industry. In this industry, the collective brands for the wineries are the PDO labels.
The dependent variable of advertising investment was measured by the logarithm of the advertising spend (Abwt) of company w of collective brand b in period t, obtained from the database INFOADEX (Information for Advertising Expenditures database, which provides detailed information on advertising expenditures made in Spanish media -television, newspapers, magazines, etc.).
The main independent variables used in the study are the following:
i. Collective brand concentration index. This was proxied by the Herfindahl-Hirschman Index, that is, the sum of the squared market shares (Sw) of all wineries operating within the collective brand in period t − 1 (Chopo-Murillo et al., 2025; Domínguez et al., 2016).
ii. Collective brand market growth, a market characteristic that captures the dynamism of the market and is measured by the percentage growth rate in total sales of the collective brand from period t − 2 to period t − 1 (Bayus & Putsis, 1999).
The control variables used in the study, selected by the genetic algorithm, are the following:
i. Advertising investment of all producers that belong to the winery’s collective brand. This variable was measured by calculating the sum of the advertising investments of rival firms (Shapiro, 2018) within the same PDO.
ii. Winery profitability. Proxied by the return on assets ratio (Damodaran, 2002), which is calculated as the ratio of firm earnings before interest and taxes to total assets.
iii. Number of the winery’s products (references) appearing in the wine guide. This is a proxy of the winery’s relative product breadth.
iv. Market share of the winery. This variable is calculated by the percentage of a winery’s total wine sales compared to total wine sales in Spain.
v. The degree of competition within the PDO (Horstmann & Moorthy, 2003). This variable is measured by comparing the average number of direct competitors every winery has in its collective brand, taking into account the wines marketed by each winery, and their prices (Barroso & Giarratana, 2013; Mas-Ruiz et al., 2016; Roberts & Reagans, 2007), with the total number of wineries under the collective brand in each product category.
vi. Foreign market of the collective brand. This variable is measured by the percentage of PDO export sales.
vii. Age of the collective brand. Measured by the difference between the specific year under analysis, minus the year in which the PDO was created.
Eventually, we included year dummy variables to control for unmeasured confounders due to the time-varying effects of changes in the economy that might affect the wine industry (such as the 2008 global financial crisis).
Other control variables considered in the study, not selected by the genetic algorithm, were the following. At company level, we considered the age of the winery; the winery’s reputation (from a wine quality index produced by one of the best-known Spanish wine guides, which provides blind-tasting quality scores by experts); and profitability variables (return on sales and return on investment). At the collective brand level, we considered the size of the PDO (measured by the number of wineries within the collective brand, the area of vineyard cultivated and the volume of wine produced and sold by the PDO) and collective brand growth (measured by the annual growth in the volume of wine produced and sold by the PDO).
Table 1 presents the descriptive statistics and the correlation matrix of the variables that were selected by the genetic algorithm.
Descriptive Statistics and Correlation Matrix of the Variables Selected by the Genetic Algorithm.

Coefficients in bold are significant at the 95% confidence level.
Results
Main Results
Table 2 includes the estimates of four linear regressions with random intercepts, each corresponding to the four equations presented in the Methodology section. Model 1 includes only the control variables selected by the genetic algorithm. Model 2 adds the HHI and market growth variables. Model 3 tested the hypothesised quadratic relationship by including HHI2 as an additional regressor. Finally, Model 4 extended the set of regressors from Model 3 by incorporating two interaction terms to assess the moderating role of market growth: HHI × Market Growth and HHI2 × Market Growth.
Results of Three-Level Random–Intercept Models (Standard Errors in Parentheses and p-Values in Square Brackets).

Note: The dependent variable is the logarithm of the advertising investment. These four regressions are linear mixed-effects models. Clustered standard errors have been used which relax the independence assumption by allowing correlation between observations corresponding to the same collective brand.
The two main regressors – market growth and HHI – were mean-centred to avoid multicollinearity issues in the last two regression models shown in Table 2. The highest variance inflation factor (VIF) value was 4.8, with average VIF values of 1.26 in Model 1, 1.28 in Model 2, 1.66 in Model 3 and 2.12 in Model 4. These values are all well below the threshold of 10 commonly cited in the econometric literature, thus multicollinearity does not appear to pose a threat to the validity of the results (Hair et al., 2010).
With respect to model fit, likelihood ratio tests confirmed that all the estimated regressions significantly outperformed the null model (i.e., a model without covariates explaining advertising investment) at the 99% confidence level. The Nagelkerke and Cox and Snell pseudo-R-squared values exceeded 70% across all models, and McFadden’s rho was above 20% (Hensher & Johnson, 1981). Accordingly, we conclude that all the models exhibit substantial explanatory power. Finally, following Holcomb et al. (2010), we report the estimated random effects to capture the unobserved heterogeneity across wineries and collective brands, stemming from omitted variables.
We first focused on the quadratic relationship between intra-brand competition – measured via the Herfindahl-Hirschman Index – and advertising investment by wineries. In Model 3, it was seen that the HHI coefficient is negative and statistically significant at the 1% level (β = −3.448 [1.112], p-value = 0.002), while the squared term of HHI is positive and also significant at the 1% level (β = 3.025 [0.866], p-value = 0.000). These results suggest the presence of a U-shaped, nonlinear relationship (see Figure 1). Specifically, when market concentration within a collective brand is low, wineries are likely to reduce advertising expenditure as concentration increases. However, beyond a certain threshold of market concentration (estimated in our model at 0.57), 5 wineries tend to increase advertising investment as concentration continues to rise (the minimum logged advertising value is 8.82).

U-shaped quadratic relationship between market concentration (HHI) and wineries’ advertising investment.
This finding suggests that the negative effect of market concentration on advertising investment only reverses at very high levels of concentration. This pattern appears to support the idea that, in low-concentration markets (where market power is dispersed among many wineries belonging to the same collective brand) generic advertising strengthens the shared reputation and increases a more inelastic demand, thereby yielding greater returns than in moderately concentrated markets (Zheng, Bar and Kaiser, 2010). However, when concentration is sufficiently high (0.74 according to the data obtained in this study), elastic demand expansion derived from generic advertising generates higher profits than in moderately concentrated markets. Thus, it is at low and high levels of concentration that wineries are incentivized to expand their advertising efforts within the collective brand to capitalise on the increased marginal effectiveness of firm-level advertising organised by the collective brand. Hence, H1 is supported.
Second, we analysed the moderating effect of market growth on the nonlinear relationship between collective brand market concentration and wineries’ advertising investment. In Model 4, the HHI coefficient remains negative and significant (β = −3.436 [1.118], p-value = 0.002), and its squared term is positive and significant (β = 2.990 [0.896], p-value = 0.001), reaffirming the existence of a U-shaped relationship. In addition, the interaction term HHI × Market Growth is negative and significant (β = −5.017 [2.337], p-value = 0.032), while the three-way interaction term HHI² × Market Growth is positive and significant (β = 12.422 [4.442], p-value = 0.005). These findings suggest that both the shape and intensity of the U-shaped relationship are contingent on the market growth rate of the collective brand (see Figure 2).

Moderating effect of the market growth of the collective brand on the U-shaped quadratic relationship between market concentration (HHI) and wineries’ advertising investment.
In low-growth environments, increasing market concentration initially leads to a decline in advertising investment, followed by a rebound beyond a certain HHI threshold. However, as market growth intensifies, this threshold shifts and the curve becomes steeper, indicating that wineries in fast-growing collective brands are more sensitive to changes in market concentration when allocating advertising resources. These results provide empirical support for H2, highlighting the pivotal role of market dynamics in shaping the strategic advertising behaviour of wineries.
Regarding the control variables, we found that an increase in advertising investment by some wineries within the same collective brand leads the other member wineries to increase their advertising investment. This finding suggests that wineries, to maintain their market positioning and consumer attention, respond strategically to the promotional efforts of competitors. Within the collective brand framework – where reputation is partially shared but differentiation remains essential – wineries face both opportunities and threats: opportunities because affiliation with a collective brand may indirectly boost demand for wines bearing its certifications, and threats because failing to highlight their uniqueness (e.g., via individual advertising) risks allowing competitors to capture the demand generated by the collective brand association – especially when those rivals invest more heavily in advertising.
This finding underscores the complexity of coopetition dynamics in the wine market, where wineries not only collaborate by using the same certification but also compete with one another to ultimately satisfy the preferences of consumers who choose wines marketed under the umbrella of collective brands.
Moreover, we also observed that the greater longevity of collective brands encourages their member wineries to increase their advertising investment. The more established these certifications are within experience goods markets, the more likely they are to enjoy higher levels of recognition and legitimacy among a broad spectrum of consumers. In this context, wineries are likely to be incentivised to allocate resources to advertising to capitalise – at least partially – on the latent demand induced by the reputation of the collective.
Robustness Checks
Although all regressors included in the models presented in Table 2 are lagged by one period, and unobserved heterogeneity is accounted for, it may be that our key theoretical variables of interest (i.e., HHI and market growth) are endogenous due to the presence of unmeasured covariates (Wooldridge, 2010). Specifically, endogeneity may arise from potential correlation between these regressors and the error term, leading to biased and unreliable results. In mixed-effects regression models, endogeneity can occur at multiple levels (e.g., Hanchane & Mostafa, 2012; Kim & Frees, 2007). In the context of this study, level-1 endogeneity would occur when the regressors are correlated with the level-1 error term (
First, following the recommendations of Semadeni et al. (2014), we assessed the robustness of our estimates by evaluating whether HHI and market growth suffered from endogeneity. In the analysis, we employed three instrumental variables: the total production volume of the collective brand, the age of the winery and the land area of the geographical region within which wines must be produced to be eligible for these certifications. We selected these instruments because they were not identified as important predictors of advertising investment by the genetic algorithm (and, thus, were not included in the models estimated in Table 2), and because they appear to be exogenous – that is, they are not directly influenced by decisions made by wineries using PDOs, nor by the regulatory councils/oversight bodies governing these collective brands.
From a theoretical standpoint, the literature has long emphasised the importance of selecting instruments that capture factors that do not subject to firms’ individual control (Shaver, 1998). In the context of collective brands, the three variables used in this study reasonably meet this criterion. For instance, the total production volume of the collective brand is largely determined by the regulatory specifications imposed by the PDO councils, as well as by other exogenous factors such as climatic conditions. From this perspective, it is difficult to conceive that this instrument could depend on a single firm’s strategic decisions. A similar logic applies to the age of the winery (which reflects accumulated organisational experience and maturity) since the founding date is a historical event that cannot be influenced by any subsequent strategic choice made by the firm. Finally, the geographical area of the PDO, which delineates the territorial boundaries for wine production under these certifications, can also be considered reasonably exogenous, as it is heavily constrained by national and supranational regulations.
That said, and beyond these theoretical justifications, we also employed several econometric tests to validate the relevance and exogeneity of the selected instruments for detecting (and addressing) potential endogeneity. First, the Kleibergen-Paap rk LM statistic rejects the null hypothesis of underidentification (χ²(2) = 20.637, p-value = 0.000). Second, the Hansen-J statistic (used to test for overidentification of instruments) fails to reject the null hypothesis that the three instruments are exogenous (i.e., uncorrelated with the error term) (χ²(1) = 1.018, p-value = 0.313). Third, the Kleibergen-Paap rk Wald F-statistic of 53.769 far exceeds the Stock-Yogo weak instrument critical value for a 10% maximal IV size (13.43), indicating that the instruments are sufficiently strong.
Given that the instrumental variables satisfied both the relevance and exogeneity conditions, we computed the Sargan-Hansen difference test – comparing a specification where HHI and market growth are treated as endogenous against one where they are treated as exogenous. We use the Sargan-Hansen test rather than the Hausman test because it is more robust to heteroskedasticity when assessing level-1 endogeneity (Hoetker & Mellewigt, 2009). The results showed that we cannot reject the null hypothesis that HHI and market growth are exogenous regressors in the model (χ²(2) = 2.216, p-value = 0.330). Therefore, we concluded that level-1 endogeneity – arising from potential omitted covariates correlated with the regressors of interest – does not appear to compromise the validity of our findings.
Second, to evaluate the possible presence of omitted variable bias at levels 2 and 3, we conducted two Hausman (1978) tests, comparing the random-effects models (specifically Models 3 and 4 in Table 2) with fixed-effects (FE) regressions that account for potential level-2 and level-3 endogeneity (Hanchane & Mostafa, 2012; Kim & Frees, 2007). 6 The null hypothesis in both tests is that the winery- and brand-level random effects are uncorrelated with the independent variables in the model. The Hausman test results for Model 3 in Table 2 (χ²(12) = 20.926; p = .0515) and Model 4 (χ²(14) = 21.057; p = .1002) are not statistically significant at the 5% level, suggesting that level-2 and level-3 endogeneity do not pose a threat to the results. Moreover, the results from the fixed-effects regressions (see Table 3) are highly consistent with those obtained in Models 3 and 4 of Table 2.
Results of Fixed-Effects Regression Models (Standard Errors in Parentheses and p-Values in Brackets).

Note: The dependent variable is the logarithm of the winery’s advertising investment. These two regressions are fixed-effect models that can cope with level 2 and level 3 endogeneity.
These tests allow us to compare fixed-effect models that are efficient under the assumption of omitted covariates with random-effect models that are not efficient under the assumption of omitted covariates. Therefore, they allow us to assess the extent to which level 2 (wineries) and level 3 (collective brands) endogeneity represents a real problem in the study.
Consequently, we consider our findings to be robust.
Finally, we standardised the main variables (HHI and Market growth) and re-estimated Models 3 and 4 from Table 2 so that the relative magnitudes of the coefficients can be interpreted on a common scale, allowing for a clearer assessment of their comparative influence on advertising investment and the moderating effect of Market growth. The standardised results (see Table 4) confirm that the substantive conclusions remain unchanged: the curvilinear effect of HHI and its interaction with market growth continue to be statistically significant and consistent with the theoretical expectations outlined in this study. This further reinforces the robustness of our findings.
Results of Three–Level Random–Intercept Models With Standardised Independent Variables (Standard Errors in Parentheses and p-Values in Square Brackets).

Note: The dependent variable is the logarithm of the advertising investment. These regressions are linear mixed-effects models. Clustered standard errors have been used which relax the independence assumption by allowing correlation between observations corresponding to the same collective brand. The variables HHI and Market growth have been standardised to ensure that the effect sizes are comparable.
Conclusions
Discussion and Theoretical Contributions
The effects of market concentration on advertising investment have a long research tradition in academia, where different perspectives have been taken (Bagwell, 2007; Chandra & Weinberg, 2018; Farris & Buzzell, 1979; Tremblay & Tremblay, 2012). The present study aims to contribute to this area by empirically examining the relationship between the market concentration the firm faces in its own PDO and its advertising investment, and whether this relationship depends on the market growth of the collective brand. Although caution should be exercised when analysing firms’ behaviours based solely on research into a single industry, this study helps to explain these relationships through the following key findings.
First, within the context of market concentration in a collective brand, it was found that member firms tend to reduce their advertising spending when the collective brand has a low level of market concentration but increase their efforts as market concentration rises. According to Zheng, Bar and Kaiser (2010), this behaviour is exhibited because generic advertising carried out by the PDO/collective brand may provide greater benefits to both the smallest and the largest producers, while potentially harming the rest of the industry. Therefore, in a collective brand with sufficiently low or sufficiently high market concentration, firms increase their advertising efforts to take advantage of the gains in the marginal effectiveness of advertising generated by generic advertising – compared to firms operating in a moderately concentrated market. While previous studies have analysed both the linear and nonlinear theoretical relationships between market concentration and firms’ advertising investment (see Marshall, 1890; Norman et al., 2008), we did not identify any research that specifically examines the influence of collective brand market concentration on advertising investment. Our results, obtained in the context of the wine market, may be potentially generalizable to other industries that operate product-promotion programmes through collective brands (e.g., almonds, mushrooms, plums and beef or pork) where some producers increase their brand-level advertising in response to generic advertising expenditures (Isariyawongse et al., 2007). The underlying rationale is that brand advertisers have an incentive to invest more to capitalise on the improvement in the marginal effectiveness of brand advertising generated by generic advertising (Crespi, 2007).
At an empirical level, our results are consistent with Willis and Rogers (1998) and Lee (2002), who showed that a lazy J-shaped relationship existed between market concentration and advertising investment in producer goods industries. Moreover, these results are theoretically supported, as market concentration may enhance advertising efficiency – possibly by increased economies of scale in advertising, and offsets the relatively low appropriability of advertising in producer goods industries (Lee, 2002).
Some studies have made findings that differ from ours: Buxton et al. (1984), Gisser (1991), Vlachvei and Oustapassidis (1998), Uri (1988), Chen and Lin (2015), Sá (2015) and Samadzad and Hashemi (2021), demonstrated the existence of an inverted U-shaped relationship between market concentration and advertising investment. This result is supported by the mechanisms of oligopolistic mutual interdependence and appropriability of advertising (see Lee, 2002), as well as by mechanisms of free-riding and the complementariness of advertising (see Norman et al., 2008), described in the theory section. In any case, this result, and its underlying reasoning, is inconsistent with our study of the wine market, which showed the existence of a U-shaped market concentration-advertising relationship. This difference arises because wineries operate in markets with different levels of competition involving all firms that carry out generic advertising under a collective brand.
Second, in the present study, it was found that the market growth of a collective brand can positively moderate the relationship between collective brand market concentration and firm advertising. While previous research has analysed the linear relationship between market growth and firm advertising investment (see Uri, 1988; Willis & Rogers, 1998), we did not identify any studies that examined the moderating role of the market growth of a collective brand in the relationship between the market concentration of a collective brand and companies’ advertising investments. At an empirical level, our results are consistent with those of Willis and Rogers (1998), who showed that a positive and linear relationship existed between market growth and advertising investment in the food and tobacco processing industries. However, their study differed from ours in that it analyses producer goods industries, where the appropriability of advertising is relatively low (Lee, 2002). In addition, our work differs in that it examines the role of a collective brand, in which a relationship between generic advertising and the brand advertising of its members may exist.
Finally, the contributions of the present study. First, it advances research on the nonlinear relationship between market concentration and advertising investment (see Buxton et al., 1984; Chen & Lin, 2015; Gisser, 1991; Sá, 2015; Samadzad & Hashemi, 2021; Uri, 1998; Vlachvei & Oustapassidis, 1998). We illustrate the value of incorporating the analysis of curvilinear relationships in enhancing the understanding of firms operating under a collective brand, where quality is certified by the collective brand. Although collective brands are made up of individual companies that share the parent brand’s reputation, and engage in intra-collective competition (Benavente, 2010; Cornes & Sandler, 1996), the impact of the concentration of the collective brand on advertising has not been previously explored. Our findings revealed that the market concentration of a collective brand has a U-shaped relationship with advertising investment, and that this relationship depends on the market growth of the collective brand.
Second, this study also contributes to previous theoretical research, which identifies the following mechanisms that explain the effect of market concentration on advertising investment: advertising as a competitive tool (Marshall, 1890) and as complementary to the product (Becker & Murphy, 1993); positive externalities on rivals (Telser, 1964) and market power (Dorfman & Steiner, 1954). While these are important insights, our study advances the field by examining the theoretical implications of using collective brands, specifically through the U-shaped relationship between advertising investment of member of a collective brand and its market concentration in different scenarios of market growth. Our mechanism is supported on the logic of Crespi (2007) that member’s advertising may reflect a strategic attempt to leverage the marginal effectiveness generated by generic advertising of the collective brand.
Managerial Contributions
This study has the following important implications for regulators and managers in the wine industry, in terms of market competitive structure within a collective brand and the advertising investment of its members. First, collective brand managers (the regulatory councils of PDOs) should enhance their efficiency when monitoring the advertising investment of their member companies. Specifically, they should allocate more resources to monitoring advertising investments in markets characterised by both low and high levels of competition, to determine whether members’ objective is to capitalise on the marginal effectiveness of generic advertising. This recommendation follows from our findings regarding the U-shaped relationship between market competition and advertising investment within collective brands. By strengthening oversight of member firms in these competitive environments, PDOs can better assess whether these members are, in fact, responding to generic advertising spending by increasing their own brand-level advertising for this strategic reason. 7
Second, company managers should consider the results of the present study when making decisions about their advertising spending. Our finding that a U-shaped relationship exists between market concentration and the advertising investment of members of a collective brand introduces a nuanced perspective that contrasts with traditional views. Typically, traditional economic theories, such as that of Marshall (1890), suggest that when competition decreases due to increased market concentration, companies may have less incentive to increase advertising investment. However, the present study indicates the opposite. It shows that, as competition within a brand decreases, a firm may increase advertising investment if the concentration of firms in the market exceeds an inflection point. Thus, managers in the Spanish wine industry should base their advertising spend decisions on the level of market concentration of their collective brands.
Third, the findings of this study have significant implications for public regulators responsible for monitoring and curbing antitrust practices. Antitrust policies aim to foster effective competition among firms, which, according to Marshall (1890), Becker and Murphy (1993) and Hou and Yao (2022), can lead to increased advertising investment. However, economists also emphasise that the causality between market concentration and advertising might run both ways, with advertising also influencing concentration (Bagwell, 2007). Thus, to the extent that there are economies of scale in advertising, and large firms are better able to finance large advertising expenditures (Kaldor, 1950), greater spending will promote greater concentration and lead to an oligopolistic structure.
In addition, the results of the present study indicate that changes in the competitive landscape of a collective brand can both diminish and increase the advertising spend of its members. In collective brands with a high level of market concentration (on the increasing monotonic side of the curve), increased competition might lead to reduced firm advertising investment (because advantage is not taken of the gains in marginal effectiveness of firms’ advertising produced by generic advertising) until the market concentration of the collective brand reaches the inflection point. In addition, this lower advertising investment will, in turn, lead to lower market concentration and greater competition. Therefore, in the context of the Spanish wine industry, understanding the tipping points of market concentration will be crucial when applying effective antitrust policies.
Limitations and Future Research Directions
While the present study contributes to the understanding of the effect of market concentration on the advertising investment of members of a collective brand, it has limitations that restrict the generalisation of its results and provide avenues for future research. First, this study is based on aggregated information at the company level (advertising investment), but it does not consider advertising investment at the individual product level.
Second, the database is made up of a sample of only high-quality products (i.e., the best Spanish wines). This restriction limits the extent to which the results can be generalised to other groups of (low quality) products. Testing the relationships with other, lower quality groups might offer managers interesting insights. Third, lack of information about collective brands’ generic advertising investment hinders the analysis of its effects on the advertising investment of their members. Fourth, the area of study is the Spanish wine industry, and the effects should be analysed in other industries to generalise the results. Fifth, this work examined the period 2002–2013, which was characterised by deregulatory reforms and an economic crisis that fostered a more competitive environment. Replicating the model with more current data would be interesting.
Footnotes
Funding
The authors received no financial support for the research, authorship, and/or publication of this article.
Declaration of conflicting interests
The authors declared no potential conflicts of interest with respect to the research, authorship, and/or publication of this article.