



Abstract

Past attempts to identify best practices in health number communication have faced significant challenges. First, the volume of literature to be considered has grown enormously, so much so that the 2021 International Patient Decision Aids Standards (IPDAS) Collaboration evidence review on methods of presenting probabilities limited itself to a narrative review of selected topics, and even then was split into 2 papers. Furthermore, the enormous variability in tested communication methods raises questions about comparability of interventions. Different research teams also measure a wide range of outcomes, further complicating the picture.
The Making Numbers Meaningful (MNM) project (R01 LM012964) addressed these challenges by doing 3 things: 1) We established a conceptual framework and set of taxonomies that could enable “apples to apples” comparisons. 2) Using this framework, we performed an all-inclusive systematic review of the research on the communication of health-related numbers. Our review included studies that compared 2 or more data presentation formats that presented the same health-related quantitative information to patients or lay person audiences and measured 1 or more relevant quantitative outcomes. We excluded studies that did not directly compare data presentation formats, purely qualitative research, and studies of non–health-related information or professional audiences. 3) Ultimately, we sought to develop practical guidance for communication professionals that reflects what different number communication approaches can, and cannot, do well.
One of our greatest innovations was our commitment to conducting the review in a matrix fashion, categorizing research findings along several orthogonal dimensions simultaneously. For each study, we recorded the data presentation
Consider, for example, a study (Figure 1) that conducted 3 pairwise comparisons: a) percentages versus icon arrays, b) icon arrays versus bar charts, and c) percentages versus bar charts, to present risks of several treatments, capturing the outcomes of 1) recall of numbers, 2) ability to identify the treatment with the highest probability of benefit (what we call a contrast outcome), and 3) treatment choice (a behavioral intention outcome). Rather than generating a single record about this study’s results, the MNM review process generates 9 distinct findings representing all combinations of format comparison and outcome.

In the Making Numbers Meaningful approach, 1 research study that compared effects of percentages versus icon arrays versus bar charts on 3 different patient outcomes would produce 9 unique findings. More complex studies might produce even more.
This careful indexing allowed us to address multiple research questions with a single body of literature. For example, we can provide targeted evidence to answer questions of the form, “When readers perform cognitive task A upon a number of type B, what is the effect of data presentation format C upon outcome D?” Applying this approach, we can show that when readers seek information about the chance of an event (cognitive task: point) by examining a frequency (data type: probability), the form of “1 in 100” (data presentation format: 1 in X) tends to lead to inflated perceptions of the probability (outcome: probability perceptions) compared with the form of “1%” (data presentation format: percentage). The same 1 in X format also makes it difficult to compare 2 probabilities to find the larger one (outcome: contrast).
Mirroring our 3 broad objectives, the MNM project has generated 3 types of articles.
Methodological articles: In 2022, we published a standalone article describing the analytical framework and taxonomies that have guided our systematic review. 1 We now present in MDM Policy & Practice a scope, methods, and overview findings article regarding our review of probability communications research that describes virtually all methods information and provides an overview of how many findings of each type have been identified. 2 In addition, we are working on a novel set of Numerical Understanding Measurement reporting guidelines, recommendations about transparent research reporting derived from our experience trying to extract information from this literature.
Evidence summary papers: We organized the systematic review articles based on our taxonomies. Results are separated first by data type (probabilities v. quantities), then by task type, then within each task by outcome. Within each outcome, evidence is summarized by presentation format comparison. For probability communications, this led to 6 evidence summary articles published today in MDM Policy & Practice: 2 for point tasks,3,4 2 for difference tasks,5,6 and 1 article each for synthesis tasks 7 and time-trend tasks. 8 In development are an article on Bayesian synthesis tasks and additional articles on quantities data (such as lab test results and patient-reported outcomes). All evidence summary articles use the same section and subsection labeling structure (Table 1) to facilitate comparisons across articles.
Section/subsection Headings Used Consistently across All Making Numbers Meaningful Evidence Review Articles
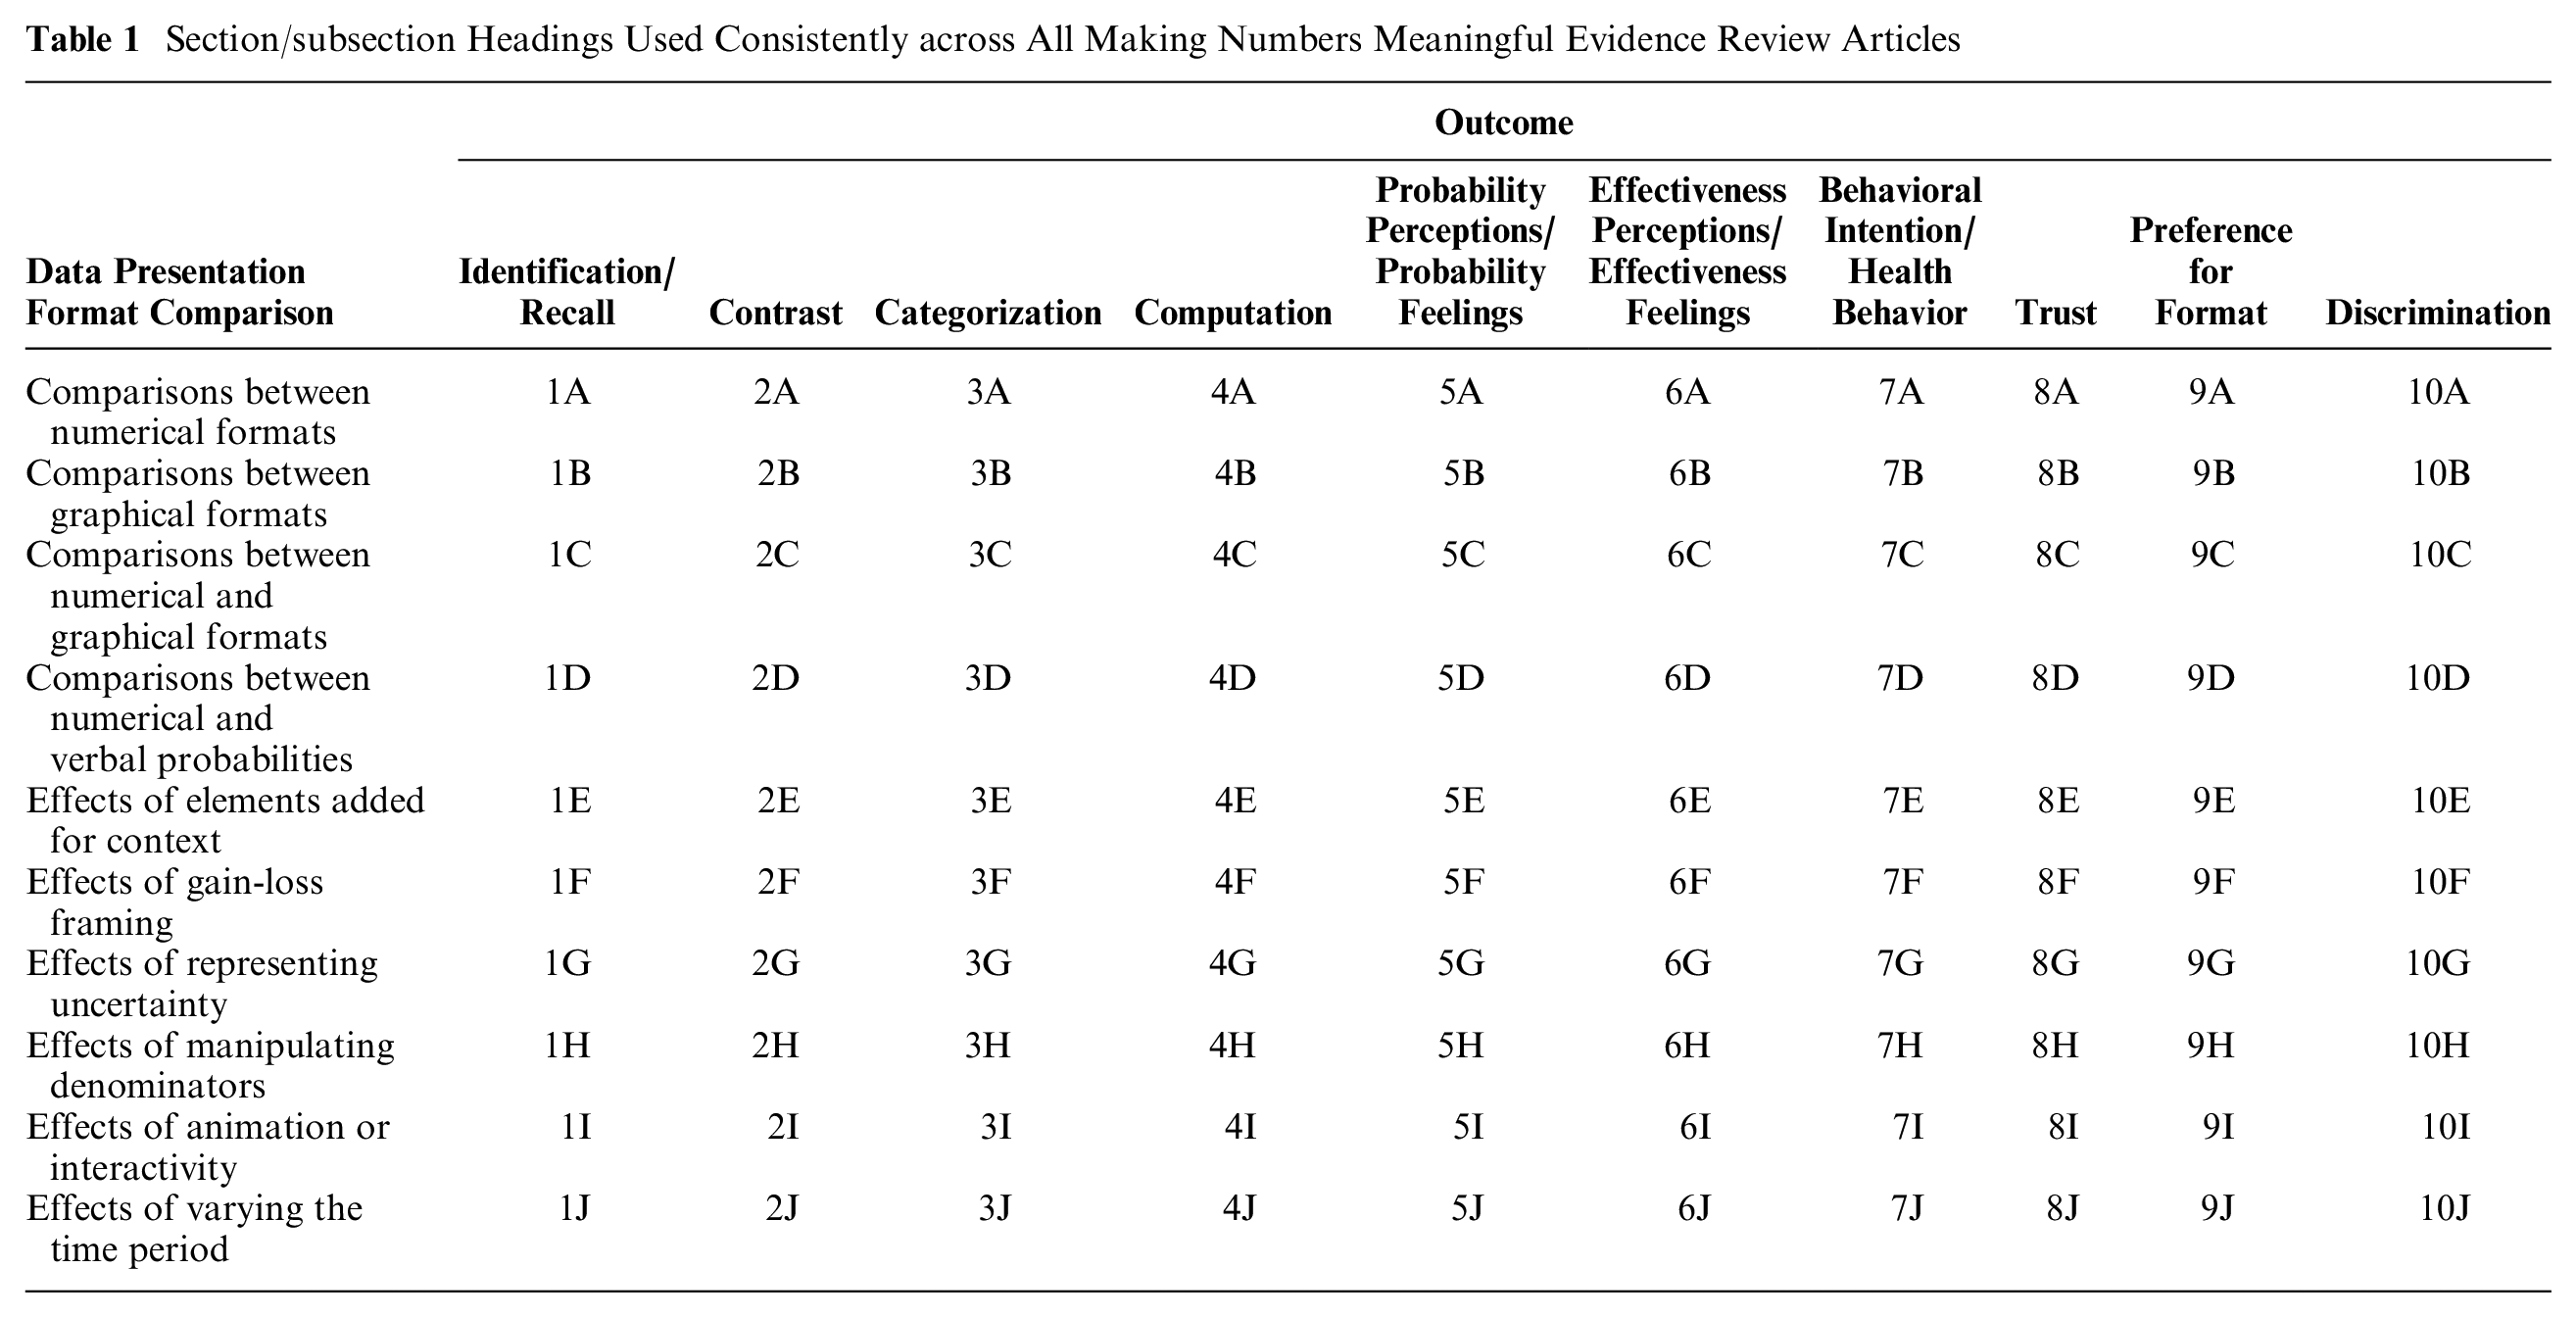
It is important to note that the evidence summary articles are just that: evidence summaries. They are encyclopedic in structure, using precise (but sometimes nonintuitive) language to describe each research finding. The articles include only very abbreviated introductions, methods, and discussions but detailed results sections that highlight which research questions have generated strong or moderate evidence strength, including evidence that particular format comparisons do not affect particular outcomes. However, they do not attempt to integrate findings across tasks, outcomes, or format comparison types or provide specific recommendations for practice.
Integrative guidance articles: Perhaps the most fundamental takeaway of the MNM project is that no communication format is best at achieving all outcomes or superior across all tasks. For example, illustrating the impact of a risk factor with the relative difference has a larger impact on effectiveness perceptions and behavioral intentions than with pairs of before-and-after probabilities of the event, 6 yet accuracy in basic computations around risks is better with absolute probabilities than with the relative difference. 5 Guidance for practitioners must therefore depend on which outcome the practitioner hopes to facilitate. Furthermore, evidence for different formats sometimes differs by task (i.e., whether it involves focusing on single probabilities, differences in probabilities, or other tasks). For example, there is moderately strong evidence that people prefer bar charts to icon arrays for illustrating probability differences 6 but no similar consistency of evidence about whether people prefer bar charts for illustrating single probabilities. 4 As a result, practitioners may need to simultaneously consider how a particular format affects point tasks and difference tasks and synthesis tasks, each across multiple outcomes. In other words, no single one of our evidence summary articles provides sufficient information to justify a global best practice recommendation.
As an opening foray into synthesizing the MNM evidence findings into practical guidance, we are comparing each of the 35 recommendations made by the two 2021 IPDAS presenting probabilities articles and summarize the related evidence (and its strength) from the MNM systematic review. As might be expected, the evidence strength varies. While some IPDAS recommendations appear well supported by strong evidence across multiple tasks and outcomes, the evidence related to other recommendations is mixed, weaker, or absent.
Our MNM versus IPDAS comparison analysis is one example of the type of broader discussion, comparison, and interpretation of the MNM findings that is possible using the MNM review data. We have also published a shorter commentary providing an integrative summary of the evidence related to interactive or animated probability graphics. 9 Yet, many more research questions remain unanswered about how to make numbers most meaningful to people in the context of medical decision making. We encourage other author groups to pursue such integrative reviews of the MNM evidence base using the fully published abstracted data from this work (see “Probability Findings” on our OSF site: https://osf.io/rvxf2/).
As massive as an undertaking as this was, the MNM project is only the beginning of what is needed to support effective communication of health numbers in patient decision aids, risk calculators, news articles, and other contexts. Like all one-time reviews, its evidence base will become out of date as new research is continually generated. This work reflects our decades of experience in this field but also our own biases; new perspectives are needed. Furthermore, broader adoption of methodological transparency and the granularity of our framework in future research will enable our field to resolve inconsistencies and pursue more nuanced analyses.
Ultimately, the most important thing we have learned from this effort is a deep respect for the complexity of the task. There is no “best” method of communicating probabilities, only methods that are better at achieving certain outcomes but poorer at others. 10 This means that we cannot simply look at what data someone has and say “do this” or even look at a given communication and give a blanket evaluation of it as good or bad. Instead, we must partner with communicators to understand their communication goals, guide them to the evidence base related to those objectives, and help them understand the implications of choosing different communications formats. While undoubtedly incomplete, these articles provide a strong foundation for such conversations.
Footnotes
Acknowledgements
We thank our coauthors on the MNM evidence articles (Natalie Benda, Mohit Sharma, Stephen B. Johnson, Michelle Demetres, Diana Delgado) as well as the Numeracy Expert Panel for contributions to conceptualizing the MNM project (Cynthia Baur, Sara Cjaza, Angela Fagerlin, Carolyn Petersen, Rima Rudd, Michael Wolf, and Steven Woloshin).
The authors declared no potential conflicts of interest with respect to the research, authorship, and/or publication of this article. The authors disclosed receipt of the following financial support for the research, authorship, and/or publication of this article: Financial support for this work was provided entirely by a grant from the National Library of Medicine (R01 LM012964, Ancker PI). The funding agreement ensured the authors’ independence in designing the study, interpreting the data, writing, and publishing the reports.
Ethical Considerations
Not applicable.
Consent to Participate
Not applicable.
Consent for Publication
Not applicable.

Data Availability
Not applicable.