



Abstract
Abstract
The aim of this study is to determine the most significant factors that lead to continuous rise in the foreign direct investment (FDI) inflows in the five most emerging economies of the world, that is, Brazil, Russia, India, China, and South Africa (BRICS). The present study employs panel data regression analysis to find out the most significant determinants affecting the FDI inflows in BRICS countries as a whole. Under this technique, all the three regression models, that is, common constant (ordinary least square [OLS]), fixed effects, and random effects are tested to explore the determinants of FDI in BRICS countries over a period of 31 years, that is, 1983–2013 (except for Russia whose data is available from 1995–2013 for the selected variables in the study). The empirical results of the modified random effects model reveal that industrial production index (IPI), inflation rates, unemployment rates, trade openness and real effective exchange rate (REER) are significant at 1 percent significance level whereas labor cost is statistically significant at 10 percent significance level which means that these are the most significant determinants in attracting FDI inflows in BRICS countries. This study is significant because there are various researchers who have contributed to the literature of determinants of FDI but there is hardly any study which documents the factors attracting FDI inflows in BRICS countries covering a long period of more than three decades.
Keywords
Introduction
One of the noticeable tendencies in the world economy over the past three decades has been its increasing global economic integration. The world economy has seen an increasing internationalization with rising volumes of international trade and increasing levels of foreign investment flows, particularly that of the direct investment. However, the impact of globalization has been uneven across sectors, regions and countries. Some countries and regions have been able to get more integrated with the world economy with growing magnitudes of inward FDI flows and other types of cross-border transactions, while others have been left relatively untouched. The BRICS countries are a notable example of such world-wide economic shift that is evolving today.
The era of globalization has brought about drastic changes in the outlook of the leading manufacturers and producers around the world to explore investment opportunities in these fastest developing countries of the world, that is, BRICS countries. Because of the competitive advantage that these foreign investors get by investing in these BRICS countries their domestic counterparts are facing a huge economic exposure. Thus, this study will help such companies to understand and evaluate the factors that are motivating their local counterparts to become multinational and how they can also gain by investing in these emerging markets.
Second, many researchers and policy makers have opined that FDI is an important source of investment, capital formation, and growth for emerging markets. They assert that this becomes a reason for rising competition for such emerging market economies to attract more FDI flows. Thus, this study will enable the policy makers across the world to understand the major factors acting behind the rising FDI flows in these five countries and also motivate other least developed countries (LDCs) to move up from the category of LDC to emerging market economies like BRICS.
Third, this study has policy implications for the policy makers of other emerging market economies because by comparing the performance of their country with BRICS they will be able to learn about the areas in which they are lagging behind. Furthermore, by benchmarking emerging market economies against one another over the last three decades, the nations that have consistently performed well and the factors that contribute to their success can be identified.
This study is also significant because there are various researchers who have contributed to the literature of determinants of FDI but there is hardly any study which documents the factors attracting FDI inflows in BRICS countries. The objective of this study is thus to determine the most important economic determinants attracting FDI inflows in the context of BRICS countries as a whole for a long time period of 31 years.
An Overview of FDI Inflows in BRICS Countries
Over the last two decades, BRICS economies have become the most emerging economies of the world because of a continuously increasing share in world GDP and world trade, trade openness, foreign exchange reserves, and FDI inflows and outflows. Jim O’ Neill (2001) at Goldman Sachs coined the idea of the BRICS in his notable paper, “Building better global economic BRICS” when major structural changes were already taking place in the BRIC countries. Brazil had put in place a radical economic stabilization plan to turn around hyperinflation and boost privatization in the late 1980s, while India had introduced extensive economic reforms in the early 1990s. On the other hand, China had emerged unharmed from the Asian economic crisis of the late 1990s and Russia had started putting in place a strategy to rebuild its lost economic status.
Persistent economic activities coupled with a growth-oriented strategy in BRICS countries, since the 1990s, have resulted in significant infrastructural and other favorable changes. These changes have transformed BRICS countries into attractive destinations for FDI. The BRICS members are all developing or newly industrialized countries but they are distinguished by their large, fast-growing economies and significant influence on regional and global affairs; all five are G20 members. As of 2013, the five BRICS nations represent almost 3 billion people with a combined nominal GDP level of US$ 16.039 trillion and US$ 4 trillion approximately as combined foreign reserves. Appendix Table A1 presents the total FDI net inflows into BRICS by the host countries. The table reveals that the year 2013 was a strong year for BRICS with FDI net inflows of US$ 535.62 billion. In year 2013, China was the largest recipient of FDI inflows accounting for 65 percent of the total FDI flows in BRICS.
With this background, the study attempts to determine the various factors influencing the increased FDI inflows in these countries over a long period of 31 years (except for Russia for which the data was available from 1995). Also, the study throws a light on how this would channelize the efforts made by these economies in the right direction and enhance their efficiencies to become one of the supreme powers of the world.
The study is also motivated by the fact that BRICS appear to have prosperity of economic and social development in the forthcoming decades and it is expected that the economic growth of these countries will be tremendous in such a manner that they will throw competition and challenges toward the developed countries as well (Goldman Sachs Annual Report, 2013). Therefore, this study is important not just for the policy makers of these five countries but also for the other least developed countries (LDCs) and emerging market economies (EMEs) following the same path like the BRICS.
The rest of this article is structured as follows: The next section provides a “Literature Review” on the potential determinants of FDI. The section after that presents the “Data, Methodological Framework, and Modeling.” This is followed by “Empirical Results, and Discussions” section and “Findings” section. The next section summarizes the findings and results along with the policy implications of the study, while the final section highlights the limitations and future scope of this study.
Literature Review
FDI is assumed to facilitate economic growth in emerging markets by providing innovative technological know-how, capital, and access to diverse markets for the production of goods and services. However, attracting FDI is a major challenge for host countries as they need to identify the major push and pull factors that attract FDI to their countries.
All the below mentioned studies, point the role of economic factors in attracting FDI flows in emerging markets but there are hardly any studies which have examined the determinants of FDI in emerging markets as a group. Therefore, we extend previous studies by analyzing the economic determinants affecting the FDI inflows in BRICS countries as a whole over a very long period of three decades.
There are several studies which have analyzed the determinants of FDI for individual countries or groups of countries that are part of developing or developed markets. A brief summary of such studies is presented in this section. Marcelo Braga Nonnemberg and Mario Jorge Cardoso de Mendonca (2004) concluded that FDI is correlated to the level of schooling, economy’s degree of openness, inflation, risk, and average rate of economic growth in developing countries. Khondoker Abdul Mottaleb and Kaliappa Kalirajan (2010) also demonstrated that developing countries with larger GDPs, higher GDP growth rates, higher proportion of international trade, and a more business-friendly environment are more successful in attracting FDI.
Various studies pertaining to specific developing countries include studies by Boopen Seetanah and Sawkut Rojid (2011) who emphasized on trade openness, wages, and the quality of labor as the most instrumental factors for attracting FDI in Mauritius. Andreia Alexandra Faria Severiano (2011) showed the importance of GDP per capita, degree of openness to trade, exchange rate, minimum wage, corporate tax rate, and labor market flexibility while analyzing the determining factors for FDI in primary, secondary, and tertiary sectors of Portugal. Another study which confirmed the results of the previous studies was by Gilmore et al. (2003) who concluded that FDI is a preference to other forms of foreign market entry, size and growth of the host market, government emphasis on FDI and financial incentives, economic policy, cultural closeness, costs of transport, materials and labor, resources, technology, political stability and infrastructure are important determinants of FDI for Northern Ireland and Bahrain. Another study by Ngoc Anh Nguyen and Thang Nguyen (2007) in the Vietnam context gave importance to market, labor, and infrastructure in attracting FDI. Elizabeth Asiedu (2002) suggested that good infrastructure, liberalized trade regimes, and better government policies can help Africa to get more FDI flows. The main result is that natural resources and large markets promote FDI (Elizabeth Asiedu, 2006). Openness to trade, the size of the domestic market, and stock of the human capital played a positive role, while political instability and labor cost a negative role in attracting FDI in the African markets as explored by Sawkut et al. (2009). Yuko Kinoshita and Nauro F. Campos (2003) explored institutions, agglomeration, and trade openness as main determinants for FDI inflows in transition economies.
A study in China by C. H. Ho Owen (2004) indicated that market size, wage rate, degree of economic reform, and innovation activities are important determinants of sectoral FDI in China. Chien-Hsun Chen (1996), Lv Na and W. S. Lightfoot (2006) determined that market expansion potential, labor cost, allocative efficiency, transportation linkages, and technological filtering are able to attract more FDI in the mainland China. Junjie Hong (2008) also emphasized the labor cost as an essential determinant for attracting FDI flows in China. DeAngelo et al. (2010) concluded the importance of the consumer market and strength of consumer sales as the most important factor in explaining capital movements into Brazil. Bergsman et al. (1999) suggested that Russia should switch to a more modern policy approach to FDI by eliminating the relatively extensive non-tariff protection given to the domestic market, phasing out existing tax preferences for foreign investors, and reducing significantly restrictions on FDI to a limited number of activities. Priya Gupta and Archana Singh (2014) also concluded in a very recent study on BRIC Nations that the most important factors for attracting FDI inflows are inflation rate, international liquidity, debt service as a percentage of export of goods and services of the country, current account as percentage of GDP, current account as percentage of export of goods and services, budget balance as a percentage of GDP, and percentage unemployment in the country.
There are various studies pertaining to determinants influencing the FDI inflows in India specifically or as a part of some group like Vijayakumar et al. (2010) concluded that market size, labor cost, infrastructure, currency value, and gross capital formation are the potential determinants of FDI inflows of BRICS countries. Another study in the context of BRICS countries was conducted by Ranjan and Agrawal (2011) who found that the most important determinants of FDI inflows in BRICS are market size, trade openness, labor cost, infrastructure facilities, and macroeconomic stability and growth prospects. Market size and trade openness were also highlighted by Jadhav (2012) in his paper on BRICS countries. Muhammad Azam and Ling Lukman (2010) also revealed that market size, external debt, domestic investment, trade openness, and physical infrastructure are the important economic determinants of FDI in Pakistan, India, and Indonesia. Balasundram Maniam and Amitava Chatterjee (1998) conferred the importance of exchange rate for attracting US FDI in a developing country like India. Monica Singhania and Akshay Gupta (2011) revealed that GDP, inflation rate, scientific research, and FDI Policy changes have had a significant impact on FDI inflows into India. The financial strength of the state, development level of the state, size of the market, and level of infrastructure were some other determining factors for FDI in India as studied by Neerja Dhingra and H. S. Sidhu (2011).
Thus, it can be seen from the above literature that there may be various studies regarding the determinants of FDI inflows in the context of both developed and developing economies but there is hardly any study which explores these determinants of FDI inflows in the context of BRICS countries as a whole. From the review of the literature regarding determinants of FDI it has been observed that researchers agreed about the impact of many variables on FDI, but there is lack of uniformity in the opinion regarding the influence of some variables like inflation, exchange rate, trade openness, GDP, labor cost, and international liquidity on FDI inflows. This necessitates reinvestigation of factors influencing FDI in case of BRICS nations.
Potential Variables Used in the Study Determining the FDI Inflows
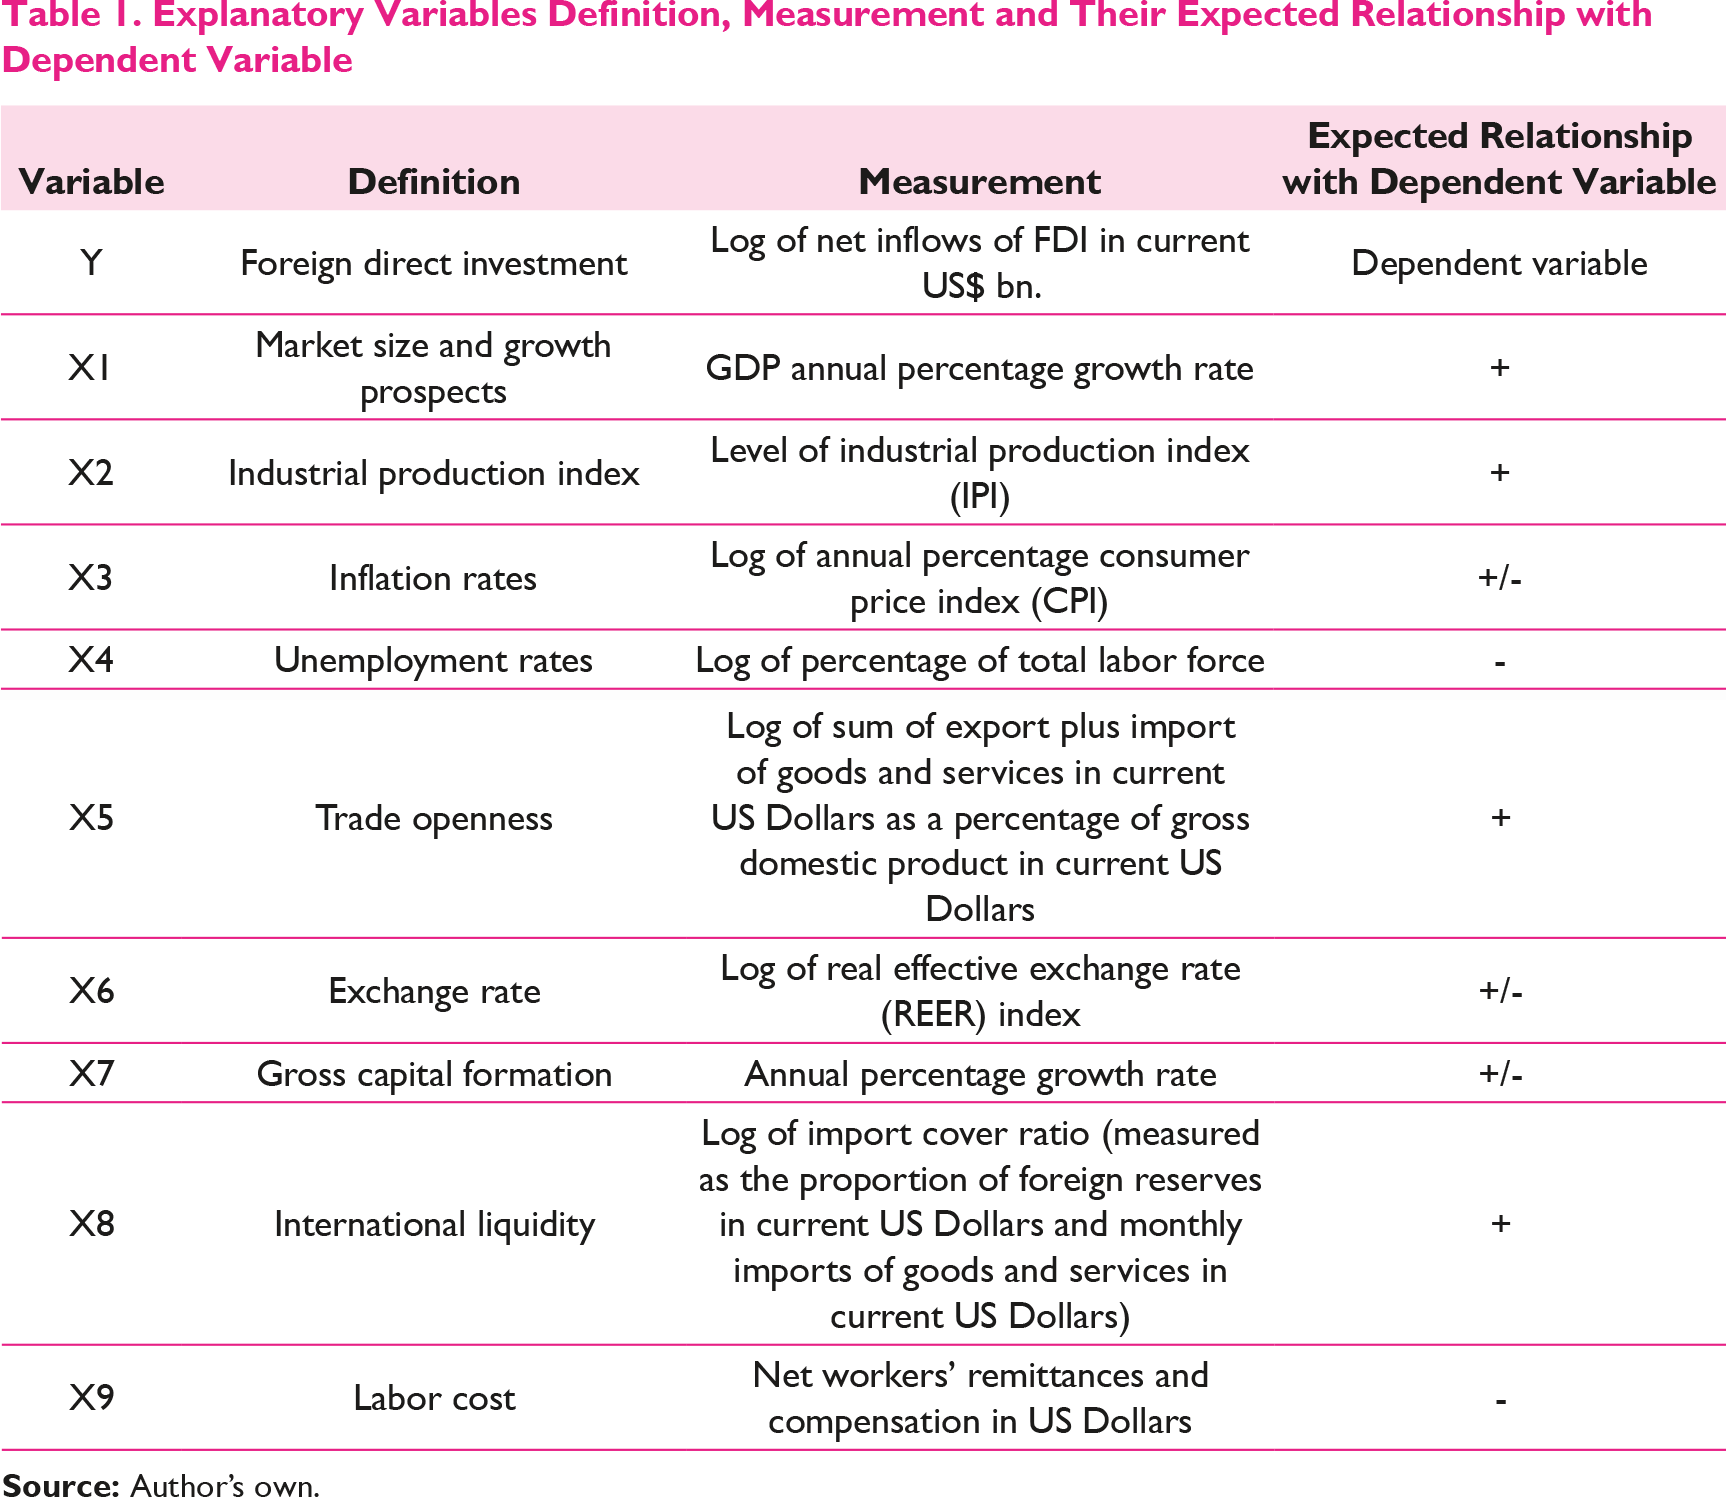
Explanatory Variables Definition, Measurement and Their Expected Relationship with Dependent Variable
Data, Methodological Framework, and Modeling
The dependent variable in this study is the FDI inflow in US billion dollars and the independent variables that are expected to determine FDI flows are carefully chosen, based on the previous literature and availability of dataset for the selected period. The dataset consists of annual dataset from 1983–2013 for the four emerging economies, namely, Brazil, India, China, and South Africa and for Russia the data is available from 1995–2013. The required dataset for the BRICS countries was obtained from various sources like the World Development Indicators, published by World Bank, World Economic Outlook published by International Monetary Fund (IMF), Oxford Economics Annual Database and Bruegel Database.
In order to evaluate the potential determinants of FDI inflows for the BRICS countries as a group, panel data analysis (Balestra, 1992) has been employed. A panel is a cross-section or group of people who are surveyed periodically over a given time span. A panel dataset offers several econometric benefits over traditional pure cross-section or pure time series datasets. Panel data analysis is being used extensively in economics and finance research to study cross-country economic issues (Maddala, 1999; Webb & Hall, 2009). The most obvious advantage is that the number of observations is typically much larger in panel data, which will produce more reliable parameter estimates and, thus enable us to test the robustness of our linear regression results. Panel data also alleviates the problem of multicollinearity because when the explanatory variables vary in two dimensions (cross-section and time series), they are less likely to be highly correlated.
Along with the common constant model (OLS regression), both fixed effects (FE) model and random effects (RE) models have also been tested to explore the key determinants of FDI inflow into BRICS countries due to the fact that the former takes into consideration the country-specific effect and the latter considers the time effect.

However, this case is quite restrictive and the case of more interest involves the inclusion of fixed and random effects in the method of estimation.
The FE model is specified as under:

where
i = 1,2,…..,N
t = 1,2,…..,T
where
In the RE case, the model is defined as

where
i = 1, 2,…..,N
t = 1, 2,…..,T
For each t,
Finally, it can be seen that in the panel data analysis, the fixed effects model assumes that each country differs in its intercept term whereas the random effects model assumes that each country differs in its error term.
Hausman Specification Test
Generally, when the panel is balanced it is expected that the fixed effects model would work well and when the panel is unbalanced, the random effects model would be a better model. However, the Hausman specification test (1978) guides us to choose the appropriate panel data model. Therefore, in such case following hypotheses are tested:
Null Hypothesis: H0: Cov (α i , X it ) = 0, that is, random effect model is suitable, if null hypothesis is accepted.
Alternate Hypothesis: Ha: Cov (α i , X it ) ≠ 0, that is, fixed effect model is suitable, if alternate hypothesis is accepted.
If p < 0.05 → FE is suitable
If p > 0.05 → RE is suitable
where
p is the probability value of the test statistic
If the value of the statistic is large, then the difference between the estimates is significant, so the null hypothesis can be rejected and a fixed effects model can be used. On the contrary, a small value of the Hausman statistic implies that the random effect is a more appropriate estimator.
The general specification of the parameters (dependent and independent variables) of the model in this study is as follows:

In the above specification,
The right hand side of the specification model includes all the independent variables which are defined as follows:
X1it is the gross domestic product (GDP) (annual percentage growth rate) used as a proxy of market size and growth prospects for country i at time t.
X2it is the industrial production index (IPI) for country i at time t.
X3it is the log of inflation rates (annual percentage consumer price index) for country i at time t.
X4it is the log of unemployment rates (measured as percentage of total labor force) for country i at time t.
X5it is the log of trade openness (measured as the sum of export plus import of goods and services in current US Dollars as a percentage of gross domestic product in current US Dollars) for country i at time t.
X6it is the log of real effective exchange rate used as a proxy of exchange rate movements for country i at time t.
X7it is the gross capital formation (annual percentage growth rate) for country i at time t.
X8it is the log of import cover ratio (measured as the proportion of foreign reserves in current US Dollars and monthly imports of goods and services in current US Dollars) used as a proxy of international liquidity for country i at time t.
X9it is the labor cost (measured as the net workers’ remittances and compensation in US Dollars) for country i at time t.
μit is the stochastic disturbance term.
The following hypotheses have been formulated with the help of carefully chosen independent variables (based on the availability of data for the selected period of study):
H1: Gross domestic product (GDP) does not have a significant impact on FDI inflows of country i at time t.
H2: Industrial production index (IPI) do not have a significant impact on FDI inflows of country i at time t.
H3: Inflation rates do not have a significant impact on FDI inflows of country i at time t.
H4: Unemployment rates do not have a significant impact on FDI inflows of country i at time t.
H5: Trade openness does not have a significant impact on FDI inflows of country i at time t.
H6: Exchange rates do not have a significant impact on FDI inflows of country i at time t.
H7: Gross capital formation does not have a significant impact on FDI inflows of country i at time t.
H8: International liquidity does not have a significant impact on FDI inflows of country i at time t.
H9: Labor cost does not have a significant impact on FDI inflows of country i at time t.
Empirical Results and Discussions
While applying the panel data models, various statistical tests need to be applied to check which model out of the three estimated models (explained in the previous section) is the model of best fit. Thus, first, the study checks whether FE model is better than the OLS model. For this purpose, the standard F-test can be used to analyze whether fixed effects (i.e., different constants for each group) should indeed be included in the model or not.
If F-statistics is bigger than the F-critical then the null hypothesis can be rejected (which assumes that all the constants are homogeneous) and therefore, the FE model should be used as a model of estimation.
Second, the comparison is made between the FE model and RE model in which Hausman specification test can be useful. If the value of the statistic is large and the difference between the estimates is significant, the null hypothesis can be rejected (which assumes the Hausman statistic is asymptotically distributed as chi-square with k degrees of freedom) and the fixed effects model can be used. On the contrary, a small and non-significant value of the Hausman statistic implies that the random effect model is a more appropriate estimator.
Lastly, the Breusch–Pagan Lagrange multiplier (LM) test (1980) is also computed to test whether the RE model is preferable over the common constant model (OLS regression). In other words, it can be proved with the help of this test whether there is an evidence of significant differences across countries or not. Otherwise, a simple OLS regression model can be run.
Descriptive Statistics of Dependent and Independent Variables in the Study
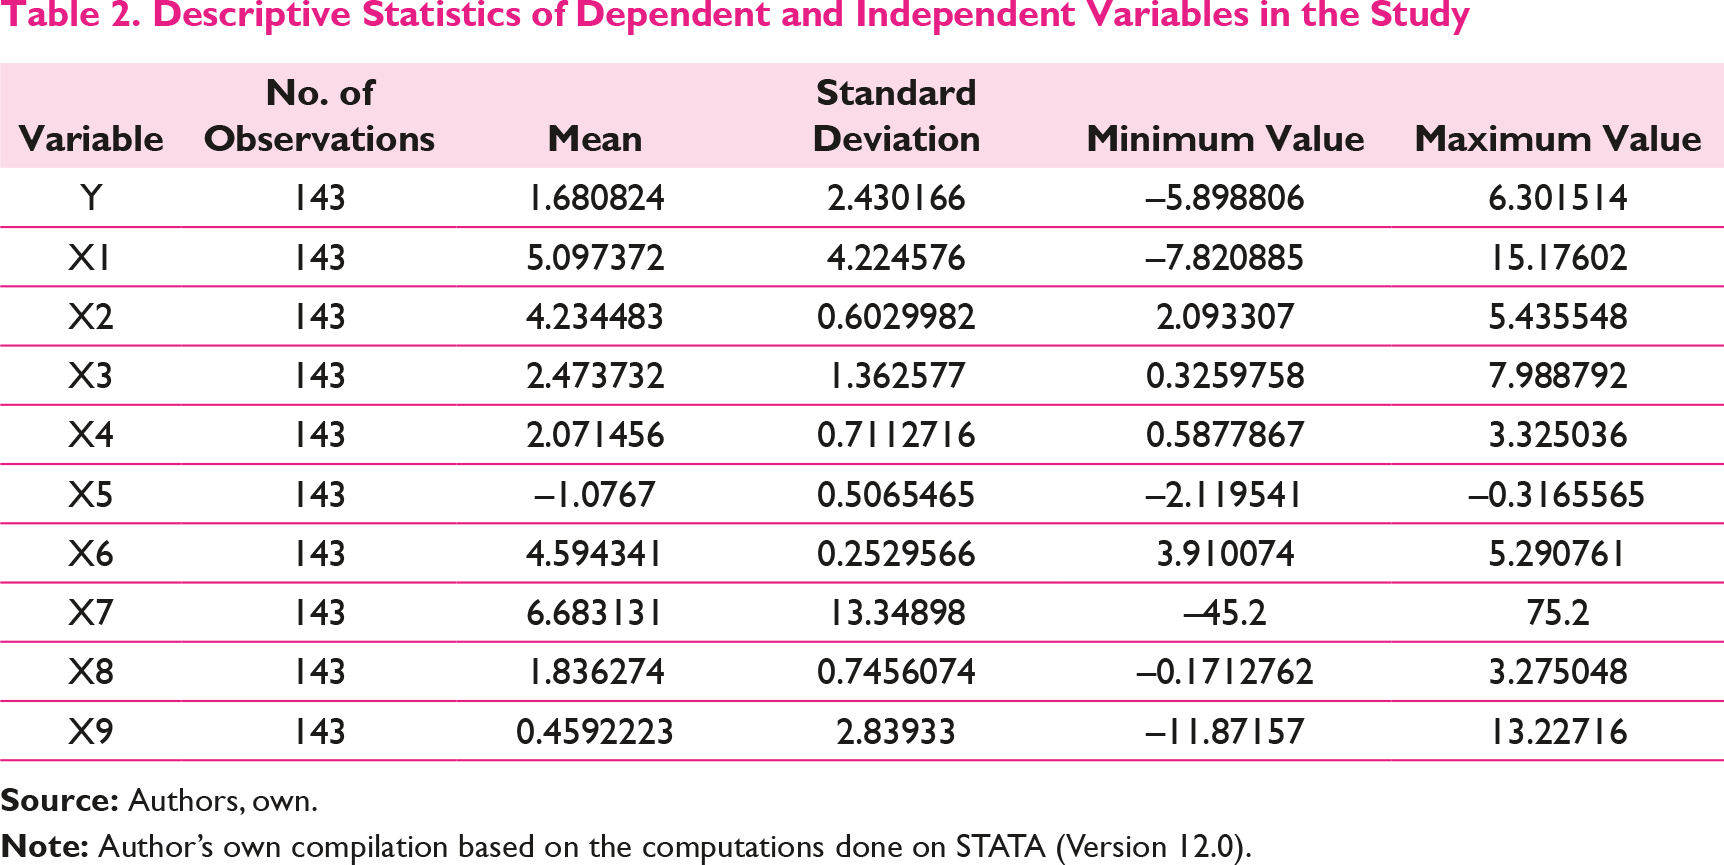
Table 2 suggests that all the selected variables in the study have equal number of 143 observations. This means that the panel is balanced with no missing observations. The results in Table 2 also displays that gross capital formation (X7) has the highest mean value and standard deviation of 6.683131 and 13.34898 respectively in the data distribution.
Correlation Matrix of the Selected Variables in the Study
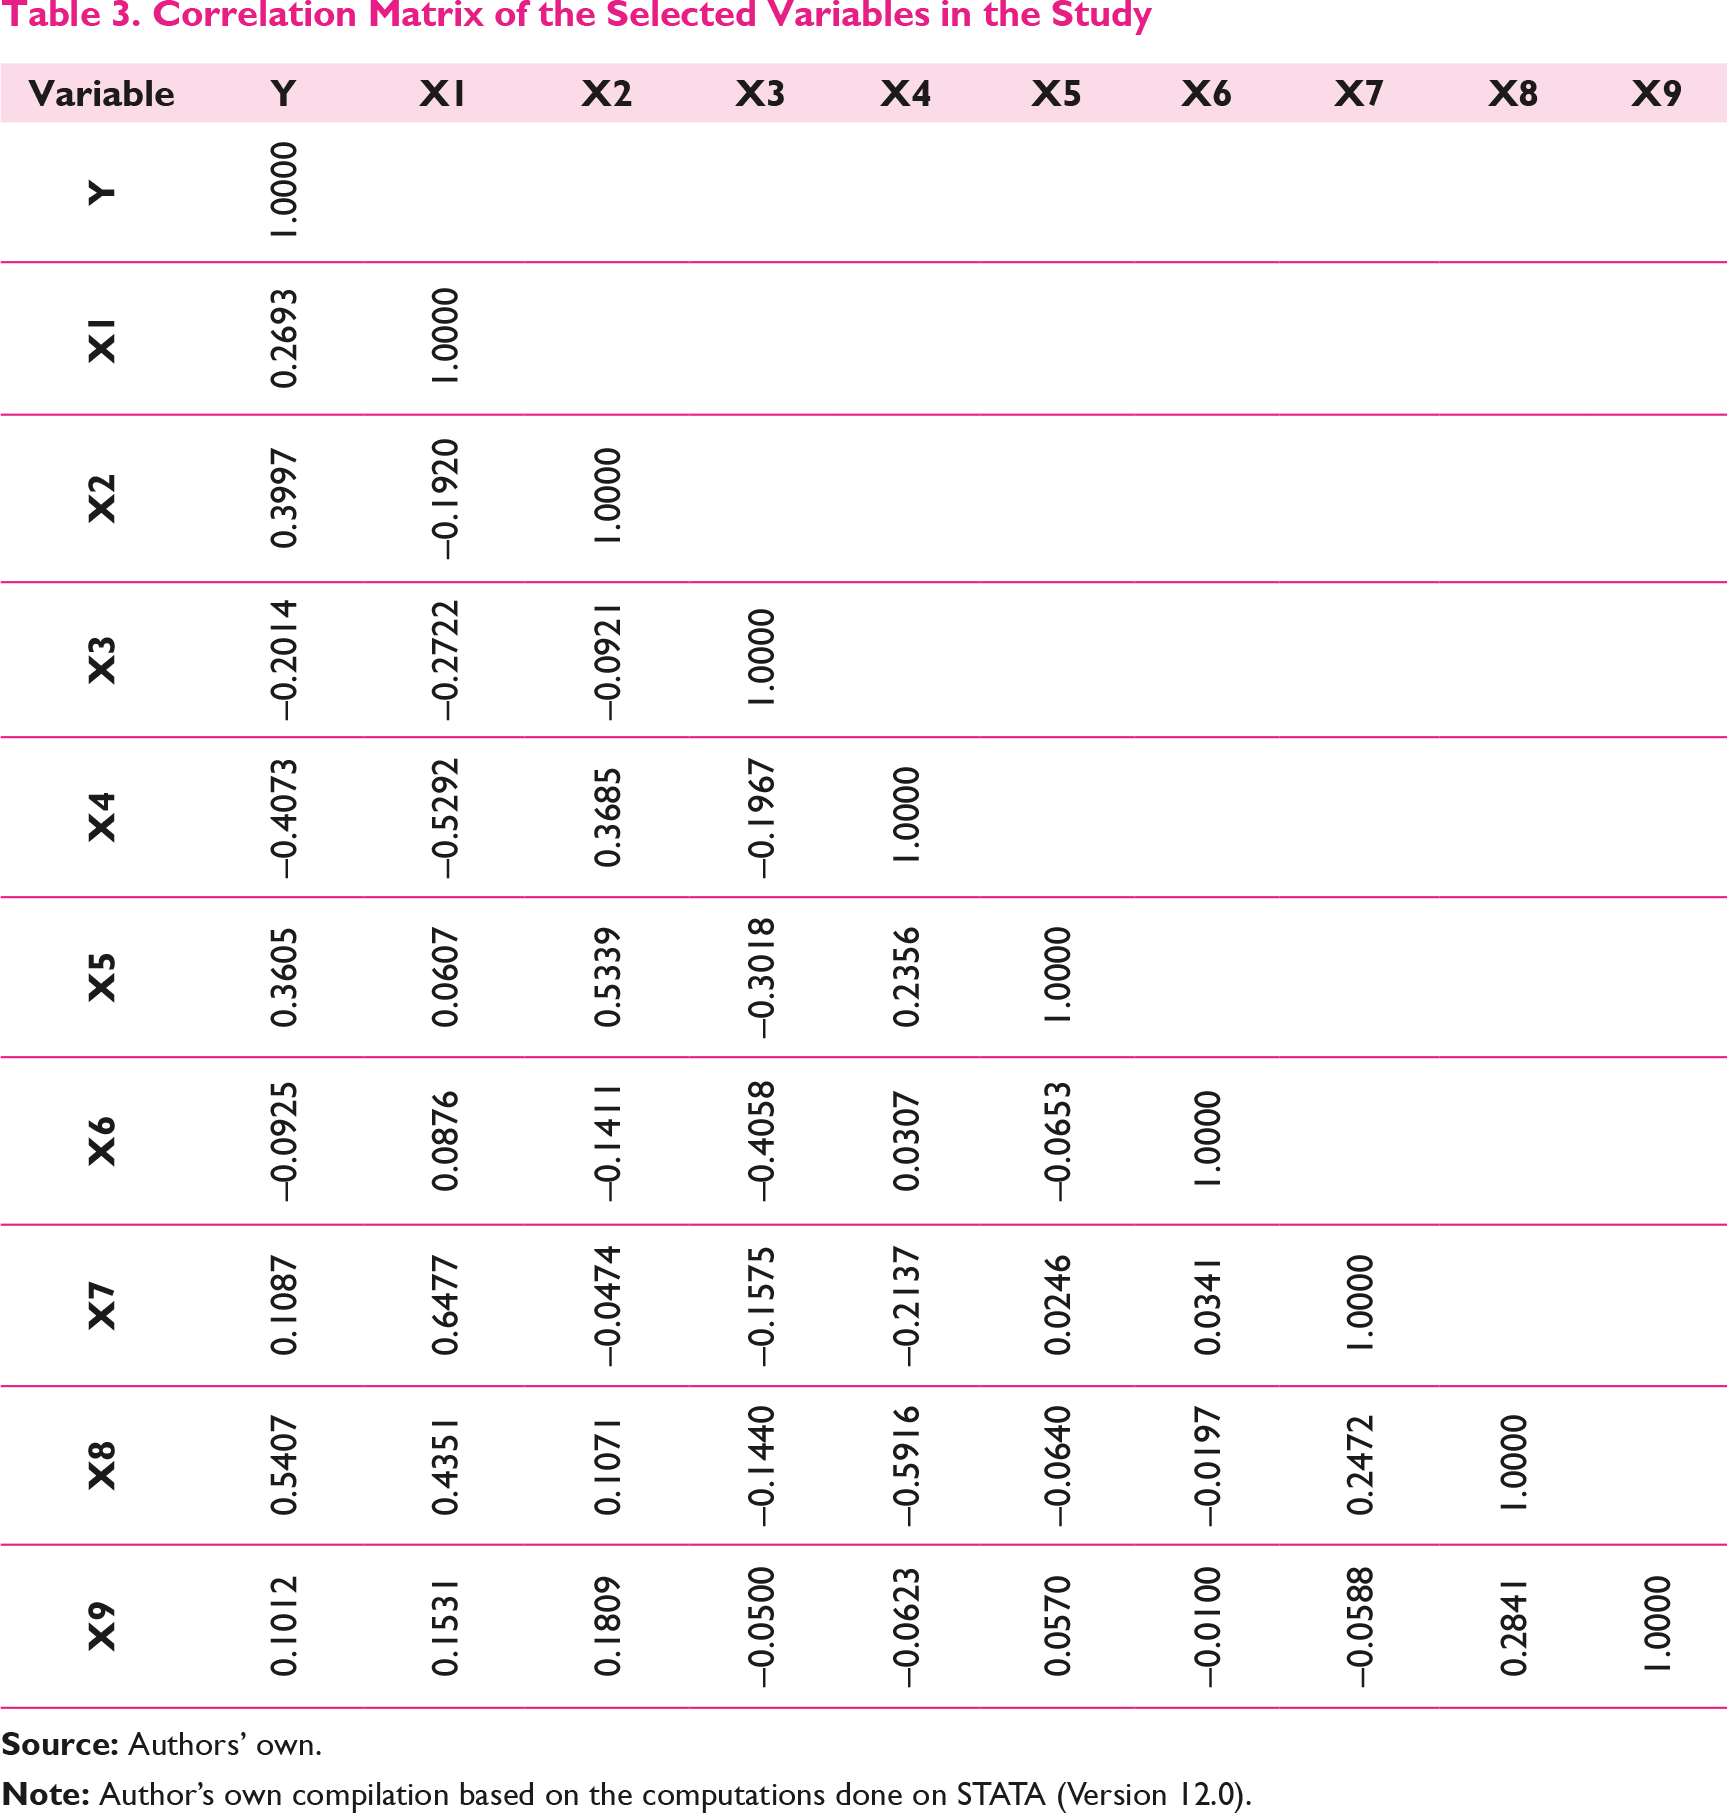
In order to capture the distribution of FDI across the BRICS countries over a period of 30 years (except for Russia), the estimates of Equation (3) were generated with the following panel data linear regression models: (1) common constant (OLS regression) model (2) FE model, and (3) RE model.
Determinants of FDI Inflows as per the Three Models of Panel Data Analysis
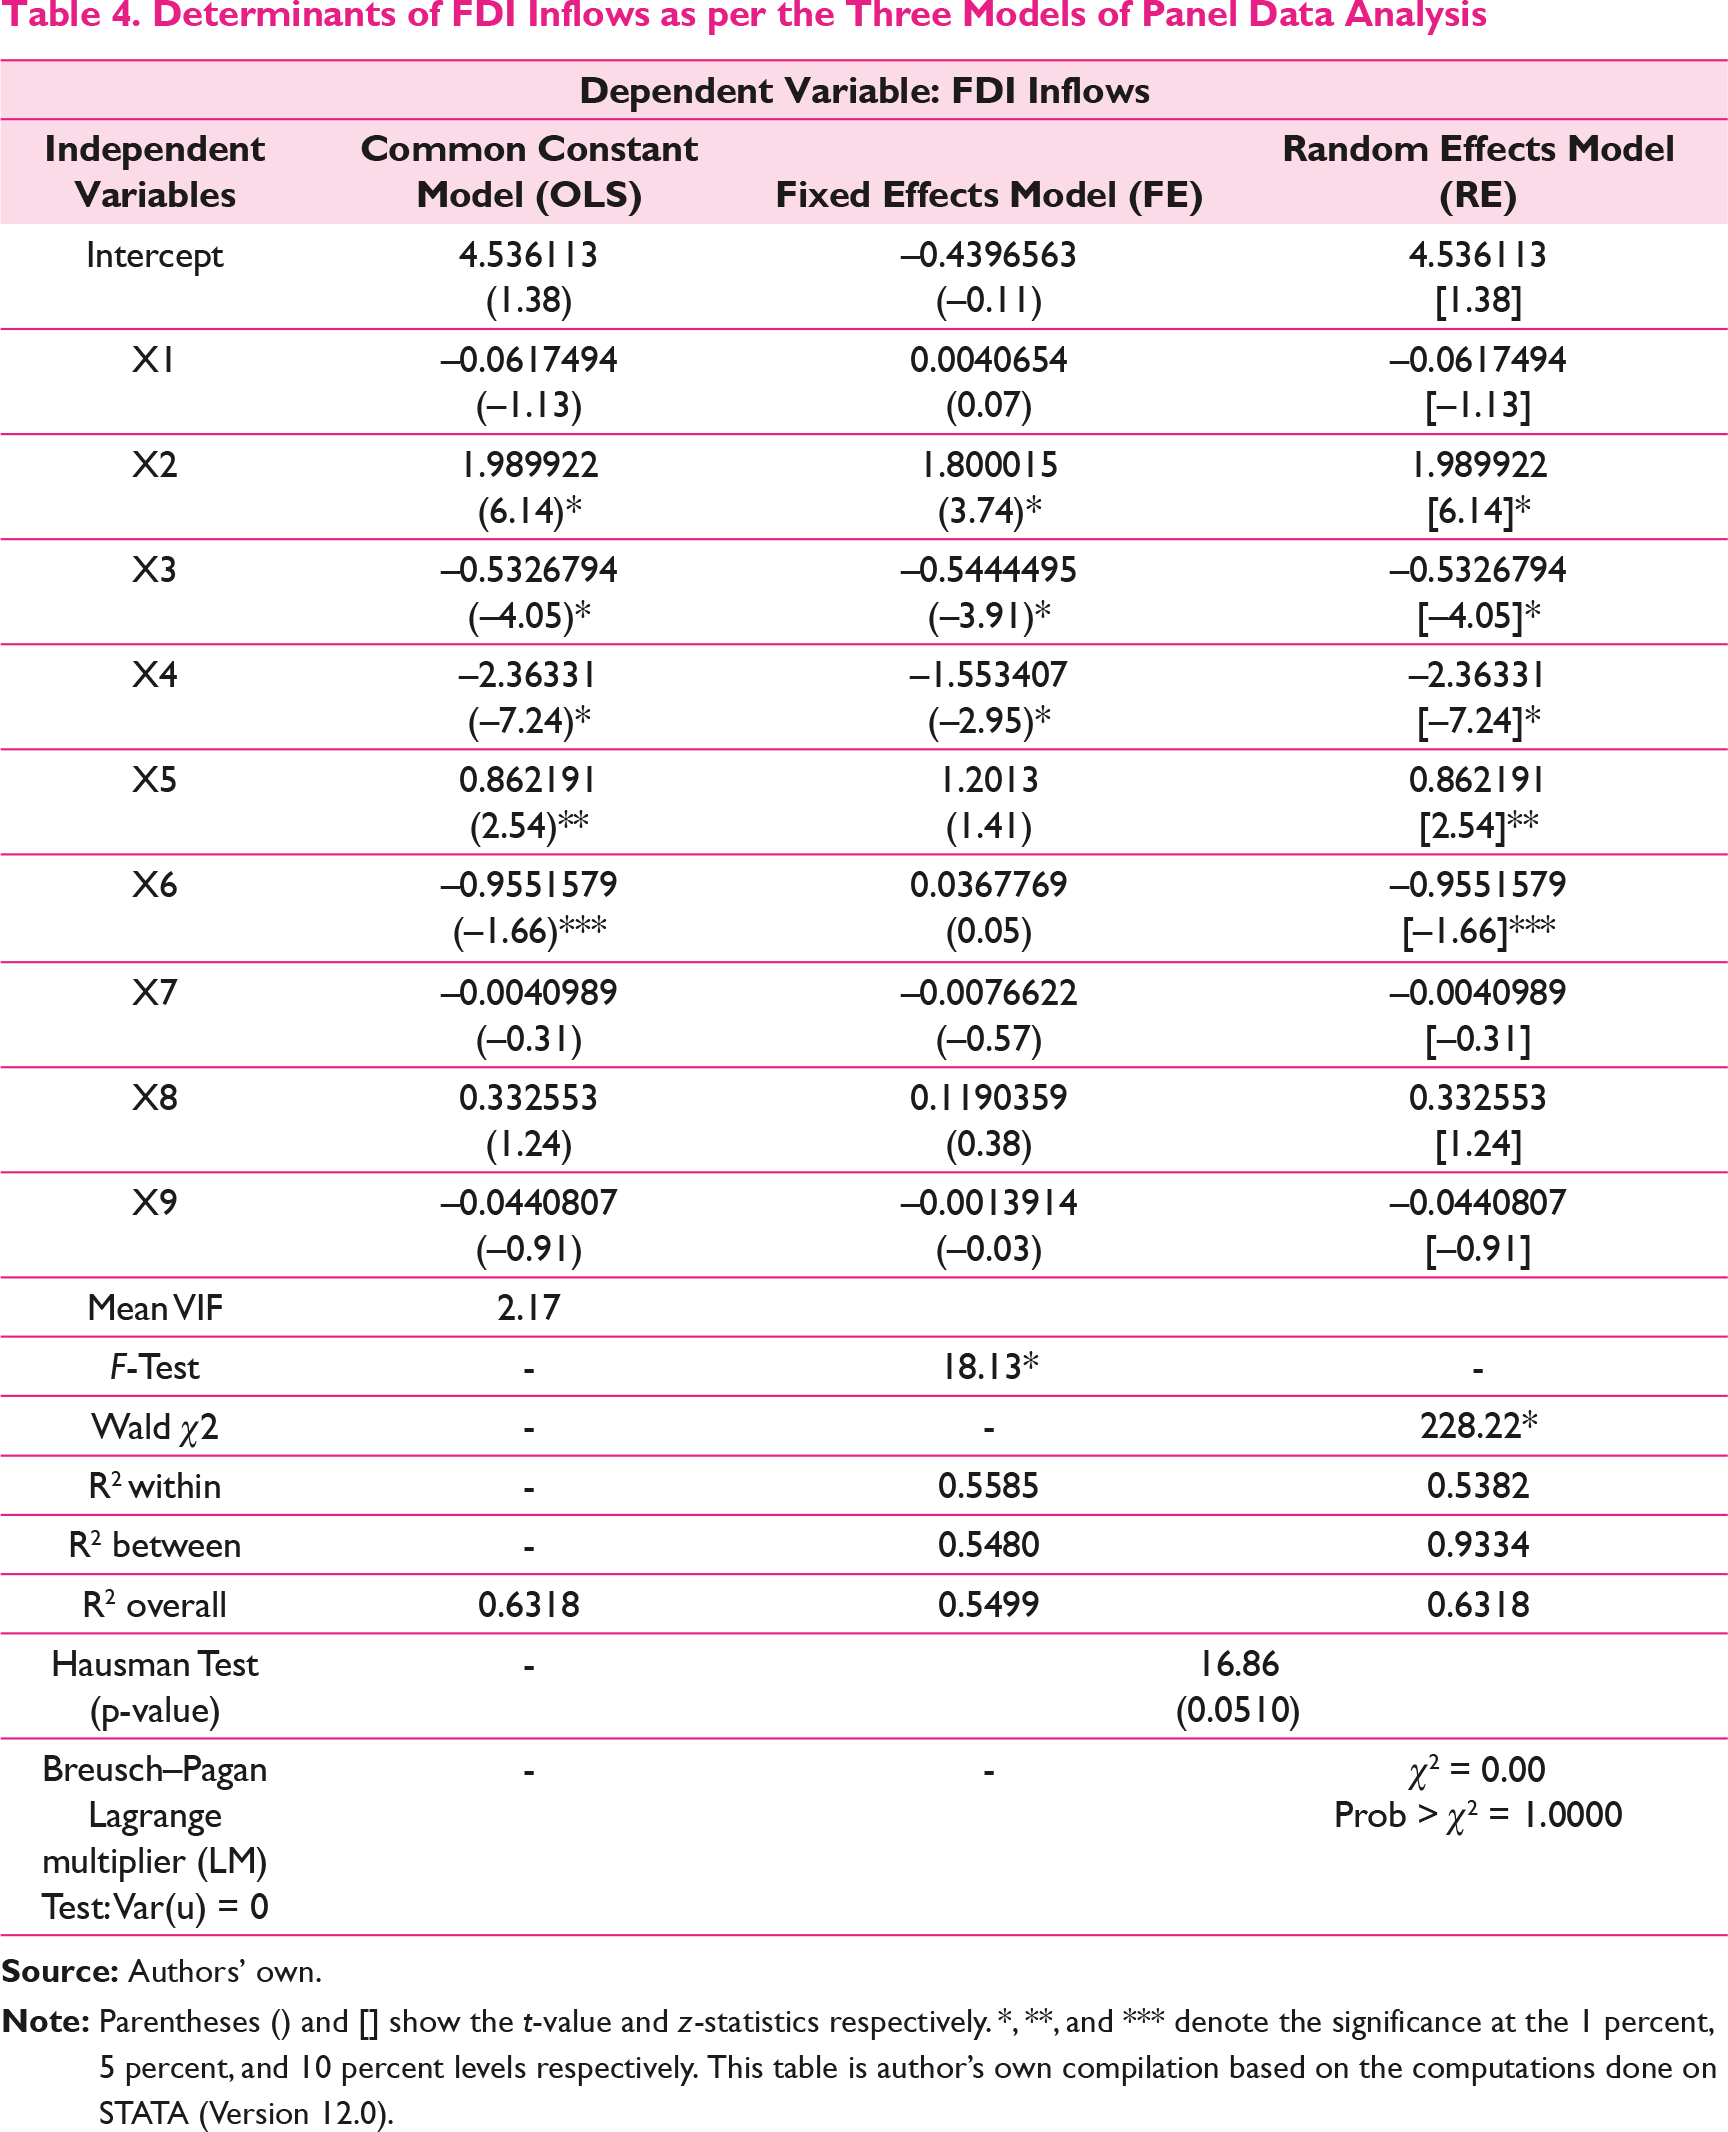
From Table 4, it can be seen that the first column (common constant model) shows the estimation results of regression Equation (5). As pointed out earlier, the problem with OLS methodology is that it implies that there are no differences between the estimated cross-sections (BRICS in our case) and it is useful under the hypothesis that the dataset is a priori homogeneous. Therefore, this case is quite restrictive but it allows us to check for the existence of multicollinearity in the model by way of a variance inflation factor (VIF). The literature points out that there is indication of multicollinearity if the mean VIF is greater than 5 (Judge et al., 1982). In Table 4, the mean VIF from the OLS method is found to be 2.17 which implies that there is no indication of multicollinearity problem in the model considered. Besides, the F-test (OLS versus FE) reveals that the null hypothesis (OLS model) is rejected. So, FE model is preferred to common constant (OLS) model.
In Table 4, the estimation results of the FE model and RE model are also reported in column three and four respectively. Now, the next concern is the choice between FE and RE models. To select an appropriate model for the empirical analysis, the Hausman specification test was conducted. The test gave a chi-square value of 16.86 which is not significant at 5 percent significance level, suggesting that the generalized least squares (GLS) estimators of the RE model are the preferred ones.
Lastly in Table 4, when the RE Model was compared with the common constant model with the help of the Breusch–Pagan Lagrange multiplier test, it was observed that the Prob > χ2 is more than 0.05. Therefore, we failed to reject the null (that variance across the five countries is zero) and concluded that random effects model is not appropriate. In other words, there is no evidence of significant difference across countries and thus we can run a simple OLS regression. But, we are still in the favor of random effects model instead of common constant model because of two reasons, one that the results of the latter were observed to be similar with the former and two, because the Hausman specification test also favored the RE model in comparison with FE model. Moreover, the random effects model has more estimation advantages than the common constant model, since the data classification seems to be a priori homogeneous. The estimation ensures homogeneity by choosing the sample countries which are assumed to be the most emerging economies of the world in terms of their growth and market potentials. Therefore, it was decided to drop the common constant model and not discuss its results further in this study.
However, once the above results are arrived at, one needs to analyze the residual diagnostics like the test of heteroskedasticity, the test of cross-sectional dependence/contemporaneous correlation, and also the test of serial correlation of both the models to derive the model of best fit to explain the dependent variable (FDI inflows in our case). If in case any of these assumptions pertaining to residual diagnostics are violated, then corrections are to be made in the aforesaid models by incorporating these assumptions and a robust model can be arrived at with the help of “cluster command” in case of FE and RE models in STATA (the statistical software). This will be done to make sure about the robustness of parameter coefficient in explaining the factors that determine the FDI inflows to the BRICS countries.
Modified Wald test for group-wise heteroskedasticity for both the FE and RE models gives a chi-square value of 1435.29 that is statistically significant at 5 percent significance level. Thus, we can conclude that there is substantial amount of heteroskedasticity in both the models. Another test for evaluating the cross-sectional dependence/contemporaneous correlation among the residuals is the Breusch–Pagan Lagrange multiplier test of independence which showed that for the FE and RE models, the chi-square distribution is 16.635 which is not significant at 95 percent confidence interval and thus we can not reject the null hypothesis, that is, there is no cross-sectional dependence or residuals across countries are not correlated. Lastly, the test for serial correlation is conducted where the F-statistic comes out to 11.393, which is statistically significant at 0.05 level, implying that the residuals have the problem of autocorrelation in both FE and RE models.
Determinants of FDI Inflows as per both the Modified Models of Panel Data Analysis (with Cluster Option)
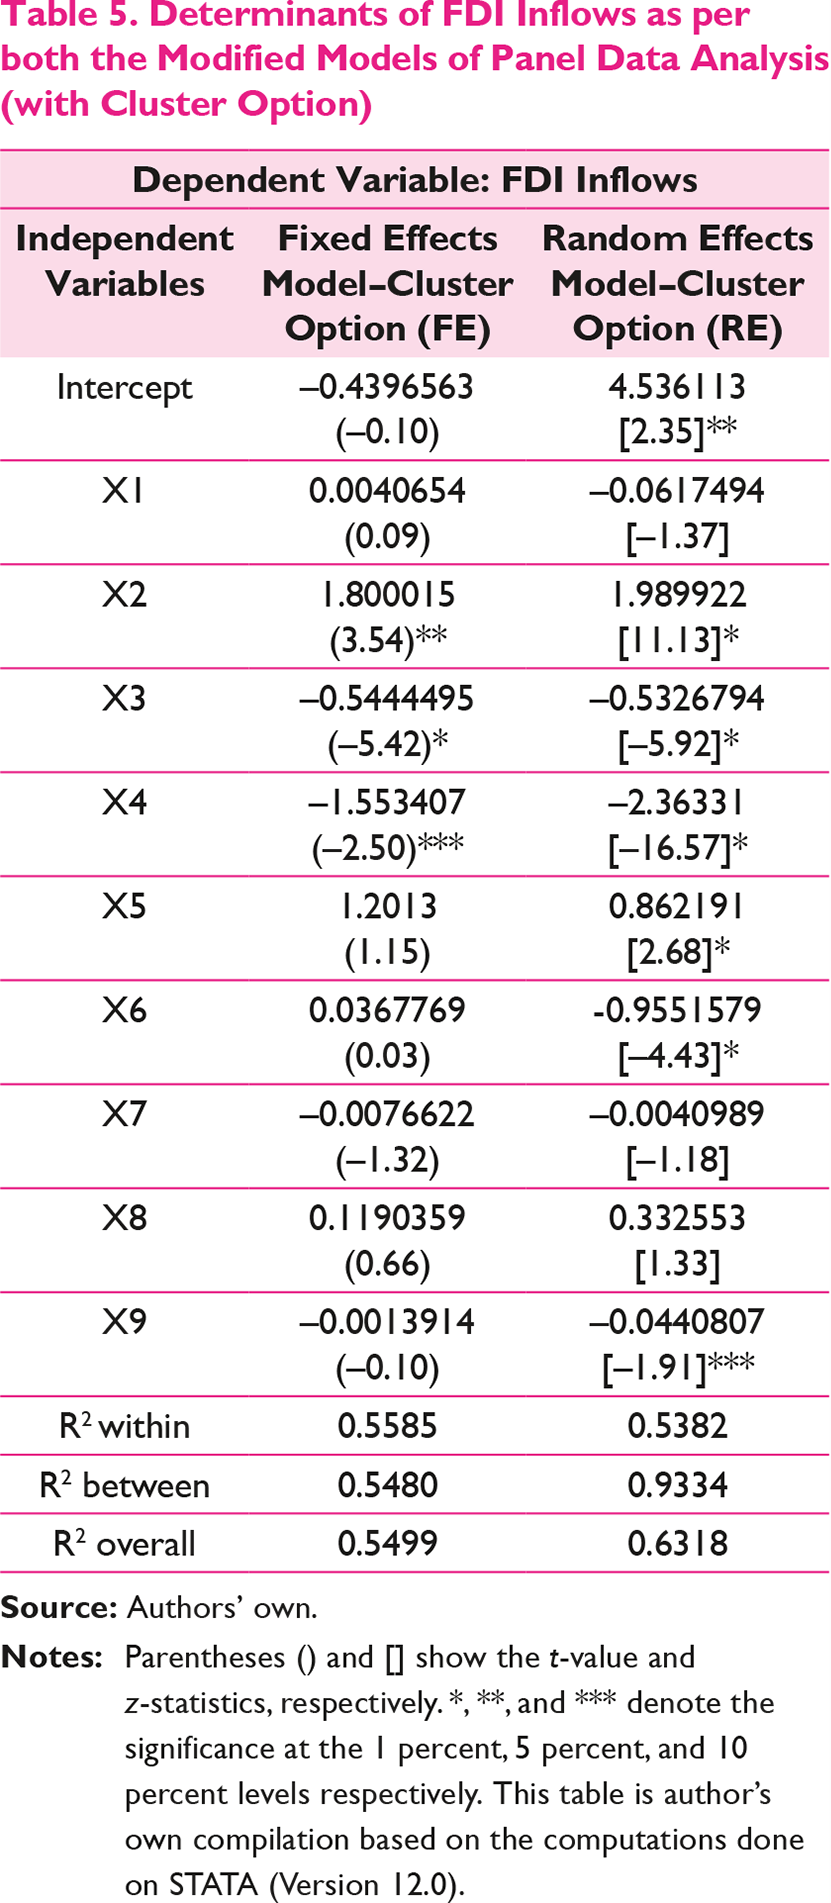
In the above table, we have estimated the fixed effects (FE) model and random effects (RE) model with the cluster option for the selected study period. The robustness of parameter coefficients is used to explain the relationship between FDI inflows and the selected independent variables. The fixed effects model is rejected in the analysis based on the Hausman specification test (1978). Therefore, we shall discuss only the results of random effects model (with cluster option) as this is the model of best fit.
Findings
The empirical results of the random effects model (with cluster option) presented in Table 5 reveals that IPI is significant and positively affecting FDI inflows as expected. Both inflation rates and unemployment rates are also significant and show a negative sign symbolizing an adverse effect on FDI inflows (results confirm with Gupta & Singh, 2014; Singhania & Gupta, 2011; Nonnemberg & Mendonca, 2004). It implies that as the inflation and unemployment rates increase in these emerging economies the resultant effect on FDI inflows is negative as the MNCs might not like to enter in such a market where their cost of production would increase. This might cut down their margins and thus acts as a demotivating factor for them while analyzing the alternative of making long-term investment into BRICS countries. A positive coefficient of trade openness, as expected, shows that all the BRICS countries are following a liberal trade regime and are thus able to successfully attract increasing FDI inflows. On the other hand, the results reveal a negative sign of coefficient of REER implying that there is an inverse relationship between FDI inflows and exchange rate movements in the host country. In other words, this implies that a depreciation of the host currency would increase FDI into the host country and an appreciation of the host currency would decrease FDI. All these five determinants are statistically significant at 1 percent significance level. The relationship between labor cost and FDI inflows is also negative as expected in the literature of other developing countries and is statistically significant at 10 percent significance level. This finding is also supported by the findings of M. V. Posner (1961) and Seev Hirsch (1976). It was concluded from these studies that the direction of the trade is decided by the comparative costs existing in these different countries which the MNEs take as absolute costs for taking decisions on investment flows.
Thus, we can conclude that these six determinants are the most crucial factors in attracting FDI inflows in BRICS countries.
Besides, the results also show that other variables such as market size (proxy used gross domestic product (GDP) growth rates) and gross capital formation have a very low and insignificant coefficient value and an opposite sign from the expected direction implying that they are not very relevant for the BRICS countries for attracting more FDI inflows. Libor Krkoska (2001) also concluded that the relationship between FDI and capital formation is not simple. Usually, a better investment climate leads to higher FDI inflows but in certain cases of privatization it might not lead to any increase at all or may even lead to a reduction in future FDI inflows. The sign of the coefficient of international liquidity (proxy used import cover ratio) is although found to be positive, as expected, but is statistically insignificant implying that even this does not play any significant role in attracting FDI inflows in BRICS countries. Finally, it can be asserted from the findings that most of the determinants are behaving in the same direction as expected in other developing countries of the world and are extremely useful (99 percent confidence level for all except labor cost) in attracting FDI inflows in BRICS.
The findings are well supported by the theories that exist in the international business environment which determines the movement of FDI flows to a specific country.
Conclusion and Policy Implications
The findings indicate that the governments of the BRICS countries should put incremental efforts to enhance production levels because a growing IPI indicates that the companies in the industry are performing well which attracts more FDI in such sectors. The BRICS countries should also adopt more open and liberal trade philosophy, provide tax incentives, etc. that will provide more confidence to the foreign investors to invest their capital in these countries. The government of these most emerging economies of the world should also keep a check on unemployment rates, inflation rates, exchange rate movements, and labor cost as these might act as a deterrent toward FDI inflows.
The results of this study also suggest that each of these five countries should put in individual efforts also to have more integration among each other. For instance, in case of Russia it can be seen that the country has undergone several reforms after the collapse of Soviet Union but still these reforms, as they were expected to, were not fully able to decrease concentration of economic power. Other than this, the country is still extremely weak in terms of protection of intellectual property rights and has an interfering atmosphere created by the government. Although Russia is amongst the leaders of the world for producing oil and natural gas but its manufacturing sector is still not competitive in the world. It is because of its reliance on commodity exports which are vulnerable to economic cycles that are prone to volatility in global prices. Therefore, the Russian government should put more emphasis on economic reforms and loosening of strict foreign sanction parameters.
The case of South Africa is quite similar to Russia, as although South Africa is one of the emerging markets in the world because of its vast supply of natural resources but it suffers from some major economic challenges leading to a retarded economic growth that in turn detains the foreign investors to keep their stakes high. Inadequate infrastructure facilities (like unstable electricity supplies) coupled with three major economic problems of unemployment, poverty, and income inequality (which are among the highest in the world) are the biggest challenge for the South African government. There are other lacunas also that hamper the growth rate of this economy like shortage of skilled labor, global incompetence, and frequent stoppage of work due to strikes and lockouts. Policy measures to resurrect the system are required at the priority level for the present government.
It is also suggested that the countries like Brazil, India, and China also need to sustain their positions in the competitive world. Like in case of Brazil, since GDP growth has slowed post 2011, due to several factors like heavy reliance on exports of raw commodities, low productivity and high costs of operations, high inflation rate, and low levels of investment, the government of Brazil should bring reforms to resurrect the system. Policy measures like promoting the domestic manufacturers by providing them tax reliefs and financial packages, educating them about new avenues in the manufacturing sector, imposing local content, and technology transfer requirements on foreign businesses, etc. might prove to be useful for bringing more FDI inflows in future if policy makers start considering them on a priority basis.
For China, friendly business climate, structural changes, better infrastructure facilities to promote exports, strategic policy initiatives of providing economic freedom, and flexible laws can be identified as driving forces for attracting FDI. While India has risen due to its human capital, size of the market, rate of the growth of the market, and political stability. In case of India, to enhance more FDI inflows, the policy makers need to ensure more economic and political stability, better infrastructure facility, a peaceful environment having a proper law and order mechanism, reduce the external liabilities, and also appropriate monetary and fiscal policy changes should be brought in for global integration.
Limitations and Scope of the Study
A similar or more comprehensive study can be extended to other upcoming groups like PIN (Pakistan, Indonesia, and Nigeria), MINT (Mexico, Indonesia, Nigeria, and Thailand), etc. which may follow the path of BRICS economies in formulating their strategies for attracting better FDI inflows. The most important limitation of this study is that the variables used in the study do not include the noneconomic/institutional variables. Therefore, further study with both economic and institutional variables is, henceforth, proposed. Another limitation is that this study looks at determinants of FDI for BRICS as a whole. Despite the fact that these five countries are classified as emerging markets there are differences among them on institutional and economic frontiers. Therefore, it will be interesting to analyze the determinants of FDI for each of these countries individually.
Footnotes
Appendix
2013
80.843
70.65372
28.15303
347.8487
8.118154
2012
76.11066
50.58755
23.99569
295.6256
4.626029
2011
71.53866
55.08363
36.49865
331.5917
4.139289
2010
53.34463
43.16777
27.39689
272.9866
3.693272
2009
31.48093
36.5831
35.58137
167.0708
7.62449
2008
50.7164
74.78291
43.40628
186.7976
9.885001
2007
44.57949
55.87368
25.22774
169.3898
6.586792
2006
19.37809
37.59476
20.02912
133.2725
0.623292
2005
15.45998
15.50806
7.269407
111.2102
6.522098
2004
18.16569
15.44437
5.771297
62.10804
0.701422
2003
10.14352
7.95812
4.322748
49.45685
0.783136
2002
16.5902
3.461132
5.62604
49.30798
1.479805
2001
22.45735
2.748286
5.471947
44.241
7.270345
2000
32.77924
2.71423
3.584217
38.3993
0.968831
1999
28.576
3.30943
2.168591
38.753
1.503332
1998
31.913
2.76126
2.634652
43.751
0.550339
1997
19.65
4.864643
3.57733
44.237
3.810544
1996
11.2
2.579
2.426057
40.18
0.816389
1995
4.859
2.065
2.143628
35.8492
1.248425
1994
3.072
-
0.973271
33.787
0.37441
1993
1.292
-
0.55037
27.515
0.011291
1992
2.061
-
0.276512
11.156
0.003358
1991
1.103
-
0.073538
4.366
0.254134
1990
0.989
-
0.23669
3.487
–0.07572
1989
1.131
-
0.2521
3.393
–0.20121
1988
2.804
-
0.09125
3.194
0.158437
1987
1.169
-
0.21232
2.314
–0.19167
1986
0.345
-
0.11773
1.875
–0.05049
1985
1.441
-
0.10609
1.659
–0.45264
1984
1.594
-
0.01924
1.258
0.4195
1983
1.609
-
0.00564
0.636
0.0709
Author’s Biography