
Abstract
Abstract
Introduction
Shifts in global competition, sales channels and strategy practices have created shifting lines between suppliers, sellers and customers, all seeking to capture value. Firms which seek to capture value at the point of sale by maximizing willingness to pay (WTP) have seen a rise in the customer’s ability to arbitrage the price of their purchases with effortless online comparison shopping, aggregation and deal sites (e.g., Amazon, jet.com, retailmenot.com and groupon.com). Similarly, firms seeking to capture value during value-add phases have seen reduced market risk and, in some cases reduced alternative costs, by efficiently designing products with market research or co-creation procedures. Firms using such tools can also capture value by more effectively pricing their products closer to the customer’s maximum WTP due to closer approximations of customers’ ideal product offerings.
While methods of developing products and the manner in which customers experience brands may be adapted, fundamental ideas of firm and customer value have remained unchanged. The existing cannon defines this zero-sum game as total value created (TVC) = WTP − supplier opportunity cost (SOC). Within the TVC, there is a division between suppliers, the firm and the customer who all seek to capture and optimize non-negative value in rational markets.
From the firm’s perspective, pressure from competition and customers alike requires offsets during value-add phases in order to achieve sustainable competitive advantage or create an opportunity for additional value capture without affecting price. Attempts to do so by driving down costs are constant. In rare cases, cost-reduction pressures proliferate with negative consequences (e.g., Samsung S7 Note failures due to quality procedure insufficiency). While improving scalability and negotiating with suppliers are standard cost-reduction methods, seeking input alternatives or utilizing approaches such as zero-based budgeting (ZBB) are on the rise. However, many firms may be concerned that continual cost-cutting may affect quality, final product configuration or product desirability in ways where value is catastrophically affected or where value becomes void or altogether unimportant (e.g., transportation maintenance failure that leads to fatal accidents).
To create value, many firms seek to either differentiate their product offering, future-proof their offering, price the offering more effectively or some combination thereof. To do this, firms increasingly engage in market research, customer experience measurement or customer co-creation exercises in order to reduce both time and cost in launching new products. These exercises seek to include the customer directly into various phases of service or product development, adding value for both the customer and the firm alike (Magretta, 2002); as customers gain a more desirable product faster, firms decrease development costs and firms save time to achieve dialled-in products while enhancing customer WTP.
These activities have become an essential component to competitive positioning and operational processes while creating firm and customer value. Failure to include customers in value chain development, on average, fails to deliver on their objectives (Christensen, 1997) as signalled by higher risks of market failure due to issues of poor design or configurations, incorrect positioning, incorrect pricing or higher development costs. Therefore, the mechanisms under which these activities occur have become increasingly common and sophisticated as demand for accuracy and quality of analytics, as well as the effectiveness of marketing sciences, have risen.
To achieve this goal of customer inclusion amid co-creation, firms typically follow a multi-step process of idea generation and screening, concept testing, product development and product testing (Wind, 1973). Most development patterns follow this or a reasonably similar heuristic, under which the service or product becomes more tangible and targets further into the continuum a firm invests. In an ideal setting where cost and speed to market were not factors in product or service design, firms could opt in to connected and continuous research cycles that followed best-in-class models (e.g., the IDEO method, Kelley [2001]). Such continuums of values creation have long been employed in product development, though the openness with which firms engage with customers via qualitative (e.g., focus groups, in-depth interviews and in-home usage tests) and quantitative methods has made their application ubiquitous.
Advanced quantitative survey-based methods such as maximum difference scaling (a.k.a MaxDiff) (Louviere, 1991, 1993; Louviere, Swait, & Anderson, 1995) and various forms of conjoint research (e.g., choice-based conjoint [CBC], adaptive choice-based conjoint [ACBC], menu-based conjoint, etc.) are employed in the middle and latter stages of this continuum. These advanced methods have been considered more serious contributors in the value creation process due to their underlying advanced analytics which provide greater precision in creating desirable product configurations, as well as narrowing acceptable price points for each combination with respect to alternatives in the current market or expected alternatives in the near-future market.
While advanced methods certainly enable the creation and capture of firm value, firms in competitive and saturated markets remain under relentless pressure—from shareholders and competitors—to also capture value from driving down costs and not solely differentiating their offerings; price does not influence the amount of value created, only how value is captured between the firm and its customers. The issue here, of course, is that the methods of discovering and differentiating value (including those research approaches or co-creation exercises) are simultaneously considered in conjunction with—or attributing to—firm costs, just the same as other operational inputs. Therefore, even these value-creating mechanisms are not immune to cost pressures, and the propensity to achieve increasing value per research dollar should be expected.
The source of costs from the firm’s perspective for MaxDiff and other conjoint methods—such as CBC and ACBC—is their reliance on experimental designs, specialty software and expensive consultants who are responsible for executing and interpreting this form of customer research. MaxDiff exercises are less expensive than CBC or ACBC methods because these designs are less complex, capture data more easily in survey programming and have simpler and less sophisticated outputs. Typical MaxDiff exercises also differ from CBC or ACBC studies in cost due to the decreased complexity, value and specificity generated.
Despite being relatively simpler than CBC or ACBC, MaxDiff delivers insights and value not achievable through unsophisticated alternative survey methods—even if seemingly similar—such as ordinal ranking exercises, even when post-hoc approaches such as Thurstone scaling are applied (Thurstone, 1928). Accordingly, costs to execute MaxDiff remain lower than CBC or ACBC but remain more expensive that standard, non-advanced routines in survey research.
From the customer’s perspective, the source of cost is the time commitment required to complete lengthy or high-complexity surveys and exercises. MaxDiff, CBC and ACBC—while providing ostensibly more interesting and realistic scenarios—all involve iterative question batteries requiring the respondent to evaluate multiple sets of choices. This cost is one that customers are increasingly unwilling to pay (with the time and attention) in today’s market—thus, lengthier or denser surveys are barriers to participation in the value co-creation process. Marketing research and survey panel companies are increasingly under pressure to reduce survey length and, in the process, cost per interview (CPI).
The research undertaken in this article examines an alternative to experimental methods of utility estimation (such as MaxDiff and conjoint) using a common survey technique which can deliver parallel results. The wallet allocation rule (WAR) is a specific application of the Zipf distribution power law, initially proposed as a means of estimating the share of wallet among brands in a customer’s usage set (Keiningham, Aksoy, Buoye & Cooil, 2011) but later extended as a Thurstone-like scaling approach for ordinal data (Aksoy, Keiningham, Buoye & Ball, 2016). Aksoy et al. (2016) presented an example of this application to the key drivers of selecting a loan provider. This investigation applies the same approach to the smartphones, while providing a comparison to the results derived from MaxDiff and ACBC approaches, as well as constant sum scaling.
There are two manifest contributions of the research presented in this article. First, the WAR methodology and MaxDiff can generate similar aggregate results which allow the former to be substituted in place of the latter during investigations where MaxDiff use is appropriate and frequent. Second, the alternative WAR methodology is a more accessible technique when compared to MaxDiff: it does not require the use of experts for development and deployment of experimental designs and it does not require the usage of specialty software to execute required survey fieldwork. Additionally, the survey experience for survey respondents may be more straightforward utilizing WAR as it avoids the necessity for the repeated tasks inherent within MaxDiff. In these ways, WAR is an overall simpler approach.
For firms seeking to capture value from MaxDiff approaches, there are also two additional latent benefits from the studied alternative approach: cost reduction in development and cost reduction in execution. The necessary experimental design required in MaxDiff—while not comparable to the more complex requirements of CBC or ACBC—often requires specialty knowledge from analytics consultants. Additionally, using MaxDiff prevents the usage of unsophisticated survey tools to field the survey. Both of these offset firm value by increasing SOCs. Without such requirements, this produces a cost-saving for the firm. It also potentially creates value for the panel company through higher panel retention rates due to more engaging or less repetitive questionnaires.
The WAR question battery is shorter than that for MaxDiff, CBC or ACBC, which represents a cost-saving for the respondent (i.e., customer) as well. Although research on the relationship between interview length and survey completion rates is somewhat mixed, shorter interviews are generally expected to result in higher completion rates and require smaller incentives, which, in turn, lower the overall sample cost (Galesic & Bosnjak, 2009; Schoeni, Stafford, McGonagle & Andreski, 2013). It also potentially creates additional value for the panel company through higher panel retention rates due to more engaging questionnaires.
In conclusion, firms continually seek methods of value creation. Using techniques such as value co-creation or market research, firms have effectively elevated both customer value and firm value. However, advanced methods such as varying forms of conjoint increase SOCs through complexity of design, the necessity of specialty software and subject matter expertise and consulting. The corresponding increase in firm costs threatens the ability of firms to capture a maximum of the value that is created in such ways. By using the WAR methodology to replace cases which used MaxDiff, firms can achieve near identical value from the survey exercise while reducing firm costs. This article outlines the substitutability of WAR for MaxDiff for the case of purchasing new mobile phone services and devices.
Literature Review
Kaplan and Norton (2004, p. 10) note: ‘Strategy is based on a differentiated customer value proposition. Satisfying customers is the source of sustainable value creation’. Certainly, disciples of the service-dominant logic (Vargo & Lusch, 2004) movement would agree and failures to assess customer needs can adversely affect firm success (Ogawa & Piller, 2006). Thus, creating value inherently involves understanding customer needs through any variety of methods.
The most widely accepted definition of value is that a firm creates value by producing goods and services at costs lower than a customer’s WTP for those same goods and services. Porter (1985) lays out the initial concept of the value chain as the template through which firms receive raw inputs, add value through differentiating and sustainable activities and produce outputs that generate opportunities to capture value and create sustainable competitive advantage.
Introduced by Prahalad and Ramaswamy (2000), value co-creation is emblematic of the process of customer inclusion in new product development, improvement of consumption and usage experiences as well as service and product innovations that provide consumer benefits. For summary reviews, see seminal works by Prahalad and Ramaswamy (2000, 2003, 2004a, 2004b), Bitner, Ostrom and Morgan (2008) and Vargo and Lusch (2004).
Mascarenhas, Kesavan and Bernacchi (2004) cover customer value chain involvement and expound on the value of bringing the customer into the value creation process; Mascarenhas et al. (2004), citing Fournier and Mick (1999) and Keiningham, Goddard, Vavra and Source (1999), additionally argued that the ‘greater attention paid to and participation invited from the target customers at every step of the value chain, the greater will be customer satisfaction, retention and customer delight’. Galvagno and Dalli (2014) define co-creation as ‘the joint, collaborative, concurrent, peer-like process of producing new value, both materially and symbolically’ and Vargo and Lusch (2004, 2008) cite the process of firm-customer interaction as similarly creating value as the customer shifts from a role of value reception (passive) to a position where value is co-developed (co-creation).
In this sense, advanced market research methods—at least advanced methods such as WAR, MaxDiff or conjoint—can be seen as critical contributors for identifying manifest and latent customer needs. By delivering products guided by such methods, categorical assignment of such efforts as a form of value co-creation is evident.
Data
Attributes (Factors) and Factor Levels
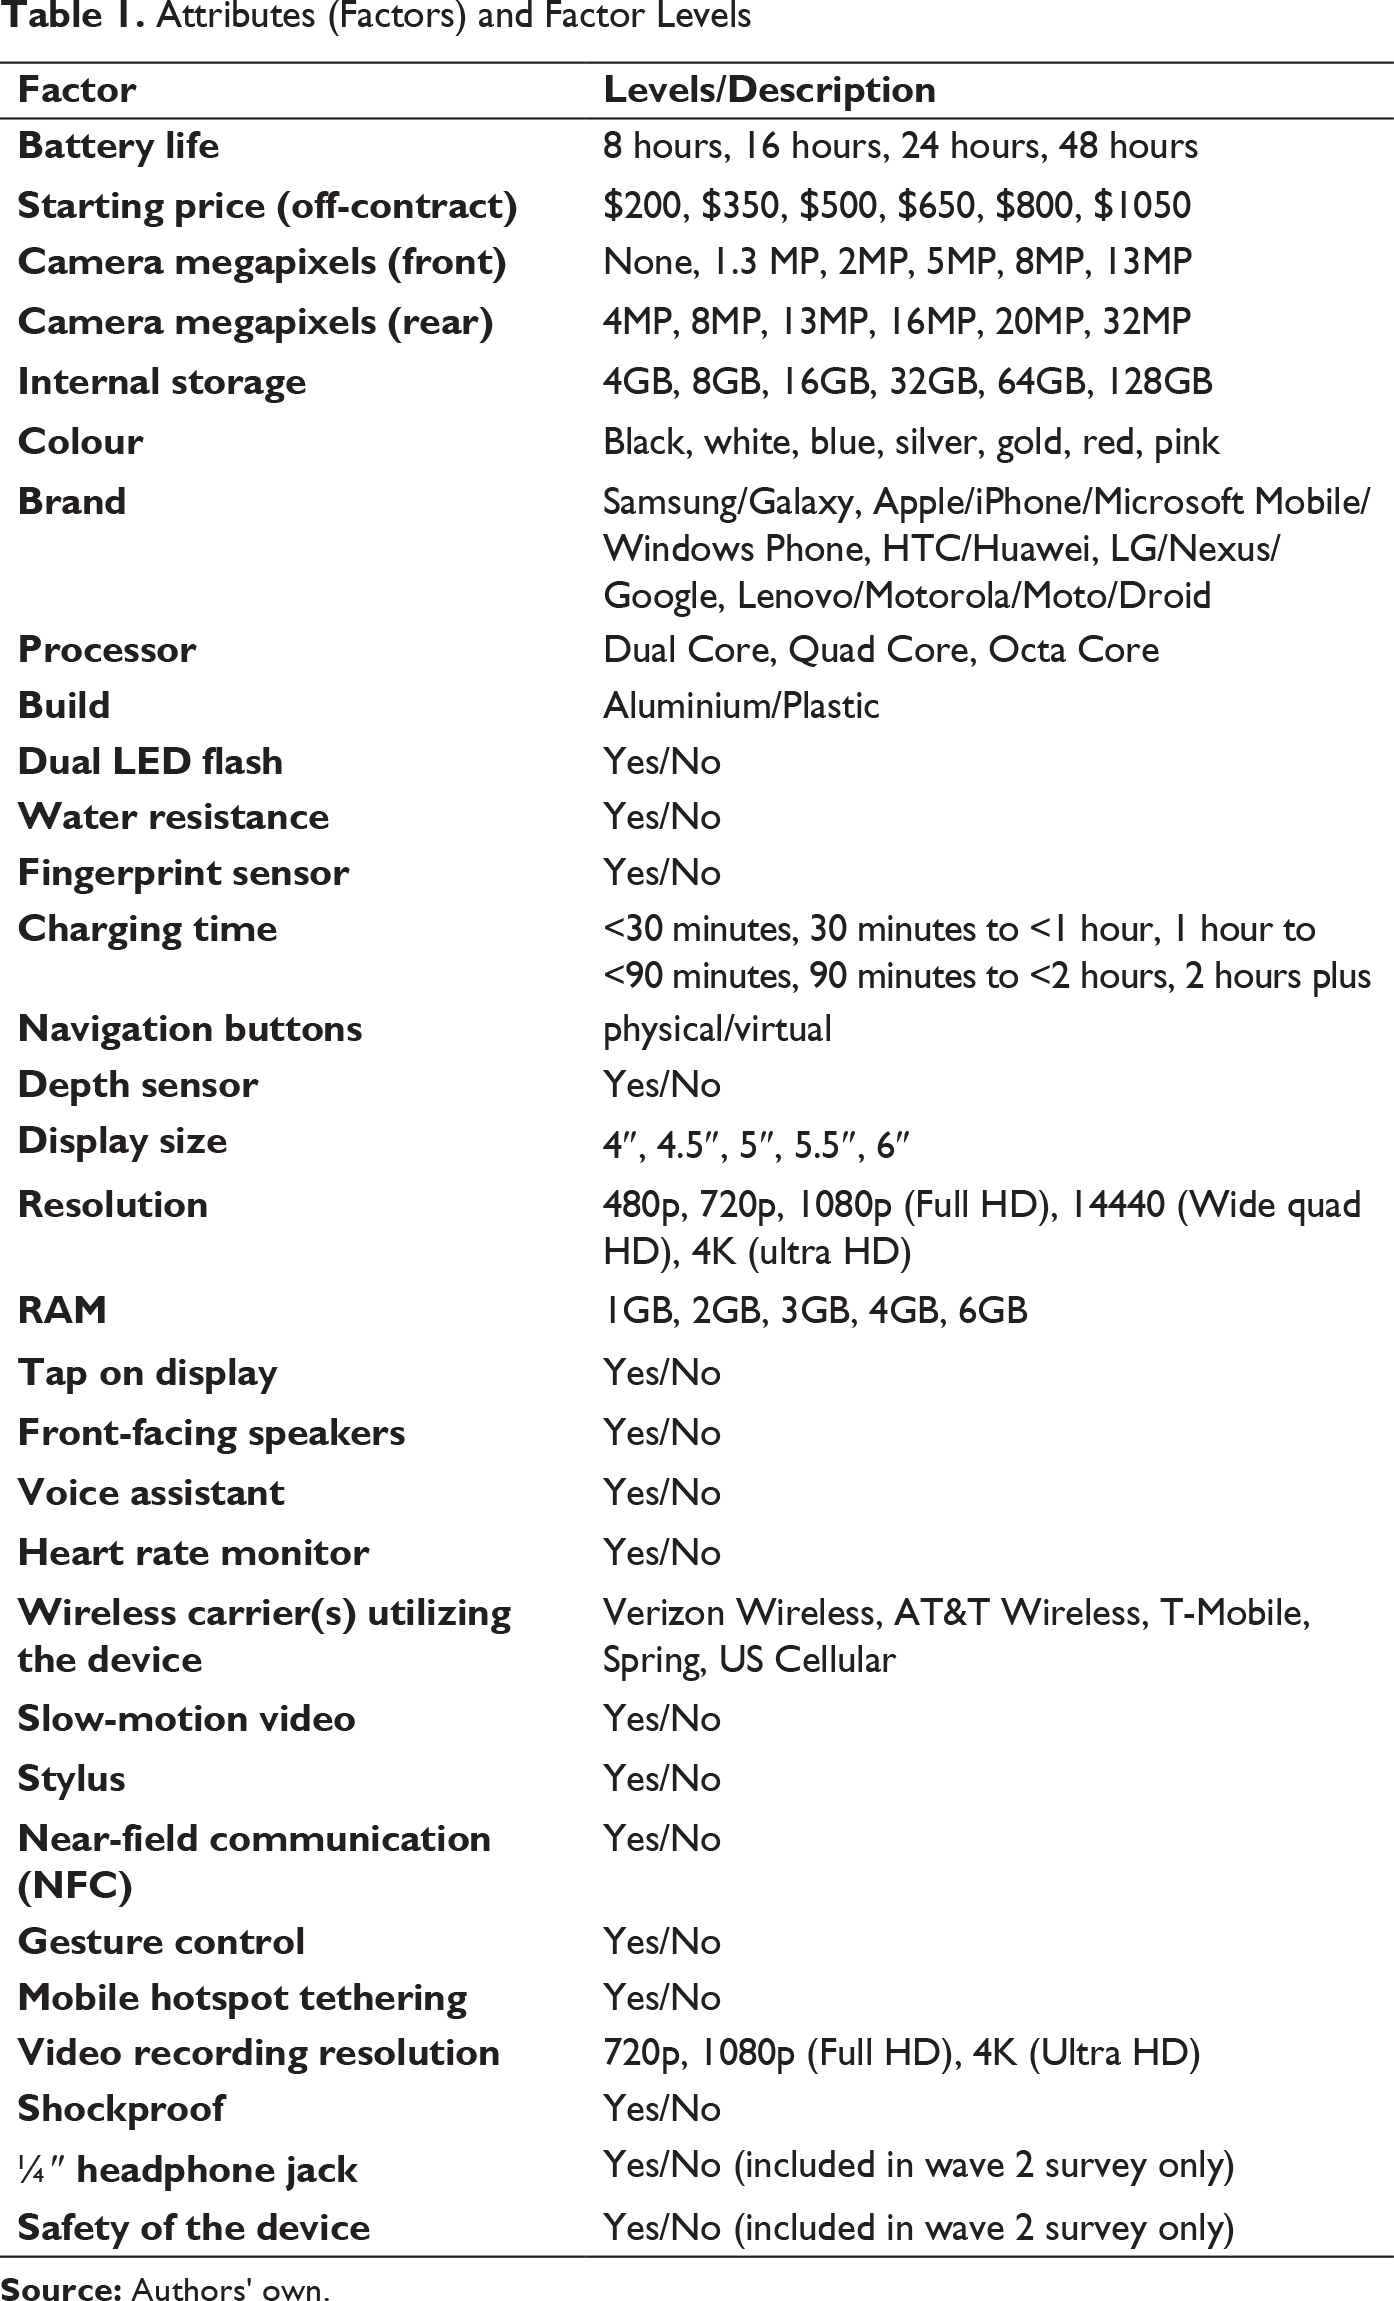
The 554 recent purchasers were asked to indicate which of the 30 features, if any, they considered in their recent purchase. Respondents were then asked to rank only the features they selected. Recent purchasers were also presented with a maximum difference scaling (a.k.a., ‘MaxDiff’ or ‘Best-Worst Scaling’) exercise incorporating all 30 features, whether they had considered them in their recent purchase decision or not.
The 598 intended purchasers were randomly assigned to one of two paths: (a) a set of questions perfectly analogous to those seen by the recent purchasers (i.e., select features they will consider in their upcoming purchase decision and rank in terms of importance and a MaxDiff scaling exercise) or (b) an ACBC exercise which presented them with a series of product profiles, among which they had to choose the profile they would be most likely to purchase. The intended purchasers were evenly split between the two paths, with 299 respondents assigned to each. The select/rank, MaxDiff and ACBC exercises were all based on the same list of 30 attributes listed in Table 1. All respondents who saw the select/rank questions also saw the MaxDiff questions. Respondents assigned to the ACBC exercise only saw the ACBC exercise.
Intended purchasers (N = 598) from wave 1 who actually purchased a phone over the next 6 months qualified for inclusion in wave 2. They were asked to retrospectively evaluate the importance of each of the 30 features from wave 1, plus 2 additional features, to their actual purchase decision. In total, 105 purchasers were included in the final wave 2 sample.
In terms of demographics, the wave 1 sample was 58 per cent female and 42 per cent male. Respondents were well represented across age groups: 40 per cent were aged 18–34, 40 per cent aged 35–54 and 19 per cent aged 55+. A total of 48 per cent were employed full time, with 13 per cent employed part time, 11 per cent retired, 8 per cent students and 8 per cent self-employed. A total of 54 per cent of respondents were married, with 30 per cent single and 9 per cent divorced. A total of 90 per cent of respondents reported that they are responsible for paying the monthly wireless carrier bills for their household.
The wave 2 subset skewed older and more females but otherwise mirrored the demographics of the full wave 1 sample. Respondents were 64 per cent female, 36 per cent male, with 29 per cent aged 18–34, 48 per cent aged 35–54 and 21 per cent age 55+. A total of 50 per cent were employed full time, with 12 per cent employed part time, 12 per cent retired, 5 per cent students and 10 per cent self-employed. A total of 52 per cent of respondents were married, with 30 per cent single and 12 per cent divorced. A total of 90 per cent reported that they were responsible for paying the monthly wireless carrier bills for their household.
Methods
The objective of this research is twofold: first, to identify the most salient features of smartphones to recent and impending buyers and second, to compare and contrast the results of four methods used to provide these answers. (For an overview of the various methods available for deriving and measuring importance, see Buoye, Keiningham, Williams and Aksoy [2014].)
MaxDiff
MaxDiff, also known as ‘Best-Worst scaling’, is an approach that has been growing in popularity in recent years, especially for situations in which respondents are asked to rate or rank a large number of attributes (e.g., 10–30 attributes). Sawtooth Software, the leading provider of conjoint and conjoint-related software, reports that MaxDiff usage has steadily grown from only 8 per cent of their customers in 2005 to 67 per cent in 2014 (Sawtooth Software, 2014a).
MaxDiff can be thought of as a more efficient extension of paired-comparison scaling (David, 1969). Instead of being asked for their preference between each pair of items in an exhaustive list of combinations (as is done in paired-comparison scaling), in MaxDiff respondents are typically shown up to six items at a time, asked to indicate which is best (or most important) and which is worst (or least important). The task is repeated several times for each respondent, showing a different set of items in each task. Experimental designs are generated by the software to ensure that enough combinations of elements are seen across the sample of respondents to estimate each respondent’s interval scale for ranking the items. The interested reader can refer to the Sawtooth Software Version 8/MaxDiff System Technical Paper and Version 8CBC/HB Technical Paper for more information on the MaxDiff system and hierarchical Bayes modelling (Sawtooth Software, 2013).
In line with the recommendations by Orme (2005), we limited each set of choices to five items, with each respondent seeing 12 sets of choices. Orme (2005) recommends that respondents see each item at least three times, but our design only allowed for respondents to see each item twice. This trade-off was made in the interest of reducing respondent fatigue as the MaxDiff was only one part of a longer survey. The design was constructed such that each of the 30 attributes was seen the same number of times (frequency balance), each item was seen an equal number of times with every other item (orthogonality) and each item was seen as first, second, and so on in the list an equal number of times (positional balance). Answers to the choice sets were then analysed in Sawtooth’s MaxDiff System to estimate utilities for each of the 30 attributes. While the reduction in the number of times each respondent saw an item may cause some instability for individual-level utility estimates, the items are seen enough times and in the proper ratio across respondents to establish robust aggregate-level estimates, which is our primary concern for this investigation. The raw utility scores from MaxDiff may be somewhat unintuitive for the lay reader. For convenience, and to facilitate comparison with other methods, we rescaled individual respondent utilities to sum to 100. These final respondent level scores were then aggregated to provide overall utilities for each attribute, as well as utilities for various segments of customers.
WAR
Aksoy et al. (2016) propose an extension of the WAR power law trans-formation (Keiningham et al., 2011; Keiningham, Gupta, Aksoy & Buoye, 2014; Keiningham et al., 2015) as a method of establishing utilities for key drivers, with respect to their relative importance to each respondent. Respondents are presented with the list of attributes and asked to select those that they considered or will consider in their decision to purchase a smartphone. Respondents are then asked to rank only the attributes they selected as playing a role in their decision.
Using the items selected by respondents as important (note: the order of features was randomized for this question to prevent order effects), the rank assigned to those items and the total number of items selected, we are able to use the WAR to calculate an individual utility (U) for each attribute for each respondent. Thus, the WAR utility for each attribute is calculated in this case as follows:
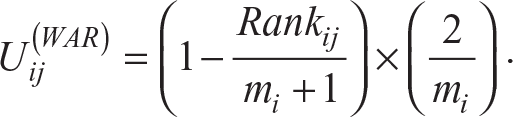
where
m is the number of attributes selected as important/considered;
i is the respondent; and
j is the attribute being scored.
Attributes that were not selected as playing a role in the respondent’s decision are assigned a value of 0. Thus, the scores (i.e., utilities) across all attributes will sum to 1 for each respondent. We then multiplied these scores by 100 so that the WAR utilities range in values from 0 to 100 (similar to the MaxDiff scores).
As in the case of the MaxDiff utilities, the respondent-level values for the attributes were aggregated to determine overall utility scores for each attribute, as well as segment-level utility scores.
Adaptive Choice-based Conjoint
Most choice-based procedures are based on a theory of compensatory decision-making. That is, consumers make mental trade-offs between different features of a product or between features and price (i.e., willing to pay more, will accept a lesser product if the price is sufficiently discounted). ACBC is a relatively new method that was developed to account for (a) some level of non-compensatory decision-making in product choice (e.g., ‘must-have’ and ‘unacceptable’ attributes) and (b) to allow for the inclusion of more factors than are typically feasible in more traditional choice models. The Sawtooth Software version of this approach emerged after the presentation of the Sawtooth Software conference 2006. Compared to MaxDiff, it is used by only about half as many of Sawtooth’s customers (32% in 2014). It is an extension of the more established CBC approach that allows researchers to analyse larger lists of features. The procedure used in this research involved up to 15 screening tasks to determine ‘must have’ and ‘unacceptable’ factor levels, followed by 10 choice tasks per respondent. The same factors used in the MaxDiff analysis were used in the ACBC analysis.
The interested reader can refer to the Sawtooth Software ACBC Technical Paper (Sawtooth Software, 2014b) for more detailed information on ACBC.
Constant Sum Scaling
Constant sum scaling, also known as ‘chip allocation’, is a basic, non-experimental approach for establishing the relative importance of or preference for items in a list. Respondents are asked to assign 100 points across all the items in the list, assigning more points to items with greater importance and fewer points to those with lesser importance. All items are included in the exercise (i.e., we do not first filter for items that were considered), but items that were not considered at all could be assigned a value of 0. The sum of points assigned by each respondent had to sum to 100.
A comparison of the pros and cons of the four methods is summarized in Figure 1.
Summary of Pros and Cons for Each Utility Estimation Method

Correlation Analysis
We compared the results of the different methods using a series of correlation analyses. First, at the aggregate level, we use the Spearman’s Rho rank-order correlation to compare the overall utilities for each attribute across all three methods. Next, we consider the respondent-level correlation (Pearson’s r) of the WAR utilities to the wave 1 MaxDiff utilities and wave 2 constant sum scaling results (ACBC is not included in this last analysis because the ACBC exercise was asked of a separate randomly assigned set of respondents).
Measures
The measures for this study include the average and individual-level utility scores for each attribute (in Table 1) assigned by each of the methods. As described above, all utility scores are interval-level measures ranging from a minimum possible value of 0 (least important) to a maximum possible value of 100 (most important).
Findings
Attribute importance rankings from the exercises in waves 1 and 2 are presented in Table 2.
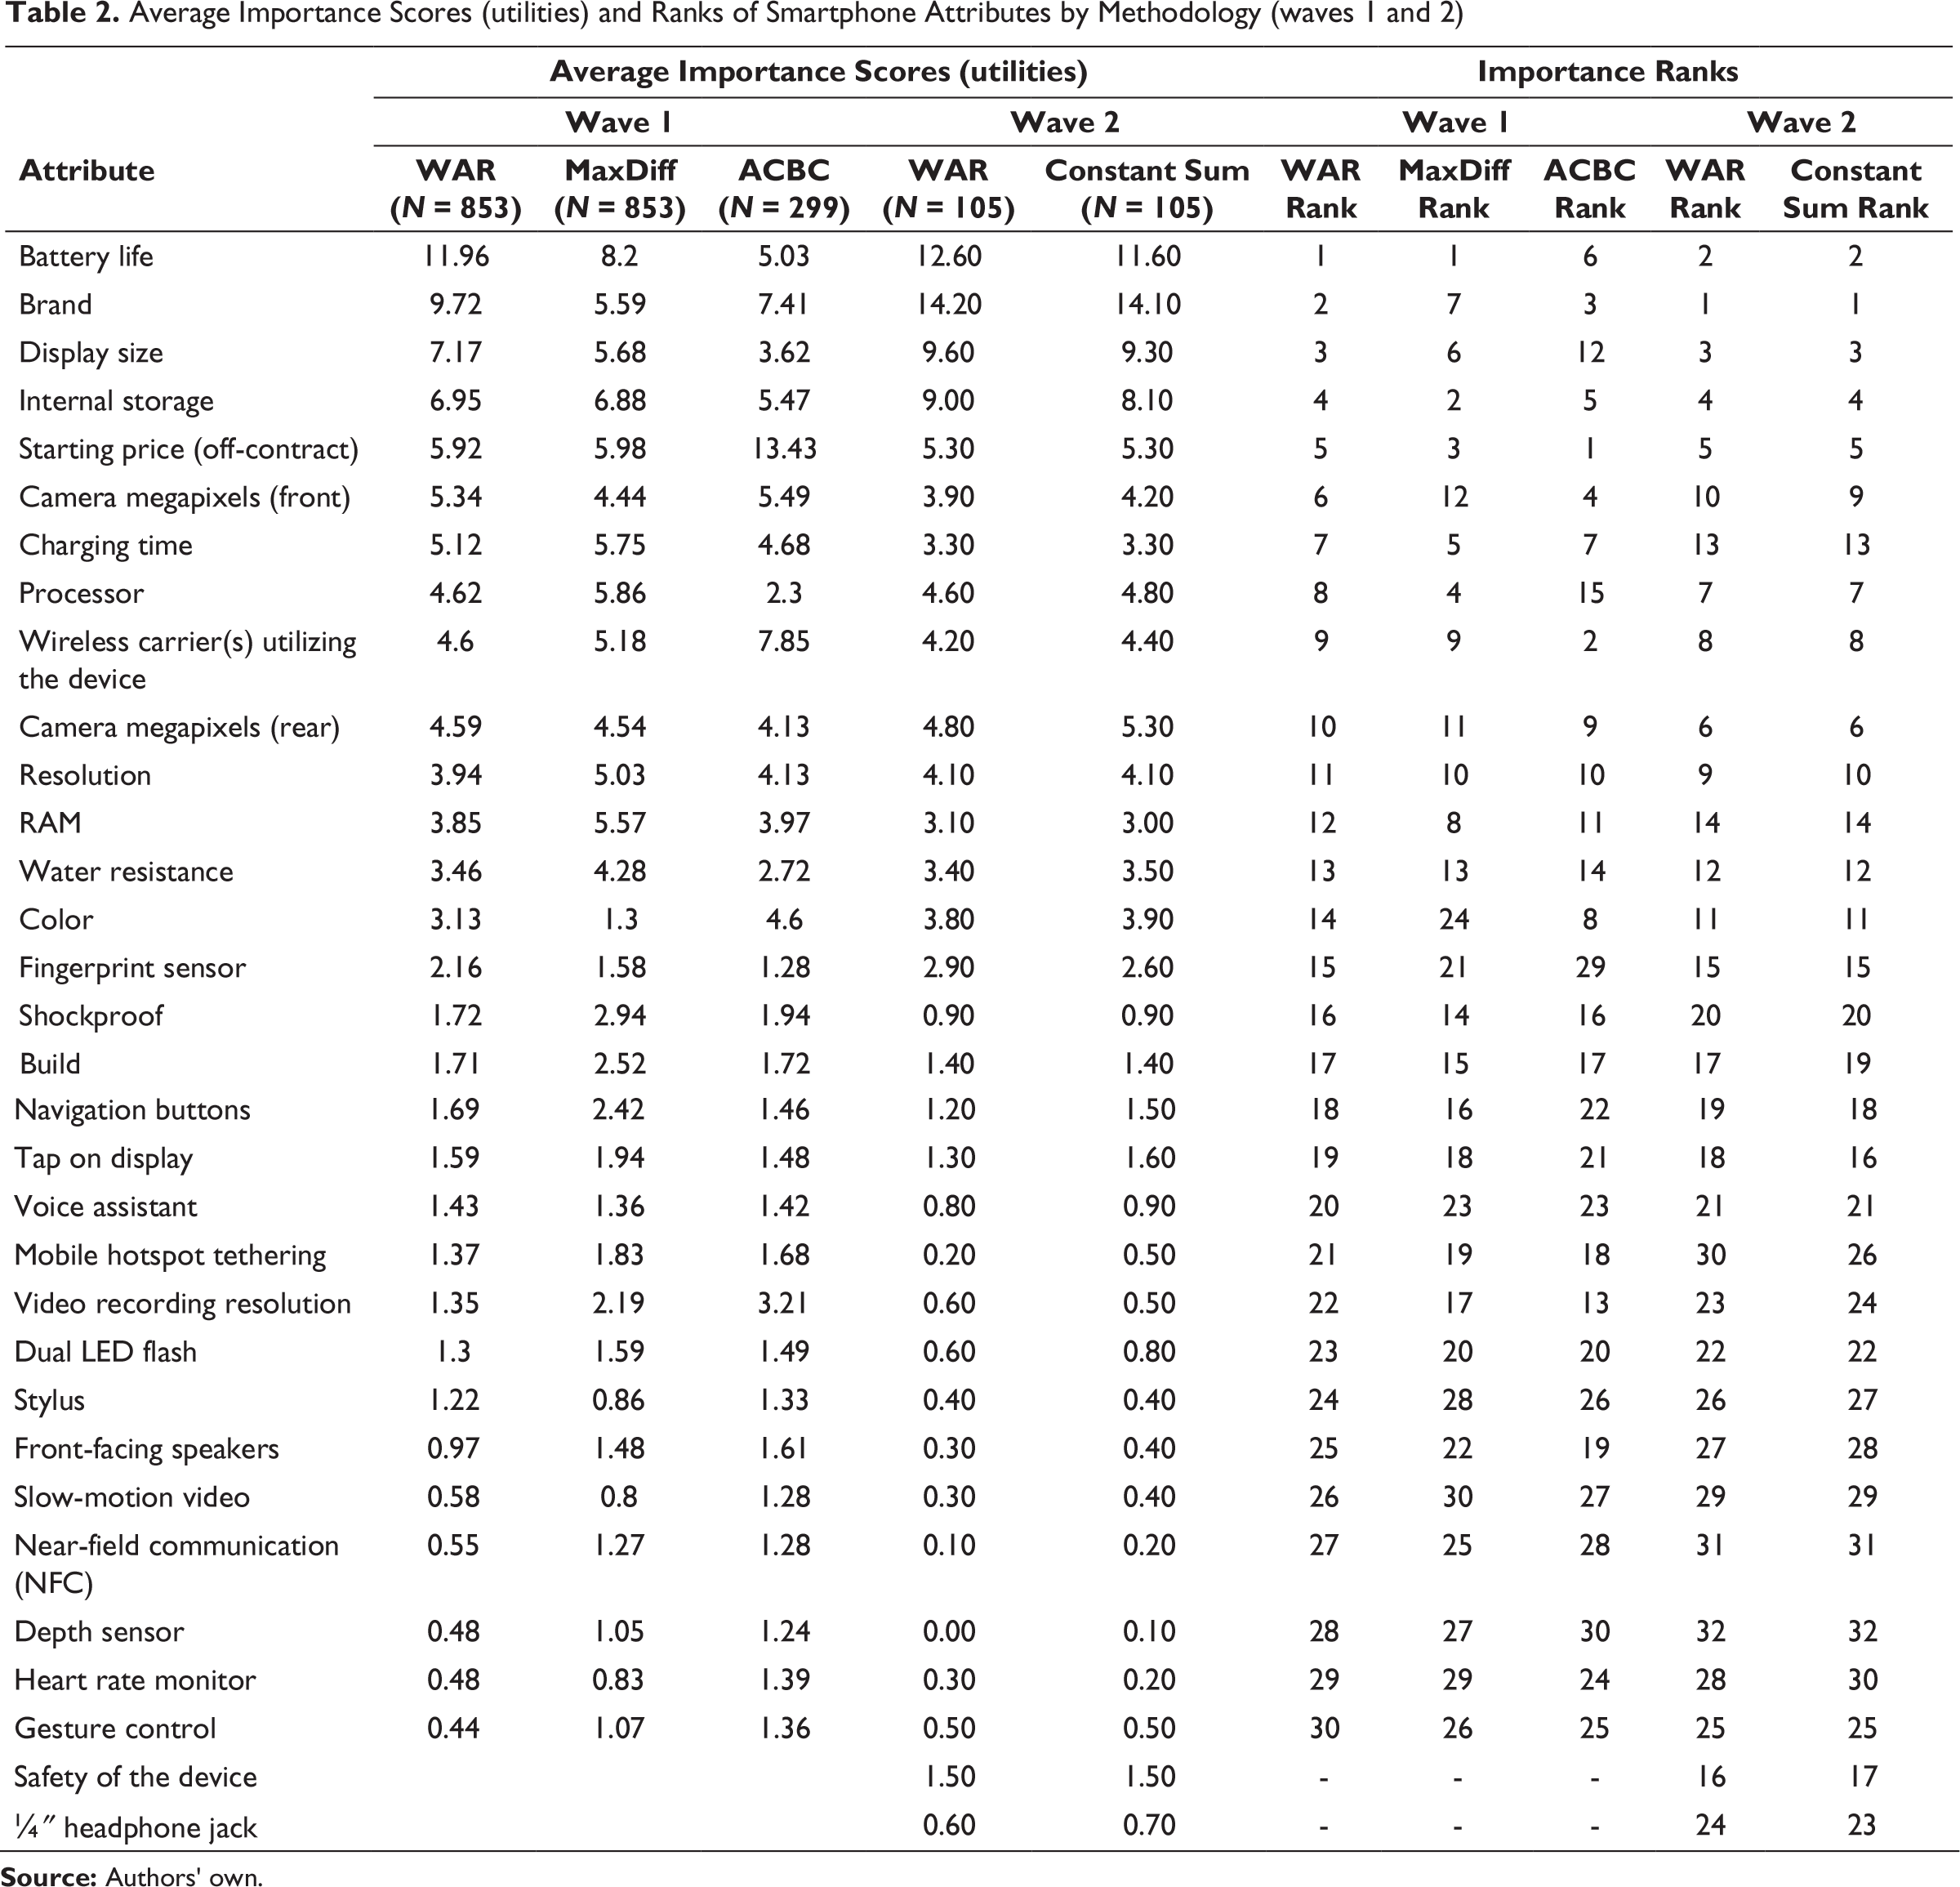
First, we examine the wave 1 findings. While the exact rankings of attributes do not perfectly line up, the three methods produce a great deal of agreement, especially between the WAR and MaxDiff scores. For example, WAR and MaxDiff identify the same top attribute (battery life) and the top 12 (out of 30) attributes are the same, albeit in a different order. ACBC identifies a different top driver (starting price) but again is generally in agreement with the other methods in terms of the most important ‘tier’ of attributes, having 11 of the same top 12 attributes. At the bottom end, the methods also generally agree with WAR and MaxDiff sharing 8 of the same bottom 10 attributes, while ACBC shares 7 of the same bottom 10.
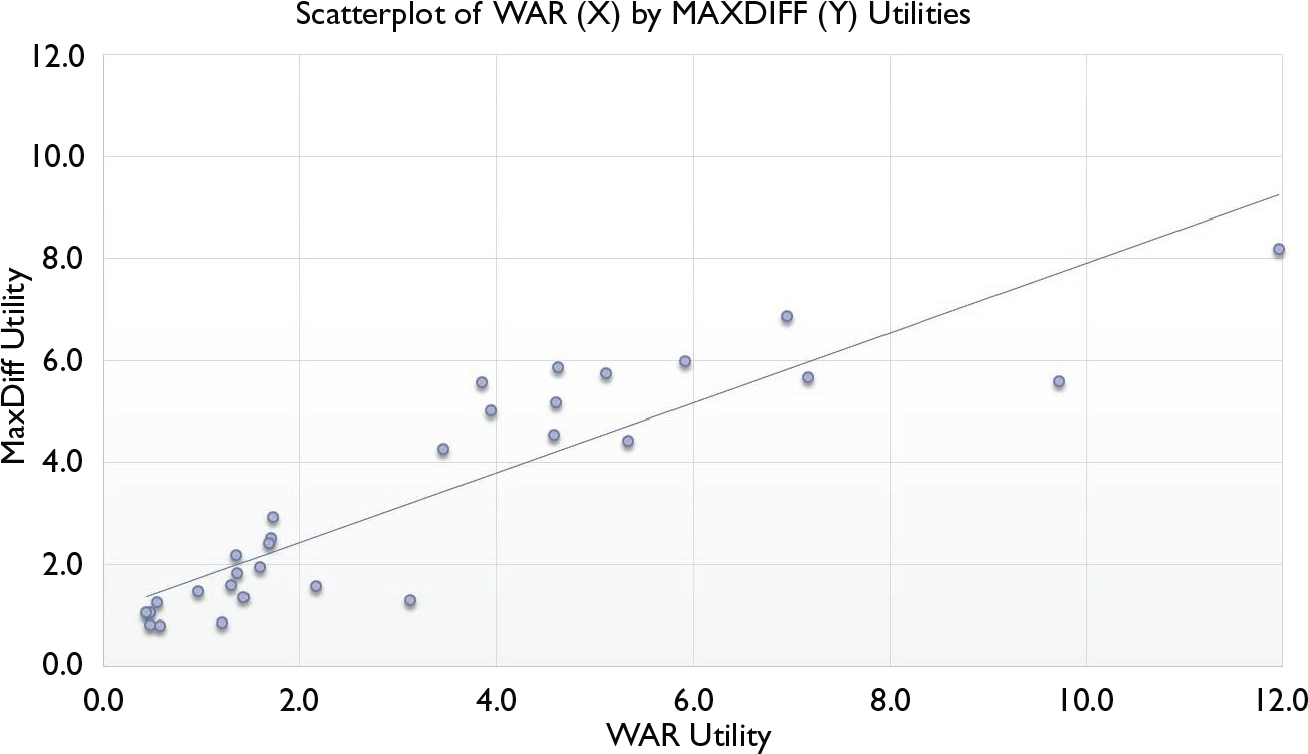
To quantify the level of agreement with respect to ordering of the attributes by the methods, we calculated the Spearman’s Rho (ρ) values for the wave 1 data. Overall, WAR and MaxDiff attribute rankings are correlated at ρ = 0.92 level, while the WAR and ACBC rankings demonstrate a correlation of ρ = 0.85 and MaxDiff and ACBC at ρ = 0.82. Scatterplots visually representing these relationships are presented in Figures 2 and 3.
Scatterplot of WAR (X) by ACBC (Y) Utilities

At a respondent level, however, WAR and MaxDiff scores do not produce the same level of agreement. The correlation of the utilities assigned by respondents to each attribute is positively and significantly correlated but at a much lower level than the average rankings of attributes at the segment and overall levels. The average Pearson’s r for WAR and MaxDiff utilities at the respondent level is only r = 0.20. (Correlation tables are available upon request from the journal or from the authors.) This discrepancy may be due, in part, to some instability in the individual MaxDiff utility estimates from the hierarchical Bayes analysis stemming from respondents only seeing each item twice instead of the typically recommended three times. Also, we did not include any covariates in the individual-level MaxDiff model—opting for the most straightforward, simple version—and it is possible that inclusion of additional covariates could improve the individual-level match.
So while the three methods—and especially WAR and MaxDiff—produce comparable results in terms of ordering the importance of attributes/factors, the value of individual-level utilities vary considerably. As such, WAR and MaxDiff may be used somewhat interchangeably when the objective is to simply rank the importance of product features, but greater consideration needs to be given to which method makes the most sense if one wishes to analyse the individual utility values for each respondent.
The wave 2 data presented in Table 2 allows us to compare WAR to constant sum scaling. Here we find an even greater level of consistency—in fact an almost perfect match with ρ = 0.99. Among the top 15 attributes, the only difference in the rankings provided by the two methods is that ‘Resolution’ and ‘Camera Megapixels (Front)’ trade 9th and 10th place on the list. There is some minor shuffling among the lower ranking items, but the results are substantively identical. Figure 4 provides a scatterplot graphically illustrating this consistency.
Scatterplot of WAR (X) by Constant Sum (Y) Utilities
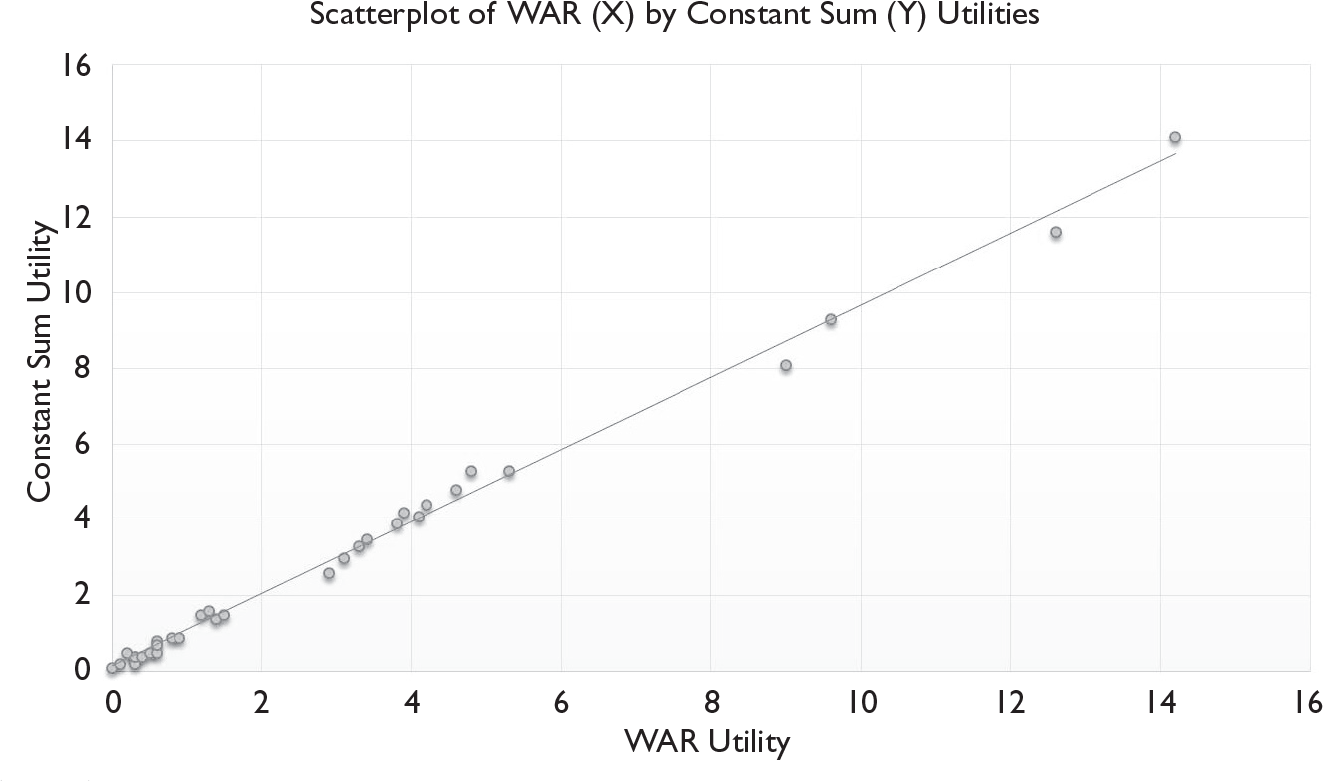
In contrast to the comparison between MaxDiff and WAR utilities, we find that the agreement between WAR and constant sum scaling remains extremely strong at the respondent level. The average Pearson’s r between the WAR and constant sum utilities across all items is r = 0.87, with only 1 of the 32 attributes reviewed, demonstrating a correlation lower than r = 0.65. Thus, not only is the aggregate-level ordering of the attributes very similar, but the quantification of the distance between items on the list by the two methods is remarkably consistent, even when looking at individual respondents. The findings suggest that the WAR approach and constant sum scaling can be used interchangeably.
Discussion and Implications
With respect to the specific example of smartphones presented here, the aggregate wave 1 results of the MaxDiff and WAR analyses are in agreement and make clear where firms producing smartphones need to focus their attention in order to create value for the customer. Battery life is the most important factor to address. However, price also ranks quite high on all lists (#1 for ACBC), so improvements in battery life must be carefully balanced with changes in price.
Other factors that are among the most important include more core features of the phone: brand (which elevated to the top of the list in wave 2), internal storage, processor, display size, charging time. These core attributes are much more important than any of the smaller features like shockproof, voice assistance and so on. The value of the phone to the consumer is still based on the more general functionality of the phone, not the ‘bells and whistles’.
That we are able to arrive at the same substantive insights as MaxDiff with the relatively simple WAR approach may add value for the firms seeking this information, simply because the cost of acquiring this information is less. Simultaneously, more firms may allow customers to participate in determining the optimal product configuration, thereby increasing the value to the consumer as well. Moreover, when dealing with a large number of attributes, customers’ investment in terms of time commitment is greatly reduced when substituting WAR for MaxDiff.
Nonetheless, the ordering among the more important items is not identical, and differences at the respondent level between the two approaches suggest that the two methods may not be measuring exactly the same thing, even if we do arrive at similar aggregate results. Based on these findings, we suggest the following guidelines for the suitability of substituting WAR for MaxDiff: (a) if managers do not have access to the necessary software or requisite expertise in experimental design to execute MaxDiff, WAR is a ‘good enough’ replacement for assessing aggregate-level prioritization, (b) as the number of attributes increases (e.g., 15+), managers should consider substituting WAR for MaxDiff, as the cost savings in terms of overall interview length—both with respect to CPI and with respect to respondent abuse—become more significant and (c) WAR should not be substituted for MaxDiff when respondent-level utilities from MaxDiff exercises are being used in deeper dive advanced analytics such as segmentation or predictive modelling/simulation. This is especially true where legacy processes are in place (as the respondent-level results will surely change).
Where firms are interested in identifying the optimal combination of levels of the factors, however, more advanced and involved methods, like ACBC will still be necessary. Note that neither MaxDiff nor WAR provides utilities for the specific levels of the factors—just for the overall importance of each factor. Of the methods examined here, only ACBC can provide that level of detailed information. In addition, only choice-based models provide the necessary information for simulating trade-offs with price in hypothetical product reconfigurations. As such, this article is in no way an effort to displace ACBC as an important tool in the marketing researcher’s toolkit. Nor is it our position that researchers should abandon MaxDiff. Far from it. Rather, the implication is that if a simpler method can approximate the insights of these advanced approaches, more firms can engage in this type of research, and more customers may participate in this type of research. Moreover, greater customer involvement in the process ultimately equates to greater value for both the customer and the firm.
That the WAR utilities from the wave 2 data align so closely with constant sum scaling results is comforting. Constant sum scaling is a well-established technique and the fact that WAR produces almost identical results at the very least indicates that the thinking behind the new technique is soundly based. At the same time, it raises the question: why not just do constant sum scaling?
It is worth mentioning that the average number of items selected from the list of 30 attributes for evaluation in wave 1 was only 8.24. Among recent purchasers, that average was lower (7.56) compared to those intending to purchase in the next 6 months (9.50). In wave 2, the recent purchasers selected an average of only 6.38 items from the list of 32 attributes. These numbers are consistent with general guidelines typically given for making cognitive demands on respondents with respect to ranking exercises (6–10 maximum, e.g., Vanette, 2015). More importantly, it suggests that asking respondents to evaluate 30 or more attributes especially with the iterative sets in MaxDiff or choice-based exercises wastes a lot of their time. And even asking respondents to consider how many points to assign to attributes that they do not even consider seems, at best, inefficient.
From these numbers, one may draw the conclusion that researchers should just (a) shorten the initial list of attributes or (b) filter the attribute list regardless of which technique is used. Both options are not as simple to apply as it may at first seem. First, with regard to the first point, shortening the overall list ignores the fact that some items are important to some respondents and other items are important to other respondents. Of the list of 30–32 items in this research, there were none that were important to no one. Second, an across-the-board edict to shorten the attribute list assumes that the innovation team knows, a priori, which attributes to drop. By including respondent input, we insure that no good attribute gets left on the cutting room floor. Lastly, WAR and MaxDiff can and should be considered as good tools for early concept development work. By allowing firms to test more items, we are insuring the consumer involvement in the attribute screening process.
With respect to the second point, filtering the list to allow for respondent-level variation in the subset of minimally important attributes is problematic for MaxDiff, as it would require on-the-fly alterations to the experimental design. One certainly could filter the list before asking respondents to allocate points/chips in the constant sum exercise, but at that point, WAR actually becomes the more efficient approach. The WAR approach asks respondents only to rank the items they select. Constant sum scaling implicitly requires them to rank and quantify. If researchers can use a power law to quantify the distance between attributes—with an extremely high degree of accuracy—without asking respondents to exert additional effort in the interview, it makes sense to do so.
Limitations
The analysis presented addresses only one industry. It is possible that the MaxDiff and WAR approaches may produce more divergent results in other industries. Furthermore, the agreement of the experimental methods with WAR seems limited to aggregate views.
The example presented here is focused on product optimization. We have no reason to believe that the technique will not produce similar results when applied to services optimization, but more research is necessary to empirically evaluate that claim.