




Abstract
The consistent distribution of economic value from state-owned companies in Indonesia to both external and internal stakeholders over the long term is crucial as an indicator of company growth. This research aims to demonstrate the influence of stakeholder value on the performance of state-owned enterprises in Indonesia. Using panel data to measure predictor consistency over the long term, the study finds that the data is stationary and cointegration occurs in the long term. The findings are: (a) Government Value positively influences return on equity (ROE) and sustainable growth rate (SGR) but has no effect on return on assets (ROA); (b) Customer Value positively influences ROA but has no effect on ROE and SGR; (c) Social Value has no significant impact on ROA, ROE and SGR; (d) Debt-holder Value negatively influences ROA, ROE and SGR; (e) Supplier Value positively influences ROA, ROE and SGR; (f) Employee Value positively influences ROE but has no effect on ROA and SGR; and (g) Shareholder Value positively influences ROE but has no effect on ROA and SGR. These findings indicate inconsistencies in the impact of stakeholder value on company performance.
Introduction
State-owned enterprises (SOEs) are vital to the Indonesian government due to their role in supporting the economy across several primary sectors and their importance in the global economic arena. However, SOE governance practices in Indonesia remain challenging in terms of building global legitimacy and competitiveness (Apriyantopo et al., 2023; Asnawi et al., 2021; Kartasasmita, 2020). One significant challenge for SOEs is the implementation of activities related to stakeholders and the economic value distributed to them (e.g., operating costs for suppliers, employee salaries/incentives, financial costs, taxes and corporate social responsibility (CSR) costs). Stakeholder conflict or pressure can affect organizational performance. Some studies show a positive influence of stakeholder incentives on performance (Doni, et al., 2022; Wei & Zhou, 2024) and a negative relationship between stakeholders and performance (Bătae et al., 2021; Chen et al., 2023). Economic value is the value the company contributes to all stakeholder elements, known as stakeholder value.
The relationship between stakeholder value and performance in SOEs can be explained by several indicators. For instance, corporate social performance positively affects efficiency (Ho et al., 2022). Conversely, Wang et al. (2022) found that SOEs in China have better environmental performance before privatization compared to post-privatization, and multinational SOEs in China have better governance and environmental performance than social performance (Khalid et al., 2021). Sustainability practices also interest stakeholders, such as CSR programmes (Kobrossy et al., 2022). This process helps explain convergence or divergence in CSR activities, as institutional theory suggests that decision-making is largely determined by the legitimacy of the organization and its institutional system and ownership (Ang et al., 2022; Chabowski et al., 2023).
Previous empirical research has often used only a few indicators of stakeholder value and their impact on company performance. This article measures each stakeholder value group and its impact on company performance and sustainable growth rate (SGR), which has not been widely explored. This disclosure is important to show that SOE practices in Indonesia benefit their stakeholders and enrich stakeholder and institutional theory.
Literature Review
Institutional Theory
Institutional theory, which explains organizational behaviour, states that organizational success is a function of conformity with the institutional environment (Greenwood & Meyer, 2008; Powell & Colyvas, 2008). It also explains stakeholder involvement and complexity. In line with Risi et al. (2023), stakeholder interactions in CSR implementation are largely determined by institutional structures and interactions between the business world and society (Ramdhan, 2022). Different institutional norms for state-owned companies in various countries can exert internal pressure on stakeholder interests and produce different performance outcomes. Potential conflict arises when the boundaries between the ownership structure of SOEs and the government are unclear, affecting stakeholder freedom (Niyommaneerat et al., 2023).
Stakeholder Value and Firm Performances
Stakeholder theory explains the relationship between a company and its stakeholders in terms of sustainability expectations. Studies by Khuong (2022) and Freeman et al. (2021) that a company’s responsibility extends beyond shareholders and their financial measures. Stakeholder integration and orientation towards sustainability positively impact performance (Danso, 2020).
This includes the moral responsibility to fulfil stakeholders’ claims. Stakeholders can be categorized into external and internal groups. External stakeholders include consumers, suppliers, specific communities, society and the government. Internal stakeholders consist of employees, managers and investors or shareholders. The stakeholder approach aims to balance conflicting claims from various stakeholders, including managers, employees, shareholders, suppliers, vendors and managers making decisions to meet these interests.
Government Value and Performance
The government plays a crucial role in SOEs due to its ownership and as a source of financing. The economic value contribution to the government is recorded in the company’s sustainability report, which includes tax components and other payments, in addition to dividends. The relationship between SOEs and the government can involve tax incentives that specifically reduce costs and improve company performance. Several studies have shown that taxes influence the SGR (Neog, 2020). Furthermore, environmental tax burdens on companies can increase tax expenses and costs, leading to reduced firm performance (Li, 2022; Long, 2022). This contrasts with the findings by Fuadah (2022) and Khuong et al. (2020), who demonstrated that tax avoidance positively affects company performance.
H1: The higher the contribution of economic value to the government (in terms of taxes), the higher the financial performance and SGR of SOEs.
Customer Value and Firm Performance
Customer value can enhance company performance as the company improves its services to achieve customer satisfaction and loyalty (Özkan, 2020). Increasing customer value impacts the company’s competitiveness and market share. Customer value represents the economic vsalue distributed for marketing activities and the costs incurred to enhance customer service as sales expenses. Several researchers have demonstrated the positive impact of sales expenses, including marketing costs, development and administrative expenditures, on performance and growth (Jaisinghani et al., 2020; Markovitch et al., 2020). However, Lee and Wei (2023) show that marketing expenditures have a significant negative impact on firm performance.
H2: The higher the marketing and sales expenses, the higher the financial performance and SGR of SOEs.
Social Value and Firm Performance
The value for the community is reflected in the extent of CSR expenses incurred by the company. Several studies have shown that a company’s responsibility towards the community through CSR can enhance performance through brand image and reputation (Suharman, 2022). Some studies have found a positive influence of CSR on firm value (Guo, 2020; Khuong, 2022). However, there is still empirical evidence that CSR has a negative impact on firm performance. Various arguments demonstrate the positive impact of CSR on company performance, such as the concept of CSR employee engagement, which has a positive impact on firm value (Acharyya & Agarwala, 2022; Enalpe, 2022). Arguments against CSR having a negative impact on performance and firm value include weak CSR planning and strategy and a negative relationship with CSR commitment (Bartov et al., 2021; Cao et al., 2023).
H3: The higher the CSR expenses, the higher the financial performance and SGR of SOEs.
Bondholder Value and Performance
Bondholders contribute to the operational and investment funding of the company. The value for bondholders lies in the company’s obligation to fulfil their immediate obligations. The proxy for bondholder value is the distribution of economic value in the form of the cost of debt for the company or bondholder return. Several studies have shown that the cost of debt has a negative impact on ESG scores and performance (Amiraslani et al., 2023; Apergis et al., 2022). Some researchers have shown a negative relationship between the cost of debt and firm performance, where a high cost of debt leads to financial risk and market value (Gao et al., 2022; Soda et al., 2021). The relationship between the cost of debt/financing is also an implication of capital structure decisions. A high debt-to-equity ratio has a negative impact on financial performance.
H4: The higher the cost of financing, the lower the performance and SGR of SOEs.
Employee Value and Performance
The relationship between the value for employees/managers and firm performance is that employee/manager involvement in the company enhances productivity. Increased productivity can be achieved through training or skill development (Mahmood, M., et al., 2023) and improving the effectiveness of employee learning, which has a positive impact on firm performance (Ko et al., 2022). A good working environment and fair compensation can increase employee/manager satisfaction, thereby enhancing work motivation and productivity (Liang et al., 2023; Liu, Dang et al., 2023). Several studies have shown that increased compensation impacts firm performance (Kim & Jang, 2020; Purwati et al., 2023). However, some research indicates that the relationship between employee/executive compensation and firm performance is U-shaped, where compensation has a positive effect on performance in the short term but becomes unfavourable for long-term performance (Ferry et al., 2023).
H5: The higher the distribution of economic value for employees/managers (compensation), the higher the financial performance and SGR of SOEs.
Supplier Value and Firm Performance
The value for suppliers is the benefits perceived by suppliers from buyers. This allows both parties to achieve a win-win solution within the supply chain and obtain financing as a competitive resource (Bal & Pawlicka, 2021). Strengthening and maintaining continuous relationships with suppliers can enhance bargaining power. Increased bargaining power for companies can enhance competitiveness (Chang, 2022; Koo, 2022). The relationship between buyers and suppliers creates value for companies to improve financial performance (Hsu et al., 2022). The value contribution to suppliers is the operational costs incurred by the company (Pehlivan et al., 2020). This approach is relevant to the economic value received by suppliers and their value chain.
H6: The higher the distribution of economic value for suppliers, the higher the profitability and SGR of the company.
Shareholder Value and Performance
Shareholders are the primary stakeholders in a company who invest capital for long-term returns in the form of dividends or capital gains. The value for shareholders in this study is approximated by the dividend policy in the form of cash dividends. Dividend policy has a positive impact on return on assets (ROA), return on equity (ROE) and firm value (Bossman et al., 2022; Kim et al., 2021). However, Susanti et al. (2021) indicate that the dividend payout ratio in Indonesian SOEs does not affect profitability. In line with Yan et al. (2023), SOEs in China with a high level of large shareholders weaken corporate governance and negatively impact performance.
H7: The higher the dividend payment, the higher the financial performance and SGR of SOEs.
Research Method
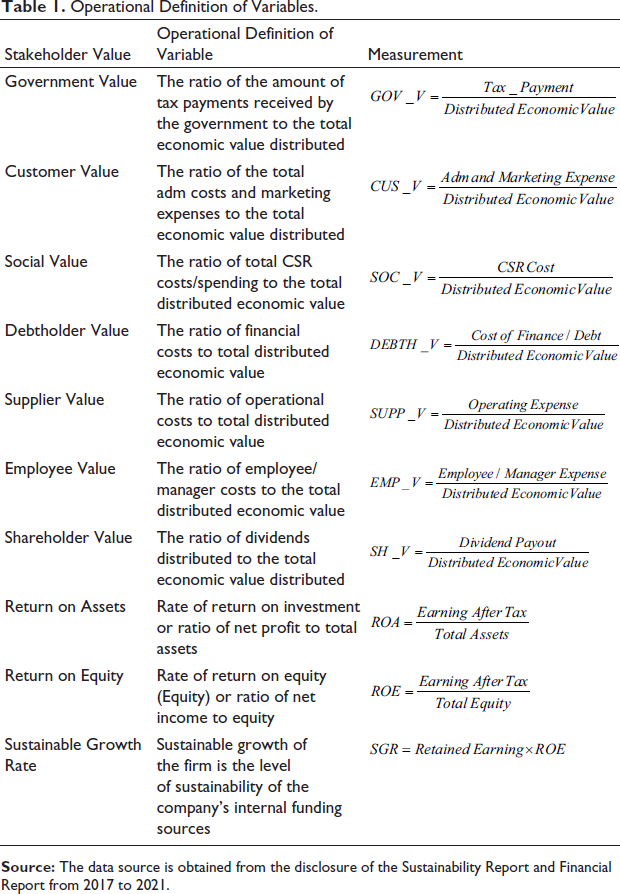
This study adopts an explanatory research design to investigate the relationship between stakeholder value and the firm performance and SGR of Indonesian SOEs. The research sample consists of 38 SOEs, utilizing a panel data approach, covering a period of 5 years from 2017 to 2021. A static data test was carried out using the first-generation root test and cointegration (Cao et al., 2024; Li et al., 2024). If the data is not stationary and not cointegrated, then the resulting regression is a false regression (spurious regression). The value for each stakeholder value component is shown in Table 1, using measurements documented in the sustainability reports of state-owned companies in Indonesia.
Operational Definition of Variables.
Results and Discussion
Stationarity Test
Stationarity testing of each variable using the Augmented Dickey–Fuller test statistic obtained a t-test value and probability smaller than the value α = 0.05, meaning that all data at level or I(0) using the intercept (constant) was stationary (Liu, Salman et al., 2023). If the data contains the unit, it will experience a random walk or not be stationary. The stationary test is shown in Table 2, which explains that all variables show stationary data as random data does not contain unit roots. Stationary data has (a) a fixed data probability distribution that does not change over time; (b) autocovariance of the data does not depend on time; and (c) the average value of the data remains constant. This is evidence that panel data has a constant data distribution, thus allowing predictions of future behaviour of a phenomenon with a higher level of confidence.
Stationarity Testing of Panel Data.

Cointegration Test
The cointegration test is useful for ensuring that the data used has a long-term relationship (cointegrated) (Liu, Salman et al., 2023). The results of data cointegration testing using the Johansen test obtained a trace statistics value of 367.9135 > critical value = 285.1425 with probability = 0.0000 < α = 0.05, so Ho is rejected. This means that all data variables are cointegrated in the long term, as shown in Table 3. This is proven by the fact that there is no correlation between errors (absolutely none), at most 1 (at most there is one error correlation), at most 2 (at most 2 errors are correlated), at most 3 and so on.
Cointegration Test.

The results of the stationarity and cointegration tests imply that the Multivariate General Linear Model analysis can be continued. The generalized linear mixed model (GLMM) method has met the robust test by testing Pillai’s Trace, Wilks’ Lambda, Hotelling’s Trace and Roy’s Largest Root models for each predictor, and testing the model with a significance F test of ≤0.005.
Descriptive Statistics
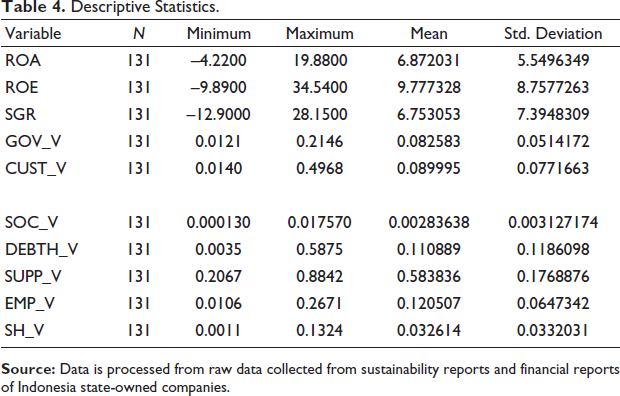
Descriptively, it shows that the contribution to external stakeholder value is the lowest for social value in the form of costs incurred for the community and CSR programmes, averaging only 0.28 per cent of the total economic value obtained by state-owned companies, followed by government value with an average of 8.25 per cent in the form of taxes. Customer value averages 8.99 per cent in the form of administrative and marketing costs, shareholder value in the form of dividend payouts received by shareholders averages 3.26 per cent, debtholder value in the form of cost of debt paid on company loans averages 11.86 per cent, and employment value in the form of salaries/incentives for employees and managers averages 12.05 per cent, which is quite good. Meanwhile, the largest contribution to supplier value, on average, was 58.38 per cent, in the form of company business transactions. This description is proof that the company’s social legitimacy is still relatively low, the interests of bondholders are greater than shareholders even though ROE is greater than ROA, and the contribution to taxes is still relatively low, below 10 per cent. The performance of state-owned companies for average ROA is 8.87 per cent, average ROE is 9.77 per cent with an average SGR of 7.39 per cent, and among state-owned companies there are still negative ROA, ROE and SGR, each for ROA is –4.22 per cent; ROE was –9.89 per cent and SGR was –12.9 per cent. Even though several pieces of literature have shown that stakeholder orientation is a sustainability goal, there is still an imbalance between the interests of the company and shareholders, which is indicated by debtholder value being much greater than shareholder value, while employee/manager incentives have contributions greater than those of bondholders. A detailed description of the company is shown in Table 4.
Descriptive Statistics.
The testing of the GLMM model can be indicated by the coefficient of determination, where Model I has an R-squared of 0.328, meaning that the predictor variables can explain 32.8 per cent of the variability in ROA. Model II and Model III have R-squared values of 36.5 per cent and 28.8 per cent, respectively. The estimated parameter coefficients for each dependent variable, ROA, ROE and SGR, are shown in Table 5. It reveals that not all independent variables impact the financial performance of the company. The predictor variable DEBTH_V has a negative impact on all three financial performance measures, while CUST_V does not impact the three financial performance measures. Meanwhile, the variable SOC_V only impacts ROA, and GOV_V only impacts ROE and SGR.
Parameter Estimation of the Effect of Stakeholder Value on Company Financial Performance.
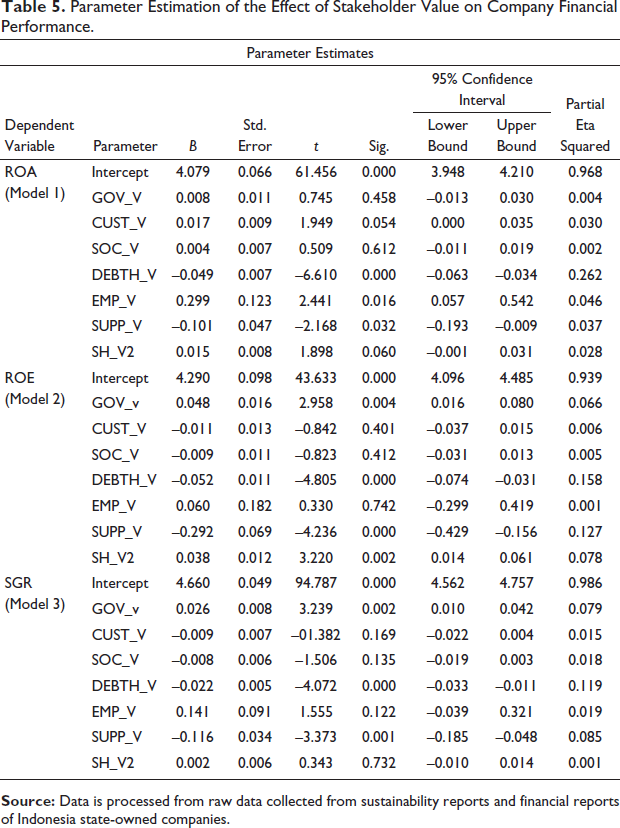
Stakeholder theory states that the sustainability of a company is the objective of each stakeholder component. It is found that Government Value has a positive impact on ROE and SGR, but it does not impact ROA. The influence of taxes on ROE and SGR can be explained by the relationship between tax rates and capital structure, where tax avoidance serves as an accounting discretion to determine the capital structure and benefit shareholders. Companies that receive tax incentives tend to extend the maturity of their debt payments, which affects the capital structure and increases free cash flow and real earnings management.
Customer value impacts ROA but does not affect ROE and SGR in Indonesian SOEs. Increased customer service through marketing expense allocation leads to higher company performance, although some studies still show a negative relationship between marketing expenditure and performance, with no impact on sustainability (Lee & Wei, 2023).
Regarding social value, reflected by CSR’s impact on performance, this study finds no significant effect on ROA, ROE and SGR in Indonesian SOEs. Therefore, CSR has not yet become a consideration in determining the financial performance and sustainability of the company. This can be explained by the fact that the relationship between CSR and performance goes beyond CSR strategies and governance, which were not examined in this study. In line with institutional theory, organizational decisions are largely determined by the interaction between institutions and their social environment.
Bondholder value refers to the benefits received by debtholders from SOEs. In this study, the cost of financing or the cost of debt allocated by the company from the distributed economic value to all stakeholders was used. The research findings demonstrate that the cost of financing has a significant negative impact on ROA, ROE and SGR. The higher the cost of debt, the lower the cost of equity, which in turn affects the lower ROE and SGR.
Employee value is crucial for companies because the contribution of value to employees can enhance motivation and work productivity. This research proves that employee value has a positive impact on ROA and does not affect ROE and SGR. However, supplier value is a key factor in business transactions. Consistent and long-term relationships between buyers and suppliers can enhance company performance. Long-term relationships can be utilized for financing chains, efficiency and strong bargaining positions to enhance competitiveness.
Shareholder value, as the main stakeholder, receives returns in the form of dividends. There is still ongoing debate regarding the impact of dividend payments on company performance. This research demonstrates that cash dividend payments have a positive impact on ROE and SGR but do not affect ROA. Companies with higher free cash flow tend to make dividend payments, resulting in higher ROE and SGR.
Conclusion and Implications
Stakeholder value of SOEs has been extensively discussed in this study because they play a significant role in the country’s economy and compete in the global market. The research findings confirm the acceptance of hypotheses where several stakeholder value variables have different impacts on financial performance measures and shareholder value. This highlights practical implications for SOEs in Indonesia to enhance CSR performance and improve their responsibilities towards employees and managers. These findings also provide theoretical implications for enriching stakeholder theory in the context of internal and external stakeholders in the case of SOEs in Indonesia. Balancing the fulfilment of stakeholder interests requires normative rules and standards to guarantee social legitimacy. The integration model of stakeholder theory and institutional theory will enrich future research, allowing researchers to test institutional rules and compliance for the interests of stakeholders.
