



Abstract
This article puts forward the notion of socio-technical resistance with an application to the regulation through performance indicators in the water sector. Governance failures are mainly explained by concentrating on governance design, considering regulation as a set of control mechanisms. We propose an alternative perspective by putting the emphasis on socio-technical resistance to take into account both human and non-human actors in the governance process. We observe the misuse of performance indicators by local actors in urban water systems in Europe to highlight the empirical significance of socio-technical resistance. Results support that socio-technical resistance is frequent and reduces significantly the reliability of the information gathered through performance indicators. Drawing on a new typology of resistance, we show socio-technical resistance is a dynamic combination of cognitive, interpretative, territorial, strategic, technical and structural factors. These results and the proposed notion underline a crucial limitation of public policies and regulation in the process of policy-instruments implementation and compliance. Empirically, it reveals particularly relevant to provide new insights on New public management and performance-based regulation, where measurement are crucial.
Since the 1980s, public utilities in Europe have been going through a phase of re-regulation and modernisation with the goal of improving the quality of public services and the efficiency of their provision. New public management and organizational economics have inspired this modernisation (Bolognesi, 2018; Finger and Kunneke, 2011; Ménard and Ghertman, 2009). The reform typically mixes administrative control and incentives, and performance indicators are a core aspect of the monitoring process (Gerrish, 2016; Pollitt, 2013; Speklé and Verbeeten, 2014). Sector studies have focused on energy (Finon and Pérez, 2007; Saussier, 2000), health (Bevan and Wilson, 2013), then more recently on water (Bolognesi, 2014; Lieberherr and Fuenfschilling, 2016; Witte and Saal, 2010).
Most explanations of regulatory failures are functionalist (Lewis, 2015), focussing on incentives, transaction costs and implementation mechanisms (Bajari and Tadelis, 2001; Cunningham and James, 2017; Spiller, 2013). This literature argues the existence of information asymmetries and strategic behaviours cause regulation failures (Laffont and Martimort, 2009; Spiller, 2013). It obscures the intertwinement of social and technical components in utilities (Fuenfschilling and Truffer, 2014) even though that intertwinement is essential to utilities management and therefore likely to contribute to regulation failure (Callon, 1990; Lewis, 2015; Renou and Bolognesi, 2018). In this paper we aim to provide a more comprehensive understanding of regulation failures by setting aside functionalist approaches and taking into account the socio-technical dimension.
The paper focuses empirically on performance indicators allowing us to consider a central instrument of utilities modernization. Performance indicators should reduce information asymmetries and contribute to aligning stakeholders’ preferences with the objectives of public-sector policies (Laffont and Martimort, 2009). In addition, this focus links our results with on-going research on New Public Management and performance management (Gerrish, 2016; Lieberherr and Fuenfschilling, 2016; Pollitt, 2013; Pollitt and Bouckaert, 2017; Renou, 2017). New Public Management and the regulation of performance management implicitly assume that the gathered information about performance indicators is of good quality (Lascoumes and Le Galès, 2007, Lewis, 2015).
Previous studies of performance management in utilities have mostly examined its impact and stressed the likelihood of failures due to human actors' behaviors and non-compliance, primarily through strategic practices such as rent-seeking (Bolognesi and Pflieger, 2019; De Witte and Marques 2012; Lewis, 2015; Pollitt, 2013). For example, performance indicators may be manipulated. These behaviours can be conceived as resistance (Mumby, 2005; Thomas and Davies, 2005). The resistance literature explains how micro-politics, i.e., intentional behaviour, affects the functioning of the organization and is consequently relevant to identify regulatory failures. But, it does not take into account the very nature of utilities that mix social and technical features (Callon, 1990; Künneke et al., 2010).
Our research suggests that intentional resistance by human actors is only part of the story. The intertwinement of social and technical elements of the system means that resistance to performance management is also socio-technical. We therefore propose the notion of socio-technical resistance (STR) to take into account this intertwinement. By 'socio-technical resistance', we mean human and non-human-processes that limit the functioning of an organization, e.g., policy instrument implementation and compliance. Using the case of performance indicators in the French water utilities, this article argues that socio-technical resistance limits the efficiency of regulation by producing differences between the reported indicators and the actual performance of the system that are not only a consequence of human characteristics, e.g., opportunism or bounded rationality, but also involves non-human elements, e.g., administrative fragmentation or technical characteristics of assets.
We propose and define the notion of socio-technical resistance (STR) to extend the notion of resistance to include non-human actors (Callon, 1990; Latour, 1990; Mumby et al., 2017). At this stage, we include most of the technical failures within STR notion. Firstly, ‘accidental’ failures, e.g., pipes breaking, are not necessarily random, e.g., the laying of pipes. Secondly, from the perspective of theory building, this encompassing conceptualization can be consistently sharpened in future research according to empirical The concept of STR emphasises that resistance is not solely about power and intentional actions against regulation. Socio-technical resistance is intrinsic to any socio-technical system. It is embedded in the behaviour of human and non-human actors and mediates the implementation of, and compliance with, regulation. It manifests in discrepancies between actors’ practices and regulators’ prescriptive norms (technical, social and political) in the use of public policy instruments. As a consequence, it reveals the failure and lack of willingness to comply with regulatory requirements.
The STR notion expands existing understanding of resistance in two ways. Firstly, it includes interaction between human and non-human actors into the scope of analysis (Callon, 1990; Latour, 1990; Müller and Schurr, 2016). This is of paramount importance as technological and technical components are central to most of human activities. Secondly, while the literature shows the significance of resistance in everyday activities it mostly focuses on the micro-resistances specific to a given actor within an organization. It considers cultural motivations as a cause of resistance, like the positioning within managerial discourses for instance (Mumby, 2005; Mumby et al., 2017) and sees resistance as an intentional action that comes from value conflicts between actors and governance modes (Mumby et al., 2017; Saurugger and Terpan, 2016; Thomas and Davies, 2005). The value conflict is grounded in economic, social or ethical considerations (Fleming, 2016). By including non-human actors and passive STR, we can consider implementation failures and non-compliance that do not manifest exclusively through actors’ struggles (Fleming and Spicer, 2008; De Holan, 2016) but also from actors’ interactions with their context, e.g. politics, technical components, and administrative organization (Le Bourhis and Lascoumes, 2014). In sum, STR arises not only from individual components of the system but also from the interactions of groups of components. A perspective based only on individual components is likely to be misleading: the systemic dynamic could be different from the aggregation of component dynamics. For instance, Bolognesi (2014b, 2018) emphasizes this discrepancy in the case of the modernization of European water systems.
STR offers a systemic understanding of resistance providing analytical tools for a more realistic political perspective on regulation (Lewis, 2015). STR allows the identification of unintended and undesirable consequences of performance indicators, and offers a more accurate appraisal of this mode of governance and its alternatives. With this in mind, we carried out a field survey from 2011 to 2013 at the Communauté de l’Eau (Water Community), a federation gathering local communities and water services managers involved with water management in the Grenoble urban area (Brochet, 2017). This gave us access to the raw data used by water utilities to generate the performance indicators. To estimate socio-technical resistance, we measured the difference between reported performance indicators and performance indicators as recalculated by us, using the same raw data. This research gives three outputs:
a typology of socio-technical resistance (theoretical result) a quantitative assessment of socio-technical resistance (empirical result) a qualitative assessment of socio-technical resistance (empirical result)
The article is divided into five parts. We first review the literature on performance measurement and performance indicator implementation in the French water sector, and then turn to resistance in the second part. Subsequently, we present our assumptions and analytical frameworks of socio-technical resistance. Once we have presented our methodology (part 3), we will describe our results (part 4). They show that local forms of socio-technical resistance are significant in both their amplitude and their diversity. Finally, we discuss possible generalization and contribution to the existing literature (part 5).
Theory and hypotheses
Performance reporting issues: Stressing the room for socio-technical resistance
The regulation of public utilities faces the principal-agent problem (Laffont and Tirole, 1993; Ross, 1973). Service providers have private information that is unknown by the regulator, like the current level of investment. Consequently, regulators cannot accurately control the quality and efficiency of service provision. For instance, the regulator of the water sector in the UK (Ofwat) realized ex-post a dramatic under-investment in water utilities despite its signals and supports to private operators. Underinvestment caused majors problems, including shortages during the Yorkshire drought of 1995 (Bakker, 2000). Ofwat enacted a new regulation that defined excess profits. Shleifer (1985) proposes yardstick competition as a method to develop benchmarking to limit impacts of these asymmetries of information. Yardstick competition was set to regulate local monopolies. It consists of a third party, e.g., an autonomous regulatory agency, comparing the existing local monopolies with their characteristics of functioning (costs and organization mainly) and quality of delivery (often through the price). Then according to this benchmark, incentives are set and adjusted to organize the sector and avoid monopolistic rents. 1 Numerous studies investigate yardstick competition focusing on its efficiency (Le Lannier and Porcher, 2014; Romano and Guerrini, 2011) as well as impacts on service providers’ behaviours (Chong and Huet, 2009).
Performance indicators come from a ‘softer’ form of benchmarking, called sunshine regulation or “naming and shaming”. These instruments support the monitoring of services by pointing out bad and good practices. It uses the reputational effect to incentivize utilities to perform better. For instance, if a water utility reveals that it is performing poorly, users could put pressure on local authorities to improve the quality of the public service. This could lead to the readjustment of contracts with the operator or, in extreme cases, to changing the operator. Performance indicators contribute to the enforcement aspect of the modernization of public services, putting into practice New Public Management principles (Baldwin and Black, 2008; Bolognesi, 2018). As a consequence, their use has increased dramatically worldwide over the past two decades.
Empirical research suggests that the impacts of performance measurement on service performance itself have been small on average (Gerrish, 2016; Witte and Saal, 2010), despite the observed proliferation of performance indicators. In most cases, performance indicators are reported by service providers and not measured directly by the regulator. Disclosed performance could be therefore be erroneous (Sutinen and Kuperan, 1999; Talbot, 2010), which may help to explain why empirical assessments are cautious in their conclusions. We propose to address the role of non-compliance in the reporting of performance indicators. Significant non-compliance may indicate the existence of socio-technical resistance (STR).
From our perspective, STR underlies socio-technical systems and mediates practices in the implementation of policy instruments and compliance with regulation. We focus on performance indicators as a policy instrument (Lascoumes and Le Galès, 2007). Because of STR, we expect a deviation in performance assessment due to reporting practices (calculation and transmission of results). Our first hypothesis is: H1: Performance indicators suffer from frequent and significant deviations in reporting.
Socio-technical resistance in performance measurement: A systemic perspective
Performance reporting deviations contribute to a performance paradox (Pollitt, 2013; Van Thiel and Leeuw, 2002): a given performance measurement loses accuracy and discriminatory power over time. It eventually becomes obsolete because measurement no longer helps in identifying reliable services from others (Pollitt, 2013). The performance paradox focusses on the design of the management, and empirical investigations look for relationships between design and performance (Verbeeten, 2008). Besides design, the relationship between service providers and performance reporting could contribute to the understanding of the misuse of performance indicators (McAdam et al., 2005).
Institutional analyses emphasise the social and political aspects of performance management (Lewis, 2015; Modell, 2009). In that respect, Modell (2009) highlights a need for further micro-analyses to understand how stakeholders put into practice performance measurement and management, this should give understandings of failures in this mode of governance (Howlett, 2009). As an illustration, Renou (2017) shows a misalignment between the technical infrastructure, the cognitive model and the management philosophy in the use of performance indicators in the French water sector. This misalignment results in difficulties for operators to produce and disseminate appropriate performance indicators. 2 It highlights that it is the interaction of human and non-human actors that produces the governance failure, i.e. a deviation in reporting (as in hypothesis 1).
Actors’ practices are not the only source of deviation in performance indicator reporting. The technical characteristics of the services and the underlying “philosophy” of the indicators are sources of deviations as well (Renou, 2017). A governance system involves institutions, values, interests, actors’ strategies and technical assets and policy instruments, like performance indicators, are part of this system (Lascoumes and Le Galès, 2007; Lewis, 2015; Wesselink et al., 2013).
In our definition, socio-technical resistance results from the interaction of multiple components of one system, i.e. human and non-human actors, and may be active or passive. Consequently, we expect STR to be a mix of redundant factors that drive policy instrument implementation and compliance with regulation. In the case of performance indicators, these redundant factors include opportunism, measurement issues and misunderstandings of the calculation. In addition, we expect this mix of factors to change over time because each system evolves and transforms (Fuenfschilling and Truffer, 2014; Geels, 2010; Renou and Bolognesi, 2018).
3
Our second hypothesis therefore seeks to grasp the content of STR: H2: Socio-technical resistance is a changing and entangled mix of diverse types of resistances.
A typology of socio-technical resistance
In the French water sector, the rate of reporting of performance indicators remains low, but there is no clear understanding of why and how stakeholders use this regulatory instrument (Renou, 2017). We offer a typology to delineate the main dimensions of socio-technical resistances. It allows us to identify the main triggers causing deviations occurring during the process of performance indicator reporting by water services, in comparison to the actual performance. The typology relies on the literature of socio-technical regimes (Fuenfschilling and Truffer, 2014; Geels, 2004; Smith et al., 2005) and actor-network theory (Callon, 1990; Latour, 1990; Müller and Schurr, 2016). In that perspective, practices depend on technologies, knowledge, and culture. Consequently, socio-technical resistance is related to stakeholders’ characteristics (human actors), services’ technical characteristics (non-human actors), and the articulation of both (Latour, 1990).
Socio-technical resistances result from the fact that actors, objects, policy instrument and philosophy are embedded in institutional environments (Lascoumes and Le Galès, 2007; Latour, 1990; Müller and Schurr, 2016). In the case of water supply, regulation implementation results from human (i.e. service managers, elected representatives, civil servants, or users) and non-human actors (i.e. networks, meters, topography, or service organisation) (Lascoumes and Le Galès, 2007; Renou, 2017). Consequently, the reporting of performance indicators is also, necessarily, embedded in routines, strategies, methods, and technology. These factors are path-dependent and inherited from past choices, e.g. types of meters or software (Kirk et al., 2007). By considering resistances as socio-technical phenomena, we grasp the interaction between all these dimensions and provide complementary insights into the conflicts concerning regulation and compliance (Mumby, 2005; Mumby et al., 2017). This places conflicts into their material and regional contexts. One major analytical implication is that socio-technical resistances are not only active, e.g. struggle between actors (Mumby et al., 2017), but also passive, e.g. inability to comply because of the structure of the network (Fuenfschilling and Truffer, 2014; Geels, 2004). Intentionality is not critical from that perspective (Callon, 1990).
Control and resistance are closely knitted together (De Holan, 2016; Fleming and Spicer, 2008; Foucault, 1977). Individuals both adapt to and resist regulation. Our empirical evidence of socio-technical resistance in performance indicator reporting in the case of French urban water systems provides original insights into non-compliance with regulation. Non-compliance appears not to be a binary outcome but gradual depending on various triggers.
The typology of socio-technical resistances allows the empirical analysis to be orientated systematically, in such a way as to develop comparability between the cases and to test theoretical inferences. It is underpinned by the work of Le Bourhis and Lascoumes (2014), Saurugger and Terpan (2016), Callon (1990) and Commons (1934), to identify forms of socio-technical resistance. They put forward the role of structural and technical factors as non-human actors, of rationality-related factors and of territory. Ostrom’s (2005, 2011), Saleth and Dinar’s (2004), Lewis’ (2015), and Howlett’s (2009) work are used to define the criteria of the typology. Their work suggests focussing on the origin, the participant, the media and the scale of each type of STR. The typology is applied and fitted to the question of regulation by performance indicators but could be transposed to other regulatory instruments or sectors.
We identify and define six forms of socio-technical resistance to the use of performance indicators. We use four criteria, each one having 3 to 5 characteristics (Table 1) to build the typology (Table 2). The four criteria and their forms are:
Origin: factors triggering resistance. Origin involves three types of catalyst: systems and organisation, the rationality of stakeholders, and territoriality (Ostrom, 2005; Saleth and Dinar, 2004). The origin indicates whether the forms of resistance are internal or external to the stakeholder on the one hand, and on the other hand whether they relate to instruments, to stakeholder competences or to the territory of which the stakeholder is part. Participants: objects or stakeholders displaying resistance. They may be non-human actors, individual stakeholders, organisational stakeholders or territorial stakeholders. This criterion is one of the most important because it allows for targeting groups in the refinement of public policies (Muller, 2011). Media: basis and vehicle of resistance. Considering Le Roy (1997, 2007), we focus on five different media: the technical asset, the local technical system, the power relationships, the general and impersonal regulations, and the conduct and behaviour models. Scale: level at which resistance manifests. We deal with three scales that echo the literature on organisations: infra-service scale, service scale and territory scale (Howlett, 2009; Ostrom, 2005, 2011).
Typology criteria.

Typology of forms of resistance.
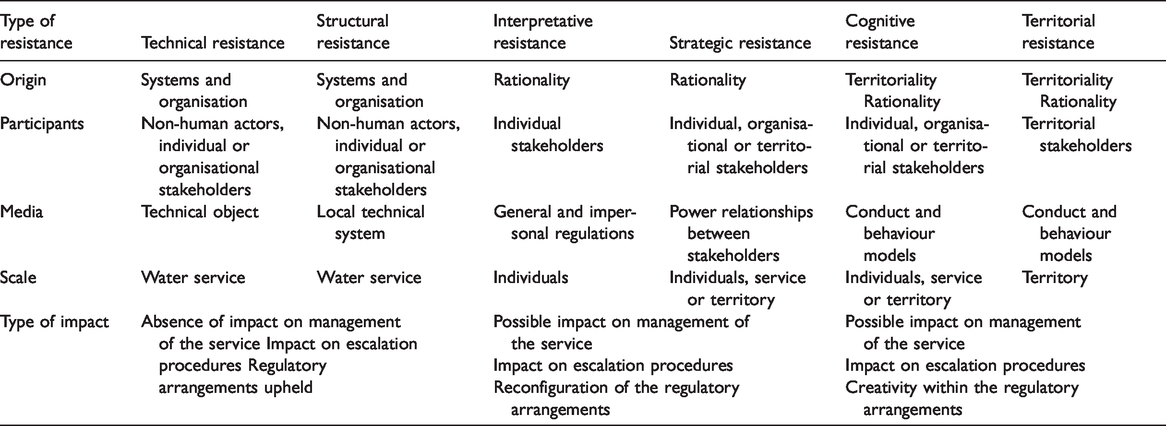
We mention territory to describe at the same time a form and an origin of socio-technical resistance. We define territory as a dynamic element relating economic, cognitive, and political resources (Amin and Thrift, 2002). It is, therefore, a breeding-ground in which stakeholders can base their actions, either by obligation, or by opportunity. Consequently, stakeholders co-evolve with the territory in which they are integrated. This can then be a medium for socio-technical resistance and a resource for those resisting.
Methodology
Case choice and presentation: Performance indicators in the regulation of French water utilities
In the European water sector, the modernisation process started in 2000, and performance indicators were put in place in 2007 in France. However, they do not seem to produce the expected effects (Bolognesi, 2018; Renou, 2017; Tsanga-Tabi and Verdon, 2014).
The genesis of performance indicators in the French water sector dates to 1998. The Minister of the Environment, Dominique Voynet (left-wing government), initiated it in the context of general mistrust of water operators, due to some management scandals. Performance indicators represented a tool to both regulate and restore trust in operators. In addition, the International Water Association encouraged using performance indicators to make water delivery more efficient (Alegre et al., 2000).
From 2002, the new right-wing government pursued this project. During this second stage, private and public operators created coalitions to contribute to the process and get their voices heard. They aimed to influence definition and selection of the indicators (Canneva and Guérin-Schneider, 2011a).
In the end, operators, technical staff and academics made up most of the stakeholders involved in the process. Ministries and private operators strongly influenced the final definitions of performance indicators. In contrast, the room for end-user participation turned out to be small.
In 2007, performance indicators were implemented on a national scale. The same year, a soft regulatory agency (ONEMA - Observatoire National de l’Eau et des Milieux Aquatiques) 4 is created. This national agency is in charge of monitoring services and of implementing a national information system (SISPEA). Performance indicators are part of it, and seventeen are dedicated to water supply (Table 3). They are mainly technical and cover four domains: finance, users, environment, and network. They contribute to regulating water services and improving their reputation in order to mitigate adverse impacts of past scandals (Canneva and Guérin-Schneider, 2011a, 2011b). Water services were requested to report their performance through the SISPEA information system, on a voluntary basis. ONEMA then inspects the values and makes them publicly and freely available. This allows for the comparison of services’ performance across time and space.
List of performance indicators and variable name.
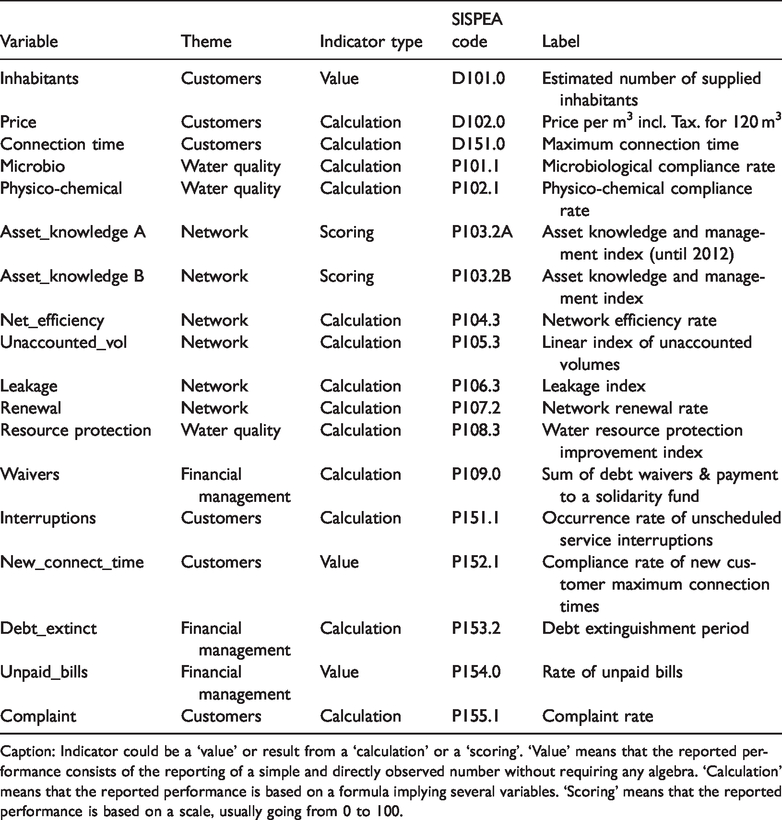
Caption: Indicator could be a ‘value’ or result from a ‘calculation’ or a ‘scoring’. ‘Value’ means that the reported performance consists of the reporting of a simple and directly observed number without requiring any algebra. ‘Calculation’ means that the reported performance is based on a formula implying several variables. ‘Scoring’ means that the reported performance is based on a scale, usually going from 0 to 100.
Water management in the Grenoble urban area (Figure 1) was highly fragmented during the period of interest. The number of services was greater than the number of municipalities (53 services and 49 municipalities). 34 services operate under direct public management and 19 under public-private partnership. Amongst the 53 services, 25 are producers of drinking water and 46 are exclusively distributors. Most of the municipalities retain responsibility for water distribution. The resource abundance, high quality, and proximity to sites of consumption provide a good set of conditions for service provision. By contrast, the mountainous character and unfavourable topography of certain services may result in additional costs and constraints.

Map of the water services in the Grenoble urban area on 31st December 2014.
Grenoble’s politico-institutional context is unique. Up until the 19th century, water represented a threat and a cost due to recurrent flooding, distancing drinking water from the priorities of local authorities. Then, stimulated by scientific and technical progress but also due to the discovery of its specific territorial characteristics (exceptional quality, abundance, low cost of transportation and extraction), water changed from being a constraint to a resource for stakeholders. Stakeholders’ views changed, transforming water resources into a driver of economic development in the urban area (paper mills, hydropower and more recently nanotechnologies) (Brochet, 2015). As a consequence, local public intervention increased significantly in the first half of the 20th century and some elected representatives adopted strategic approaches to financing municipal budgets via the sale of water. Water institutions and urban authorities were created. Le Bras (2003) shows that by embodying conflicts, competition for distribution and rationalisation of the hydro-territorial map, these institutions participated in the maintenance of a low level of “inter-municipal cooperation” at the scale of the urban area. This past continues to structure the territory by pitting the city centre against the suburbs. The variety and abundance of the stakes involved should encourage socio-technical resistance as conflicts and heterogeneity in technical modernisation remain present. These characteristics make the Grenoble metropolitan area conducive to the use of our typology.
Empirical strategy: Mixed quantitative and qualitative methods approach
We adopt a mixed quantitative and qualitative methods approach (Creswell, 2014) which allows us to appraise the extent and nature of socio-technical resistances. More precisely undertook an explanatory sequential mixed methods design (Creswell, 2014). The quantitative approach gives information about the significance of STR, frequency and magnitude of deviations in reporting (H1), whereas the qualitative approach allows us to grasp the essence of STR (H2). Quantitative results contribute to the design of the qualitative phase by identifying the performance indicators of paramount importance. For the quantitative analysis, we created an indicator of socio-technical resistances which measures their frequency and intensity. In the qualitative analysis, information about the nature of socio-technical resistances is related to the typology above. This second stage is restricted to the indicators that are the most subject to socio -technical resistances.
A three-year action research process (2011–2013) was carried-out for data collection and consolidation. 5 It covered the 53 water services located in the Grenoble urban area (France). We collected raw data about service delivery, for instance price, volume of water distributed and relation with users, directly in the service. It means we have the same data as employees in charge of reporting performance which allows us to isolate the impact of reporting practice from the calculation of the companies’ input to the SISPEA database. These data prevent us from identifying the role of measurement, e.g. metering, but offer an accurate identification of actors’ practices, which are the media of STR according to our definition.
This unique dataset allowed us to have a sample free of the socio-technical resistances that occur in the practices of performance reporting. The dataset enables identifying socio-technical resistance that occur during the reporting process. The identification proceeds through the measurement of an indiccomp that is the index of variation between the reported performance in the SISPEA database (indicsispea) and the one we have calculated with the raw data (indiccalc). We assume indiccomp is the actual performance. It is a narrow perspective of STR, which enables a conservative and robust test of the existence of STR. Then, we use our typology and qualitative materials to appraise STR in their broader perspective. The analysis goes through three stages and the next subsections elaborate on the specific methods:
Our own calculation of the performance indicators with the same raw data that service providers use. Variables indiccalc store our measures, and serves as a benchmark. Comparison of the performance indicators reported by service providers with our variables indiccalc. These results are labelled variables indiccomp. This step grasps the frequency and magnitude of socio-technical resistances (H1). Analysis of the nature of socio-technical resistance by applying our typology to the qualitative materials collected during the fieldwork (H2)
We identify the occurrence of socio-technical resistance through the outcome of reporting practices during the quantitative phase; characterisation of resistance is the result of the qualitative phase. In the second phase we focus only on the most significant socio-technical resistances.
The Grenoble area is relevant for our analysis for several reasons. There is a broad range of services profiles, e.g. large-scale urban services, semi-urban and rural services, within the same institutional environment. Besides, local stakeholders created a working group (within the Communauté de l’Eau) on performance indicators. This group, started in 2012, consisted of approximately thirteen of the drinking water services located in the area, but also the Isère Land-use Management Division (Direction des Territoires de l’Isère), which is responsible for monitoring the SISPEA (Observatory of Public Water and Sanitation Services) for the entire Department for a year. The group aimed at diagnosing the various situations and blockages encountered during the indicator completion process by stakeholders responsible for completing the SISPEA.
Quantitative methodology
We collected data from service providers’ databases directly. These raw data are observational data, not survey data. They are free of deviations because they were collected before the reporting process. Our data covered the 53 water services of the Grenoble urban area in 2011. The analysis excludes indicators Connection time (maximum connection time) due to a lack of information and Asset_knowledge B (asset knowledge and management index) because it is a re-definition of indicator Asset_knowledge A and was not in force during the period of analysis. We did not recalculate indicator Resource protection (water resource protection improvement index) because the raw data are not accessible. The prefecture holds several of the variables necessary to the calculation of the index. Thus, the sample focuses on 15 of the 18 existing performance indicators. Table 4 presents the summary statistics.
Summary statistics of response variables.
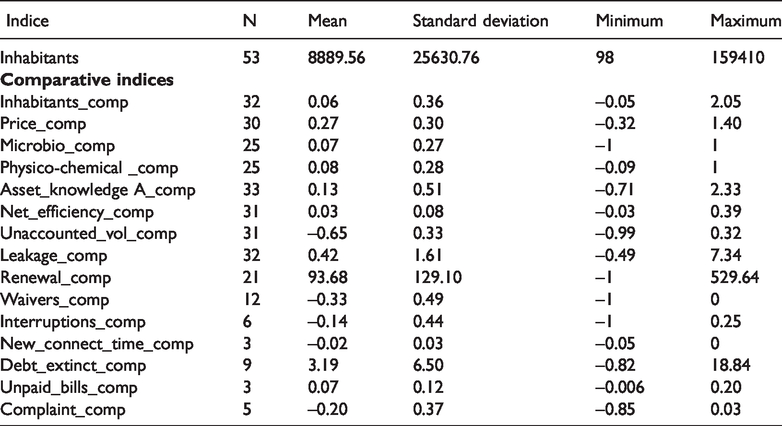
Most of the performance indicators require calculation; only four indicators are reported directly (scoring or value report). These four indicators are: 1) the number of supplied inhabitants, 2) the asset knowledge index, 3) the compliance rate of new customer maximum connection times, and 4) the rate of unpaid bills. After the collection, we have checked the data consistency in collaboration with service providers during technical workshops. We calculated the value of each performance indicator from the raw data by following the method recommended by ONEMA to complete the SISPEA database. Then we propose a measurement of socio-technical resistance via indices comparing the calculated values (group without resistance) and the values reported in SISPEA (group with resistance) by service providers. These indices are a proxy to appraise the frequency and the magnitude of socio-technical resistance. indiccomp variables (one variable per indicator) store this information, measurement is a variation index calculated as following:

Qualitative methodology
The qualitative analysis aims at grasping practices and perceptions to characterize socio-technical resistance. We collected specific materials for this purpose, and do not use the dataset constructed for the quantitative analysis. Data collection used participant observation (Kawulich, 2005) and relied on six sources (Table 5):
semi-structured interviews (55) collective work sessions (20) focus groups (4) technical workshops (2) permanent conference (1) informal interviews (from 2011 to 2016)
Qualitative data collection processed.
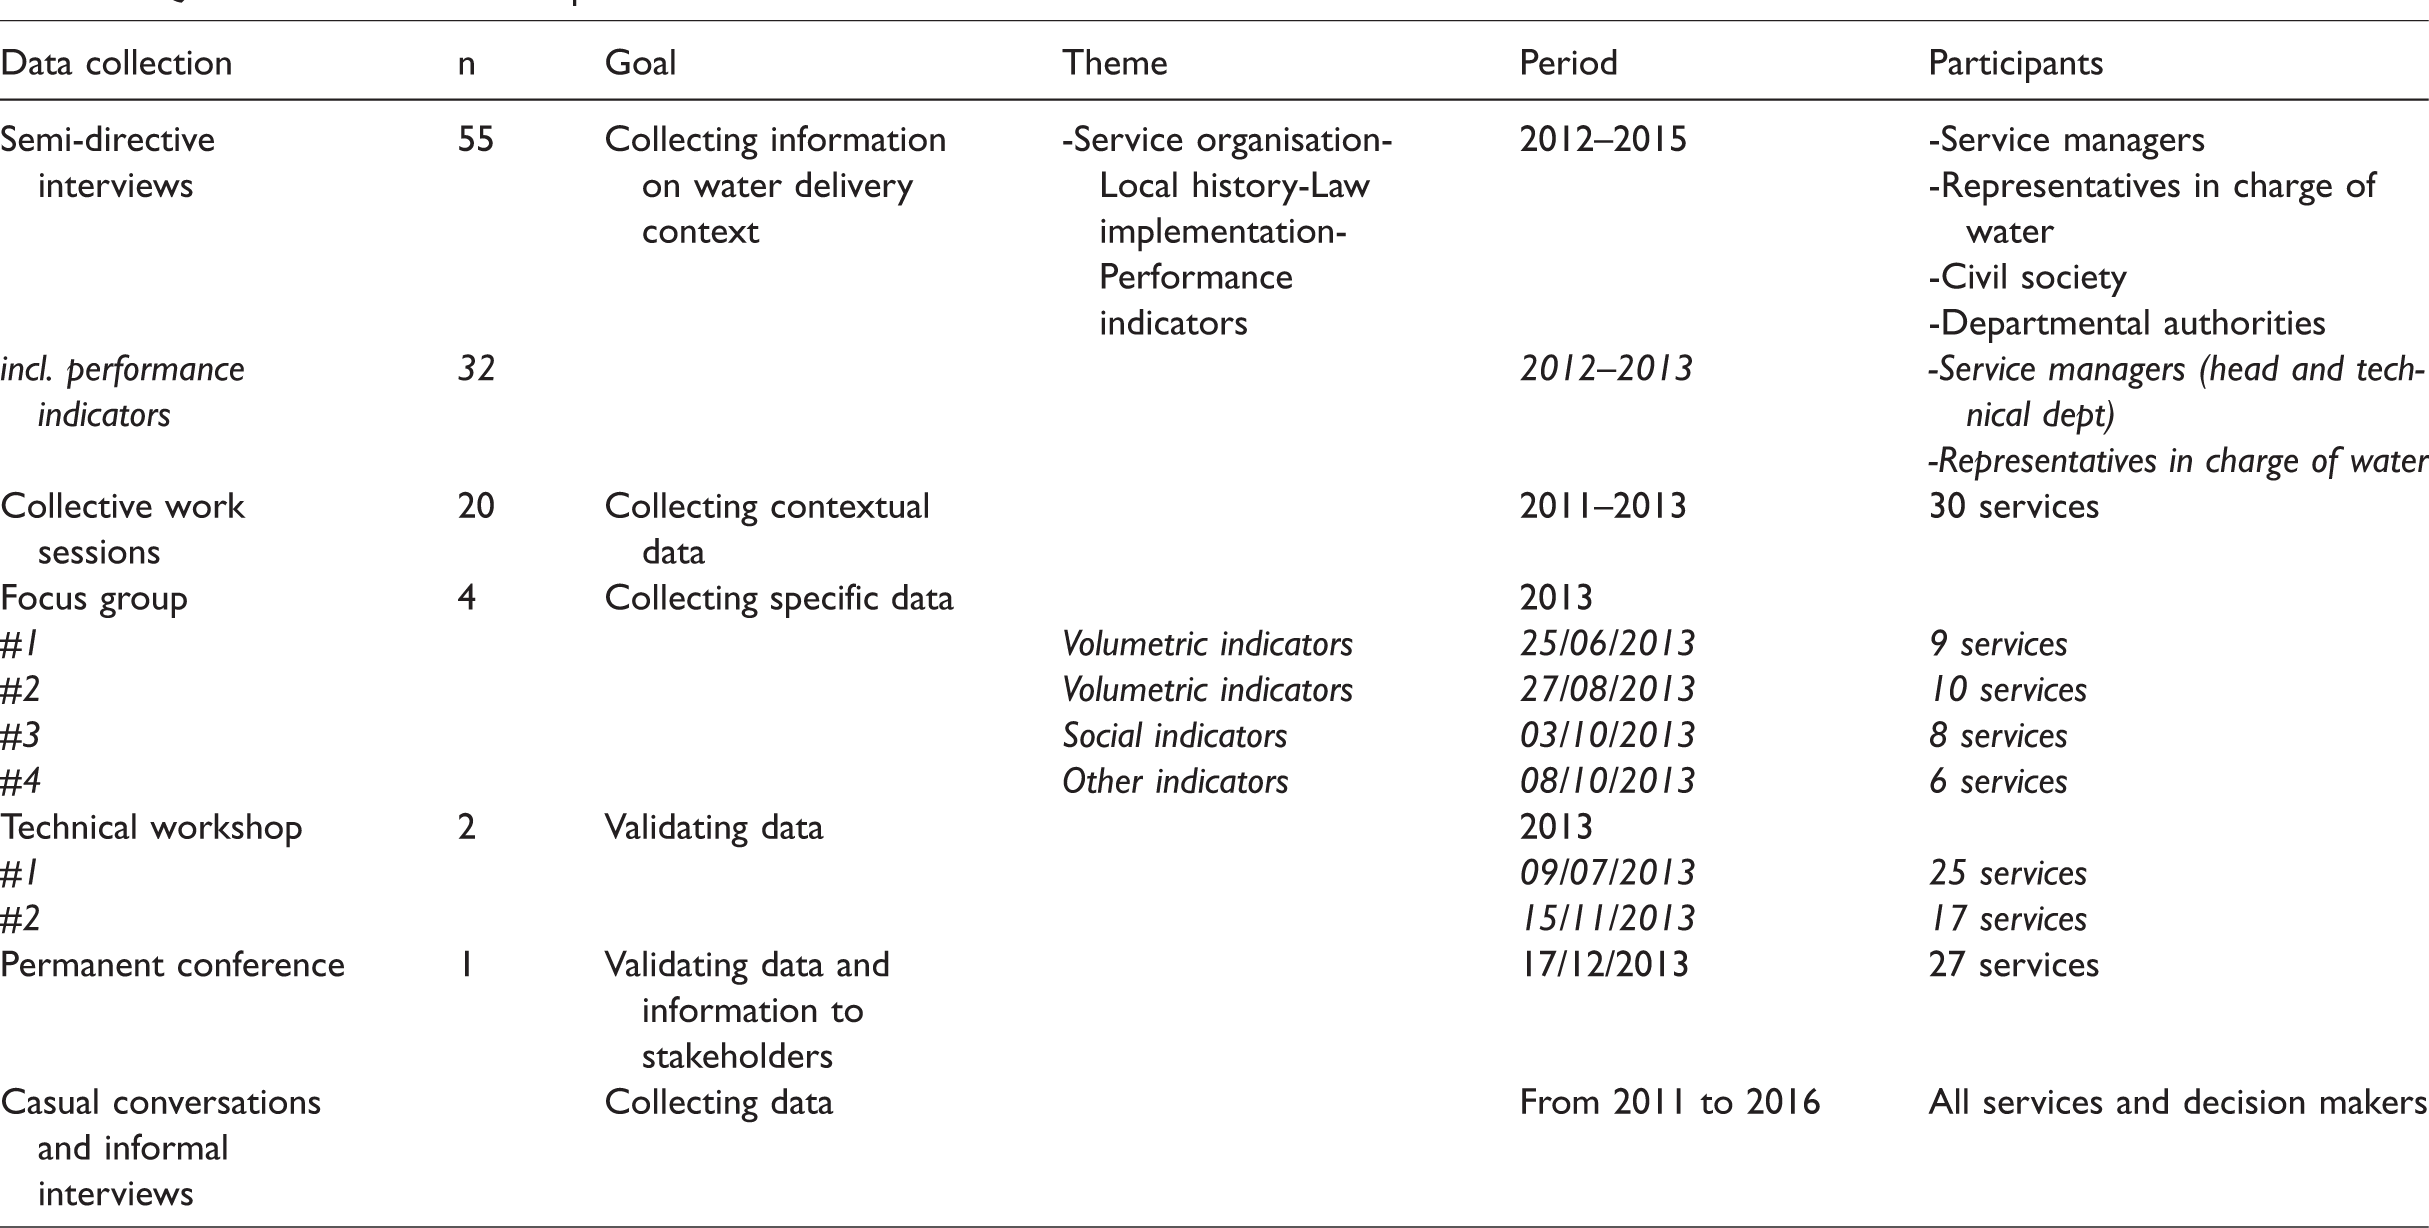
Therefore, in addition to information about the performance indicators, we gathered contextual information about the services (technical, geographic, social, financial). This contextual information plays a crucial role in interpreting the nature of socio-technical resistance and applying our typology of socio-technical resistances. That is why 32 of the 55 semi-structured interviews explicitly mentioned and focussed on performance indicators; others addressed the water management more extensively. Interviewees included local people in charge of water provision, members of Departmental authorities and the civil society. This panel contributes to information sharing about drinking water delivery in the Grenoble area extensively.
Of the 53 service providers studied, thirty or so participated in the majority of the 20 collective work sessions. The four focus groups were organised by theme and orientated by specific questions (indicators of financial management, social management, technical management). We restricted the number of participants to ten to facilitate group control (Krueger and Casey, 2000) and most of the participants were directly involved in performance indicator completion. Then, the two technical workshops and the permanent conference were held. Their main role was to consolidate data, through member checking, and to make stakeholders aware of our observations. During each of these sessions, participants were able to express themselves freely about their practices and impressions concerning the completion of indicators. The observations provided material for a record of qualitative observations (Laplantine, 1996).
Results
Amplitude of socio-technical resistances
Hypothesis 1 states that socio-technical resistances to performance indicators are significant and frequent. The indiccomp indicator estimates socio-technical resistances as a deviation between the performance reported in SISPEA (official database) and the performance that we measured from raw data. Its distribution confirms hypothesis 1. If we look at the frequency of socio-technical resistance, the indicator can take four forms:
dist, when the indiccomp indicator is not null, signifying the SISPEA value contains deviations and indicating a resistance NR, when the SISPEA is not filled in whereas the services have the data to do so, indicating a resistance missing, when the data necessary for indicator calculation do not exist correct, when the indiccomp indicator is nil, no resistance.
12 of the 15 indicators we focus on are significantly subject to socio-technical resistance (Figure 2). Only four indicators are correctly completed in at least 20% of the cases, but not more than 40%. Three indicators have a share of not reported performance even though the data exist (NR), and four others show a significant frequency (> 40%) of difference between reporting and our calculations (dist). The correct category informs that stakeholders report values with no deviation from our calculations. The dist and NR categories, however, group indicators subject to socio-technical resistance. In the dist group, the resistance occurrence consists in a deviated value in SISPEA, in comparison to our calculation, while in the NR group it takes the form of a missing data.
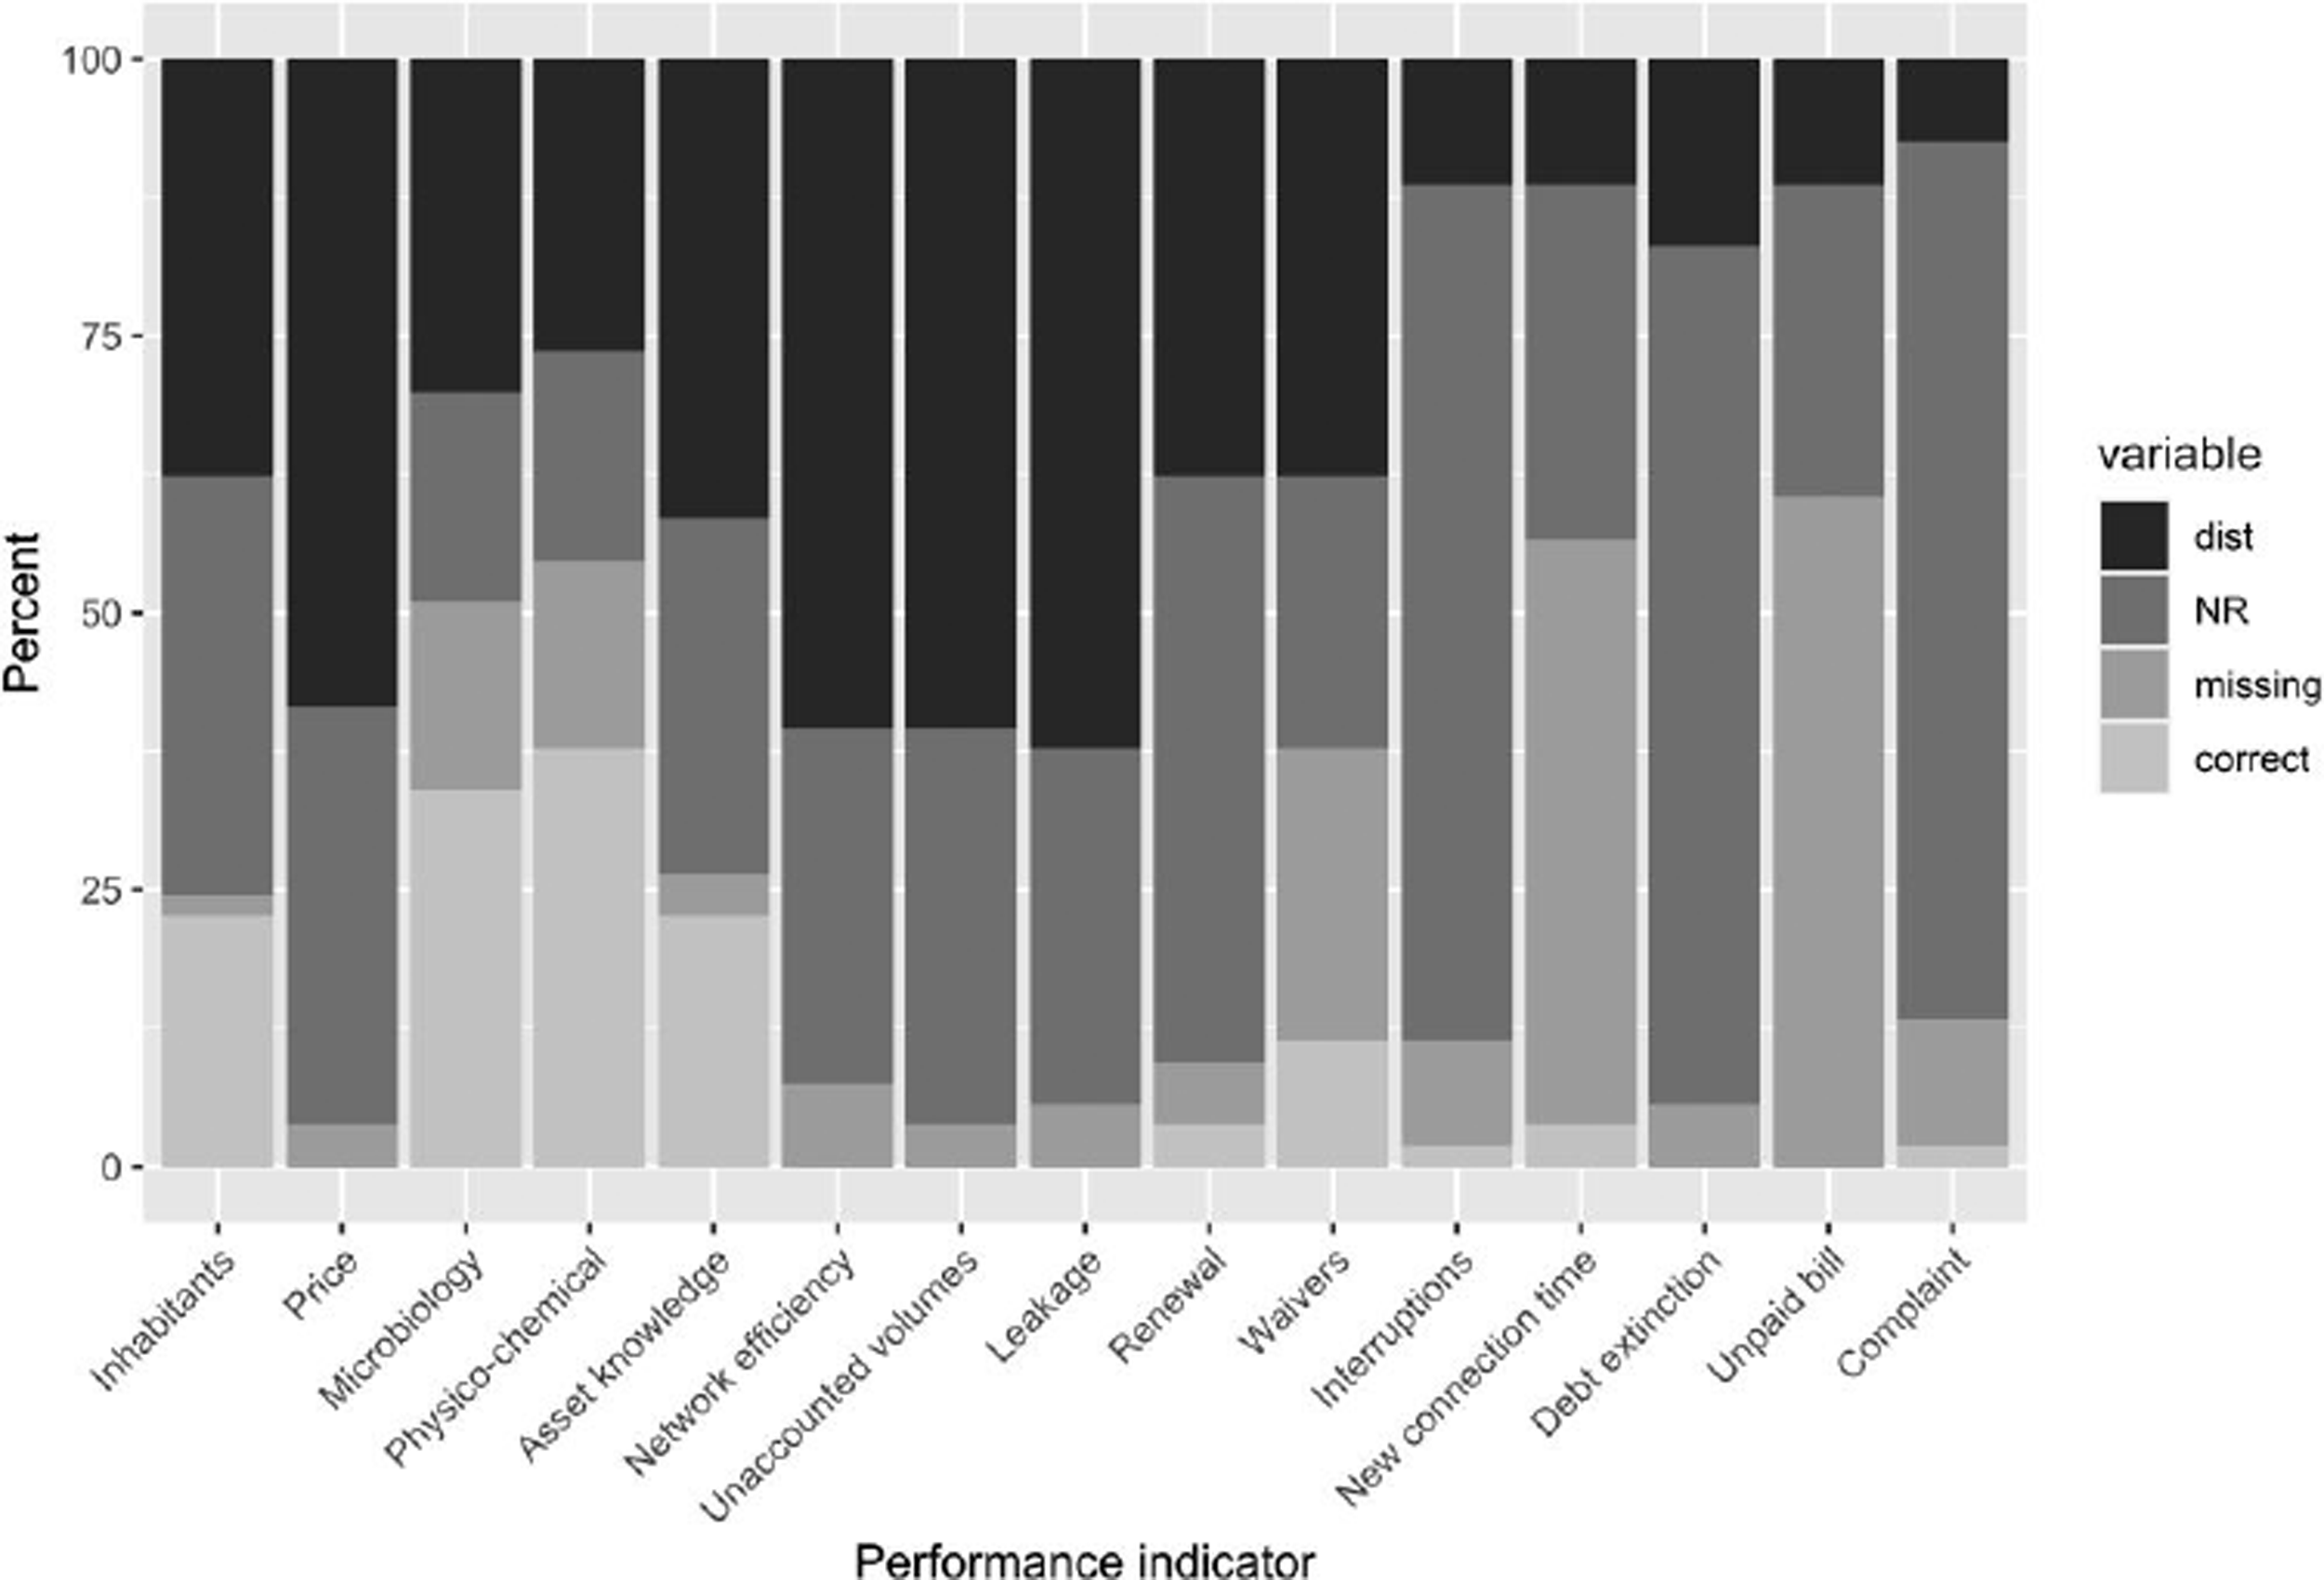
Distribution of resistance based on the comparison index.
Representing 15.35% of cases, the level of missing data turns out to be relatively low given the lack of knowledge about water networks in France and the recent appearance of concerns about service performance (Bolognesi, 2018; Colon et al., 2018).This proportion is significantly raised because of four indicators, (the microbiological compliance rate (Microbiology), the physico-chemical compliance rate (Physico-chemical), asset knowledge and management index (Asset knowledge)). Concerning the missing values, the indiccomp indicators distribution varies significantly. Indicators “new connection time” and “unpaid bill” have more than 50% of missing values. In contrast, for seven indicators the share falls below 5%, the middle ground is about 10 to 15% of missing data and concern four indicators.
Regarding the frequency of socio-technical resistances, on average, 28% of cases have distortions (dist), but for indicators of the price (Price), the network efficiency rate (Net_efficiency), the linear index of unaccounted volumes (Unaccounted_vol), and the leakage index (Leakage) this rate is close to 60%. There are 41.2% of cases with no information reported even though the services have the necessary data (NR). The median is 32.08%. Indicators related to users, notably the occurrence rate of unscheduled service interruptions (Interruptions), the debt extinguishment period (Debt_extinct) and the complaint rate (Complaint), raise the mean. In summary, the probability of observing socio-technical resistance (dist + NR) is of the order of 69% and rises to 81.81% if the missing values are removed.
With regard to the amplitude of socio-technical resistance, Figure 3 presents the distribution of comparison indices for the six indicators with a lot of deviation in reporting. The red segment marks the 10% level of deviation which corresponds to an important one, i.e., that can’t be explained solely by rounding errors (Bolognesi and Pflieger, 2019), while the number of the service on the x-axis permits comparison between the different tables. It shows there are significant deviations and deviations mostly go in the same direction.

Distributions of selected comparison indices.
We see on the first diagram that reported prices are mostly overestimated. The combination of three types of socio-technical resistances provides an explanation for this situation: strategic, structural, and interpretative. The strategic aspect is important. In France, the public sector authority (mostly the Mayor) and the operators negotiate and define the price of water provision. No third-party, like ONEMA, intervenes in the process. Under these conditions, users are voters. At the local level, there is an incentive to set the price of water delivery at low levels, in order to avoid the political or reputational costs of a high price of public service. Conversely, regarding national level constrain, there is a high incentive to set prices at higher level. Indeed, the Water Authorities, the Isère Department or the Aquaplus quality accreditation impose a minimum threshold price to get eligible to financial aid. This condition serves to implement cost recovery management in order to bring about the modernisation of the services.
These strategic socio-technical resistances, by overestimating prices, allows to apparently satisfy the national requirement without experiencing the local political and reputational costs of such requirement. Chong et al. (2015) underline the likelihood of such strategic behaviours, and Bolognesi and Pflieger (2019) precise that, in general, strategic behaviours are more likely to take the form of a non-reporting (NR) if a public entity runs the utility and to be a distorted reported performance (dist) if a private entity runs the utility. They also noticed that at this time, reporting was not legally compulsory, while it is now. There is a need to see if this strategic price overestimation endures through time.
This explanation must be qualified. Pricing is not linear, and the use of a block tariff scheme both increases room for strategic socio-technical resistances and makes more complex the strict application the regulatory calculation of price. 6 It is then the low capacity of certain utilities that prevent to strictly apply the regulatory price (structural resistance). As an illustration, interviewees often mention that their limited staffs allow insufficient time and specialization to correctly report price and other performance indicators. This structural socio-technical resistance produces difficulties in interpretation and allows stakeholders to adopt strategic behaviour. We observe that several types of resistance are closely linked and follow each other in succession: structural resistance produces interpretative and strategic resistance which may be combined. Deviations on price reporting strongly illustrate the socio-technical aspect of resistance. The definition of price estimate is a non-actor that affects actors’ practices, producing socio-technical resistance (Lascoumes and Le Galès, 2007; Latour, 1990). Intentionality is not of first importance here (Callon, 1990).
A similar phenomenon appears with network monitoring indices: network efficiency rate, linear index of unaccounted volume and leakage. Stakeholders tend to paint a more flattering picture than reality, and this behaviour seems neither fully naïve nor fully strategic. It attests to the manipulation of indicators by stakeholders for reasons other than those expected by the regulator. Deviations could be significant, i.e. higher than 10% of the SISPEA value. Socio-technical resistance is revealed to be a subtle mix of compliance and non-compliance.
Non-reporting (NR) is the second way socio-technical resistances occur. It is particularly common. Non-reporting affects on average 41% of the services for each indicator and exceeds 75% of services in the case of performance indicators unscheduled service interruptions, complaint rate, and debt extinguishment period (Figure 4). Price indicators network related indicators, e.g., renewal and unaccounted volumes, are particularly affected. Even though indicators about unscheduled service interruptions (Interruptions), and the complaint rate (Complaint) can be calculated for 47 services, they only appear in the SISPEA for 7 and 5 services, respectively. Indicator of the debt extinguishment period (Debt_extinct) is also provided infrequently (9 services) whereas it can be calculated for 50 services. It is noteworthy that because reporting is on a voluntary basis, the NR case is more likely.
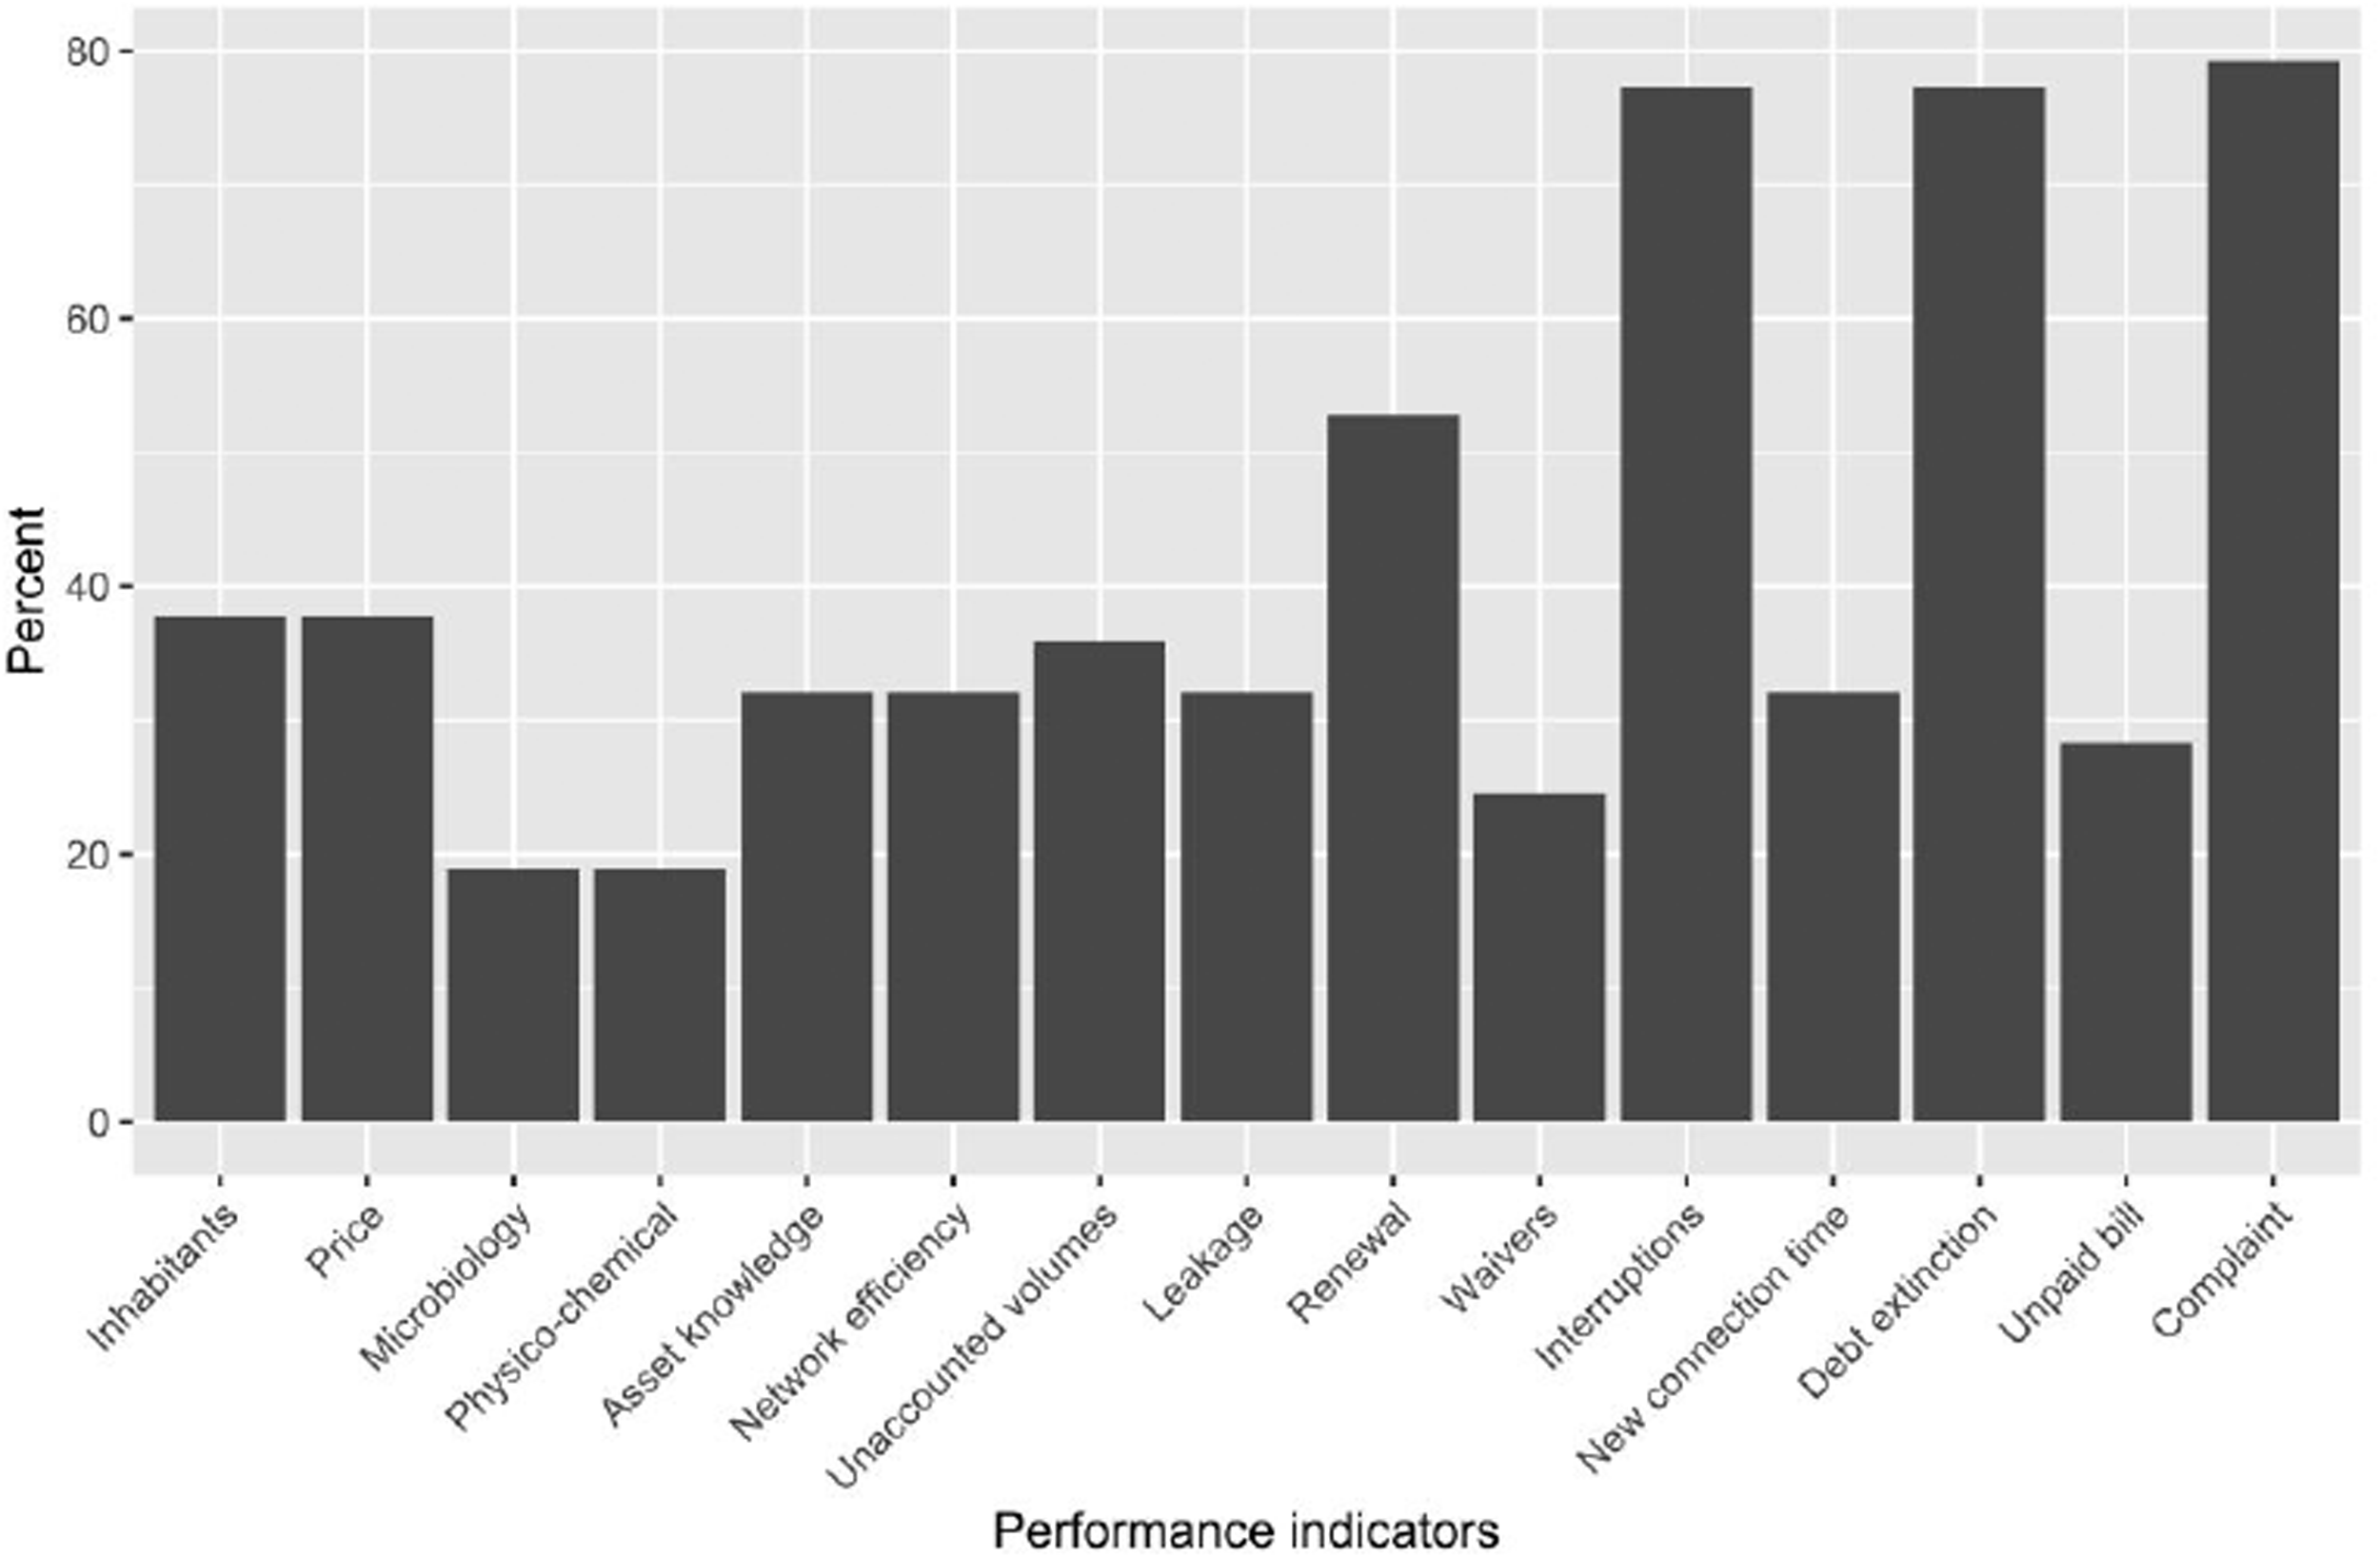
Distribution of resistance through no information provision (NR) as a function of performance indicators (% of relevant services).
In sum, the results show that socio-technical resistance are frequent and significant. We observe a high degree of deviation (dist) and non-reporting (NR) outcomes, which confirms our first hypothesis. In numerous services, the rate of reporting subject to socio-technical resistances exceeds 70%.
The essence of socio-technical resistance
Our second hypothesis states that socio-technical resistances mix multiples types of resistances and that this entanglement changes over the time. They have multiple sources: behaviour, informational issues, and network configuration (Lascoumes and Le Galès, 2007). Results confirm the hypothesis. We focus on the most significant socio-technical resistances the fieldwork revealed and draw on our qualitative materials (Table 5).
Figure 5 presents the number of combined socio-technical resistances. The maximum possible is 6, namely the number of categories identified in the typology. In nearly 40% of cases, services combine at least two types of socio-technical resistances. It suggests that socio-technical resistances to performance indicators are a mix of entangled factors that cannot be put down to opportunism or a lack of information. It confirms that the socio-technical perspective enhances the accuracy of non-compliance understanding.

Number of types of resistance per service.
We classified socio-technical resistances, using the proposed typology, and observed their frequency (Figure 6). To avoid bias in interpretation, we focused on forms of socio-technical resistance which were particularly significant during implementation of the typology. Surprisingly, we note only one instance of technical resistance that was highly significant. Our research protocol may explain this single observation. It reduces the ability to observe technical resistance as we look at the difference between the direct measurement and the information recorded in the SISPEA. We focus on the process of reporting and exclude the process of data gathering. This observation stresses the need to open the black box of socio-technical resistances and extend it to upstream steps of performance indicators implementation.

Frequency of resistance types.
Structural resistances are the most frequent (19 cases) highlighting the importance of the contextual specificities, for instance the structure of the network and administrative fragmentation. We also see that structural resistances are often the breeding-ground of other socio-technical resistances which are then superimposed. Lastly, stakeholder-related forms of resistance maintain a strong presence, with between 11 and 16 cases, the principal being interpretative and territorial ones. The typology thus allows us to grasp the nature of socio-technical resistances to performance indicators reporting and their intricacy.
Results show that territorial and structural forms of resistance are regularly displayed. This observation differs from theories of economic regulation by emphasising that the limits to good regulation do not depend only on actors’ opportunism or lack of information (the principal-agent problem) but also involve territorial, organisational and institutional dimensions. Our results provide an incentive to rethink the rationalisation of public policies, especially by considering misfits between stakeholders’ behaviour, network structure and performance management (Renou, 2017).
We identified a large variety of factors favouring socio-technical resistances through non-reporting (NR). We observed strategic motivation such as the willingness to not transfer a negative message to the user and the regulator. Structural aspects also enter into play via an organisational difficulty in finely quantifying the activity of the service when this is not very high-tech. For instance, small service providers, which are both producers and distributors of water, encounter difficulties in collecting and producing information. In this case, services may prefer not to report their performance measurement because they consider it unreliable. Capacity limitations often lead to socio-technical resistances. They combine structural and interpretative blockages in various complex ways. Most of the time the person responsible for reporting performance into the SISPEA database is a technical agent who has no accounting and financial skills, except in the case of large services favouring inter-agent exchanges. Organisational partitioning of small services prevents exchanges of information and collective work effort between technical and financial departments. Information is available in the financial department, without the technical agent responsible for reporting being aware of it. For example, the different location of the technical and financial departments increases this form of socio-technical resistances. We found numerous other examples of socio-technical resistance involving information not being provided. There are, therefore, a variety of factors causing this type of socio-technical resistance, which confirms our hypothesis 2.
We have shown that price (Price) and volumetric indicators (Net_efficiency, Unaccounted_vol, Leakage) turn out to be particularly subject to socio-technical resistances. Indicator Price is strongly subject to technical, structural and territorial forms of socio-technical resistance. Indicators about the network efficiency (Net_efficiency), the index of unaccounted volumes (Unaccounted_vol) and the leakage level (Leakage) are volumetric indicators characterising losses in networks. Since they are founded on measured and estimated data, these indicators are sensitive to material deviation (meters lose accuracy over time), human deviation (omission, refusal, interpretation, methodology) and contextual deviation (position of meters, operation of the network).
Technical forms of resistance are observed in the case of volumetric indicators but they often turn into another form of resistance, notably structural and interpretative. It explains their low occurrence in Figure 6. For example, following established routine, consultancies and private companies design the size of meters for consumption of 120 m3/year/household whereas today consumption is 94.12 m3/year/household on average (Bolognesi, 2018). Oversizing may cause low flow rates to not be taken into account, which lead to underestimate volumetric indicators, with volumes being wrongly interpreted as losses. In this case, the socio-technical resistance combines the characteristics of several types (structural and interpretative). The meter, i.e. a non-human actor, drives the socio-technical resistance.
Structural resistances occur mainly in the reporting of volumetric indicators. Fewer than one service in two invoices all drinking water uses. The absence of a meter for certain facilities (like public buildings and public parks) is inherited from choices made by previous stakeholders. It is mostly due to technical or financial constraints but sometimes results from cognitive or territorial resistance. Moreover, many services do not record the volumes consumed because meter locations do not allow this to be done. Consequently, they calculate volumetric indicators based only on the distribution part of the network whereas they should do so for the entire network, feeder pipes included. In that case, the structure of the service does not correspond with the definition of the indicator.
In these cases of structural and technical resistances, it is not only the performance indicator instrument that is subject to socio-technical resistance but also public action programmes (Renou, 2017). Service management, escalation procedures and regulatory organisation are all affected.
Interpretative resistances clearly appear when looking at the reporting of indicator Price. It stems from rationality of stakeholders and the complexity of indicators. Stakeholders face the difficulty of understanding the definition given by the regulator (ONEMA). Failing to grasp nuances of the regulatory definition, stakeholders have to create an ad hoc solution. For example, certain agents reported the average price of the service whereas ONEMA requests the average price for a user who has consumed 120 m3. This leads to reporting an inflated price because on average consumption per household is lower than 120 m3 (94.12 m3) and the tariffs structure is based on an increasing marginal price per cubic metre of water as requested by the European Water Framework Directive (Bolognesi, 2014, 2018). In certain cases, agents disseminated their interpretative resistances transforming those into a cognitive resistance. For instance, we observed cases where a stakeholder incorrectly advised the agent responsible for reporting indicators. If the latter then advises other agents in the area and the information is disseminated over a wide area and over a long period of time, the socio-technical resistance may be transformed.
Cognitive resistances also impact on price reporting. Resistances come from strongly internalised local routines shared by stakeholders in the service or territory. The main difference when compared to interpretative resistance is the origin, which in this case is to be found in the territorial dynamics. A concrete example seen several times involves the absence of distinction between the variable part of the bill (which depends on the volume of consumption) and taxes. Many services merge these two components to measure the price of water whereas this is not the formula selected by the regulator. This cognitive resistance appears to be mainly territorial. It is a routine shared by riparian water services in a given area.
Deliberate strategic resistances are the most frequent in the case of price indicator. This has already been treated earlier in the explanation for Figure 5. There are institutional inconsistencies and definitional drifts (Pollitt, 2013) regarding price assessments. It creates room for manoeuvre and an incentive for freeriding explaining why dist cases are frequent (Bolognesi and Pflieger, 2019). 7
Lastly, volumetric indicators may be subject to territorial resistance. For example, in a context of abundant resources, several services see no interest in working to reduce water losses. They question the relevance of volumetric indicators and the associated rationale in terms of water savings to evaluate their performance. In the majority of cases, such STRs have taken the form “information not provided” (NR) but some services have ostensibly given information to respond to the requests of the ONEMA, whilst evaluating their performance by other means. This type of resistance originates in territorial dynamics. It is based on the combination of organised and geographical proximity (Torre and Beuret, 2012) between the agents of different water services. 8 These types of STRs have significant impacts since they lead agents to propose territorial counter-projects in opposition to those of the ONEMA. It may be a vector for innovation and creativity within the regulatory organisation. As an illustration, considering complaints from numerous services in mountainous areas, ONEMA services are currently thinking about adapting the indicators by proposing specific definitions depending on context.
Conclusion: What can be learnt with regard to the indicators from institutional socio-technical resistance?
This article has shown that socio-technical resistances in water service performance management are frequent and their magnitude significant (H1). In consequence, they appear to be a key factor of non-compliance with regulation based on performance indicators. We found out that they are an evolving entanglement of specific types of resistance (H2). Consequently their triggers are not only strategic motivations, but territorial, technical, cognitive, interpretative and structural as well. This offers a more politically realistic perspective on performance indicators (Lewis, 2015). By looking at the case of performance indicators for drinking water supply services in the Grenoble urban area, our mixed methods research design emphasized variety and the noticeable extent of socio-technical resistance, which we observed in about 65% of our sample. This adds a new dimension to new public management theories supporting the regulation of public services in Europe.
The results turn out to be valuable at two levels. Firstly, they underline the fact that coordination problems do not only occur between stakeholders but can crystallise around governance measures. They then invite us to step back and rethink the nature of the causal model supporting the modernisation policies currently in place (Bolognesi, 2014b, 2018). We highlight that policy effectiveness might be threatened unless thought is given to the feasibility of governance instruments being taken on board at local level (Renou, 2017). We encountered a growing lack of interest in compiling indicators, which are seen as an additional obligation that is of no use in improving service efficiency. This observation reminds us that the polycentric context can increase the policy implementation challenge. This context involves working with numerous stakeholders who are relatively autonomous at many levels.
The present paper contributes to the literature on the implementation of policy instruments by linking up socio-technical and resistance approaches. Socio-technical resistance broadens the scope of the concept of resistance by taking the context in which actors evolve into account (Latour, 1990). Moreover, the concept of socio-technical resistance shed lights on the endogenous constraints of socio-technical regimes. This is of first importance as the understanding of socio-technical regimes is critical for delineating sustainable transitions (Fuenfschilling and Truffer, 2014; Geels, 2010; Renou and Bolognesi, 2018; Smith et al., 2005). Analysis of socio-technical resistance should help in understanding the feasibility of socio-technical transition pathways and explaining why the regime follows a given pathway or another.
In sum, the strategy pursued by the French State is open to criticism. The State intends to impose the modernisation of water services using a forced approach by requiring the installation of metering instruments but also by organising water services at a larger scale. In addition to this, the State is simultaneously pulling out of the area by ceasing to provide assistance to local public authorities. This strategy is based on the hypothesis that a larger water service will make it possible to standardise management, introduce technical modernisation and eliminate specific territorial features (Lieberherr and Fuenfschilling, 2016). Subsequently, a large service should be better able to comply with performance management. However, in light of our study, it seems that this logic is largely misguided. It is obvious that the interpretative and strategic forms of resistance will not disappear by following this strategy (worse, they could increase in the framework of large services where the lack of proximity between agents may encourage opportunistic practices). Concerning structural resistances, it is highly uncertain that the imposition of new technical procedures will eliminate them, as they stem from the historical organisation of the network. Indeed, the location and territorial specificities of water resources and infrastructure can only be modified at a timescale of several decades. For that reason, depoliticising water governance does not necessarily generate more efficiency and less uncertainty (Bolognesi, 2014b, 2018; Wood, 2016).
Three main policy implications come out from this research. Firstly, results indicate that socio-technical resistances are more the norm than minor disturbances in the regulatory process. In the Grenoble area, the probability of observing a socio-technical resistance to a performance indicator can be as high as 65%, and the figure jumps to 81.81% when omitting cases where actors have no measurement of the variables necessary for the calculation of performance indicators. The second lesson results from the first. Information given by regulatory tools, such as performance indicators, should be interpreted with care. They are likely to be a deviation from the current situation. For instance, the regulatory agency of water supply in England and Wales (OFWAT) mentioned in its November 2017 Company Monitoring a limited confidence in the reporting of four (among 32) water companies. 9 Regulatory bodies should assign a level of trust to the collected information according to the probability of socio-technical resistance. In this respect cognitive, structural and interpretative resistance should be easily assessable. The third lesson is that regulation is not only a question of design but also a crafting process (Ostrom, 1992). Reality is diversity, while indicators seek universal appraisal. The efficiency of regulation depends on the ability to strike a balance between these two opposite views. Adaptive governance measures to transform performance indicators and to better activate them in practice might be a fruitful tool in that respect. In addition, local public assistance such as training and support platforms for completing performance indicators would ensure that the stakeholders responsible for doing so have a sufficient level of knowledge and a uniform understanding of them.
Footnotes
Acknowledgements
Authors would like to thank the following for their substantial input on earlier drafts: Laetitia Guerrin-Schneider, Elodie Rouvière, Sebastien Lambelet, Eva Lieberherr, Laura Turley, Christian Bréthaut, Gabrielle Bouleau, Sara Fernandez, Rasha Shakra, and participants of the UMR G-eau workshops and of the ECPR panel on Water Governance. We acknowledge three anonymous reviewers and the editor, Joe Painter, for their insightful comments. Errors remain ours.
Declaration of conflicting interests
The author(s) declared no potential conflicts of interest with respect to the research, authorship, and/or publication of this article.
Funding
The author(s) disclosed receipt of the following financial support for the research, authorship, and/or publication of this article: This paper has been partly funded by the Swiss National Science Foundation (project InfraGouv – grant: 196521).
