
Abstract
Urban sprawl is now a common and threatening phenomenon in Europe, severely affecting environmental and economic sustainability. An analytical characterization and measurement of urban sprawl are required to gain a better understanding of the phenomenon and to propose the possible solutions. Traditional factor analysis techniques, especially Principal Component Analysis and Factor Analysis, have been commonly used. In this paper, we additionally test Independent Component Analysis with the aim to obtain a multidimensional characterization of the sprawl phenomenon. We also use Bayesian Factor Analysis to obtain a single (unidimensional) measuring index of sprawl, which also allows us to obtain the uncertainty of the inferred index, in contrast to traditional approaches. All these techniques have been applied to study the phenomenon of urban sprawl at the municipality level in Valencia, Spain using a wide set of variables related to the characteristics and patterns of urban land use.
Introduction
Urban sprawl is the spread of human populations from central urban areas to outlying residential areas with lower population densities and more open spaces, where single family homes and low-rises predominate, and to which residents tend to travel by car. This urban model is characterized by low-density urban expansion patterns, producing a patchy, scattered, discontinuous and strung-out urban development, often under a lax planning control. This kind of urban land development is typical of the United States but is more recent in Europe, where cities have traditionally grown around historical settlements, and even more so in the Mediterranean region, which has been characterized by compact cities until only a few years ago. Urban sprawl is a global challenge, and now a common phenomenon in Europe, where there has recently been great interest in studying it (European Environment Agency (EEA), 2016). This is also the case in Spain, where growth in urban areas has created a situation that is becoming critical because of its impact on the environmental and economic sustainability of cities (EEA, 2006). Therefore, it is necessary to improve the framework and tools to control urban sprawl, through urban policies, which requires a more extensive knowledge of the phenomenon under study.
The sprawl pattern is a complex construct, difficult to conceptualize and measure, with many different conditions involved related to the density, uses, form and structure, as well as to economic and social aspects, of urban areas. Sprawl is not directly observable, but there are several indicators related to it that can be defined and measured, so that their correlation structure and the latent dimensions (underlying factors not directly observable or measureable) can be extracted by factorial statistical techniques (Johnson and Wichern, 2007). Latent dimensions can be a useful multidimensional measure of sprawl, and a better understanding of the problem can be achieved by interpreting their correlation structure.
Traditional factor analysis techniques, such as Principal Component Analysis (PCA) and Factor Analysis (FA), are commonly used for the purpose of extracting the correlation structure and the latent dimension from a set of indicators. FA is well suited for a multidimensional characterization, since it identifies the underlying latent factors in the input variables by minimizing the linear correlation among latent factors (Frenkel and Ashkenazi, 2008). The first component of PCA, which results from the first eigenvector and eigenvalue of the covariance matrix of the input set of variables, represents the common factor that maximizes the variability; therefore, it is commonly used for unidimensional characterizations. Both techniques are based on linear model structures and assume normality of the input variables. Many environmental variables may not be normally distributed, which can be handled through transformation, and hence the results must be interpreted in terms of the transformed variables. In contrast, independent component analysis (ICA) (Stone, 2004) does not require normally distributed variables and results in statistical independence between the latent variables where the joint probability of the latent factors can be factorized (Shlens, 2005). As far as we know, there is no application of this technique in urban studies.
FA performed by means of Bayesian hierarchical models is a very powerful method for computing the unidimensional common factor that maximizes variability (Conti et al., 2014; Mezzetti and Billari, 2005) and does not assume any specific probability distribution for the variables. Furthermore, the non-linear covariance structure over the common factor, such as spatial and/or temporal covariance, can be easily specified (Marí-dell’Olmo et al., 2011), and credible intervals (uncertainty) can be inferred from the posterior distributions of the common factor parameter estimated in each municipality. Finally, the treatment of missing values is handled more appropriately, which are estimated during the Markov Chain Monte Carlo (MCMC) simulation method.
Thus, the first objective of this study is to extract the latent dimensions that underlie the input set of variables by means of the application of the ICA method, thus obtaining a multidimensional analytical characterization at the municipality for Valencia in Spain. A comparison between the ICA, FA and PCA solutions is also performed. The second objective is to compute a unidimensional measurement index as the common factor to all input variables using Bayesian hierarchical models (Ntzoufras, 2009). Although the underlying multidimensional information is lost, the phenomenon is simplified and facilitates the measurement and interpretation of the spatial distribution of sprawl throughout the territory, especially for professionals from different disciplines who may find it difficult to deal with multiple dimensions.
Brief background
Even though there is abundant literature, it is difficult to find a definitive consensus. Following Galster et al. (2001), urban sprawl is one name for many conditions. Most definitions are based on the assumption of a traditional compact city understood as the ideal model and the starting point to define the opposite model (Chin, 2002; EEA, 2006). For the EEA (2006), sprawling cities are characterized by a physical pattern of low-density expansion of large urban areas growing into the surrounding agricultural areas, which produces a patchy, scattered and strung-out urban development, with a tendency to discontinuity. According to Fulton et al. (2001), sprawl is associated with a land consumption higher than the population growth, and its commonly used indicator is the per capita consumption of land.
Factors used to measure sprawl in the literature.

There are important differences in these characteristics; yet all authors consider density as an essential feature to measure sprawl. Sprawl has static as well as dynamic components associated with population growth or expansion of urban land. Another essential characteristic is the land consumption or the footprint caused by sprawl development. Furthermore, factors linked to how dispersed urban land is are present in almost all studies with various forms (such as fragmentation, concentration and nuclearity) and different metrics, most of them derived from landscape ecology, such as the Shannon entropy index (Colaninno et al., 2011; Torrens, 2008; Zeng et al., 2014), the degree of landscape division or the Gini index of concentration (Colaninno et al., 2011). Many studies also considered a composition dimension and the consequent possible relations between uses: proximity, mixed use, accessibility, open space or connectivity. Finally, some authors considered other characteristics, like complexity, with the use of other landscape metrics, such as Fractal dimension or Shape Index (Colaninno et al., 2011; Frenkel and Ashkenazi, 2008; Zeng et al., 2014), or social factors (Torrens, 2008).
Moreover, the observed variables may differ according to the scale of the study (Torrens, 2008; Zeng et al., 2014). Sprawl is a multiscale phenomenon, with different characteristics, so measuring dispersion requires a multiple level approach in accordance with the function of the scale (Zeng et al., 2014). The macro-scale measurements, when analysis units correspond to regional or metropolitan areas, normally use socio-economic census indicators (Arribas-Bel et al., 2011; Cutsinger and Galster, 2006; Ewing et al., 2002; Galster et al., 2001). Measuring sprawl at a micro- or meso-scale, corresponding to a local characterization, requires a more accurate analysis of the spatial characteristics of the urban land use pattern, as spatial or morphological metrics (Colaninno et al., 2011; Frenkel and Ashkenazi, 2008).
Methods used to measure urban sprawl.
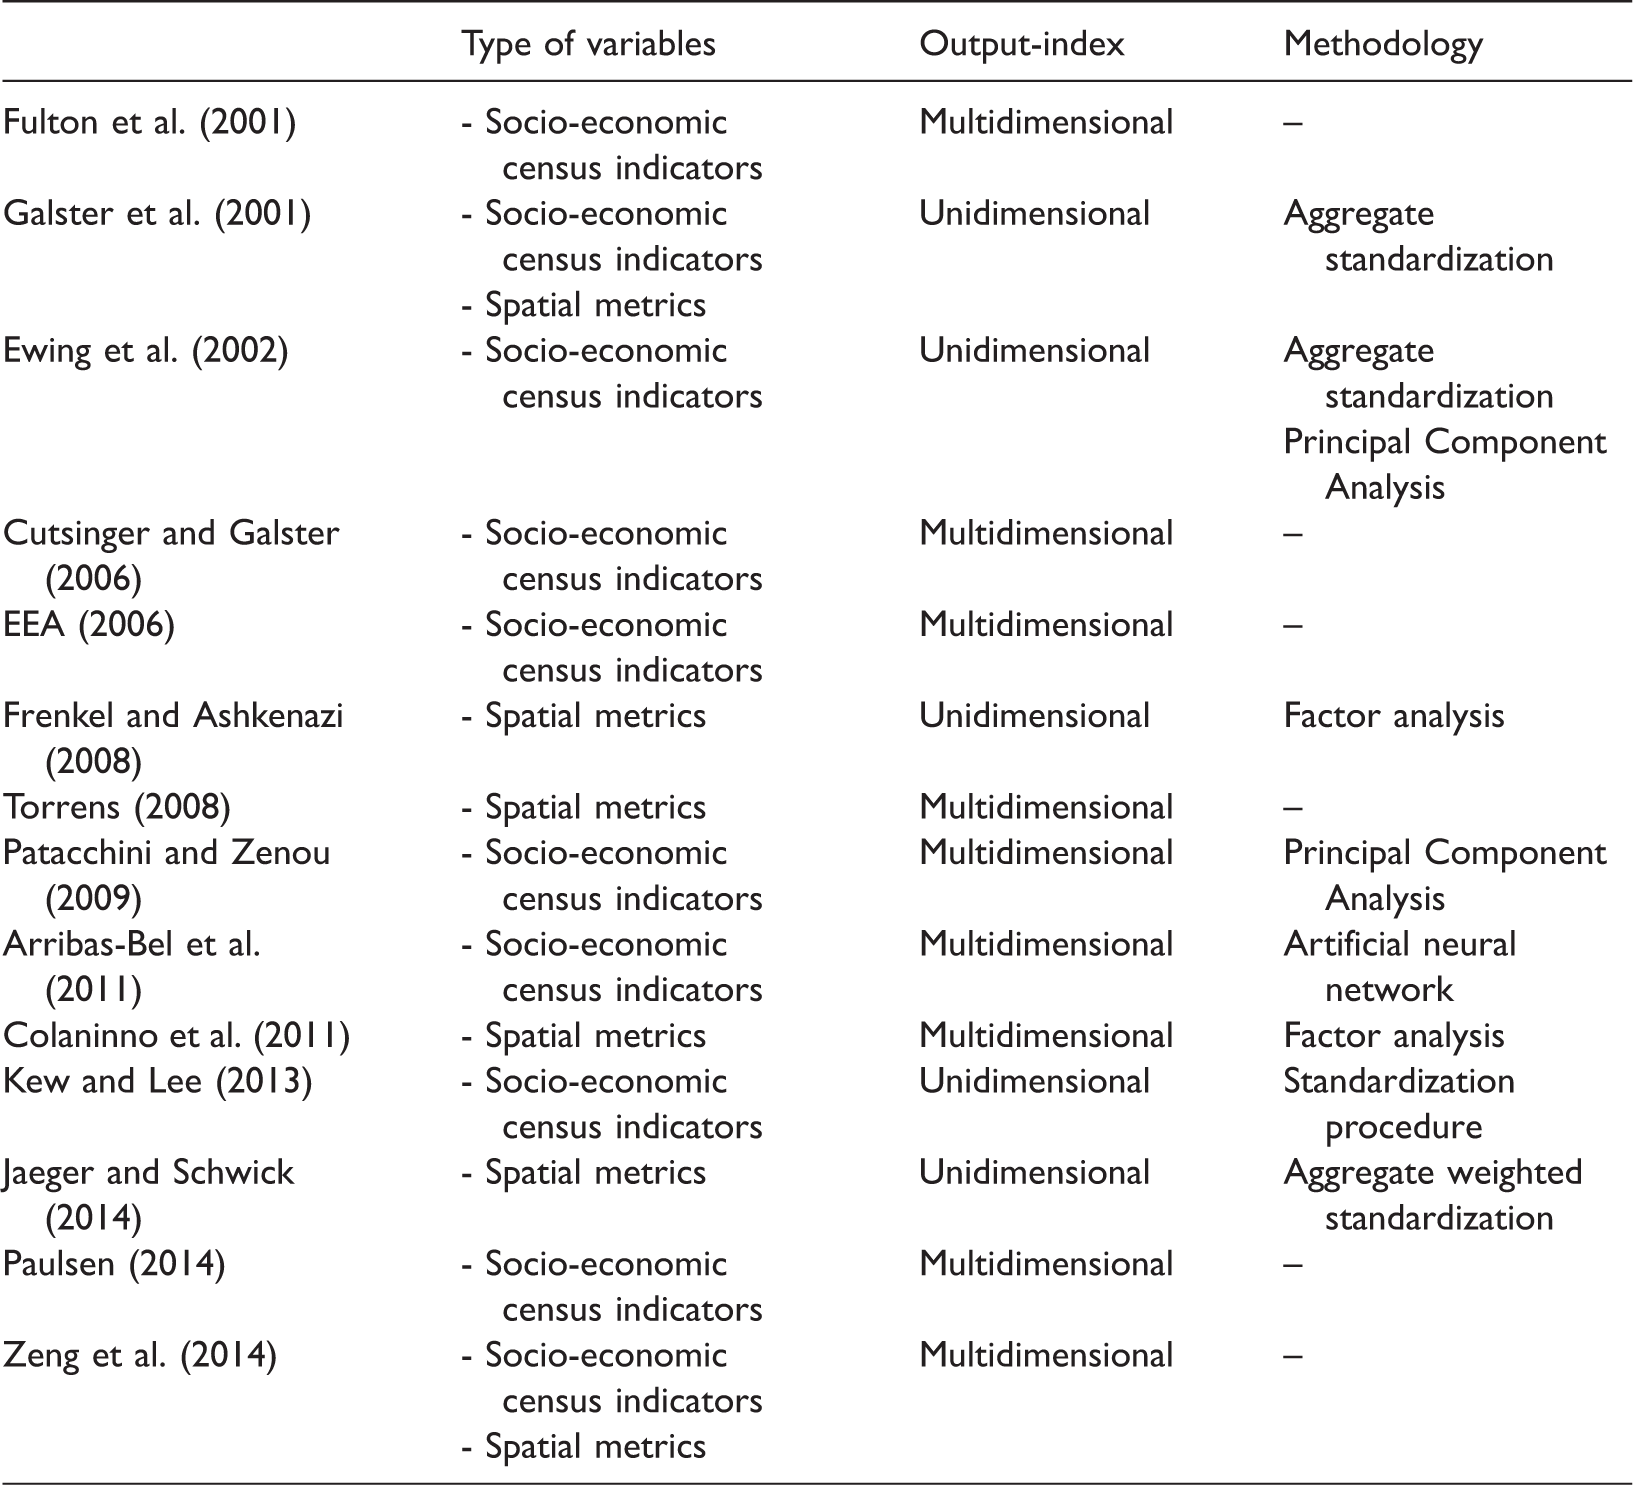
Some researchers have obtained a multidimensional output index without using any statistical procedure, but only using the original variables simultaneously to conceptually categorize the sprawl (Cutsinger and Galster, 2006; EEA, 2006; Fulton et al., 2001; Paulsen, 2014; Torrens, 2008; Zeng et al., 2014). Others have obtained a unidimensional index only by means of an aggregate standardization of various input variables.
PCA, FA and neuronal networks are the statistical models commonly used in the literature either for unidimensional or multidimensional characterizations of sprawl. The work of Frenkel and Ashkenazi (2008) obtains a unidimensional index from FA with only one factor, which is equivalent to the first component of PCA. No work has been found in the literature in which ICA or a Bayesian factor approach has been used for characterizing sprawl.
Regarding its impacts, urban sprawl development has left a very large footprint in Spain (EEA, 2006). The Corine Land Cover project and the Spanish Land Use Information System (SIOSE) reaffirmed these trends, even after the end of the housing boom in 2010 (Zornoza, 2013). Also, the European Parliament, by passing the Auken resolution, points at the impact of extensive urbanization in Spain.
There are interesting reviews in the literature of the effects of sprawl in Johnson (2001), Ewing et al. (2002), Burchell et al. (2003), Ewing (2008) or Wilson and Chakraborty (2013). Urban sprawl threatens sustainability, transforming natural and rural environments, raising noise pollution over the safety limits and creating more greenhouse gases, which affect climate change (EEA, 2006; Wilson and Chakraborty, 2013). There are also public and private costs associated with sprawl as outlined in Burchell et al. (2003).
Despite the commonly known negative effects of sprawl (e.g. the private cost associated with congested roads), urban sprawl also generates some benefits to people individually. In fact, these benefits are generally the causes of sprawl: people look for a better quality of life, more open space, wish to live in houses with gardens, etc. However, the balance seems to be negative on the community (Chin, 2002; Garbiñe, 2007; Miralles et al., 2012; Pichler, 2007).
From an economic perspective, urban sprawl is an expensive model of urban development (EEA, 2006) and is clearly inefficient (Garbiñe, 2007). The sprawled city has economic costs with a significant impact on public local finance because of the public services assumed by municipalities, as demonstrated in many studies in the United States (Burchell et al., 2003; Carruthers and Ulfarsson, 2003; RERC, 1974; Speir and Stephenson, 2002). In Spain, some authors have also addressed this issue (Benito et al., 2010; Garbiñe, 2007; Hortas-Rico, 2014; Solé-Ollé and Hortas-Rico, 2008). In any case, all of them provide very different results, depending on which expenditure is considered and where it has been studied. Therefore, the discussion on the compact or dispersed city requires more studies on measuring and evaluating the cost of sprawl in order to be able to give the correct responses and make the correct decisions on which urban model to choose. It is important, therefore, to continue increasing the knowledge about how to measure urban sprawl, especially in the Spanish context, where important economic effects may arise due to the urban development occurred in recent decades.
Scope of the study and information sources
The study area is the autonomous community of Valencia, located on the Mediterranean coast in southeast Spain. More than 5 million people currently live there, in a total of 542 municipalities and an area of 23,255 km2. The territory is administratively divided into three provinces: Castellon, Valencia and Alicante. From a geomorphological point of view, the Valencian Community can also be divided into three different geographical areas: coastal, intermediate and rural areas (Figure 1).
Geographical areas of the Valencian community.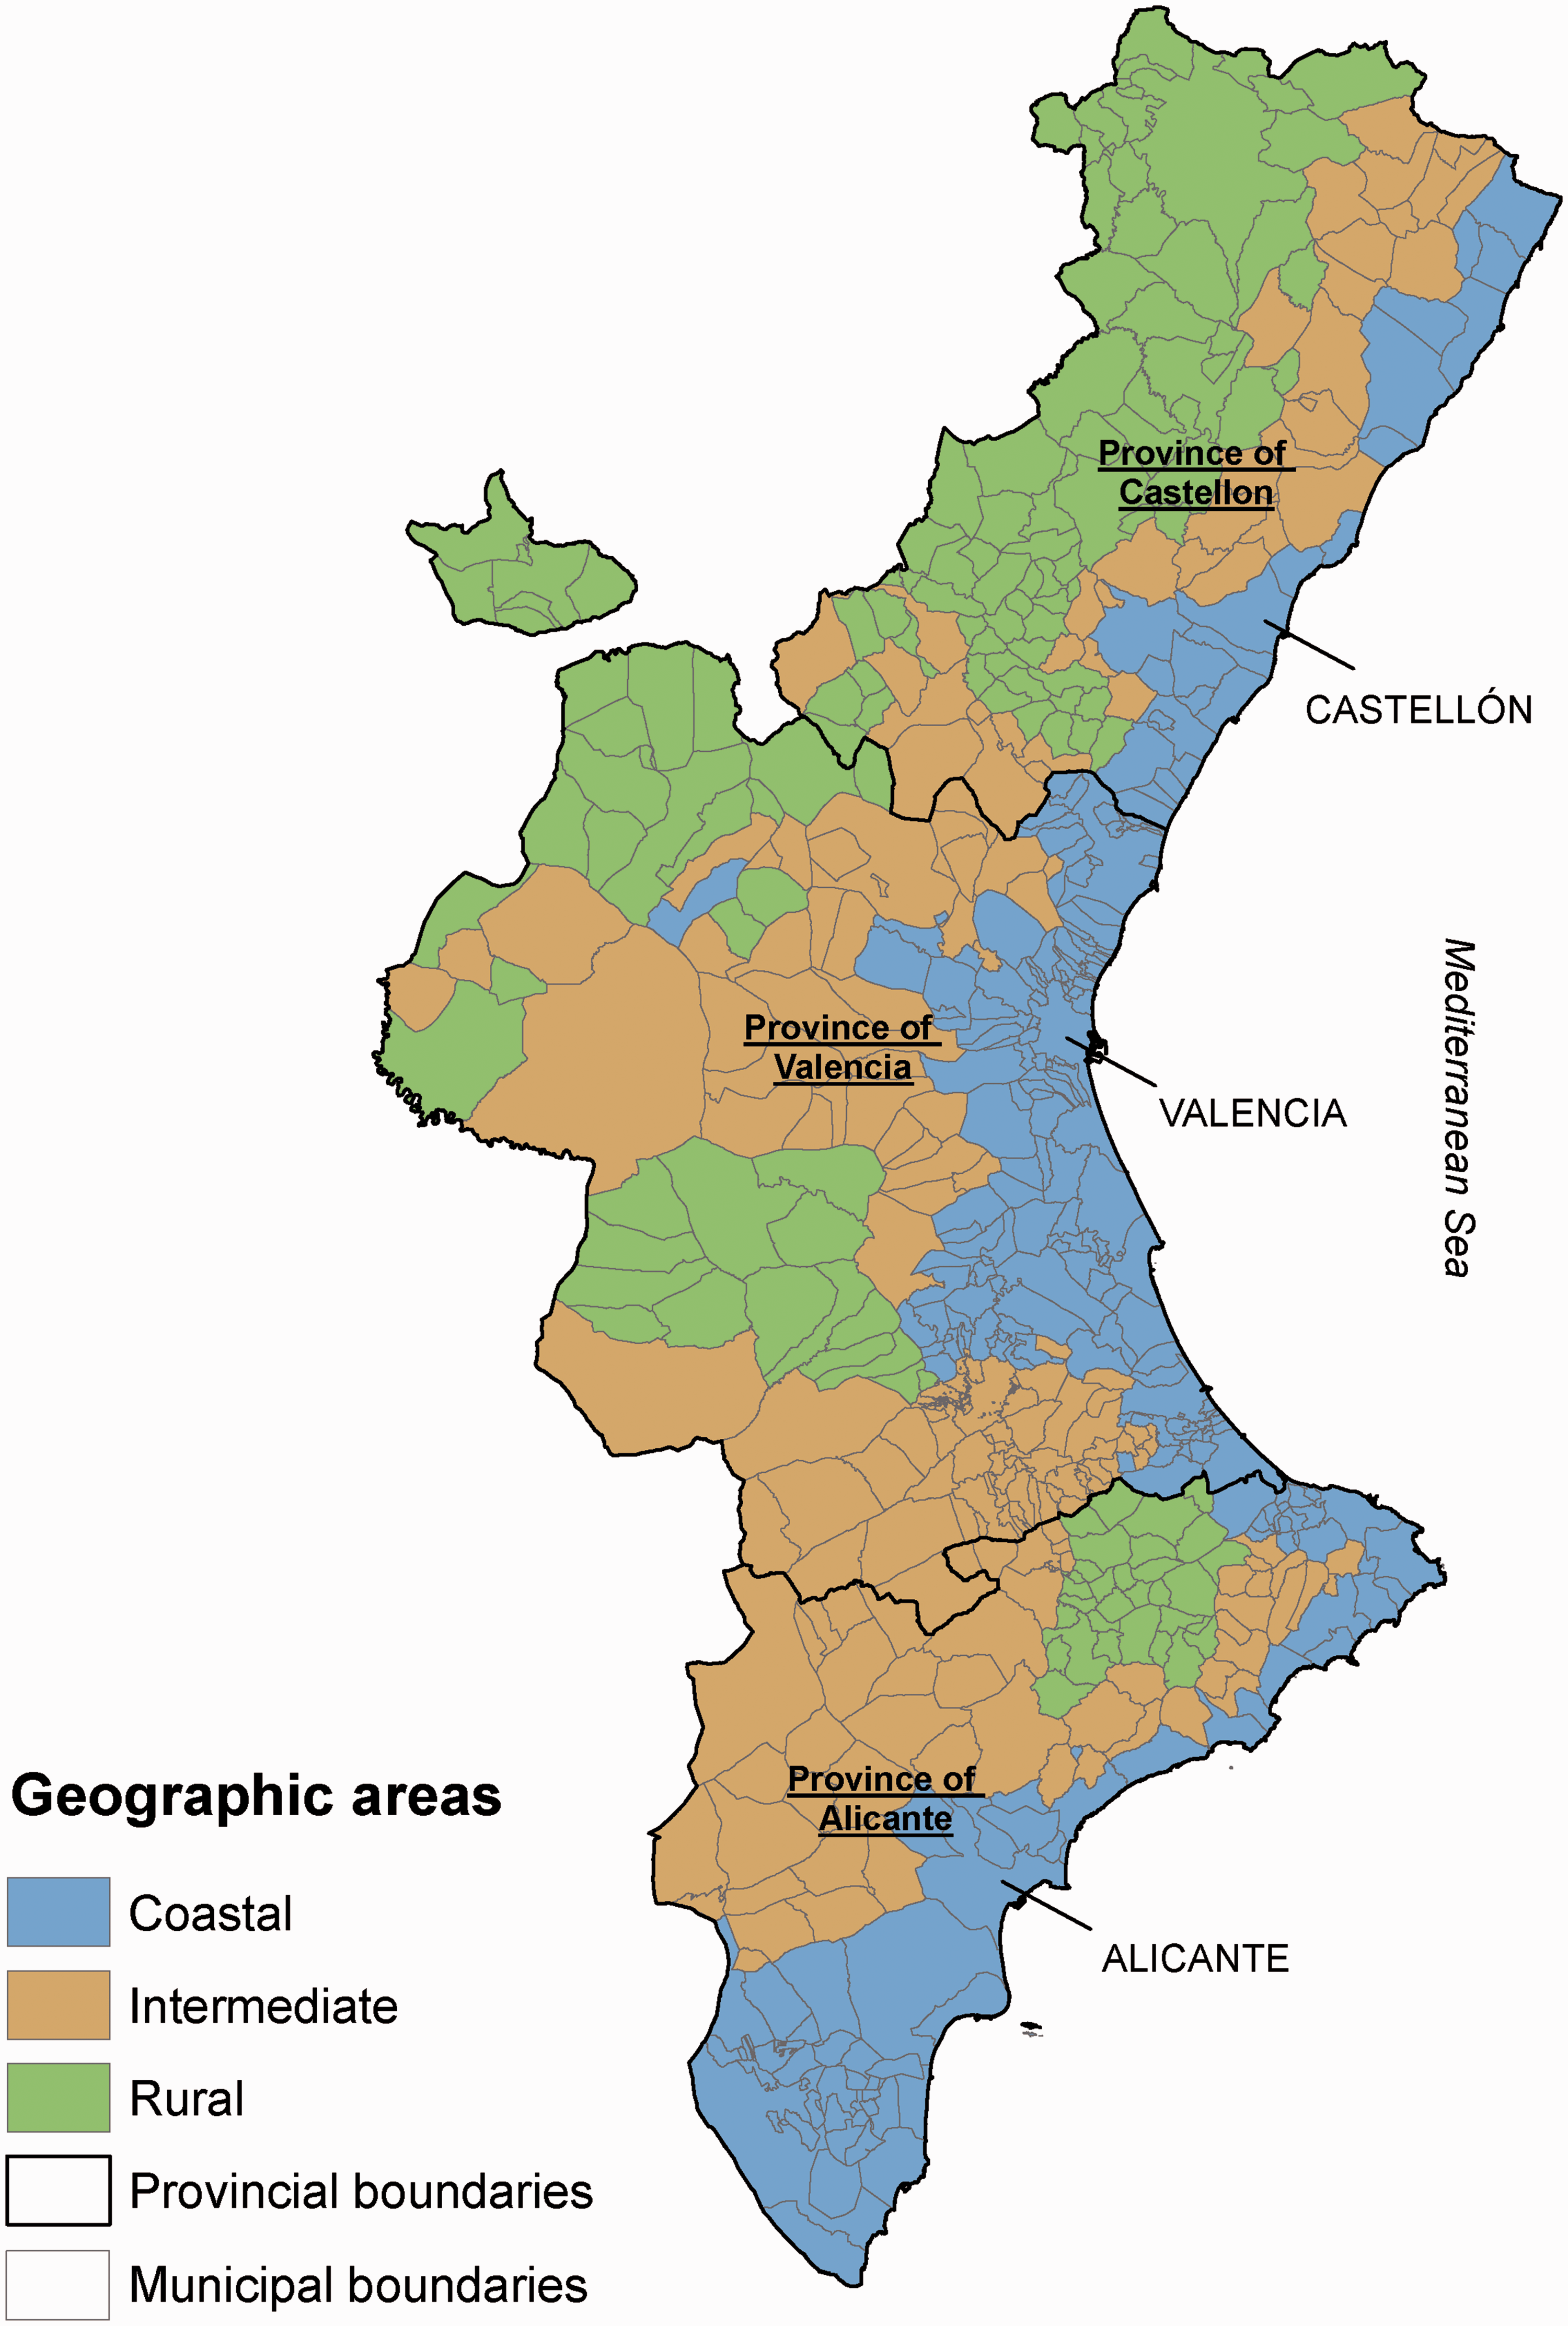
Eighty percent of the population is concentrated in the coastal area, in an area equivalent to 25% of the total. The territory is flat with less than 100 meters above sea level, and a densely populated area (696.48 people per hectare), where 85% of the GDP of the region is concentrated. It is characterized by coastal urban areas and metropolitan areas, with a predominance of irrigated agriculture and a greater economic weight of services, especially tourism. The intermediate area represents 17% of the population of Valencia on 37% of its surface with a lower density (101.80 people per hectare) and only 13% of the region’s GDP. It corresponds to an intermediate zone between the coast and the mountains, with medium-sized cities and predominance of industry and rain-fed agriculture. Thirdly, the rural area (38% of the territory) is a mountain area, with small towns in which only 2% of the population lives. This area only represents 2% of the region’s GDP, with forested areas and an economy based on agriculture and services.
In regard to urban occupation, there are large differences between areas: in the coastal area, 70% of the total urban development is concentrated in Valencia with 37% and 3.3% in the intermediate and rural areas, respectively. The type of settlement also varies: 40% of the urban development in the coastal area is contiguous, while 60% is not. In the intermediate area, more than 70% of the urban development is not contiguous. Lastly, 67% of the urban development in the rural area is characterized by a contiguous urban development.
Mediterranean cities were examples of compact cities for a long time, “historically characterized by the archetypal image of density, urban complexity and social diversity” (Munoz, 2003). However, recently, this paradigm has changed, due to urban development, especially in coastal areas. This is also the case for Valencia.
In Spain, this phenomenon is the result of three expansive economic cycles associated with corresponding housing bubbles (Miralles, 2014): a first cycle, in 1959–1972, which created the first tourist developments on the coast; a second cycle, from 1985 to 1990, which generated a major urban development on the Mediterranean coast; and a third cycle, from 1997 to 2006, which resulted in new investments in the real-estate construction sector. In a context marked by greater access to private transport, helped by falling transport costs (Muñiz, 2006), at least during the first two cycles, as well as a change in the lifestyle of people, asking for more space (Jaeger and Schwick, 2014), and poor control mechanisms in the legislation of land use planning, cities became more dispersed. Fortunately, the passing of the Valencian Community Territorial Strategy in 2011 introduced some rationality in urban growth, for a sustainable and compact city.
The main information sources used were: the Population and Housing Census, the boundary limits, both from the National Statistics Institute, and the SIOSE (the Spanish Land Use and Cover Information System), a high-resolution GIS database on land cover and use, at a 25,000 scale, from the Valencian Cartographic Institute. We focused on residential buildings included in a composite coverage known as Mixed Urban. Each cover is defined according to the sum of different types of artificial simple uses (houses, streets, gardens, pools, etc.). There are three Mixed Urban covers: the old area, the expansion area (new parts) and the discontinuous area or suburbs. In addition, these covers are characterized by attributes about the residential building type: isolated block of apartments or non-isolated block of apartments, single-family detached home, houses in rows or semi-detached houses.
Methodology
The first step was to obtain as many characteristics of urban sprawl as possible. Using the datasets outlined above, a set of urban sprawl indicators were calculated as outlined in the next section.
Indicators
Selected sprawl indicators.
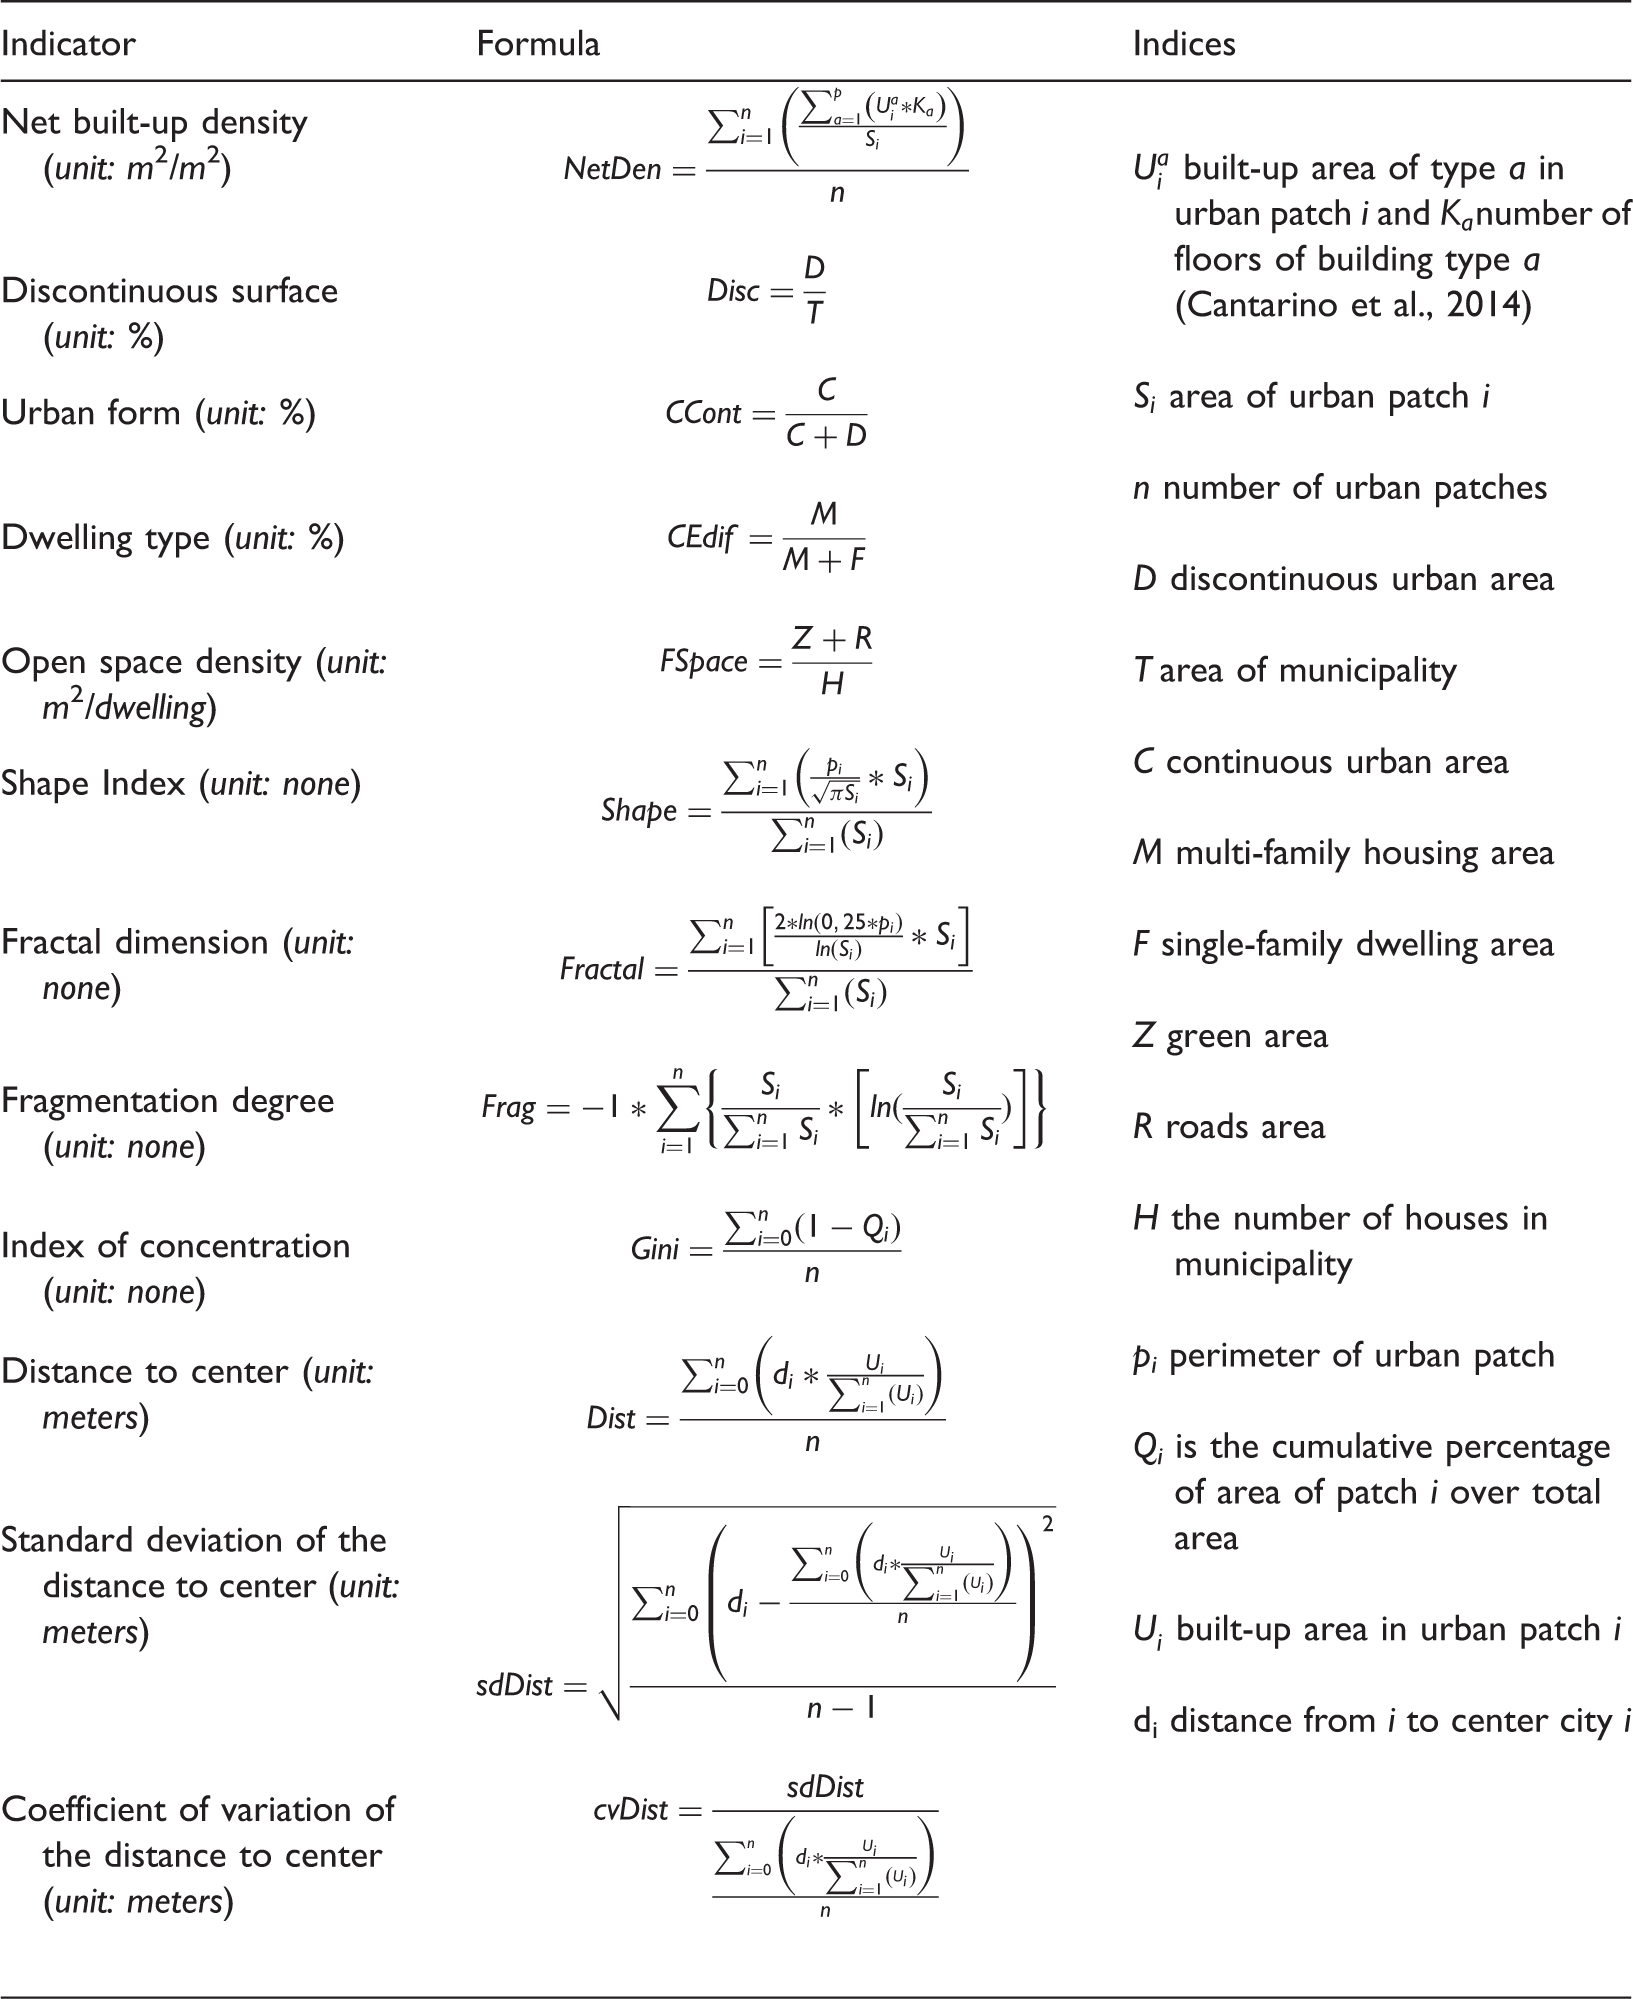
Density is the most popular measure of sprawl. The Net housing density indicator (NetDen) is the area-weighted average of housing density of all the urban patches in a municipality. However, sprawl is characterized by low housing density in single-family homes and discontinuous urban areas, so we also define an Urban form indicator (CCont) that assesses the proportion of continuous urban typology from the total urban surface. Likewise, the Dwelling type indicator (CEdif) evaluates the proportion of the multiple family homes from the total amount of homes. The Open space density indicator (FSpace) refers to green areas and street density in a municipality. Sprawled settlements are usually characterized by private gardens, swimming pools, bigger parks, parking areas and streets. The Shape index (Shape) and Fractal dimension (Fractal) are indicators of shape complexity based on the relationships between the perimeter and the area of the urban patch (Colaninno et al., 2011). Sprawl models tend to have irregular shapes in urban areas. The Fragmentation degree (Frag) and Index of concentration (Gini) are indicators related to fragmentation (Marmolejo and Stallbohm, 2008) and concentration of urban land (Colaninno et al., 2011). The Distance to center (Dist) indicator refers to the area-weighted average of distances from the urban patches to the city center. The Standard deviation of the distance to center (sdDist) measures the variability of the Dist indicator. In addition, we have computed the coefficient of variation of the Dist indicator (cvDist), which represents the variability independently of the magnitude of the mean. Finally, to account for the importance of the sprawl model in a municipality, we have computed the Discontinuous area indicator (Disc), which is the proportion of discontinuous urban surface in the municipality.
Multivariate factor techniques
Three factor multivariate techniques were then used to explore the correlation structure of the set of indicators and extract their underlying dimensions: ICA, which handles non-normally distributed variables (Hyvärinen and Oja, 2000), FA (Bartholomew, 2007) and PCA (Abdi and Williams, 2010), where the latter two approaches require normally distributed variables. As some of the indicators showed non-normal distributions, they were transformed prior to the application of FA and PCA; more details are provided in the online supplemental material.
ICA aims to extract the latent factors that are statistically independent of each other. This is achieved by a mutual-based information method, which has a form of non-linear optimization minimizing the information mutually shared among the extracted latent factors (Hyvärinen and Oja, 2000). The ICA method models the set of original indicators as a linear combination of new statistically independent components, as

FA resolves the linear combination of the new components, following the same expression in equation (1), by formulating a linear model that relates the original set of indicators X and the latent factorsS, taking into account the correlation structure of the variables in the formulation of the model and the method of maximum likelihood to estimate the model parameters (Graffelman, 2001). The R package Robustfa has been used to apply this method.
PCA performs Singular Value Decomposition of the correlation matrix of the set of variables. Using the same expression (1), this procedure leads to new latent factors determined by the eigenvectors and eigenvalues of the correlation matrix (Shlens, 2005). The R package FactoMineR has been used to apply this method. The first latent factor (first eigenvector and eigenvalue) will therefore be a common factor among all the variables that explain the maximum variability. The others (the other eigenvectors and eigenvalues) will then be consecutively orthogonal to each other. Consequently, as the first latent factor is the maximum-variance consensus among all the variables, this can include potentially different dimensions.
Bayesian factor analysis
This section aims to define a single index for urban sprawl, which is the common factor maximizing the variability contained in the set of variables. Although the multidimensional information is lost, the phenomenon is simplified and facilitates the interpretation of the spatial distribution of sprawl throughout the territory.
In this study, Gaussian models were used for all the variables, which were previously transformed into normal distributions (see online supplemental material). The Bayesian factor model for inferring only one single latent factor is based on finding the linear combination between scores and loadings that maximize the likelihood of the model (Marí-Dell’Olmo et al., 2011). If the likelihood is considered as Gaussian, then the procedure is equivalent to traditional FA. Furthermore, the Bayesian approach allows us to estimate the uncertainty of the inferred latent factors and to incorporate the process of imputing the missing values of the set of variables at the same time as the resolution of the Bayesian factor model and the estimation of its parameters.
The Bayesian factor model is performed using hierarchical models. Let 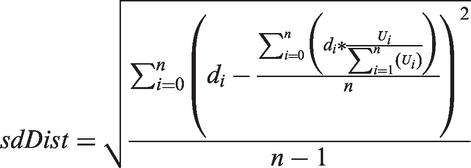
For the general means
Once the complete Bayesian hierarchical model has been formulated, a learning process based on MCMC can be applied to estimate the posterior distributions of the parameters of the model. We have used the WinBUGS software (Lunn et al., 2000) to run the MCMC on the proposed model (Ntzoufras, 2009). From the posterior distributions of the estimated parameters, their mean and variance can be inferred. The variance represents the uncertainty of the estimated parameter.
Results
Results of the multivariate factor analysis
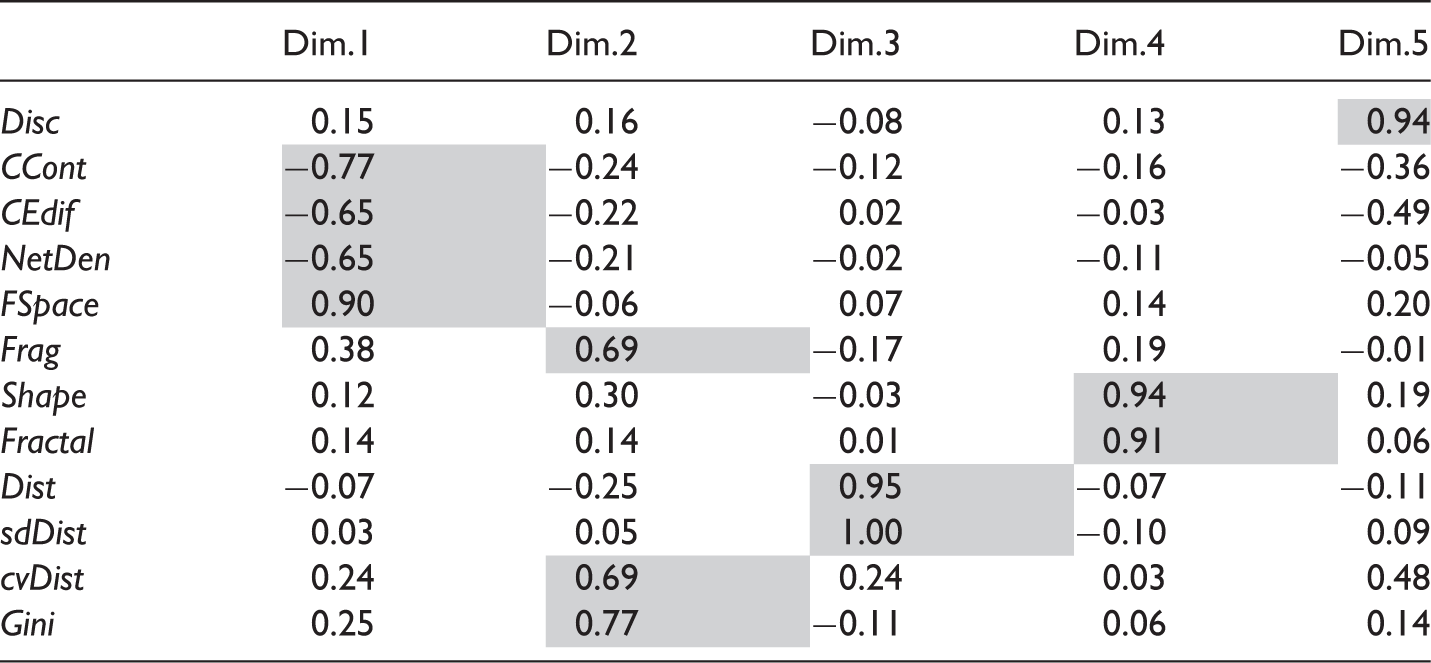
The results of ICA.
The results of FA.
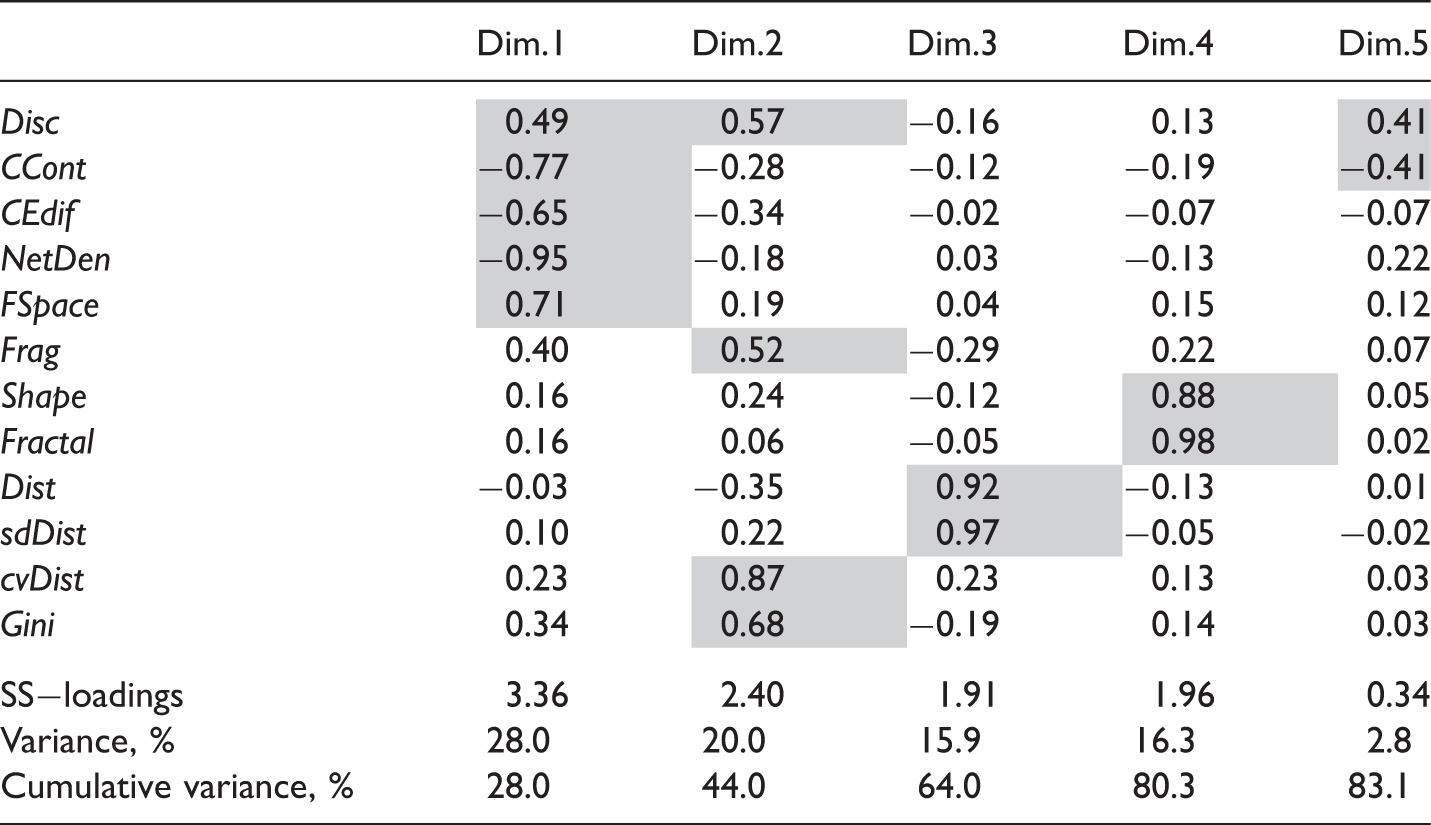
The ICA method seems to produce the best results and the clearest interpretation of the latent factors. It should be noted that the individual weights (loadings) of the dominant variables in each of the latent factors are more balanced in ICA than in FA solution. Although in ICA solution the explained variances of each of the latent factors are not shown, they are expected to be quite similar to the FA.
In summary, five clear dimensions were extracted. The weakest dimension is probably dimension 5, with only around 6% of the explained variance. Dimension 1 is composed of CCont, CEdif, NetDen and FSpace, all of which are variables related to intensity of use, i.e. density and concentration of housing and population. Dimension 2 is composed of Frag, cvDist, and Gini, all related to spatial fragmentation, dispersion and concentration of urban patches. Dimension 3 is composed of Dist and sdDist, related to the mean and variance of distance from the urban patch to the center of town. Dimension 4 is composed of the Shape and Fractal shape complexity indicators. Dimension 5 is related to the Disc variable, which measures the relative importance of the discontinuous land.
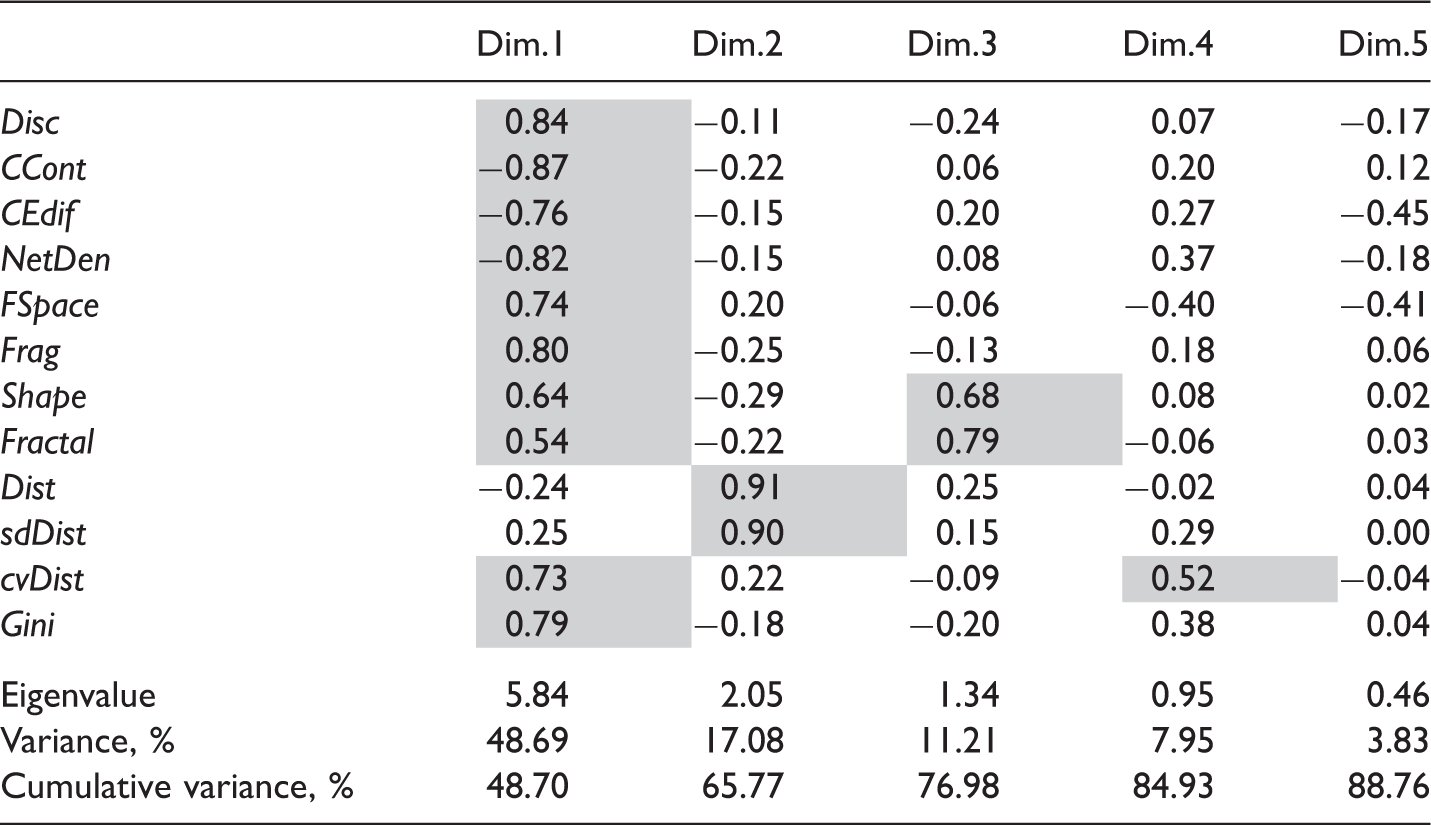
The results of PCA.
Results of the Bayesian factor analysis
Loadings of latent factor (common factor) from Bayesian factor analysis.


Map of sprawl index.

Map of uncertainty of sprawl index.
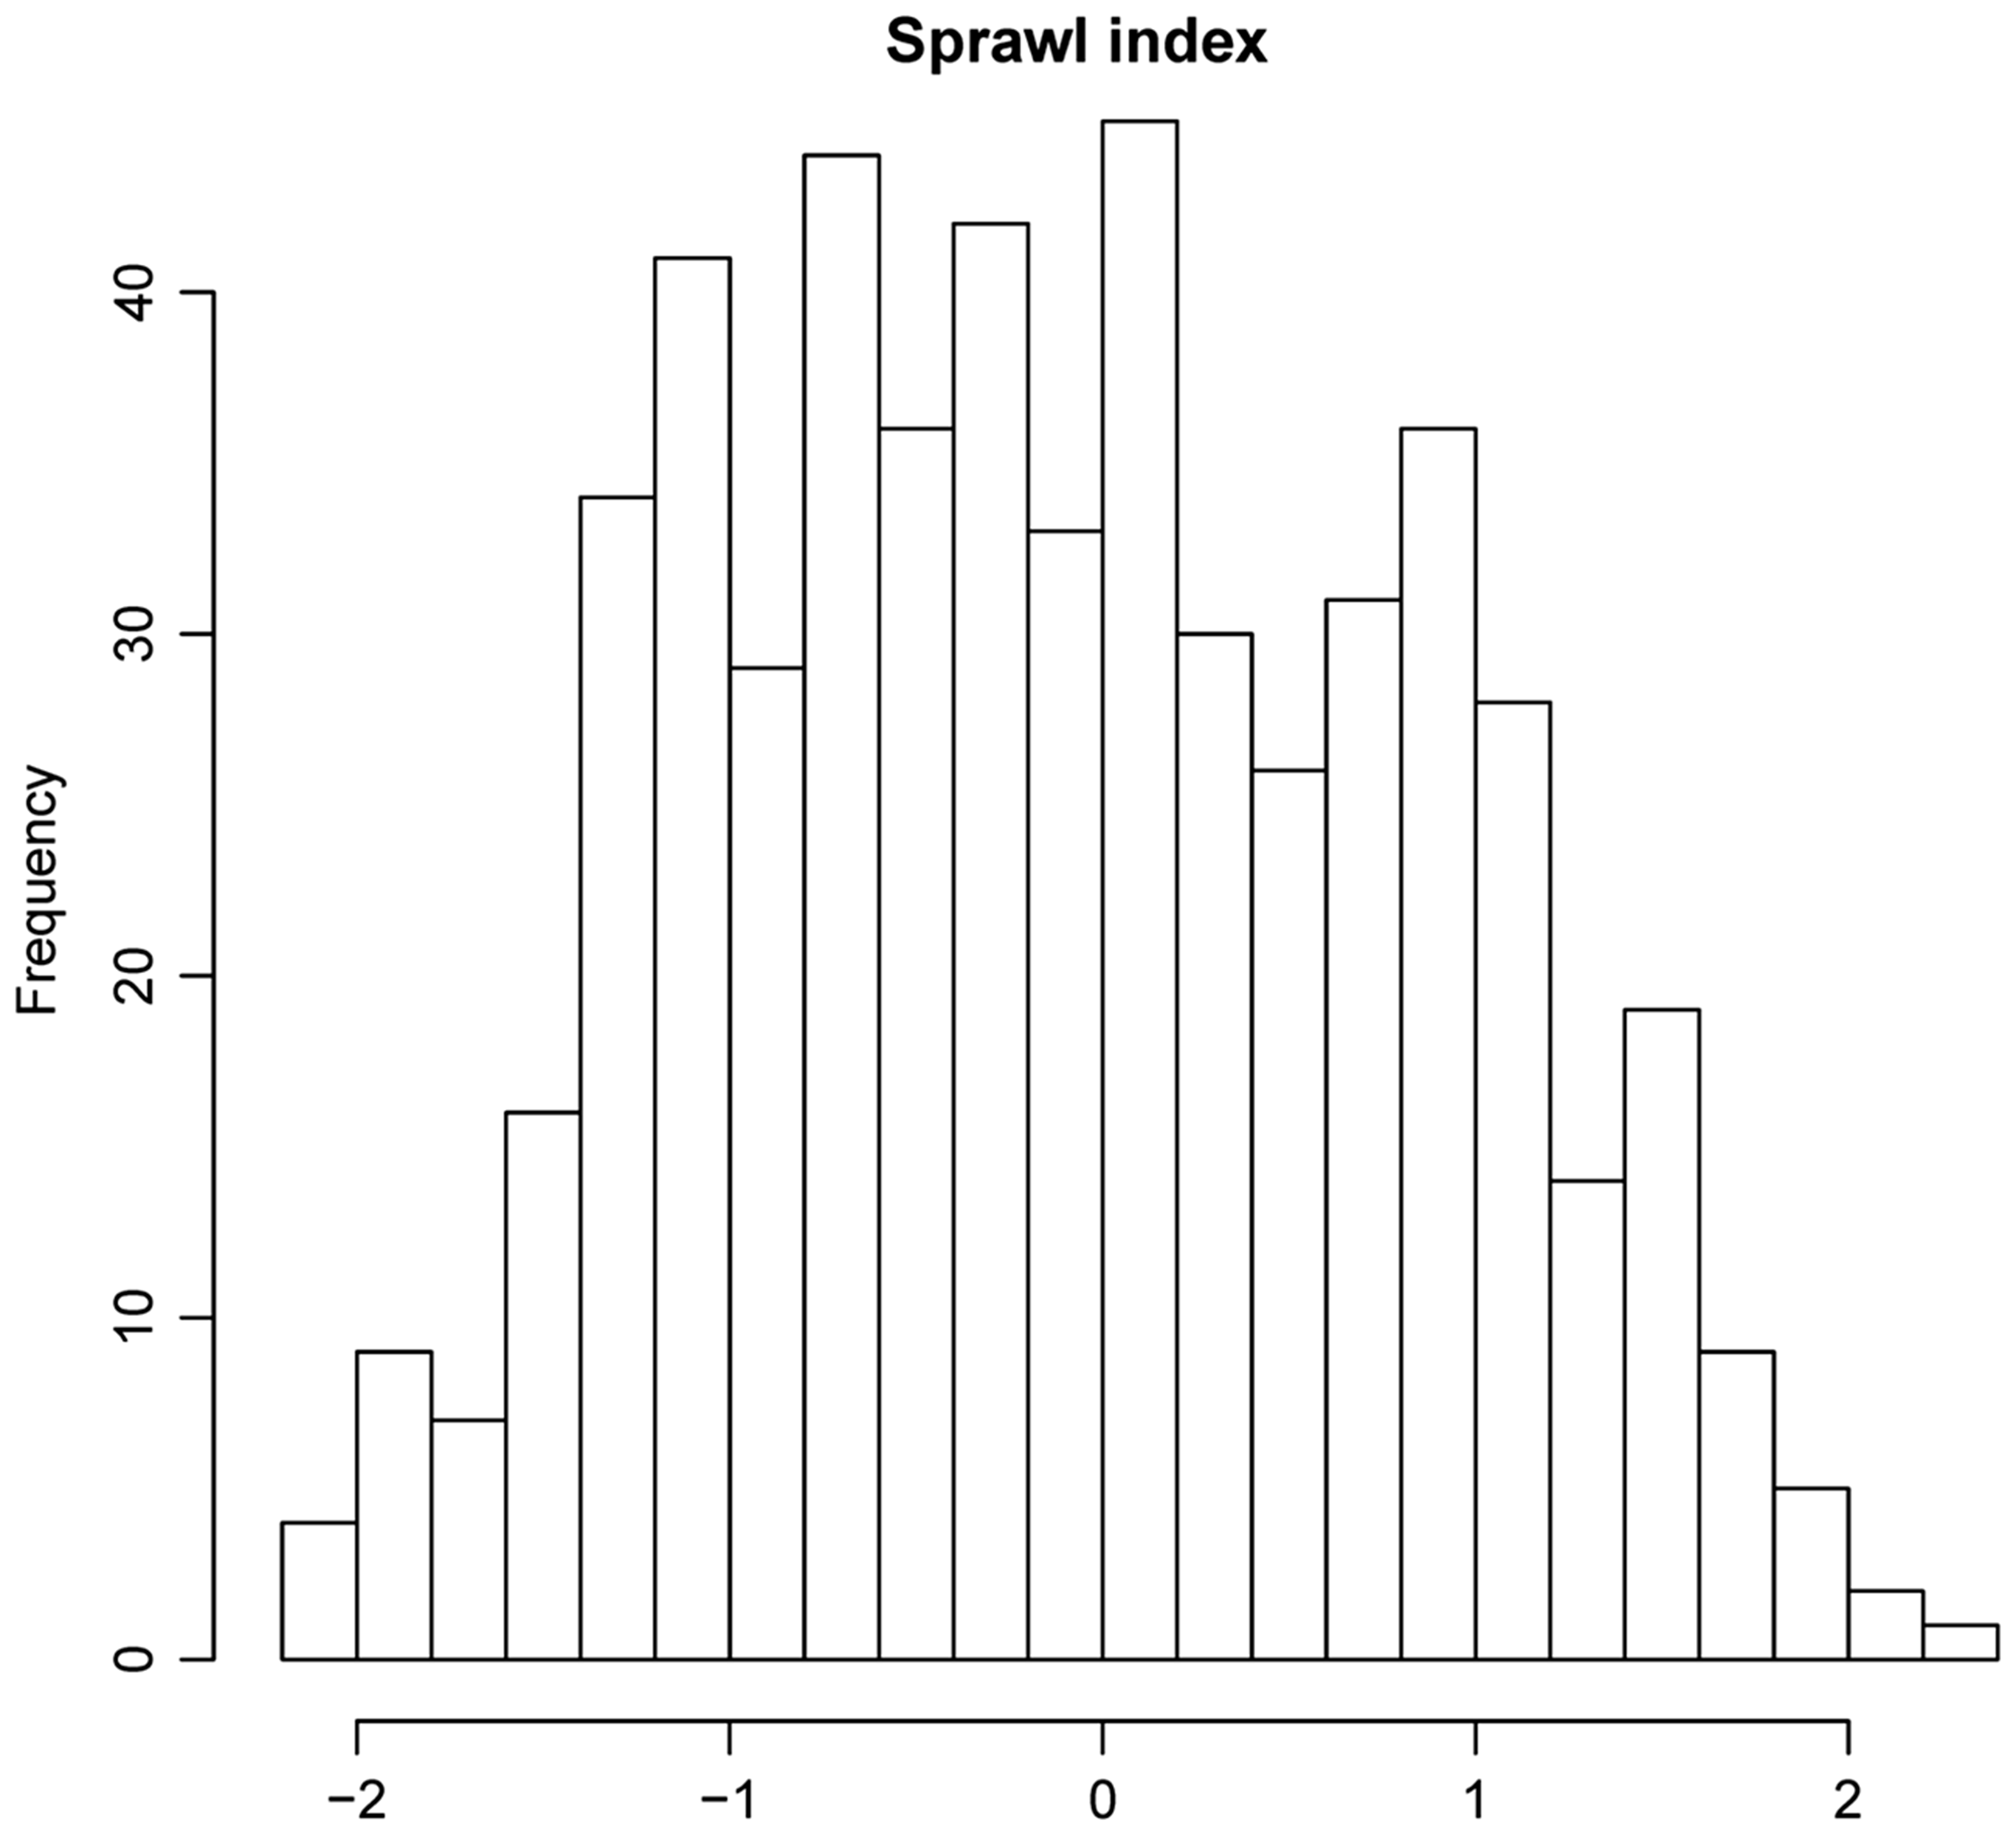
Histograms of sprawl index.
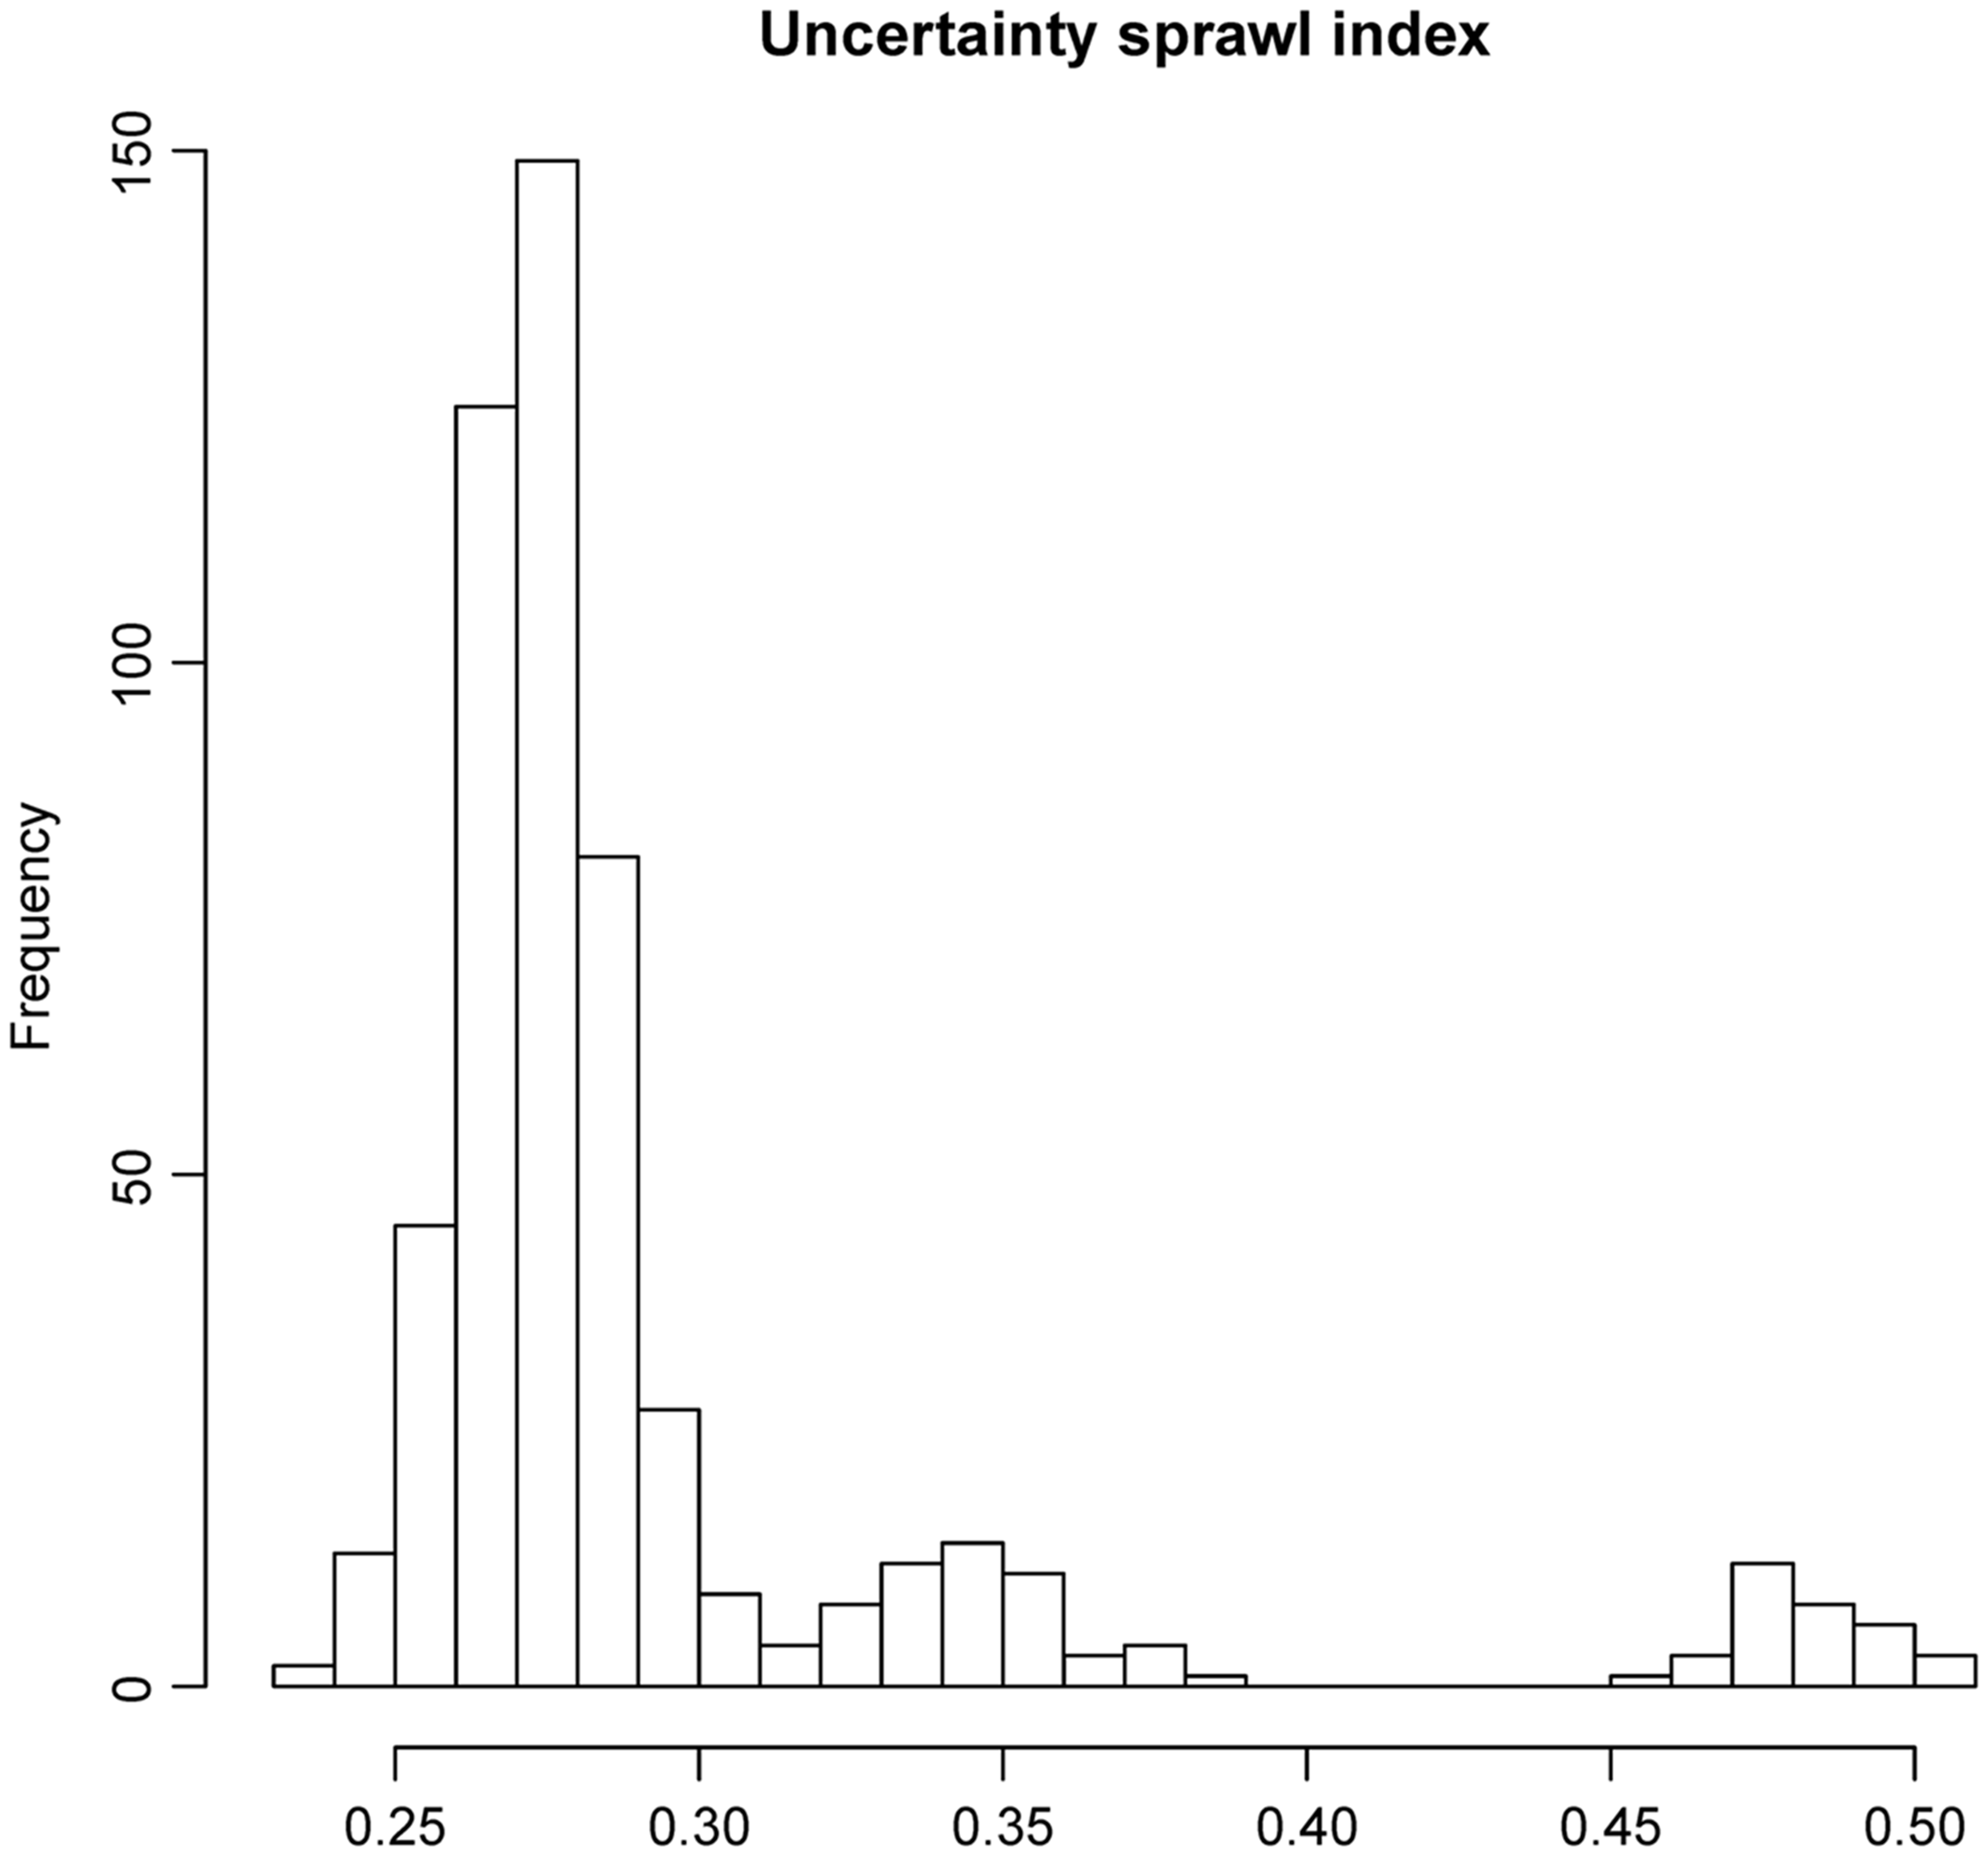
Histograms of the uncertainty of the sprawl index.
The uncertainty is around 10% of the index, which seems to be admissible for the phenomenon under study. Furthermore, its variation is very small. It varies from 0.25 to 0.33, which shows the good consistency of the model. Only two groups of municipalities with anomalous values can be seen, showing a lack of fit in the model. The values higher than 0.33 correspond to municipalities in inland and rural areas, whose behavior in their urban models is quite different to most of the other municipalities, with a much smaller or non-existent sprawl model. In most cases, they are small municipalities with a single urban patch. The municipalities with an uncertainty higher than 0.45 have additional missing values in their indicators, which is the reason for the high uncertainty.
Understanding urban sprawl in Valencia
Using multivariate factor techniques, we extracted five different dimensions from the set of original indicators to achieve a better understanding of urban sprawl in Valencia.
First underlying dimension (Figure 6) is composed of the following variables: net housing density (NetDen), proportion of continuous urban typology (CCont), proportion of multiple family homes (CEdif) and density of net open space (FSpace), associated with the intensity of residential use and load capacity of the territory, which are clearly dependent on urban typology and density, both of which are planning policy parameters. The development of this dimension appears especially in western municipalities in the metropolitan area of Valencia and Castellon, favored by the expansion of the cities and the development of bedroom communities in middle-class towns. It also appears intensively throughout the province of Alicante and in the north coast of the province of Castellon due to a low density urban model promoted by tourism. However, this dimension is not developed in most of the coastal municipalities due to the high concentration and densification of buildings and population, caused by the appeal of the beach. In the more rural and mountainous areas, it is clear that this dimension does not have a significant effect.
Map of dimension 1, intensity.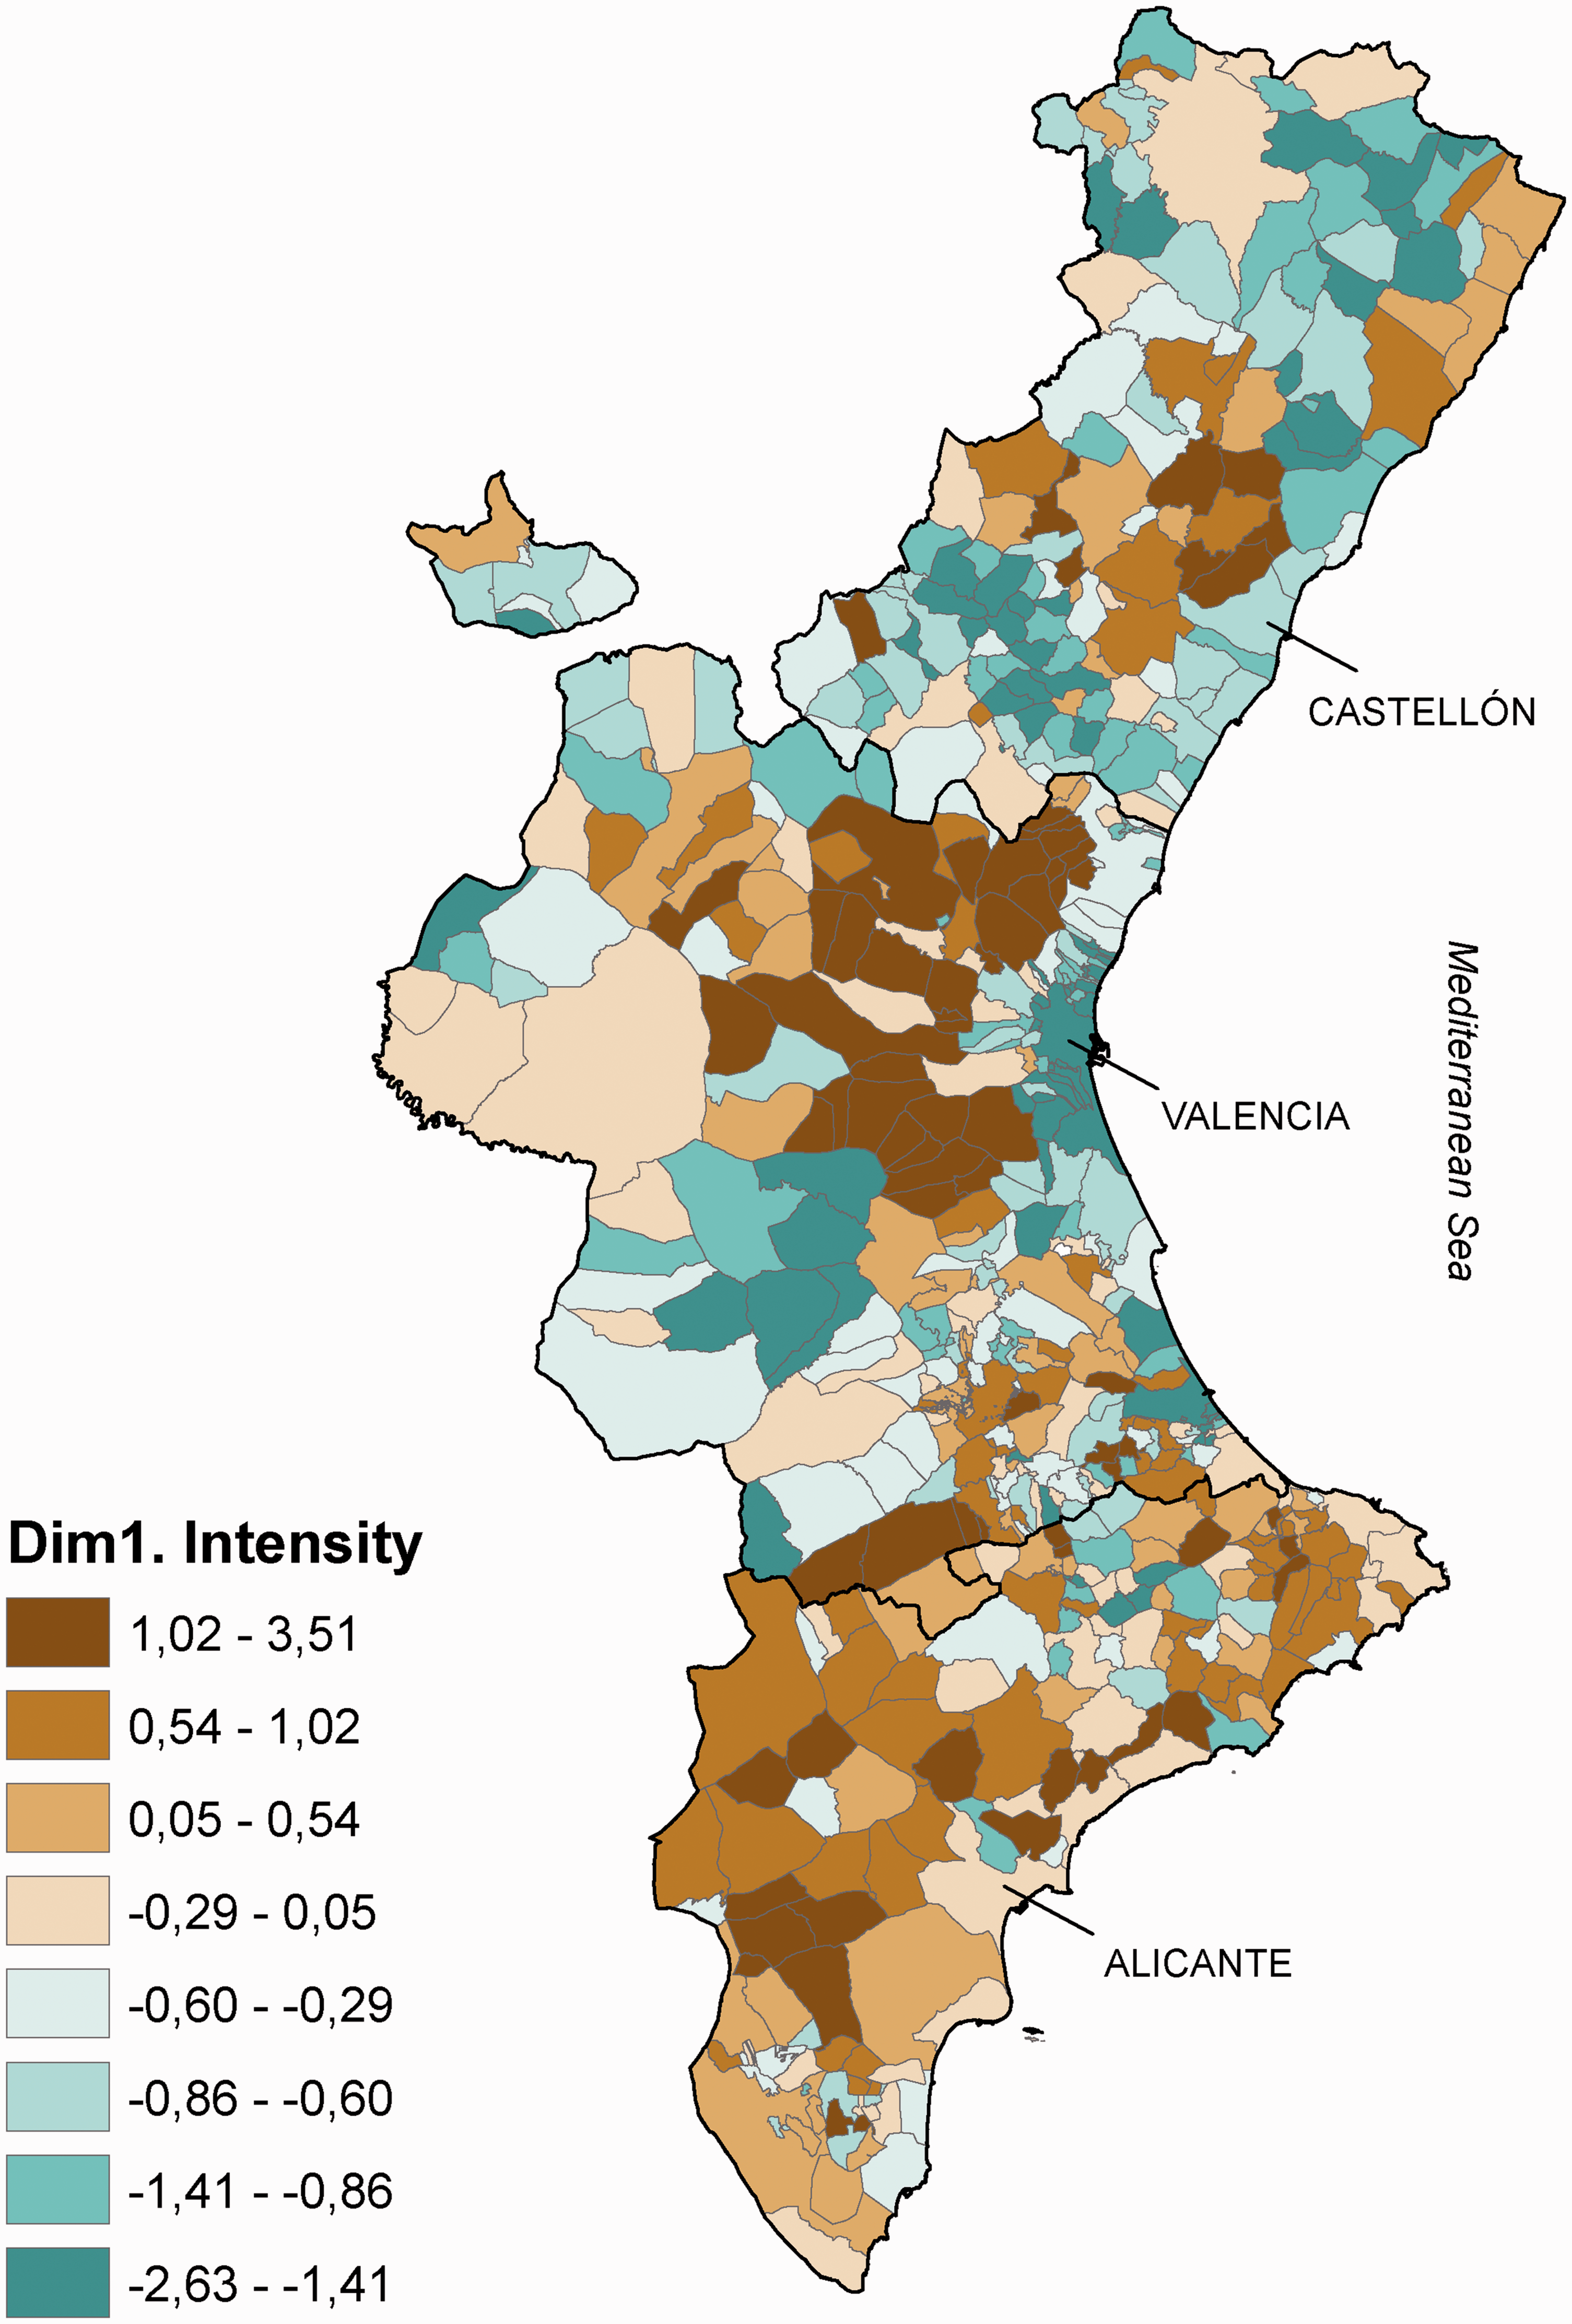
Second dimension is associated with the dispersion and fragmentation of urban land. The variables making up this dimension are Frag, Gini and cvDist, i.e. measures of division, concentration and dispersion of urban land. The presence of this second dimension shows how the sprawl phenomenon creates fragmented and dispersed urban patterns. Basically, this dimension adds coastal municipalities to the areas affected by the first dimension (Figure 7), due to the growing demand to occupy coastal areas, producing highly fragmented patterns in these areas. In addition, some large rural or intermediate municipalities seem to have high fragmentation values. In any case, these first two dimensions are linked to the morphological aspects of the urban model.
Map of dimension 2, fragmentation.
Third dimension reflects distance or proximity to the center of town and is measured by the distance to the center (Dist) plus the variability of these distances (sdDist). Mapping this dimension (Figure 8), a quite different behavior from the first two dimensions may be noted. The combination of both high distances and a variability in these distances appears mainly in the medium and large rural areas, due to the fact that they probably have few and distant urban patches. On the coast, the larger distances between urban patches are located in the northern municipalities of the provinces of Alicante and Castellon.
Map of dimension 3, distance.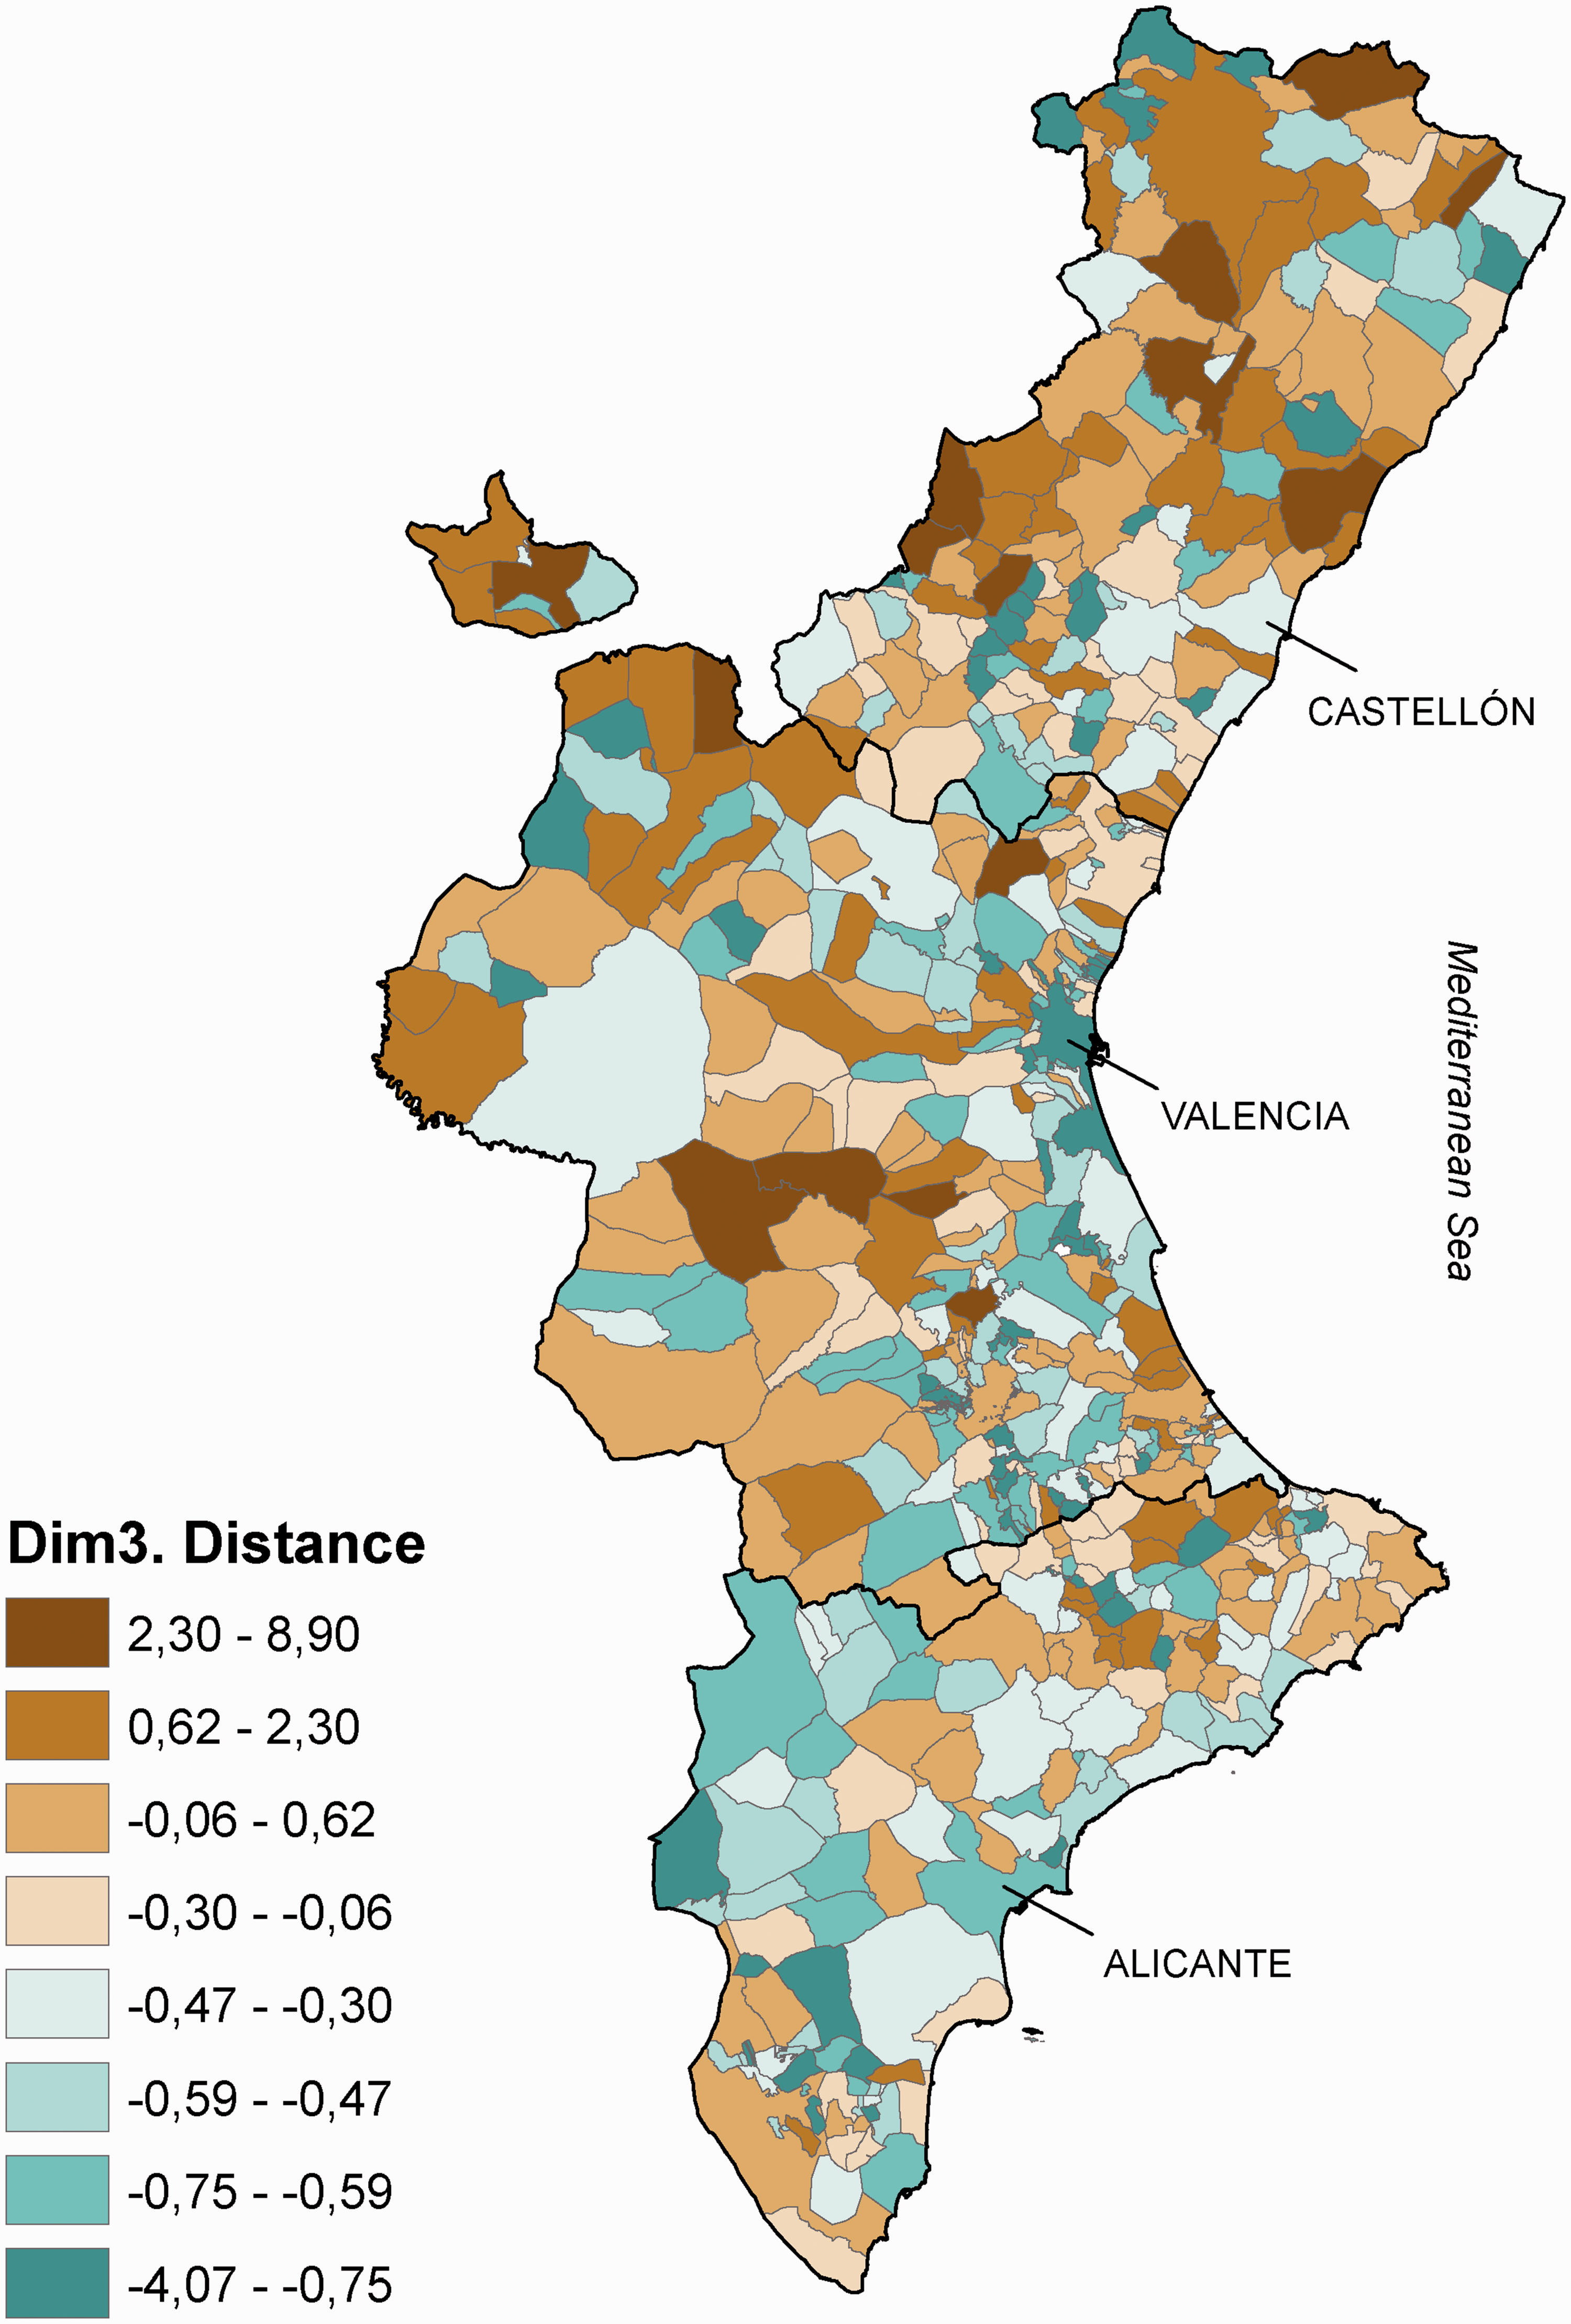
Fourth dimension deals with the Shape and Fractal shape complexity indicators, which measure the complexity of the geometric shape of urban patches. Normally, high complexity corresponds to low density, dispersed and fragmented urban areas, while compact areas tend to have simpler and more regular shapes. Nevertheless, modern residential areas tend to be regularly shaped, whereas older and usually denser areas may present complex shapes. Although this dimension is usually associated with sprawl, it can also be a characteristic of compact areas. This ambiguous behavior is reflected in the results of PCA analysis, since these variables, apart from contributing to the common factor (dimension 1 in PCA), are also present in dimension 3. Mapping this dimension (Figure 9), this ambiguous behavior may also be noted, showing high complexity values in many coastal municipalities, which are areas with sprawl models, and in many rural and mountain municipalities characterized by irregular older urban areas.
Map of dimension 4, complexity.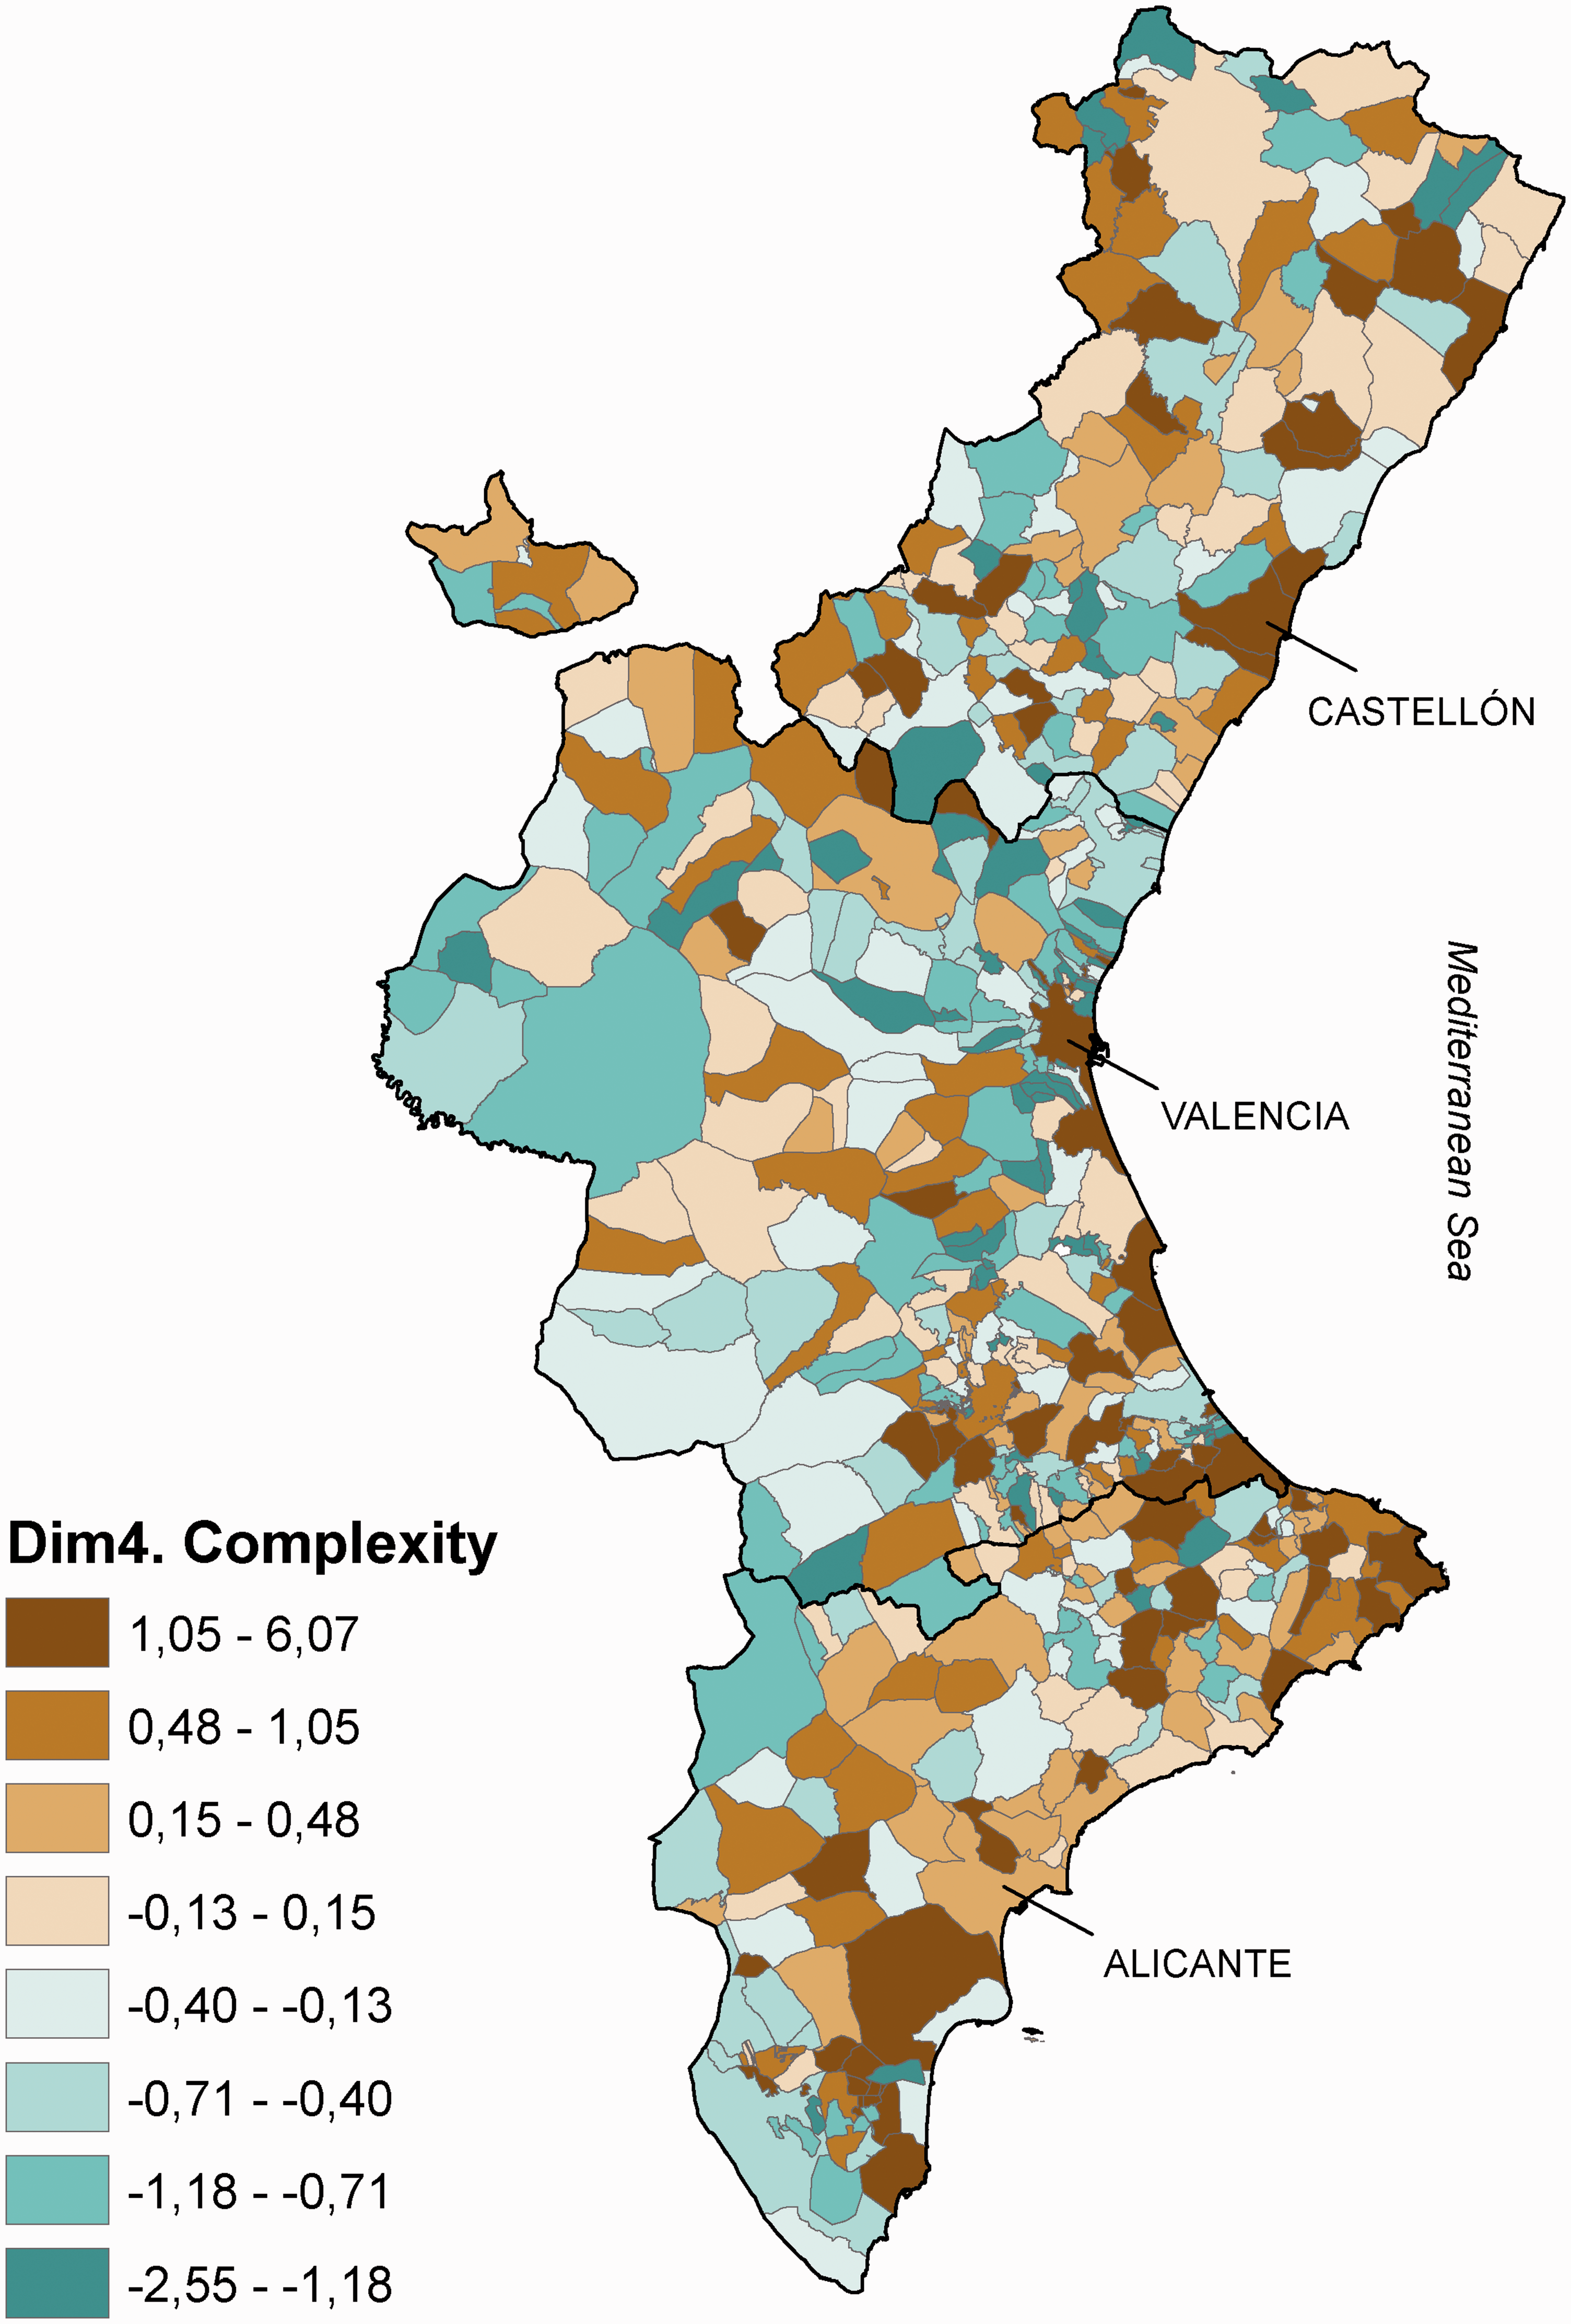
Finally, fifth dimension is associated with the Disc variable, which is the relative importance of discontinuous land in the municipality. This dimension is related to the magnitude of the phenomenon, which explains why it appears in a separate dimension. However, as can be seen in PCA and the Bayesian common factors, this variable is part of the common factor. As shown in Figure 10, the relative high importance of discontinuous urban occupation appears in the whole coast of the province of Alicante, in the western municipalities of the metropolitan area of the city of Valencia and in the entire metropolitan area of the city of Castellon. Furthermore, high values may appear in some inland and rural municipalities of the province of Castellon, due to the fact that the land use database characterizes urban centers of small rural settlements as discontinuous.
Map of dimension 5, magnitude.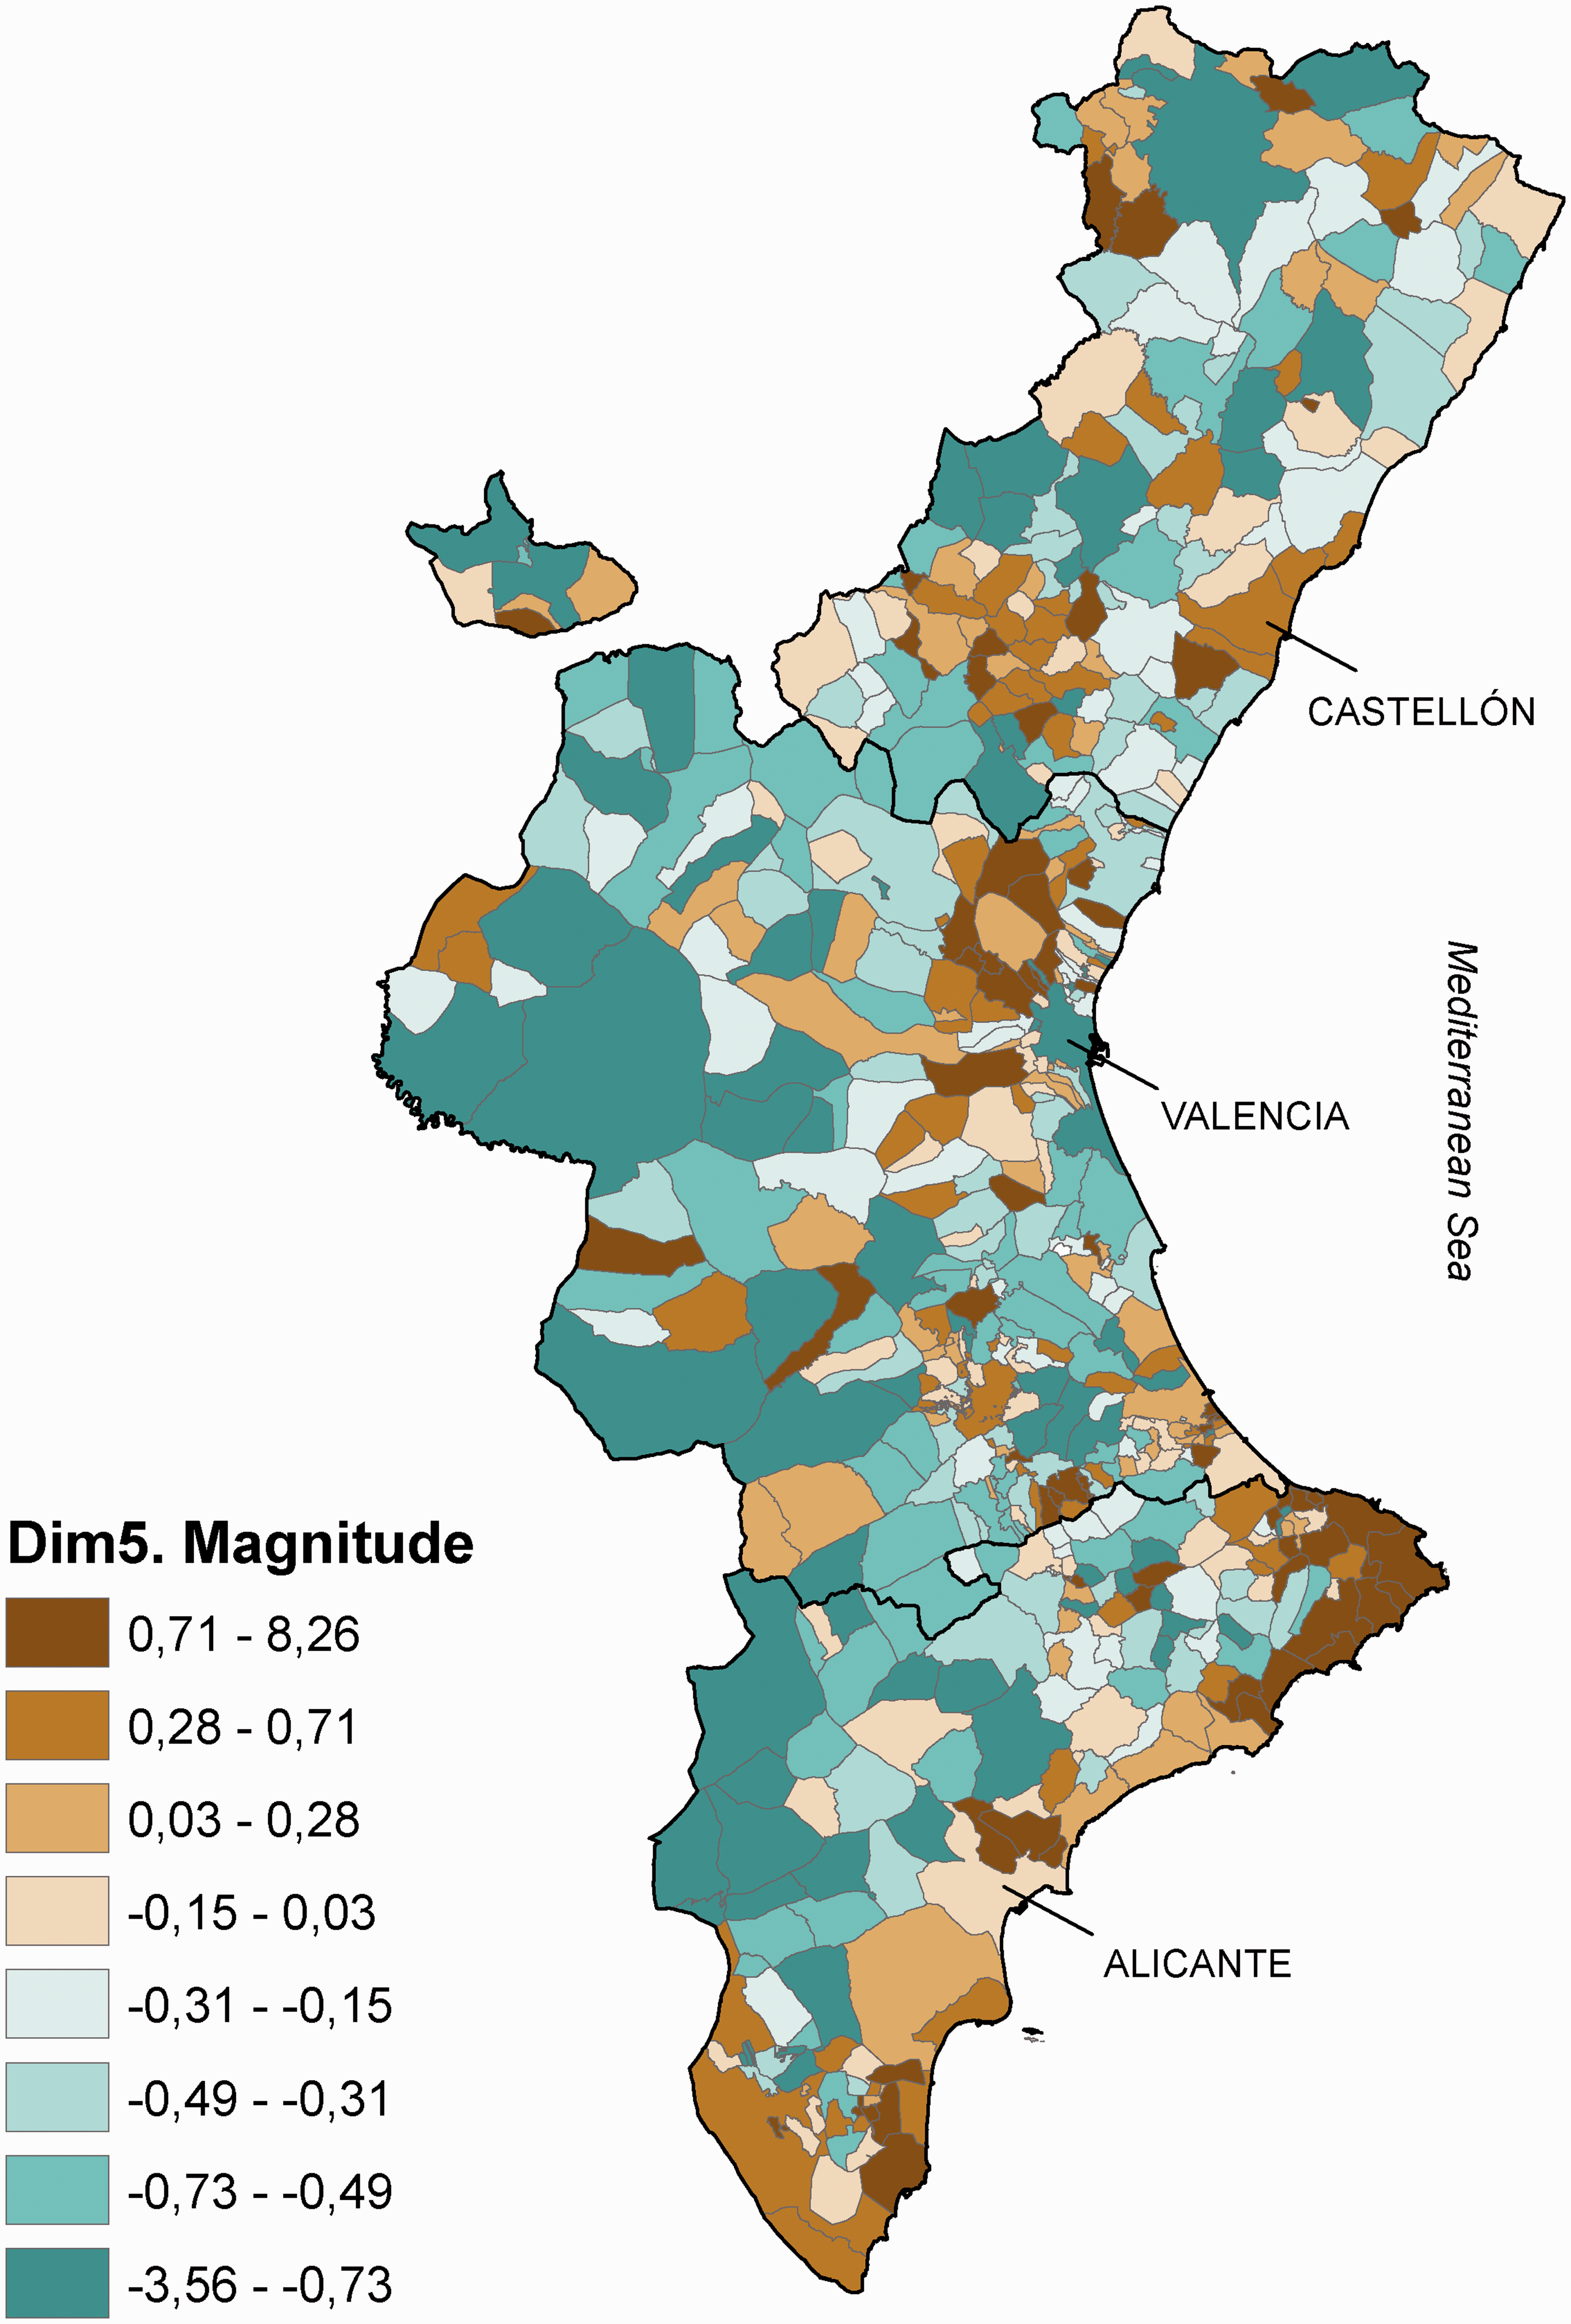
Dimensions 1 (intensity of use), 2 (fragmentation) and 4 (complexity) seem to be morphological characteristics of sprawl, while dimensions 3 (distance to center) and 5 (magnitude) are rather related to the expansion and magnitude of sprawl. Regarding the importance of each dimension, dimensions 1 (intensity of use), 2 (fragmentation) and 5 (magnitude) contribute substantially to the common factor (dimension 1 in PCA or Bayesian common factor), and therefore seem to be better dimensions to characterize sprawl. The complexity dimension (dimension 4) contributes less to common factor, as shown in loadings from Bayesian factor analysis (Table 7) and seems to have a more ambiguous behavior (dimension 3 in PCA). However, dimension 3 (Distance to center) does not seem to characterize sprawl, at least for our study area and with the variables formulated: it appears in a separate PCA dimension and contributes almost nothing to the common factor.
In addition, a single unidimensional measurement of each municipality has been obtained by computing the common factor of all the indicators, which quantifies the degree of sprawl in each municipality as shown in Figure 2. Significant values of the Sprawl Index appear from south to north, on the coast and in the intermediate area in the province of Alicante, especially in the north of Costa Blanca, in the western metropolitan area of the city of Valencia, in the metropolitan area of the city of Castellon and in some parts of the coast in the province of Castellon. These results reflect the consequences of urban planning in recent decades, in which the Valencian Community has experienced significant changes, from a dense and compact urban area to large low-density urban areas, probably as a consequence of higher living standards and the increased demand for second homes and tourist accommodation, especially in the coastal areas. At the other end, low sprawl values appear mostly in inland and rural areas, where there is no demand for urban growth, and in some coastal locations which mainly belong to small municipalities with severe space restrictions for urban development.
Discussion and conclusions
The purpose of this study was to characterize and understand urban sprawl in Valencia, Spain and to obtain a unidimensional global index variable using a combination of ICA and Bayesian factor analysis.
By applying ICA, we identified five dimensions of sprawl: density, dispersion and fragmentation, distance to center, complexity and magnitude. On the basis of these dimensions, urban sprawl can be understood as a complex model of occupation of a significant part of the territory, characterized by a large low-density urban area and divided into many widely separated and complex parts.
To study the spatial distribution of sprawl, we defined a simpler model using Bayesian factor analysis to reduce the identified dimensions to a single index, easy to represent and analyze, which has validated the research on urban development in Valencia. Over the past 20 years, many municipalities have experienced a paradigm shift and have gone from being traditional compact areas to diffuse areas, e.g. the Sprawl Index shows higher values in most of the coastal areas, in the province of Alicante and around the three major cities in the region: Alicante, Valencia and Castellon de la Plana.
It is also important to point out some limitations of the research. Firstly, the lack of more detailed information on the location of the population within the administrative boundaries prevents us from attributing exact data on population or housing to each urban patch, forcing us to work at the municipal level. The second problem arises from an over-generalization of the database used (SIOSE) (Temes and Moya, 2016), which may give anomalous information on land uses in some small municipalities. Despite these limitations, which have mostly been corrected using statistical techniques, the results are satisfactory. Another advantage of this approach is that the 12 indicators were built with simple formulations from public and online databases, ensuring that the study can be repeated.
Secondly, the results from this study can be used to determine the costs of sprawl and therefore support decision-making and planning processes through comparative assessment of different development alternatives. Sprawl could be studied in relation to sustainability or used to complement existing studies on how sprawl patterns affect municipal costs and thus design a decision-making tool for municipal authorities.
Footnotes
Declaration of conflicting interests
The author(s) declared no potential conflicts of interest with respect to the research, authorship, and/or publication of this article.
Funding
The author(s) received no financial support for the research, authorship, and/or publication of this article.
Supplemental material
Supplemental material for this paper can be found online.
References
Supplementary Material
Please find the following supplemental material available below.
For Open Access articles published under a Creative Commons License, all supplemental material carries the same license as the article it is associated with.
For non-Open Access articles published, all supplemental material carries a non-exclusive license, and permission requests for re-use of supplemental material or any part of supplemental material shall be sent directly to the copyright owner as specified in the copyright notice associated with the article.