
Abstract
The paper examines the growth of Chinese cities at prefecture level or above by first applying a non-parametric method. Kernel regression of the mean of growth rate conditional on city size reveals a U-shaped relationship between city growth and size, and rejects Gibrat’s law. That is to say that large cities take the form of divergent growth while small cities are convergent to each other. This U-shaped growth–size relationship holds for the registered (hukou) population in 1989–2012 as well as for the permanent population in 1999–2012. Furthermore, our results show that the growth of large cities becomes more divergent using the permanent population than using the hukou population, whereas the growth of small cities becomes less convergent. The permanent population counts a portion of floating population, so it is then concluded that rural–urban migrants move to large cities disproportionately, making large cities grow faster than small cities. Estimated results from rank–size OLS regression confirm the divergent growth of large cities, and, at the same time, reject the notion of random growth of Chinese cities (which is also supported by panel root tests). Our findings have profound policy implications. The national strategy of urbanization that stresses the growth control of mega and super-big cities has had no effect in the past and may continue to be ineffective in shaping the urbanization trajectory in China in the next couple of decades. Sustainable urbanization will depend largely on whether and how well big Chinese cities prepare themselves in accommodating fast growth.
Introduction
The beginning of the second decade of the 21st-century marked the first time in Chinese history when more people live in cities and towns than in the countryside. In 2011, about 691 million urban dwellers accounted for 51.27% of China’s total population. The urban population of the country has increased by nearly 520 million since 1978 (NSB, 2013). The number of cities has increased from 193 in 1978 to 658 in 2012. Referring to the rapid urbanization in China, which has occurred in tandem with exceptional economic growth, Nobel laureate in economics, Joseph Stiglitz has said this urban transition will be one of the two most important forces shaping the world in the 21st-century.
Urban scholars in economics, geography, planning, and policy are particularly interested in the fundamental and intriguing question of whether or not there are specific growth patterns of the urban system during rapid urbanization. Particularly, they wonder whether rapid urbanization results in a convergent or divergent growth pattern of Chinese cities. 1 A converging city system indicates that size differences among cities decline over time, implying that smaller cities grow faster than larger cities. A divergent pattern is just the opposite, meaning that larger cities grow faster than smaller ones.
China offers a unique context to examine growth patterns of the city system for the following reasons (Ding and Zhao, 2011). First, China first introduced the national urbanization policy of “strictly controlling the growth of large cities, moderately promoting the growth of medium-sized cities, and encouraging the growth of small cities and towns” in the middle of the 1980s. This policy specifically targeted a convergent trajectory of the city system by inversely correlating city growth rate to city size. The size-based urbanization strategy was codified in the National Urban Planning Law of 1989 and further reinforced by the so-called “new urbanization strategy” in 2012.
Second, Chinese cities have an administrative rank in a hierarchical order that is linked to local governments’ capacity regarding public spending, taxation, and capital projects, which may play important roles in local economic growth (Li, 2011). Administrative ranks of cities also matter for local economic development, because they are a major factor in site selection decisions for policy reform initiatives, pilot development projects, and the designation of various economic and social development zones (Wei, 2014).
Third and finally, China has a unique city-region governance structure, namely the “City-Managing-County” administrative system, which was first introduced in the 1950s and rapidly spread in the 1980s. Typically, a city-region region is composed of a prefecture-level city (or equivalent at the administrative level) and several county-level cities and/or counties. The city (prefectural level) has institutionalized administrative roles for managing the growth and development of county-level cities. Under the “City-Managing-County” system, city governments often take advantage of this institutional power to promote the growth of central cities at the expense of rural counties and county-level cities (Yang and Wu, 2015).
In this paper, we focus on the question of convergence versus divergence in the growth of Chinese cities in the period of 1989–2012 when the economy grew remarkably. Following the literature, we approach the question by examining the rank–size rule and Gibrat’s law using a panel data set, as well as by looking at the non-linearity of the size–growth relationship. Unlike the literature, we apply a non-parametric method, which we believe is the first use in the context of China to estimate the mean and variance of growth rates conditional on city size and to reveal the non-linearity between growth rate and city size. The non-linear relationship is further explored by examining the changes in the local Zipf exponent over time as a robustness check. We also run OLS estimates for the rank–size rule to investigate specifically the size–growth relationship among big cities. Finally, we use two different types of population data to minimize the estimation bias from measurement errors; we run our analyses by sub-periods, balanced and unbalanced panels, and sub-samples to determine if there are both time and cross-section variations of growth patterns of Chinese cities.
The politics of Chinese cities
Chinese cities are differentiated by their legislative and administrative status. Province-level cities have the same legislative and administrative authorities as provincial governments, which are institutionalized to establish and pass local laws, subject to the requirement of non-contradiction to the Constitution, laws, and regulations passed by the central government. This legislative power is only institutionalized to province-level cities. There are four province-level cities: Beijing, Shanghai, Tianjin, and Chongqing. The importance of province-level cities is also reflected in the political status of a city’s party secretary as a member of the Politburo, which is the most powerful decision-making body of the Communist Party of China.
Vice-province-level cities are authorized by the central government to have much greater freedom and power in creating their own economic development plans than all other cities except province-level cities. These cities were first singled out as so-called jihua danlie cities in the 1980s. Jihua danlie city means that the city’s economic growth targets are determined or allotted by the central government. That is, vice-province-level cities plan their economic growth according to national targets rather than provincial ones. Another important feature of vice-province-level cities is that they split their taxes with the central government rather than the provincial government. 2
Prefecture-level cities are the second tier in the subnational governments as diji administrative units in China. Prefecture-level cities are economically vibrant, and many serve as regional growth engines, as reflected in the criteria to establish a prefecture-level city regarding the minimum thresholds of GDP and annual tax revenue and the qualification of the “central city” status (China’s Association of Mayors, 2012). A central city is expected to play a leading role in promoting regional development, balancing growth within the region where it is situated, and reducing urban–rural inequality. The leading roles of prefecture-level cities are further reinforced by the widely adopted regional governance structure of the “City-Managing-County” system (shi guan xian). Both the notion of “central city” and the “City-Managing-County” system were introduced to promote balanced regional growth and reduce urban–rural inequality.
The last tier in China’s city system is county-level cities, of which there were 368 in 2012. County-level cities report to the prefecture-level cities where they are located. In a prefecture, county-level cities and counties are subordinated into a central city (the prefecture-level city) that administrates the entire prefecture.
Figure 1 illustrates the functional relationship between a prefecture-level city and county-level cities under the “City-Managing-County” administrative structure. The foundation behind this unique regional governance structure is the spatial trickle-down theory, which suggests that spatial development is best served by the creation of key economic centers or growth poles to generate economic growth (Breslin, 1996). To line up with this role as economic motivators, prefectural cities are designated administrative functions in managing regional affairs and growth.
The City-Managing-County system (modified from Ding, 2013).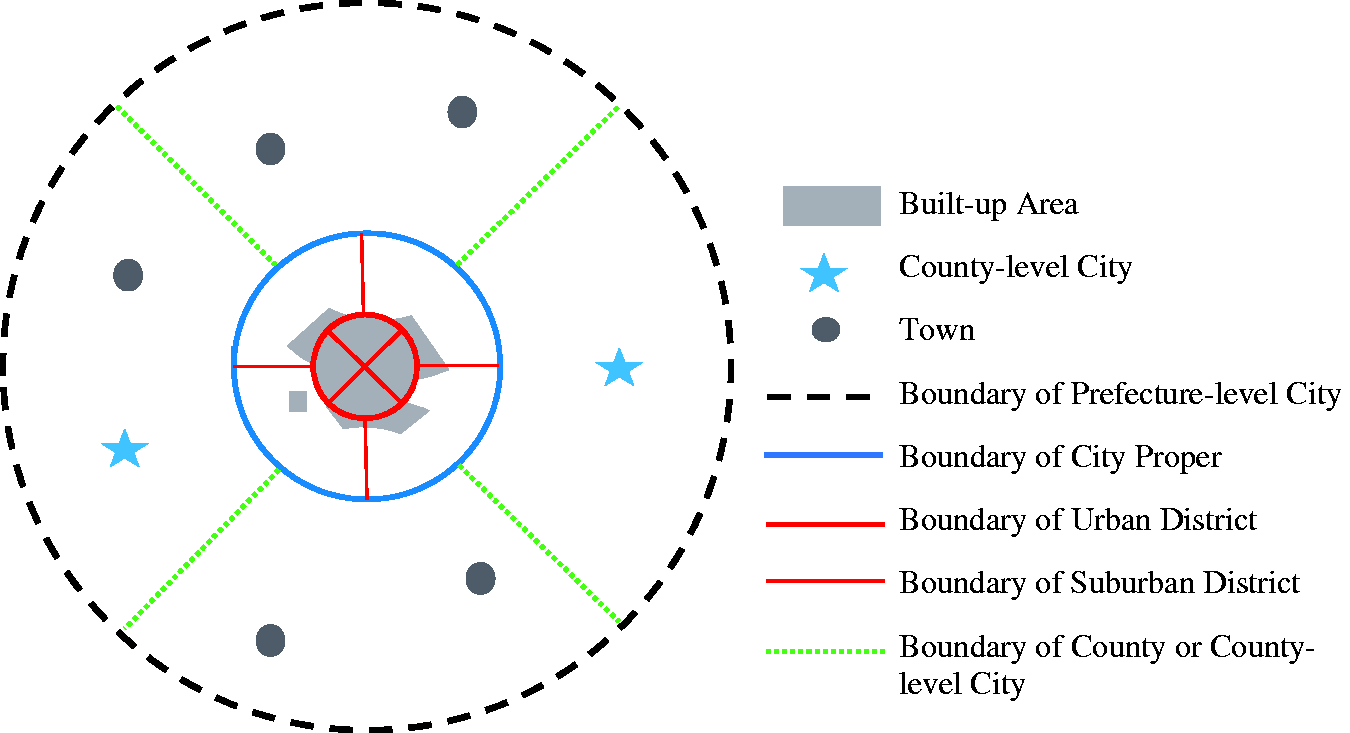
The administrative ranking system of Chinese cities has two profound impacts on urbanization. First, cities at the top of the ranks are more favored regarding economic development than cities at the bottom. Cities at the top of the administrative ranks are usually large cities, making them a favorable destination of rural migrants. The bias of urbanization toward big cities is supported by anecdotal evidence. For instance, the primacy of provinces increased from 2006 to 2012. The ratio of the population of the largest city to the population of the second largest city during this period increased in 20 out of 24 major provinces. 3 The four provinces with a declining or staggering primacy are Gansu, Shanxi, Jiangxi, and Guizhou, resulting from little growth of their capital cities.
Second, county-level cities at the bottom of the administrative ladder are at great disadvantage for economic growth. Prefecture-level cities often intercept a substantial portion of intergovernmental transfers to counties and county-level cities (Wei, 2014). Compounding an already bad situation, local officials of prefecture-level cities have strong incentives to take away capital resources and off-budget revenues from counties and county-level cities to enhance their financial profiles for local economic growth. At the same time, economic centers or growth poles have produced little trickle-down effect because many prefecture-level cities, especially those in the central and western regions, do not have local economies strong enough to allow them to function as regional growth engines (Yang and Wu, 2015).
The positive correlation between city administrative ranks and public expenditure indicates the importance of the political status of cities. Cities at the top have larger fiscal capacity in the provision of urban infrastructure, such as wastewater treatment facilities, household usage of gas and per capita hectare of open space/parks than cities at the bottom (Wei, 2014). Provincial-level cities were 4.22 times and 3.24 times as large as county-level cities and prefecture-level cities, respectively, in terms of per capita investment in urban infrastructure in 2006; these figures were 1.98 and 1.52 for capital cities of provinces (Wei, 2014). Universities, research institutes, large hospitals, and financial institutes are clustered in large cities, especially capital cities of provinces, which are often regional hubs of the national transportation network.
The literature on the growth pattern of cities
There are three types of theories regarding growth patterns of cities: parallel growth, convergent growth, and divergent growth. Theories predicting or implying parallel growth of cities include the endogenous growth theory (Black and Henderson, 1999; Eaton and Eckstein, 1997), random growth theory (Córdoba, 2008; Gabaix, 1999), and locational fundamentals theory (Fujita and Mori, 1996; Krugman, 1996). Theories predicting convergent growth of cities include the trade and export theory (North, 1955) and neoclassical exogenous growth theory (Barro and Sala-i-Martin, 1999). Theories predicting divergent growth of cities include the cumulative causation theory (Dixon and Thirlwall, 1975) and growth pole theory, which was abandoned in the 1980s.
A sequential development model has been proposed (Cuberes, 2011). The model suggests a bell-shaped growth pattern in which large cities grow first and small cities grow subsequently. The micro-foundation for the bell-shaped growth pattern is that the force of scale of economies enables large cities to grow, or grow faster, than small cities at an early stage of development. The benefit of scale becomes weaker than negative externalities (congestion and pollution) as development continues so that small cities grow, or grow faster, at a later stage of development. This implies that urbanization is biased toward large cities at an early stage of development.
Among these theories, the random growth theory has drawn significant attention. It not only predicts parallel growth of cities but also, more importantly, produces a stable city size distribution that follows Zipf’s law. Specifically, according to the model, cities grow randomly with the same expected growth rate and same variance, both of which are independent of city size (Eeckhout, 2004; Gabaix, 1999).
Empirical studies are rich and extensive with regard to the growth of cities. By analyzing the distribution of the population of the top-40 urban areas of France and Japan, Eaton and Eckstein (1997) concluded that urbanization takes the form of parallel growth of cities, rather than convergence to the optimal size distribution or divergence, which favors large cities. Sharma (2003) concluded that Indian cities grow in a parallel fashion in the long run. Ioannides and Overman (2003) used the entire sample of metropolitan areas in the United States for 1900–1990 and concluded that Gibrat’s law cannot be formally rejected, even though the mean and variance of growth rates vary with city size, suggesting that the growth trajectories of cities are parallel. Eeckhout (2004) echoed their conclusion by confirming Gibrat’s law in the period of 1990–2000. González-Val (2010) found that Gibrat’s law weakly holds for U.S. incorporated places in the long run. González-Val et al. (2014) tested the validity of Gibrat’s law using data covering the complete distribution of cities in the United States, Spain, and Italy from 1900 to 2000. The results of nonparametric estimates indicated that mean growth rates seem to be independent of city size in these three countries in the long term.
There is substantial coverage in the literature of the size distribution of cities and its evolution over time. Without changes in rank order, a stable size distribution implies a parallel growth pattern of cities. A majority of studies provide evidence suggesting a stable size distribution over time (Black and Henderson, 2003; Eaton and Eckstein, 1997; Ioannides and Overman, 2003).
City growth may take the form of either divergence or convergence in the short run or depend on the development stage/period. González-Val (2010) found that large cities grow faster in periods of high economic growth, and small cities grow faster in periods of crisis. González-Val et al. (2014) concluded that city growth exhibited a divergent pattern in Spain and Italy during the first half of the century and a convergent pattern in the second half, especially among medium-sized and large cities. Studies by Guérin-Pace (1995), Black and Henderson (2003), Junius (1999), Davis and Henderson (2003), and Cuberes (2011) also found the growth pattern of divergence first and convergence later over time.
Moomaw and Shatter (1996) presented evidence supporting the argument that urbanization is biased toward large cities. Ades and Glaeser (1995) concluded that large cities are favored to grow in the presence of high transportation costs, a politically dictated system, and a lack of openness to international trade.
There are mixed results in the examination of the growth of Chinese cities. Song and Zhang (2002) and Xu and Zhu (2009) found an increase in the Zipf exponent during the 1990s, implying a convergent growth pattern for cities. Anderson and Ge (2005) suggested that the size distribution of Chinese cities was stable before the economic reform and that a convergent growth pattern was present during the period of 1980–1999. Schaffar and Dimou (2012) found mixed results that urban growth exhibited convergent behavior in 1984–1994 and divergent behavior in 1994–2004. Chen et al. (2013) found that the growth of Chinese cities is random based on estimates of the rank–size rule and unit-root tests, revealing parallel growth in the period of 1984–2006. Henderson (2009) concluded that large cities are favored to grow because they are ranked high in the hierarchy of the city system and enjoy greater autonomy in decision-making, more public finance resources, and better access to regional transportation.
The inconsistent conclusions about growth patterns of Chinese cities are largely due to estimation problems and data issues. Estimation problems arise for the following reasons. First, changes in sample size during the study period may affect the estimated coefficients, particularly for the Zipf exponent (Eeckhout, 2004). The number of both total cities and prefectural cities steadily increased from 193 and 98 in 1978 to 657 and 289 in 2012, respectively. Second, rank–size OLS regression would produce a biased estimation when the underlying true distribution of city size is lognormal (Eeckhout, 2004). Third, a whole city sample may not follow the same distribution. For instance, only the upper tail of the city size distribution follows Pareto distribution, a critical condition for the holding of Zipf’s law (Gabaix, 1999; Ioannides and Skouras, 2013). Fourth, rank–size OLS regression cannot reflect the evolution of city size distribution that varies with city size (Garmestani et al., 2007).
Data used to represent city size are problematic, which may cause discrepancies in estimation results. 4 Previous studies on China have used either the registered non-agricultural population (Chen et al., 2013; Song and Zhang, 2002; Xu and Zhu, 2009) or the total registered population of an entire administrative area of a city (Anderson and Ge, 2005; Schaffar and Dimou, 2012). Neither the registered non-agricultural population nor total registered population accurately represents the size of cities. The registered non-agricultural population underrepresents true city size because it excludes the floating population and agricultural population living and working in the city proper. The total registered population of an entire administrative area over-represents city size because it includes the rural population, which is not part of the urban economy. This overestimation is significant for (small) cities with relatively small city proper areas. Both types of data may substantially under-represent true city size for large cities as they are primary destinations of a massive floating population that are believed to be in the range of 100–250 million. Underreporting (or missing) of massive rural–urban migrants (called the floating population) physically working and living in cities will definitely produce biased results and misinform policy implications.
Data
We use two different sets of data to examine the growth pattern of Chinese cities. The first data set is the total registered (hukou) population in the city proper, collected from China City Statistical Yearbooks (1990–2013) for the period of 1989–2012. 4 The second data set is the permanent population in built-up city areas from China Urban Construction Statistical Yearbooks (2000–2013) for the period of 1999–2012.
Each data set has its own merits. Compared with the total registered population of the entire administrative area of a city and the registered non-agricultural population of both the entire administrative area and the city proper used in previous studies, the total registered population (including both the registered agricultural and non-agricultural population) in the city proper more accurately represents city size in China’s transformation toward a market economy. This is because members of the registered agricultural population in the city proper (including peri-urban areas) are more likely employed in non-agricultural sectors, as is the case in the Pearl Delta and Yangtze Delta regions, and should be counted as part of the urban population. Excluding these populations, the registered non-agricultural population in the city proper will result in the underestimation of city size. Counting people living outside built-up city areas (such as the registered non-agricultural population in towns outside the city proper and the agricultural population in rural areas) will result in an overestimation of city size so that both the registered non-agricultural and total registered population of the entire administrative area may over-represent city size.
The main drawback of using the registered population is the omission of the floating population (migrant workers). The registered population excludes the floating population holding rural hukou but working and living in cities and towns. The combination of the industrialization, the market economy development, and labor reforms has produced a massive floating population. It is estimated that the floating population numbered 121 million in 2000 and increased to 236 million in 2012 (NSB, 2013). Excluding the massive floating population will substantially under-represent city size and city growth, especially for large cities that attract a disproportionately large portion of migrant workers.
The permanent population data from China Urban Construction Statistical Yearbooks address this issue, at least partially, by taking into account the floating population continuously living in cities or towns over six months. Another major improvement in the data is associated with the fact that built-up areas are used, instead of the city proper, since the geographical territory of a city proper may be not determined by urban spatial expansion but by administrative consideration. Merging and annexation of administrative units would cause dramatic changes of city-proper areas. A major problem with the permanent population data, however, is that the definition of built-up areas changed in 2005–2006, which caused the permanent population increases or decreases for some cities. From 1999 to 2005, population density, statutory street committees (jiedao), and contiguity of urban areas were used to determine built-up areas. Since 2006, these have been determined mainly by geographical contiguity of built-up urban areas. China Urban Construction Statistical Yearbook data are only available after 1999.
We use different population data sets to investigate growth patterns of cities for two reasons. The first reason is to illustrate that different population data may produce different growth patterns of cities. One of the main differences between the two population data sets is whether the floating population is included. We attempt to use the registered population as a benchmark to indirectly reveal destination preferences of the massive migrant population (floating population) and the growth patterns of cities.
Descriptive statistics of Chinese cities at prefecture level or above, 1989–2012.

Third and finally, the net growth of large cities is greater than that of small cities, indicated by rising skewness of both the registered and permanent population toward the right over time. The registered population underrepresents the growth of large cities compared to the permanent population. This is indicated by the fact that the increase in the skewness of the permanent population is larger than that of the registered population. The conclusion is also supported by changes in the extreme values (min. and max.) of both the registered and permanent population.
Both population data sets show irregular changes over time. This is caused by changes in definitions (e.g. built-up areas) and city administrative boundaries (e.g. enlargement of the city proper) and inclusiveness/exclusiveness of the floating population. These explain the unusual growth of some cities. For instance, the registered population of the largest city, Shanghai, grew 17% in 2005–2006 and about 15% in 2010–2011, whereas the permanent population grew 23.5% in 2004–2005. In addition, there are data entry errors. For example, the registered population in the city proper of Dongguan increased from 1.3 million in 1990 to 1.6 million in 2004, and then suddenly jumped to 6.6 million in 2005 and dropped back to 1.7 million in 2006.
As a result, some cities show unusually high/low growth rates, creating outliers. We use the top 0.5% highest and the bottom 0.5% lowest normalized growth rates as cutoff values to identify outliers that are dropped from the sample used in this paper. The outliers include observations that are considered to be data entry errors or associated with changes in city-proper territories.
Empirical results
Non-parametric analysis
Growth pattern by examining the mean of growth rate on city size
We apply kernel regression to analyze city growth with respect to city size. The merits of the approach are three-fold (Eeckhout, 2004; González-Val et al., 2014; Ioannides and Overman, 2003). First, the function form does not need to be pre-specified. This is important when the relationship between city growth and size may be unknown and non-linear. Second, estimates are less sensitive to changes in sample size compared to those from unit-root tests, rank–size type of regression, and regression of growth rate on city size. Third, this non-parametric method can identify local patterns that vary from the general growth–size relationship.
Following González-Val et al. (2014) and Ioannides and Overman (2003), the mean of growth rate (
To estimate (1), we adopt the Nadaraya–Watson method, which is expressed as:

The variance in growth rate conditional on city size, 
If the growth rate is independent of city size, the conditional mean growth rate should be a straight line on zero, and conditional variance of growth rate should be a straight line on one, as the growth rate is normalized. An ascending line implies a divergent growth pattern in which larger cities grow faster, while a descending line implies a convergent growth pattern.
Figure 2 shows the non-parametric estimates of means of growth rates conditional on city size by applying equation (2). A detailed examination of Figure 2 reveals three interesting findings. The first finding is that Gibrat’s law does not hold well because: 1) the zero value line does not completely fall inside the 5% confidence band of means of growth rates (Figure 2); and 2) the one value line does not completely fall inside the 5% confidence band of variance of growth rates (Figure 3). For the registered population (1989–2012), small and medium-sized cities tend to be located outside the zero line (Figure 2a) while large cities barely fall onto the zero line. This observation is also produced using the permanent population (1999–2012) and by sub-periods (Figure 2b to f). The one value line falls outside the entire sample for both the registered and permanent populations (Figure 3). An exception is the registered population in 1989–1999 as large cities do fall onto the one value line. Those results lead us to conclude that the growth of Chinese cities does not take the form of parallel growth.
Non-parametric estimates of the mean of growth rates conditional on city size: (a) Registered population, 1989–2012. (b) Registered population, 1989–1999. (c) Registered population, 1999–2012. (d) Permanent population, 1999–2012. (e) Permanent population, 1999–2005 and (f) Permanent population, 2006–2012. Non-parametric estimates of the variance of growth rates: (a) Registered population, 1989–2012. (b) Registered population, 1989–1999. (c) Registered population, 1999–2012. (d) Permanent population, 1999–2012. (e) Permanent population, 1999–2005 and (f) Permanent population, 2006–2012.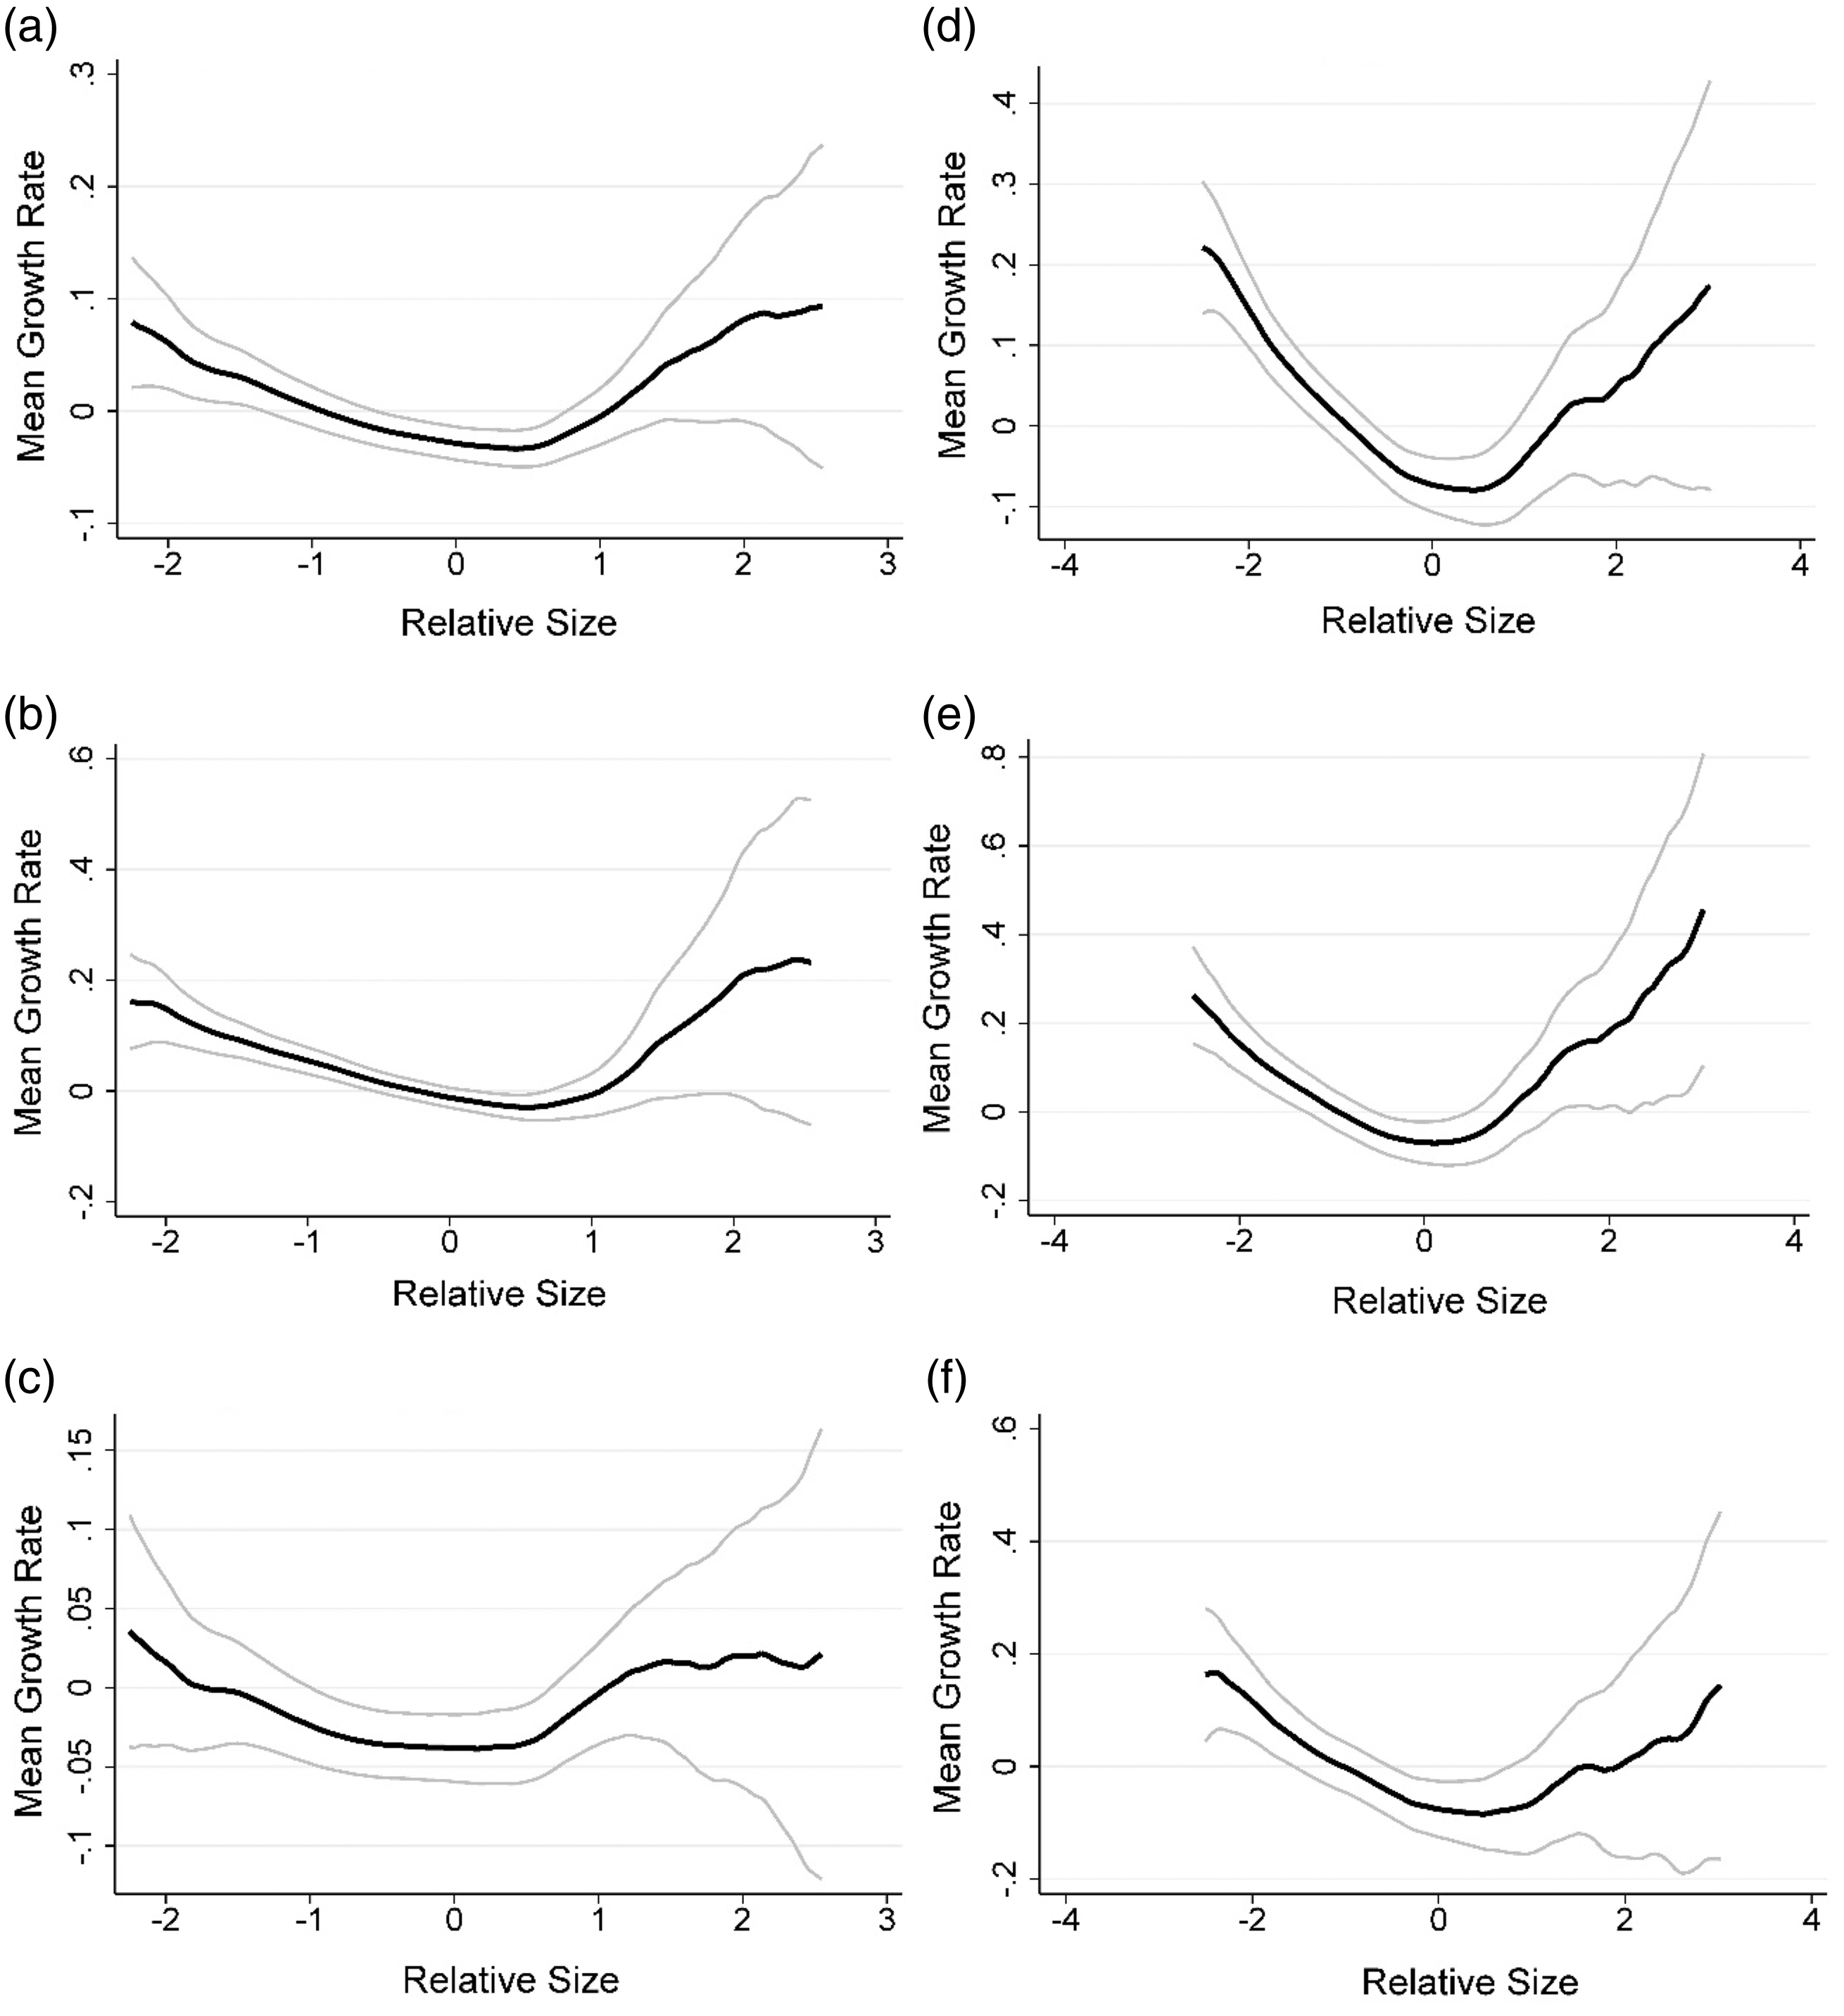

We conducted panel unit root tests to determine if the growth of Chinese cities follows a random growth trajectory or if Gibrat’s law holds in a short time period (González-Val et al., 2014; Schaffar and Dimou, 2012). We used two panel unit root tests (Levin–Lin–Chu test and Im–Pesaran–Shin test) to test the null hypothesis of all series with a unit root versus the alternative of all or some of the series being stationary (Im et al., 2003; Levin et al., 2002). The results of panel unit root tests allow the conclusion that Gibrat’s law can be strongly rejected, along with a random growth pattern for both the registered population and permanent population. We also conducted a panel root test for a subsample of, for example, the top-50 largest cities. The same conclusion was made. That is, the top-50 largest cities do not follow a random growth pattern. The results will be provided upon request.
The second finding is that we can reject a linear relationship between city growth and size, as indicated by the U-shaped curves (Figure 2). This leads to the third finding of the coexistence of both divergent growth and convergent growth of Chinese cities. Small cities converge while large cities diverge. These three findings are robust regardless of data and period.
Figure 2 also reveals that when the permanent population is used, more divergent growth is found for large cities, compared to using the registered population (comparison between c and d). We interpret the differences between c and d in Figure 2 as the fact that the registered population underestimates the size and growth of large cities since it excludes the massive floating population. A further breakdown of periods that compares the mean of growth rates between the registered population and the permanent population in 1999–2005 and 2006–2012 produces similar results as shown in c and d. This conclusion is also consistent with the general descriptive statistics (Table 1).
Growth pattern by examining the changes of the local Zipf exponent over time
An alternative way to examine the relationship between city growth and size is through an examination of changes in the local Zipf exponent over time (Gabaix, 1999; González-Val, 2012; Ioannides and Overman, 2003). The main merit of the approach is that it enables us to examine the possibility that cities of different sizes have different growth patterns. In other words, we are able to reveal local patterns that may be different from the general rank–size relationship (Garmestani et al., 2007). Thus, we do not need to conduct analyses based on the assumption that all cities follow the same distribution and growth pattern in conventional rank–size regression.
Under Zipf’s law, city size distribution should follow Pareto distribution, which is given by equation (4):

Following Gabaix (1999), in case that cities grow randomly with the expected rates and the standard deviations that are dependent on their size, the size of a city is determined as:


Equation (6) is estimated by using the estimated mean and the variance from the non-parametric analysis from equations (2) and (3).
We estimate the local Zipf exponents for sub-periods by following equation (6) and then examine the changes in the local Zipf exponent between sub-periods. Assuming that Zipf’s law may or may not hold in the short run (González-Val, 2012), increases or decreases in the local Zipf exponent between sub-periods are interpreted as a convergent or divergent growth pattern, respectively.
We estimate local Zipf exponents for two pairs of sub-periods and examine their changes over periods to check the robustness of the results. One pair is 1989–1999 and 1999–2012 and the other is 1989–1994 and 2007–2012. The first pair reveals the growth pattern between the first half and second half of the study period, while the second pair illustrates the growth pattern between the beginning and end of the study period. Figure 4 presents the estimates of the local Zipf exponent.
Non-parametric estimates of the local Zipf exponent.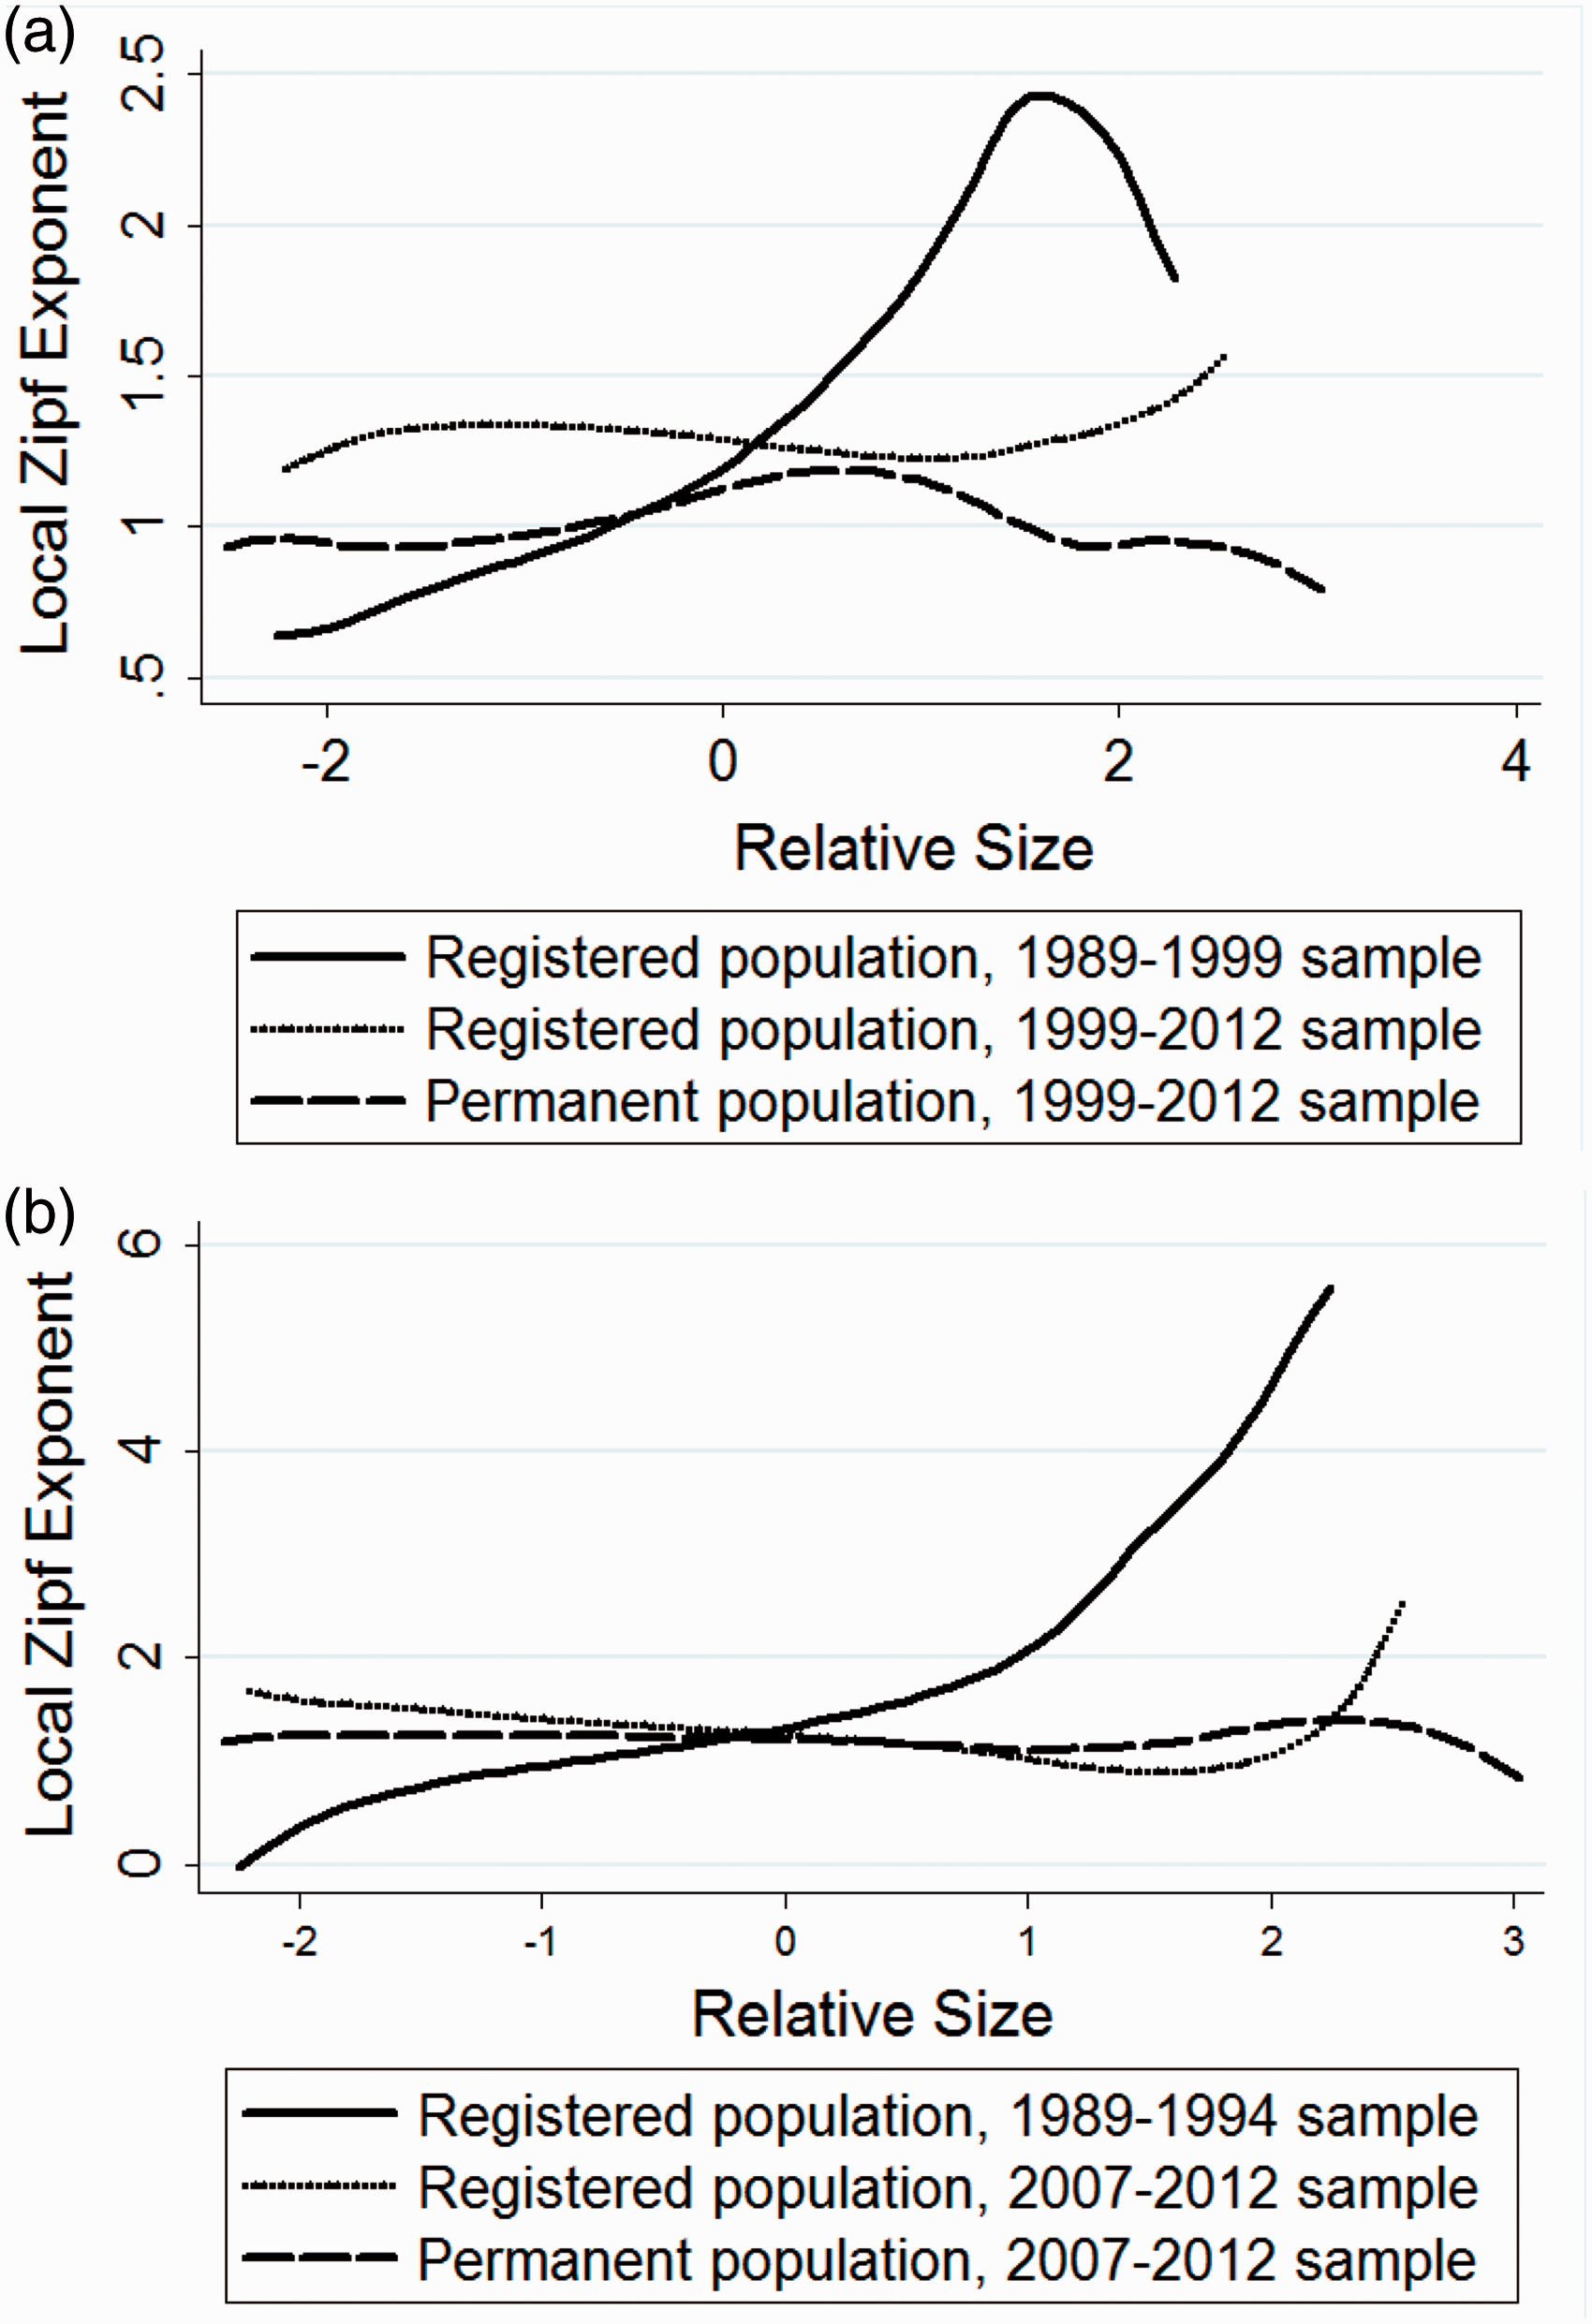
Figure 4 reveals that the local Zip exponent tends to increase for small cities and decrease for big cities over time. We use the intersection between the solid line and dotted line in the figure to separate small and big cities. When using the registered population, we find that the mean of the estimated values of the local Zipf exponent increases from 0.926 in 1989–1999 to 1.323 in 1999–2012 for small cities and decreases from 1.719 to 1.24 for big cities (Figure 4a). These changes lead us to conclude that small cities converge while large cities diverge between the two periods (1989–1999 and 1999–2012). The conclusion is consistent with those obtained in section “Growth pattern by examining the mean of growth rate on city size”.
Figure 4(a) also reveals that the estimated values of the local Zipf exponent using the permanent population are smaller than those using the registered population in 1999–2012. This difference suggests that: 1) the registered population underestimates size differences among cities; and 2) the registered population may bias the growth pattern of small and big cities in different directions. Using the permanent population as the reference, the registered population underestimates the divergent growth of big cities and overestimates the convergent growth of small cities. This is indicated by the fact that when the permanent population is used, the decline of the estimated values of the local Zipf exponent for big cities over periods is larger and the increase in the estimated values for small cities over periods is smaller, compared to using the registered population. For instance, the average value of the local Zipf exponent using the permanent population in 1999–2012 is 1.157 for large cities and 0.995 for small cities. Those numbers are smaller than 1.719 for large cities and greater than 0.926 for small cities, respectively, when using the registered population in 1989–1999.
We also examine the changes of the local Zipf exponent between 1989–1994 and 2007–2012 (Figure 4b). The estimated values of the local Zipf exponent exhibit similar patterns as those shown by Figure 4(a), suggesting that the growth pattern of cities over time are robust. Those estimated values and their changes over time should be interpreted in the context of historical growth of city population in China. The floating population first began to emerge in the 1980s and rapidly arose in the mid-1990s. It was not until the 21st-century that these migrant workers began to permanently settle in cities and towns on a massive scale. Accordingly, if urbanization in 1989–1999 is considered to be with restricted spatial mobility and the urbanization in 1999–2012 to be without restriction, compared to the registered population, the smaller values of the local Zipf exponent of the permanent population imply that rural–urban migration causes the growth of small cities to be less convergent and the growth of large cities to be more divergent between the two periods (1989–1999 and 1999–2012). The floating population explains the size differences between the two data sets. We thus interpret this as evidence that rural–urban migrants (floating population) have favored large cities during the rapid urbanization in China, particularly in the period of 1999–2012, causing divergent growth of large cities.
OLS regression
We conduct rank–size OLS regression to examine city size distribution and evolution of the city system over time as a robustness check for the non-parametric analyses. To capture the growth patterns revealed in section “Non-parametric analysis”, we estimate both the conventional rank–size relationship and an extended relationship.
The conventional rank–size model is expressed as:

The change of the estimated coefficient
The extended rank–size relationship is expressed as:

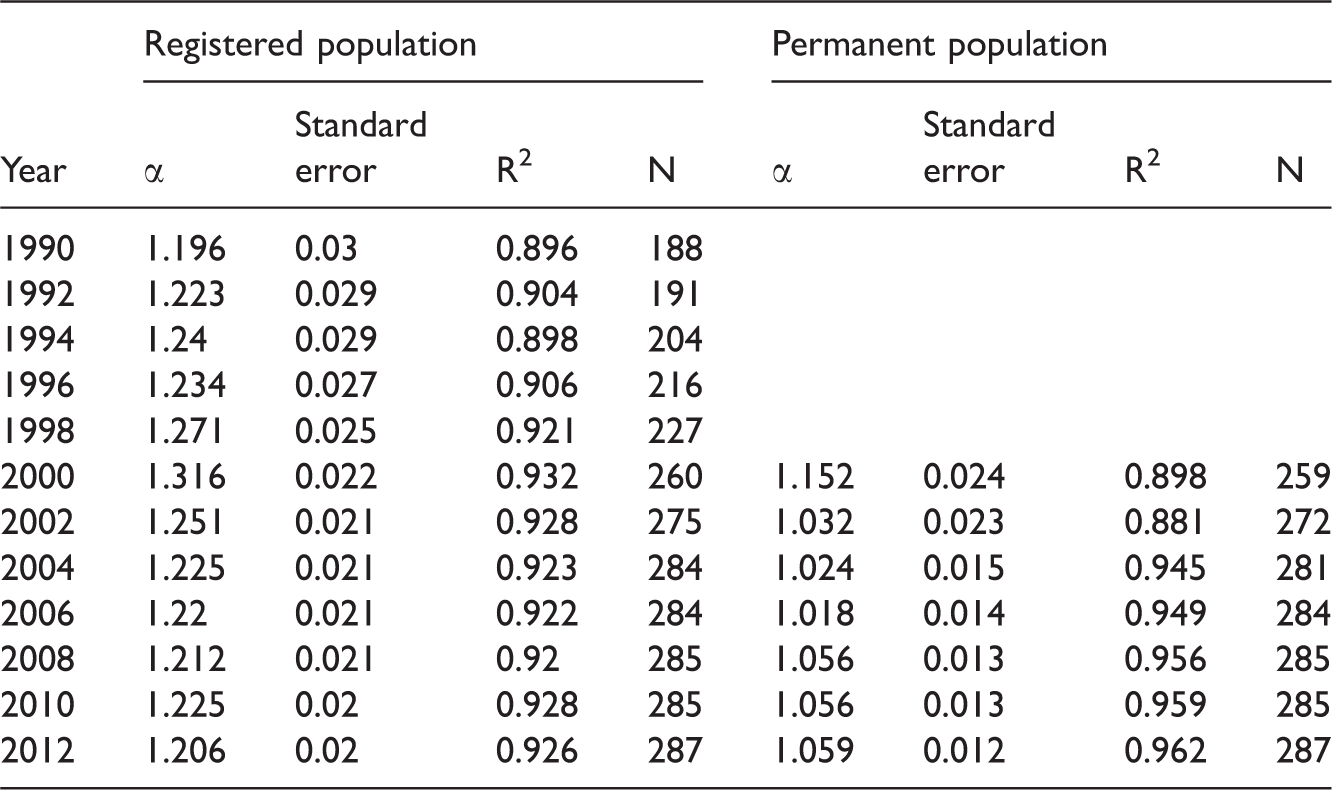
OLS estimates of rank–size (Zipf) exponent, full sample.
OLS estimates of rank–size (Zipf) exponent, large cities.

Second, in all cases except the full sample of the registered population in 1990–2000, the estimated value of the exponent decreases over time. In the period of 2000–2012, the estimated exponent decreases steadily from 1.316 to 1.206 for the registered population and from 1.152 to 1.059 for the permanent population. This trend of declining value over time becomes more substantial for large cities. A declining value of the exponent means that larger cities grow faster. It should be noted that the estimated value of the exponent steadily increased from 1990 to 2000. An explanation is that this increase is caused by an increase in the number of cities. The number of cities increased from 188 in 1990 to 260 in 2012, at a remarkably high growth rate of 38%.
Third, the estimated values of the Zipf exponent using the permanent population are always smaller than those using the registered population. The difference in the estimated Zipf exponent reveals that using the registered population shows a smaller population gap between different cities (sizes) than using the permanent population. We conclude that large cities disproportionately attract floating population, causing the difference.
Finally, the evidence for a divergent growth pattern is strongly present in large cities (Table 3). This is indicated by the decline of the Zipf exponent over time. For instance, for cities with a population of over half a million, the estimated exponent steadily dropped from 1.615 in 1990 to 1.432 in 2012 using the registered population and from 1.553 in 2000 to 1.232 in 2012 using the permanent population. The results using the sample of cities with a population of over one million are highly similar. This confirms the conclusion of divergent growth of large cities in China. The model performs well, as indicated by high R-square values, which fall into the range of 0.896–0.996.
OLS estimates of rank–size (Zipf) exponent, extended model.
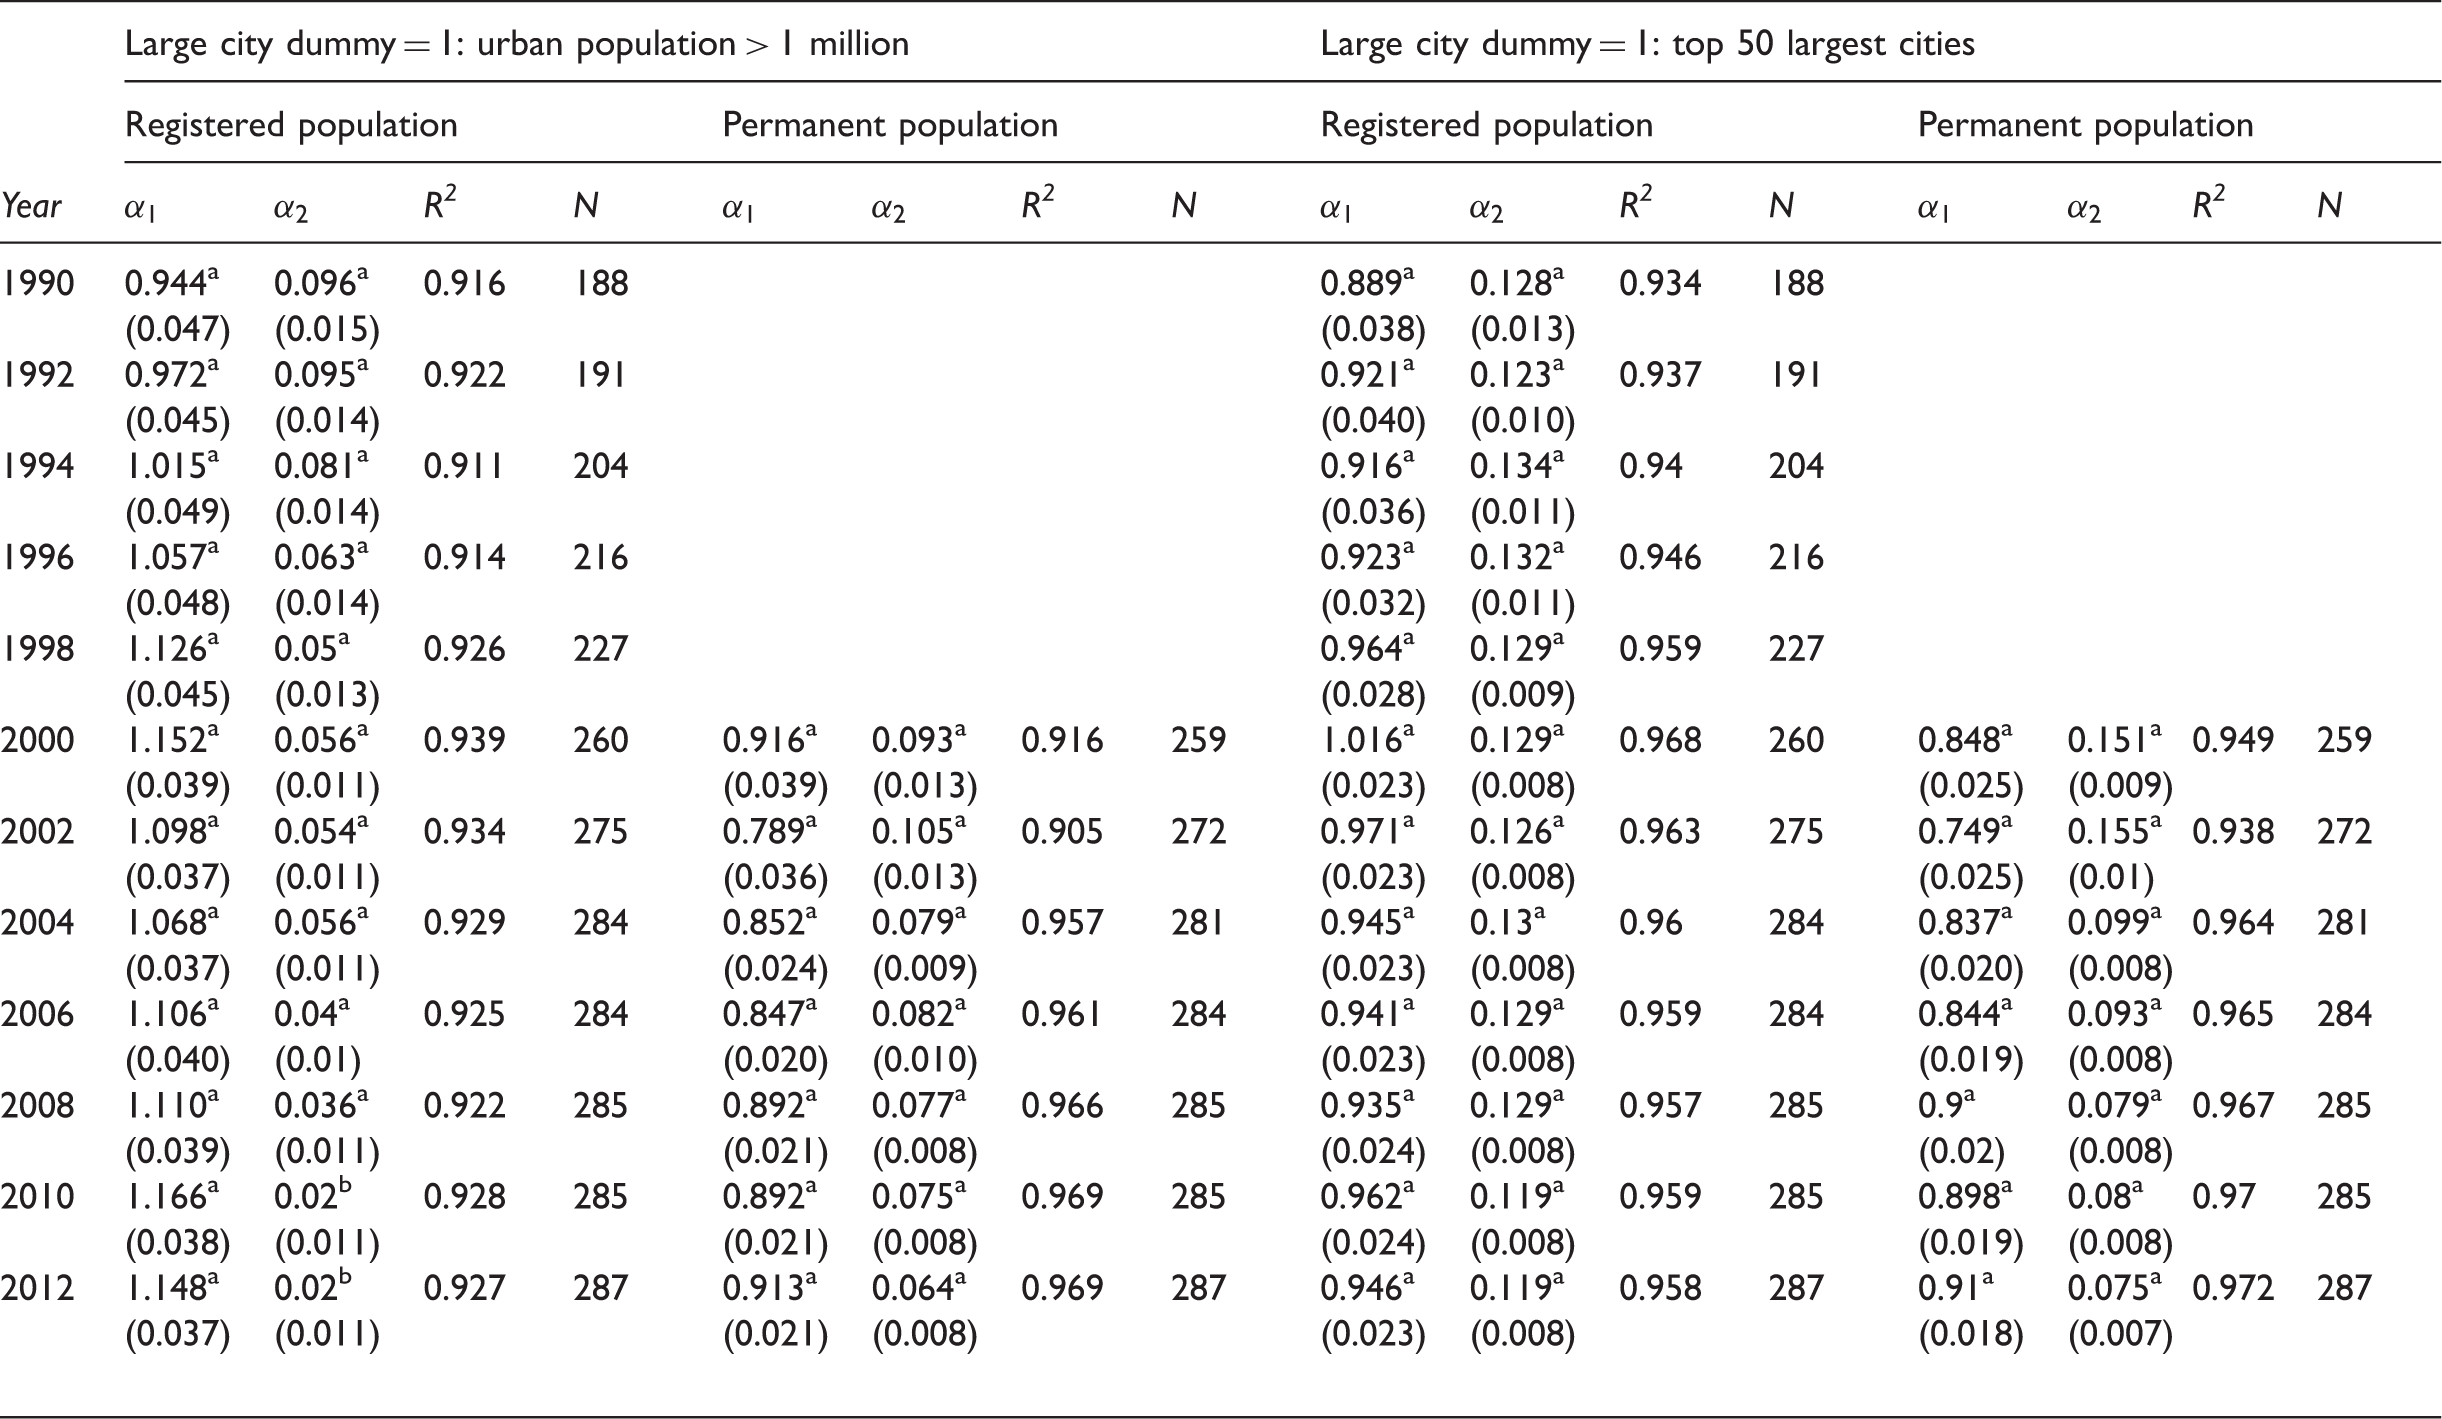
Note: Standard errors in parentheses.
p < 0.01.
p < 0.1.
p < 0.1.
Final remarks and conclusion
The combination of radical reforms toward a market economy and remarkable pace of urbanization in China presents a great opportunity to examine growth patterns of cities and the evolution of the city system. This paper applies a non-parametric analysis to investigate growth patterns of Chinese cities during rapid urbanization. Our estimated results from non-parametric analysis first reject Gibrat’s law and then reveal a U-shaped relationship between city growth and size. The conclusion of divergent growth of large cities is also supported by estimates of the local Zipf exponent and by rank–size regression.
The finding of the divergent growth of large cities has three profound policy implications. First, the national strategy of urbanization that specifically reversely links city growth with city size is against the general trend of development. Consequently, it is not surprising to observe that the strategy has had little effect on the growth of cities and on the evolution of the city system in China in the past couple of decades.
Second, the policy of strictly controlling the growth of mega and super-big cities make these cities less prepared for growth potential driven by market forces and may cause them to choose inappropriate policy options. For instance, under the control policy of large cities, in 2004, Beijing planned a population growth ceiling of 18 million by 2020. This ceiling has been used to determine the provision of infrastructure and urban services. However, the population of Beijing based on official data had already reached 23 million in 2012, which is still widely believed to be underestimated. The mismatch of population growth and provision of infrastructure (such as urban transportation) and urban services partly explains the rapidly increasing congestion in Beijing. Third and finally, the divergent growth of large cities in China may continue in the next one or two decades, even under the current national strategy of urbanization. Accordingly, large cities should prepare themselves to accommodate substantial population surges by providing more efficient infrastructure and urban services in order to promote sustainable growth.
Footnotes
Acknowledgements
The authors are grateful to Rafael González-Val and three anonymous referees who made valuable comments on earlier versions of this paper. The authors alone are responsible for any remaining errors.
Declaration of conflicting interests
The author(s) declared no potential conflicts of interest with respect to the research, authorship, and/or publication of this article.
Funding
The author(s) received no financial support for the research, authorship, and/or publication of this article.