
Abstract
The conceptual and methodological debate on urban form has grown in the last decades to recognize that social, economic, demographic and political processes can contribute to the development of new urban forms, especially those related to urban sprawl, as well as to find alternative methodologies for measuring them. Spatial metrics derived from landscape ecology arise as principal indicators to measure urban form. This paper proposes a typology of the urban occupation of Portuguese municipalities. It uses land use/cover data from 1990 and 2006 to extract built-up areas, and it presents five spatial metrics alongside seventeen statistical indicators from 1991 to 2011 most commonly used in the literature to characterize urban occupation. It uses a self-organising map as a visual tool to identify trends and relationships among variables and to cluster municipalities. Based on the self-organising map’s visual clustering, six types of urban occupation of Portuguese municipalities are proposed. In addition, the paper discusses the added value of using indicators that describe both the patterns and the characteristics of the municipalities for making spatial planning decisions in Portugal. The observed results show that spatial metrics are particularly adequate for measuring peri-urban municipalities (urban sprawl areas). These results represent the first multidimensional and systematic analysis of Portuguese urban occupation and they can be the first step in the integration of spatial metrics as indicators that are suitable for the analysis of spatial planning, and also for comparative purposes at a broader geographical scale.
Introduction
The scientific debate on urban form has expanded over the last few decades. From a conceptual point of view, urban form can be described as the spatial pattern of human activities, i.e. the physical configuration of a city, including the relationships between elements that compose cities such as: land use patterns, population and housing densities, infrastructure and amenities, and transport and communication networks. These physical configurations and relationships result from demographic, socioeconomic and politico-cultural processes developed over time and space (Banister et al., 1997; Schwarz, 2010; Williams et al., 2000).
Generally in the European context, the inhabitants of a city lived in the city centre and in the immediate suburbs until the mid-1950s. In the early 1970s, the advance of automobiles and road networks and improvements in the socio-economic situation of inhabitants triggered new possibilities for commuting and housing, which resulted in widespread urban expansion widespread (Oueslati et al., 2015; Uhel, 2006). These processes have visible consequences in land use patterns and in modern urban form, where urban sprawl is the most characteristic form (Ewing, 1994; Frenkel and Orenstein, 2012; Salvati et al., 2013). Although urban sprawl is a controversial term with many definitions (Bhatta et al., 2010), it can be described as an overall low density development or a scattered or leapfrog development with a daily commuting household pattern relying on the automobile (Galster et al., 2001; Kasanko et al., 2006; Roo and Miller, 2000; Uhel, 2006).
The extent of urban phenomena has led to the widespread use of methodologies to measure modern urban forms. The first efforts to measure them were developed in the USA where urban sprawl first occurred, namely with the Buchanan report (Buchanan, 1963) and the studies of Berry (1974) that linked automobile transportation and environmental quality. Later on, these studies triggered several other studies in an effort to understand and quantify the sprawled form. By the 1980s, such studies extended to a Northern Europe that was becoming less and less compact. Then in the 2000s, experts started to pay attention to European Mediterranean countries, where dispersed patterns became evident and fast growing. In 2006, the European Environment Agency revealed that sprawl was growing faster in cities located in Southern Europe: e.g. in Istanbul, Palermo, Udine, Porto, Iraklion, Lyon and Milan (Uhel, 2006). In general, European studies focused on quantifying sprawl at the city-region level or comparing sprawl in cities across Europe (Arribas-Bel et al., 2011; Kasanko et al., 2006).
We can identify three major perspectives to quantify urban form:
A classical perspective relying on bivariate and multivariate analysis of statistical indicators, where the most commonly used indicators are population growth, commuting costs, employment shifts and city income change (Lucy and Phillips, 2001; Stead et al., 2000). Density gradient analysis has also been used in different studies (Bertaud and Malpezzi, 2003; Bertaud and Renaud, 1997; Tsai, 2005). A perspective based on GIS and remote sensing that has been spreading particularly since the 1990s with the generalisation of GIS and geocomputational tools. Remote sensing is used to map urban features (e.g. buildings) and land use/cover types (LUC) from which secondary built-up statistics and other socioeconomic parameters can be derived (Herold et al., 2003; Huang et al., 2007; Kasanko et al., 2006; Ratti and Richens, 2004; Yang, 2011). Some studies have substantiated the use of remote sensing coupled with spatial metrics (Bhatta et al., 2010; Herold et al., 2002; Ji et al., 2006; Song and Knaap, 2004; Zhang et al., 2013), i.e. quantitative indices that characterize the geometry of landscape units (e.g. built-up areas) and their spatial relationships (McGarigal and Marks, 1995), establishing them as a priority for city planning (Herold et al., 2003). A multi-dimensional perspective linking the previous approaches, e.g. spatial metrics to analyse patterns and configurations in association with classical statistical indicators (Ewing et al., 2002; Galster et al., 2001; Reis et al., 2016; Tsai, 2005).
In all the different approaches, the density dimension using population and/or LUC are key-variables. Moreover, the most commonly used techniques to detect patterns are spatial regression and multivariate statistics, e.g. component factor analysis and cluster analysis (Schwarz, 2010; Zhang et al., 2013).
The scientific debate on urban form has also extended to the political community, and urban form has become an important dimension in the design of policies linking spatial planning and sustainability (Jenks et al., 1996). In the early 2000s, this debate underwent a development in the Portuguese context with the Portuguese Framework Law for the Policy on Territorial Management and Urbanism (LBPOTU: Law No. 48/98 of 11 August, revised by Law No. 31/2014 of 30 May) and the subsequent National Program of the Territorial Management Policy (PNPOT) published in 2007 that adopted these concepts. However, overall, despite being a recognized issue, there have been few studies dedicated to quantifying urban form in Portugal (Reis et al., 2016).
In fact only major Portuguese cities such as Lisbon or Porto have been used in international comparative studies (Kasanko et al., 2006; Uhel, 2006); at the national level, only detailed case studies have been explored. For instance, Silva and Clarke (2002) studied scattered patterns in the metropolitan areas of Lisbon and Porto. Aguilera et al. (2011) explored changes in urban growth patterns through spatial metrics for the Algarve region. Overall there is no systematic analysis of the whole country.
At the same time, the analysis of urban pattern data for spatial planning purposes is mainly focused on statistical data, such as population density, to define, for instance, a typology of urban areas (TIPAU). The TIPAU is often used in territorial diagnoses supporting spatial planning documents and is somewhat incomplete because it bases the characterisation of the spatial pattern of urban systems only on a demographic parameter. Thus, there is an increasing need to systematically quantify and understand the different patterns of urban occupation and to explore other indicators besides the classical ones to assess them.
Hence, a statistical approach by itself may not be sufficient to effectively identify, for instance, the impacts of urban sprawl in a given spatial context. Several authors consider that urban sprawl must be characterized based on indicators that describe urban form, demographic and socioeconomic characters, and land-use variables (Pendall, 1999; Salvati et al. 2013; Sarvestani et al., 2011). All in all, we argue that statistical data, e.g. population data, along with geospatial metrics can help to better characterize urban form since population is one of the causal factors driving LUC changes, and spatial metrics are useful tools in mapping and quantifying urban areas. Thus, computing statistical spatio-temporal data along with landscape metrics will help to understand and evaluate urbanisation processes and patterns, thus better supporting spatial planning (Peng et al., 2010; Ramachandra et al., 2012; Wu et al., 2011).
The present study provides an empirical contribution to this deserving issue. It combines descriptive statistics and spatial metrics to investigate urban form in Portugal at the municipal level. For that, it proposes a typology of urban occupation based on Self-Organizing Maps (SOMs). This method is used to explore urban occupation analysis and for clustering because we are using multidimensional data to measure urban occupation, derived from both statistical data and from LUC. SOMs have also proved to be a very suitable method in other studies related to urban sprawl (Arribas-Bel et al., 2011; Arribas-Bel and Schmidt, 2013), metropolisation patterns (Abrantes et al., 2005) or even regional policy (Morgado et al., 2007), whenever clustering methods were needed. Moreover, SOMs use unsupervised learning methods in an adaptive learning process to create clusters so it may uncover hidden patterns that other quantitative methods may miss.
Finally, unlike traditional methods for data-reduction and clustering, SOMs map the input data (i.e. observations) from an n-dimensional complex space to a low-dimensional discrete data output space, thus compressing data in a topology-preserving geometric structure. Hence, if high-dimensional inputs were very similar, then their position in a two-dimensional space would also be very similar. Therefore, SOMs present more consistent and detailed results than traditional classification methods, blending traditional statistical methods with a machine learning approach (Arribas-Bel et al., 2011; Arribas-Bel and Schmidt, 2013; Londei, 2013; Yan and Thill, 2009). In this study, we used the SOM software adapted by Lobo and Bação – the GeoSOM suite tool – which uses the same principles as original SOM of Kohonen (Henriques et al., 2009) but the results can be directly observed in a GIS environment or imported into other GIS software, thus allowing further mapping and spatial analysis.
Another contribution of this paper is to assess whether combining statistical indicators with spatial metrics will bring added value to the analysis of Portuguese urban occupation. In the following sections, we describe the data used and the methods applied and present a typology of urban occupation. After the discussion, some final remarks are made, especially on how the methodology can support decision-making.
Data and methods
Study area
Mainland Portugal has over 10 million inhabitants and over 88,700 km2. The urban system is characterized by a concentration of the population in a range of 50 km along the coastline from Setúbal to Viana do Castelo, and along the Algarve coast (Uhel, 2006). Urban sprawl and metropolisation trends have been particularly evident, especially since the end of the 1980s, in the two metropolitan regions of Lisbon (AMP) and Porto (AML), which account for almost 4.5 million inhabitants. In these areas, urbanisation processes have increased across urban administrative boundaries, forming important functional regions. The district capitals (considered medium-sized towns) with high and medium levels of accessibility also play a relevant role in structuring urban systems, for instance Vila Real and Viseu (in the North), Aveiro, Coimbra, and Leiria (in the Centre), and Évora, Beja, and Faro (in the South) (Figure 1).
Mainland Portugal with major cities.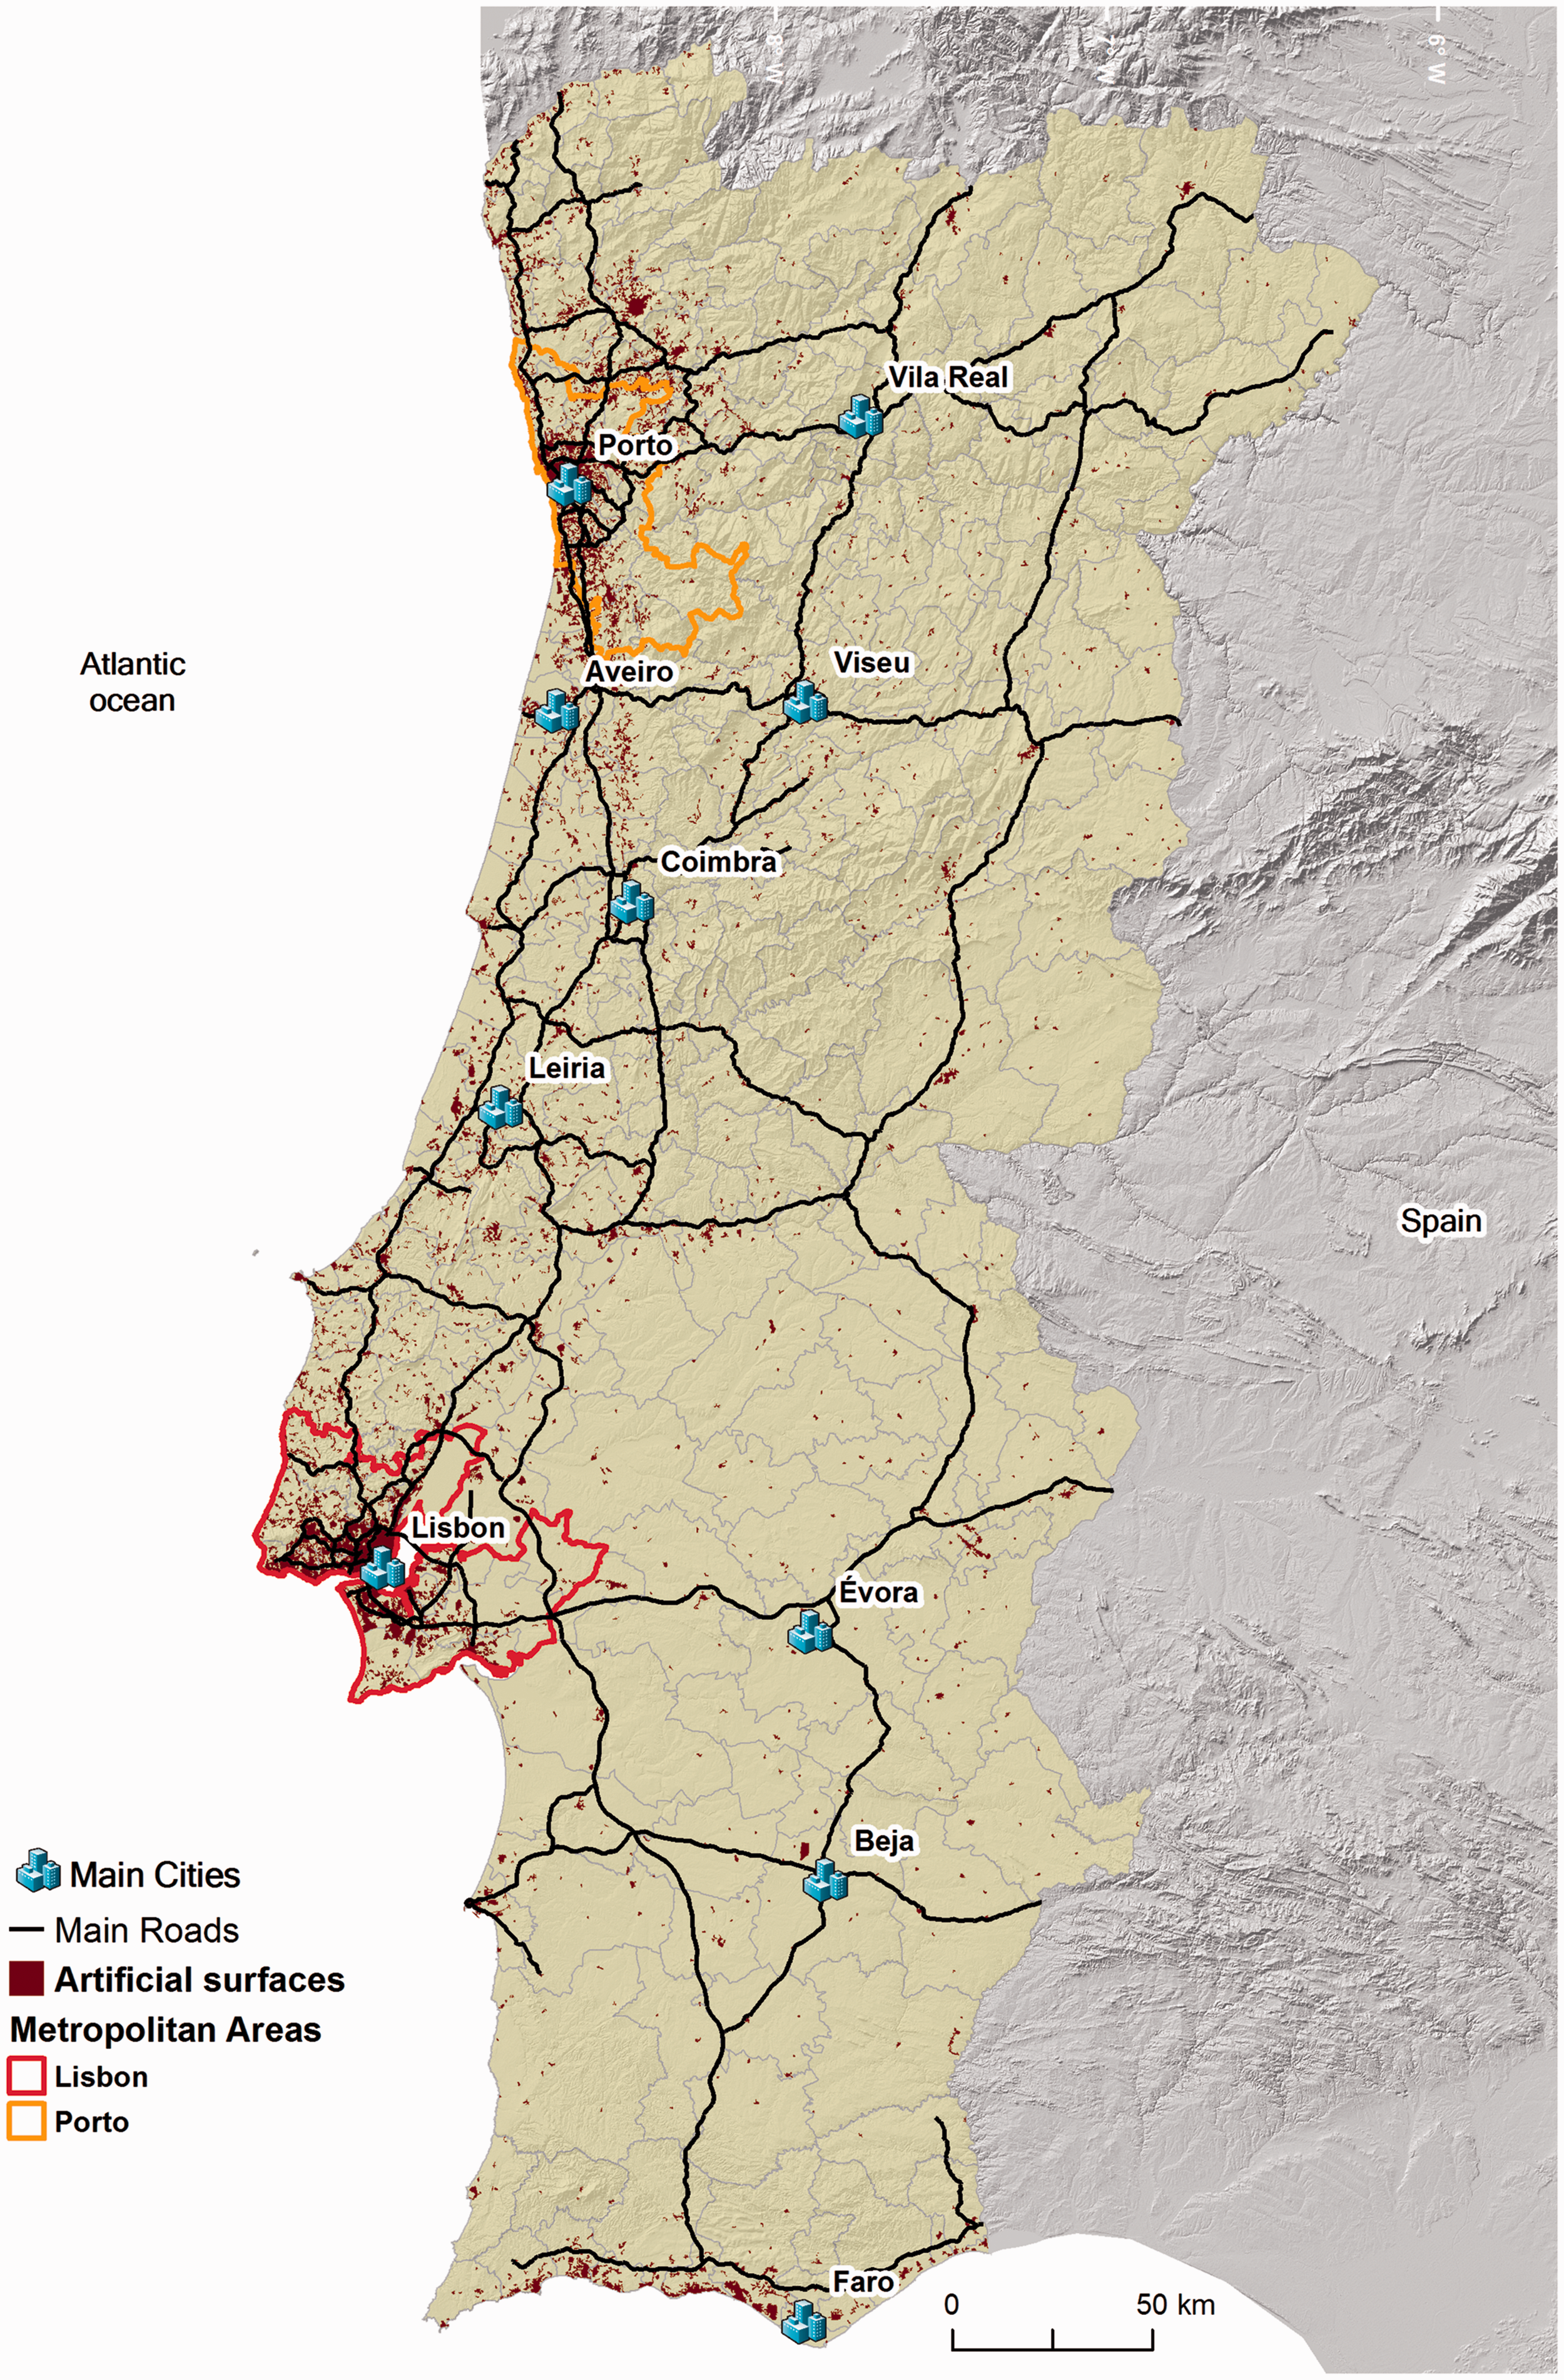
Statistical indicators
A small number of statistical indicators have proved to be enough to characterize urban systems. Population growth and density, commuting, employment, and income are the most commonly used (Kasanko et al., 2006; Schwarz, 2010). We selected six major classical indicators to characterize the Portuguese urban form based on the most commonly used indicators in the literature, and also on their availability for a given time period from the Portuguese statistics office (Statistic Portugal). All data refer to the census time periods of 1990 and 2011 and their variations (total of 17 indicators). They are: 1) population density; 2) population size and growth – these two indicators are commonly used to address spatial patterns; 3) population education level; 4) population main occupation – higher degrees of education levels have a strong positive relationship with new housing developments (Schwarz, 2010; Zhang, 2001), and can serve, together with the main occupation of the population, as proxy indicators of income since in Portugal, at the municipality level, there is no accuracy for this type of information; 5) levels of motorisation, and 6) commuting – increased use of automobiles and commuting are related to sprawl growth (Camagni et al., 2002; Huang et al., 2007; Travisi et al., 2010).
Spatial metrics and LUC data
Integrating spatial metrics can help examine and quantify the structural dimensions of LUC changes in urban areas (Liu and Yang, 2015). Plus there is a strong relationship between the spatial structure of an urban area and its functional characteristics that can be derived from a cross-analysis. Herold et al. (2002, 2003) quantified urban land use using landscape metrics in conjunction with spatial modelling of urban growth. Angel et al. (2007) used five metrics to measure sprawl together with five attributes to characterize types of sprawl. Jiang et al. (2007) used 13 geospatial indices to measure sprawl and proposed an urban sprawl index combining all of them, thus reducing computation and interpretation time and effort. Hence, a variety of spatial metrics have been proposed and applied to quantify the different spatial characteristics of urban areas, such as fragmentation (Kane et al., 2014; Zhang et al., 2013), shape complexity (Wu et al., 2011) and heterogeneity (Taubenböck et al., 2014). This confirms that landscape metrics can aid as an important mathematical tool to characterize urban sprawl and systems more efficiently.
However, the number of spatial metrics is enormous and there is no predefined set of specific spatial metrics to be used for spatial planning purposes and to characterize urban LUC patterns, which makes the selection of appropriate metrics a real challenge (Schindler et al., 2015; Wu et al., 2011). Therefore, more research is needed to help select appropriate spatial metrics according to the objective of the study, the spatial scale, and the characteristics of the urban system under investigation (Clifton et al., 2008; Liu and Yang, 2015; Reis et al., 2016).
To investigate the composition and configuration of Portuguese urban patterns, we selected a set of 32 metrics of class type that are available in the Fragstat software (McGarigal et al., 2012) and are most commonly used in current research to cover the principal aspects of structural landscapes (Liu et al., 2010; Luck and Wu, 2002; Schwarz, 2010; Torrens and Alberti, 2000; Wu et al., 2011). Several of them are highly correlated. In order to reduce this universe, in a previous study, we examined pairs of metrics with Pearson's correlation coefficients over 0.8 and excluded some pairs from further analysis (Marques da Costa et al., 2009).
In parallel, since our objective was also to provide simple metrics to be used and easily calculated by spatial planners, we reduced the number of metrics based on the literature review on spatial metrics for land use planning. Luck and Wu (2002) use specific landscape metrics, such as Patch Density and Mean Euclidean Nearest-Neighbour distance, since these are adapted to several spatial resolutions; Torrens and Alberti (2000) suggest patch density as a crucial metric to analyse urban sprawl. Herold et al. (2002) highlight the importance of using fractal dimension indexes to analyse the compactness and/or the fragmentation of a patch. Bailey et al. (2007) argue for the significance of using a metric that represents the percentage of a given landscape for the study of low thematic resolution landscapes, and Liu et al. (2010) suggest combining a time frame by analysing the growth of a certain landscape over time. In a more specific context, South European and Portuguese research also suggests a small set of spatial metrics to analyse LUC changes and to support spatial planning, i.e. number of patches, Euclidean distance neighbour, shape index and dispersion index measuring growth of non-contiguous patches (Abrantes et al., 2016; Aguilera et al., 2011; Aguilera-Benavente et al., 2014; Marraccini et al., 2015; Taubenböck et al., 2014).
This resulted in a list of five spatial metrics related to density, proximity and form analysed for 2006 and their variation during the 1990–2006 period. These are: Density index, Average nearest neighbour index, Average proximity index, Compactness index and Dispersion index (where the latter provides an analysis of the increased non-contiguous urban area from 1990 to 2006 to an existent urban area of 1990). A brief definition of these spatial metrics can be found in the online Supplementary Material (Appendix A). The spatial metrics by municipality can be visualized in Google Earth using the KMZ file supplied in online the Supplementary Material (Appendix B).
The spatial metrics are calculated after the extraction of LUC patches describing the Portuguese built-up areas from the Corine Land Cover (CLC) product. The CLC is a European Union official land cover map derived from both satellite images and orthophotos using visual interpretation to extract built-up areas and other land covers. It is mostly used for European comparative studies and to support EU policies. It has a minimum mapping unit of 25 ha and it is mapped at a scale of 1:100,000. Its accuracy is above 85%. The limited resolution of the Landsat images that it uses has consequences for land use maps, especially concerning certain types of land uses, such as small built-up scattered patterns, which can be underestimated (Aguilera-Benavente et al., 2014). The CLC is currently the only LUC data that covers Portugal as a whole with three time references (1990, 2000 and 2006). In addition, given the free nature of the CLC, it is an attractive source to test methodological applications (both spatial and temporal), to be used by spatial planners, and also to perform comparative analyses at a European scale. We have aggregated the artificial CLC classes into three different layers representing the built-up patches of the 278 municipalities of mainland Portugal in 1990, 2000 and 2006. Then each built-up patch was assigned to a respective municipality using database attributes and GIS.
The clustering method
We used an SOM as a visual clustering method to define a typology of urban occupation based on the previously described set of multidimensional indicators. An SOM is a computational neural network developed by T. Kohonen in the early 1980s as a visualisation and analysis tool to explore patterns, allowing for the combination of data reduction and clustering without losing useful information, and keeping the topological relationships from the input space (data observations) to the output space (network or SOM) (Arribas-Bel et al., 2011; Henriques et al., 2012). An SOM uses unsupervised learning methods, i.e. it has no focus on a target or predetermined value. Rather, it focuses on finding hidden structures and relations among data (e.g. clustering, association, feature extraction).
An SOM uses a set of neurons, often arranged in a 2D rectangular or hexagonal grid, to form a discrete topological mapping of an input space. Each node has a specific topological position and contains a vector of weights of the same dimension as the input vectors, i.e. if the training data consist of vectors of n dimensions, then each node will contain a corresponding weight vector of n dimensions. The SOM initialisation consists of choosing random values for the initial weight vectors.
The training algorithm itself consists of three phases: in the first phase (competitive), the output layer neurons compete with each other, based on a measure of similarity – generally the Euclidean distance – for the input signal. The neuron that is more similar to the signal is designated the winner or the Best Matching Unit (BMU) and in turn excites its neighbouring neurons. The second phase (cooperative) is set in the neighbourhood of this neuron. Generally a Gaussian function is used to define how to update the weights of the neurons in the BMU neighbourhood. In the third phase (adaptive), the vectors of the BMU and its neighbours are iteratively adjusted. The excited neurons decrease their individual values of the discriminant function in relation to the input pattern through suitable adjustment of the associated connection weights, such that the response of the winning neuron to the subsequent application of a similar input pattern is enhanced.
The best way to explore the existence of patterns in the output space is by using the U-Matrix map and the component (indicator) plane map (Arribas-Bel and Schmidt, 2013; Henriques et al., 2009). The U-matrix displays the Euclidian distance between neighbouring neurons in the 2D contiguous surface through a colour scheme (normally ranging from dark blue to orange/red). Blue signifies a high density of data and a certain homogeneity between data. Orange to red represents large distances between units, suggesting differences among neurons and can correspond to cluster borders.
The component planes (CP) are another SOM visual representation showing the distribution of one indicator at a time through a gradient of colours where red normally represents high values, and dark blue represents low values of the indicator. We can explore how a certain indicator varies along the map, how the units vary and relate in each CP so as to help characterize each cluster, and we can compare several CP and visually make correlations between variables (Arribas-Bel et al., 2011).
We used both visual outputs to understand the relations between the different aspects of the Portuguese urban occupation. In the first case, we focused on examining which BMU are grouped together and closer to each other by analysing colour patterns and boundaries between colours in the U-matrix. For instance, by looking at Figure 2(a), we can find a BMU and a small set of neighbouring units in the right upper corner in a homogenous blue and very well separated area that can be easily assigned to a cluster (Figure 2a). In the second one, we want to see how the different units are mapped into the different CP to discover (dis)similarities and to study how the different dimensions are distributed. For instance, Figure 2(b) and (c) shows the selection of two indicators for the BMU in the upper right corner. We can see that the use of automobiles and the compactness index highly characterizes this area. We can do this cross-analysis for all the indicators. By analysing how the indicators are mapped in the SOM for a set of units, we gain information for the clustering process.
(a) U-matrix and selected BMU for two component planes: (b) use of automobiles and (c) compactness index.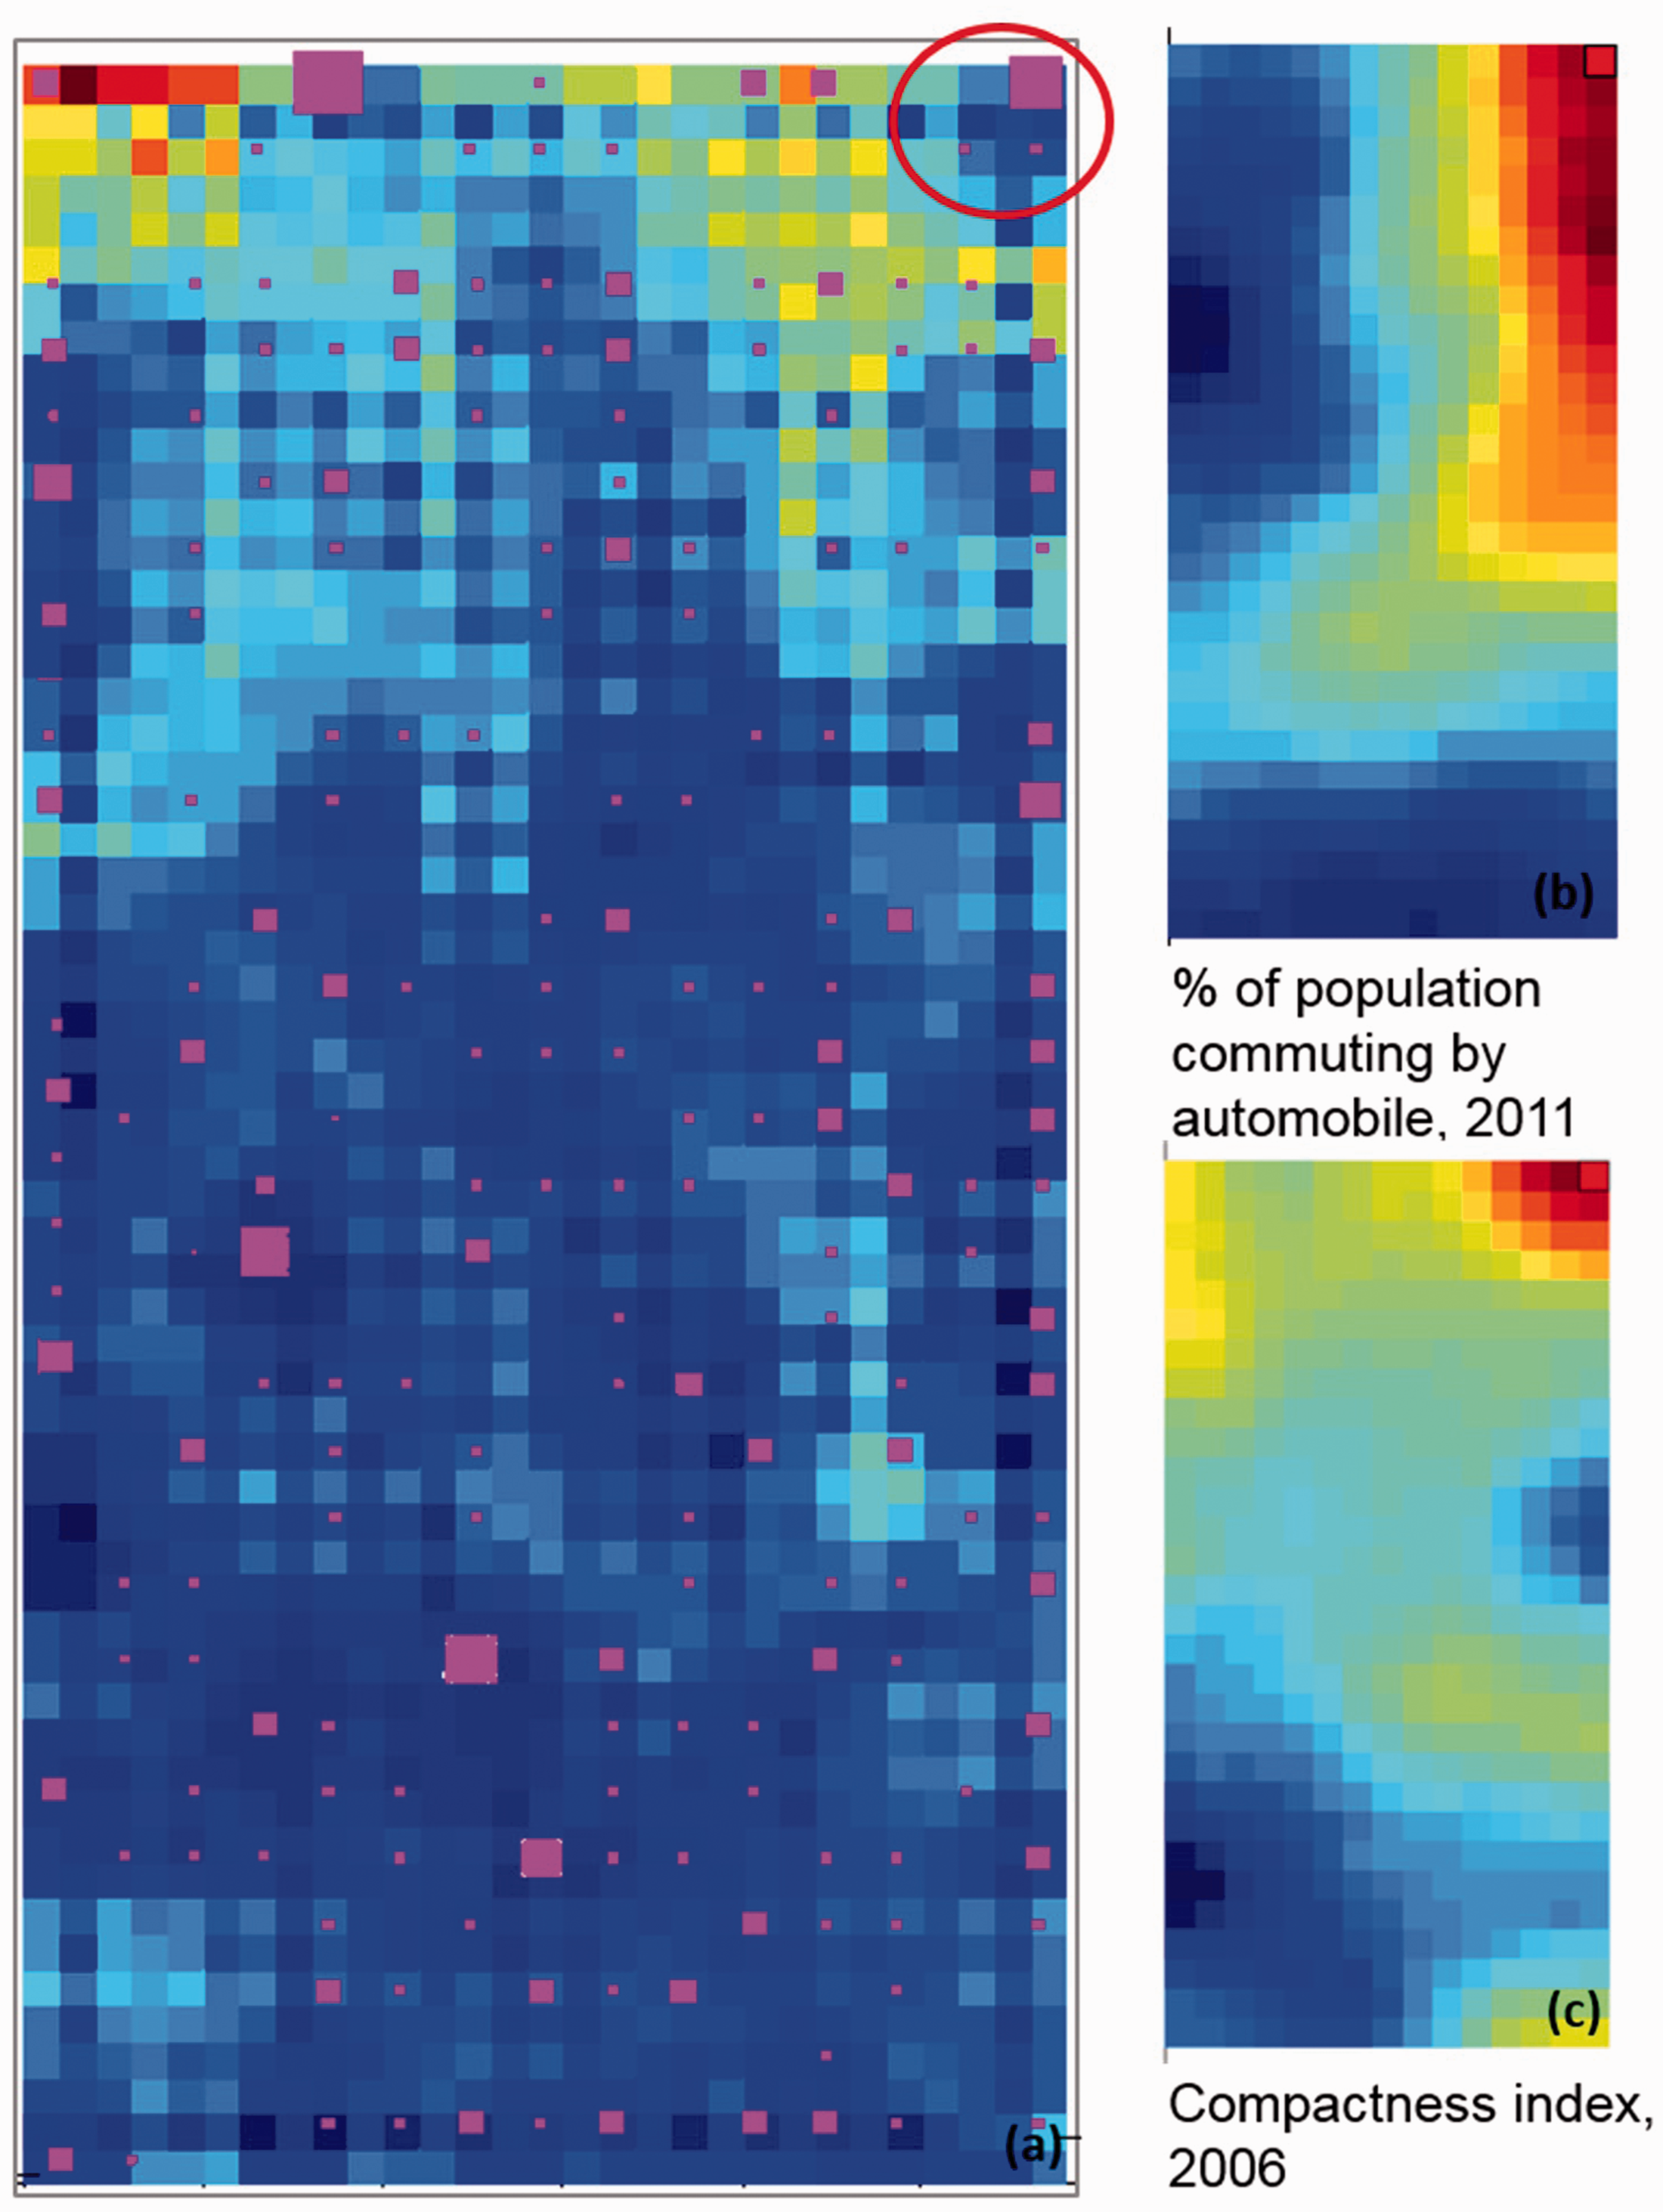
After several tests with larger and smaller networks, different shapes and structures, and different training parameters, a rectangular lattice and sheet structure, and a 450-map grid (15 × 30) were used. Using a high-dimensional grid (450-neuron) above the minimum (83-neuron) retrieved by the simple heuristic (5×sqrt(k)) allowed us to reduce the phenomenon referred to as the “edge effect”, which arises when using a rectangular or hexagonal topology and a low-dimensional geometry (Arribas-Bel and Schmidt, 2013). Also, when using a large network, municipalities do not necessarily cluster in the same neuron unless they are similar, i.e. unnatural groups of municipalities will not be forced into the same group. Thus, one or more units are naturally assigned to a BMU, allowing for a more efficient comprehension of the data structure (Abrantes et al., 2005; Arribas-Bel et al., 2011).
A detailed visual examination of the U-matrix, together with the analysis of the CP maps (both shown in Figure 2) enabled us to identify and differentiate between ten groups of clusters (Figure 3).
Clusters in the (a) U-matrix and (b) component planes.
In some cases, it can be difficult to relate some units to a specific cluster when the feature output map is highly populated because we cannot clearly distinguish between two clusters. To help support the visualisation of the results and remove some ambiguity, we ran a hierarchical clustering algorithm available in the GeoSOM suite tool using 10 predefined groups. We also ran a smaller network to force groups of municipalities into clusters. The results show consistency with the visual interpretation.
Results and discussion
After analysing the U-matrix and the CP, we highlighted ten clusters of municipalities. In clusters 2, 3 and 6, all spatial metrics except for the Average nearest neighbour index show a relevant variation distribution in the grid; statistical data do not vary in these classes, except for those related with the use of automobiles. The spatial metrics allow us to better explain these classes. Clusters 1, 4, 5 and 7 are better explained by statistical indicators, as they show more variation distribution than spatial metrics. Finally, clusters 8, 9 and 10 are characterized by both statistical indicators and spatial metrics (Figure 3).
The indicator analysis for each cluster revealed that in some cases there were clusters that presented some similarity with others in some of the indicators, e.g. clusters 2, 3 and 6; 4 and 5, and 8 and 9. For instance, clusters 8 and 9 revealed a similar behaviour in terms of population, higher education, and the size and number of urban patches (see Figure 3b, CP: DPOP01; PopCid01; TXESCUP01; AREAMANC06; MANCHAS06), while population working in the services sector (PEMP301), the use of automobiles (PACTFAUTO0), and patch density (DENS06) distinguished them.
Thus, after describing all the classes, we defined a smaller number of urban occupation patterns, thus simplifying the presentation of the results for spatial planning purposes. Figure 4 highlights the proposition of six urban occupation patterns, grouped from the ten classes visually defined through the SOM; it also indicates which BMU with more than three municipalities can be found in each pattern.
BMU representation over the U-matrix and types of municipalities.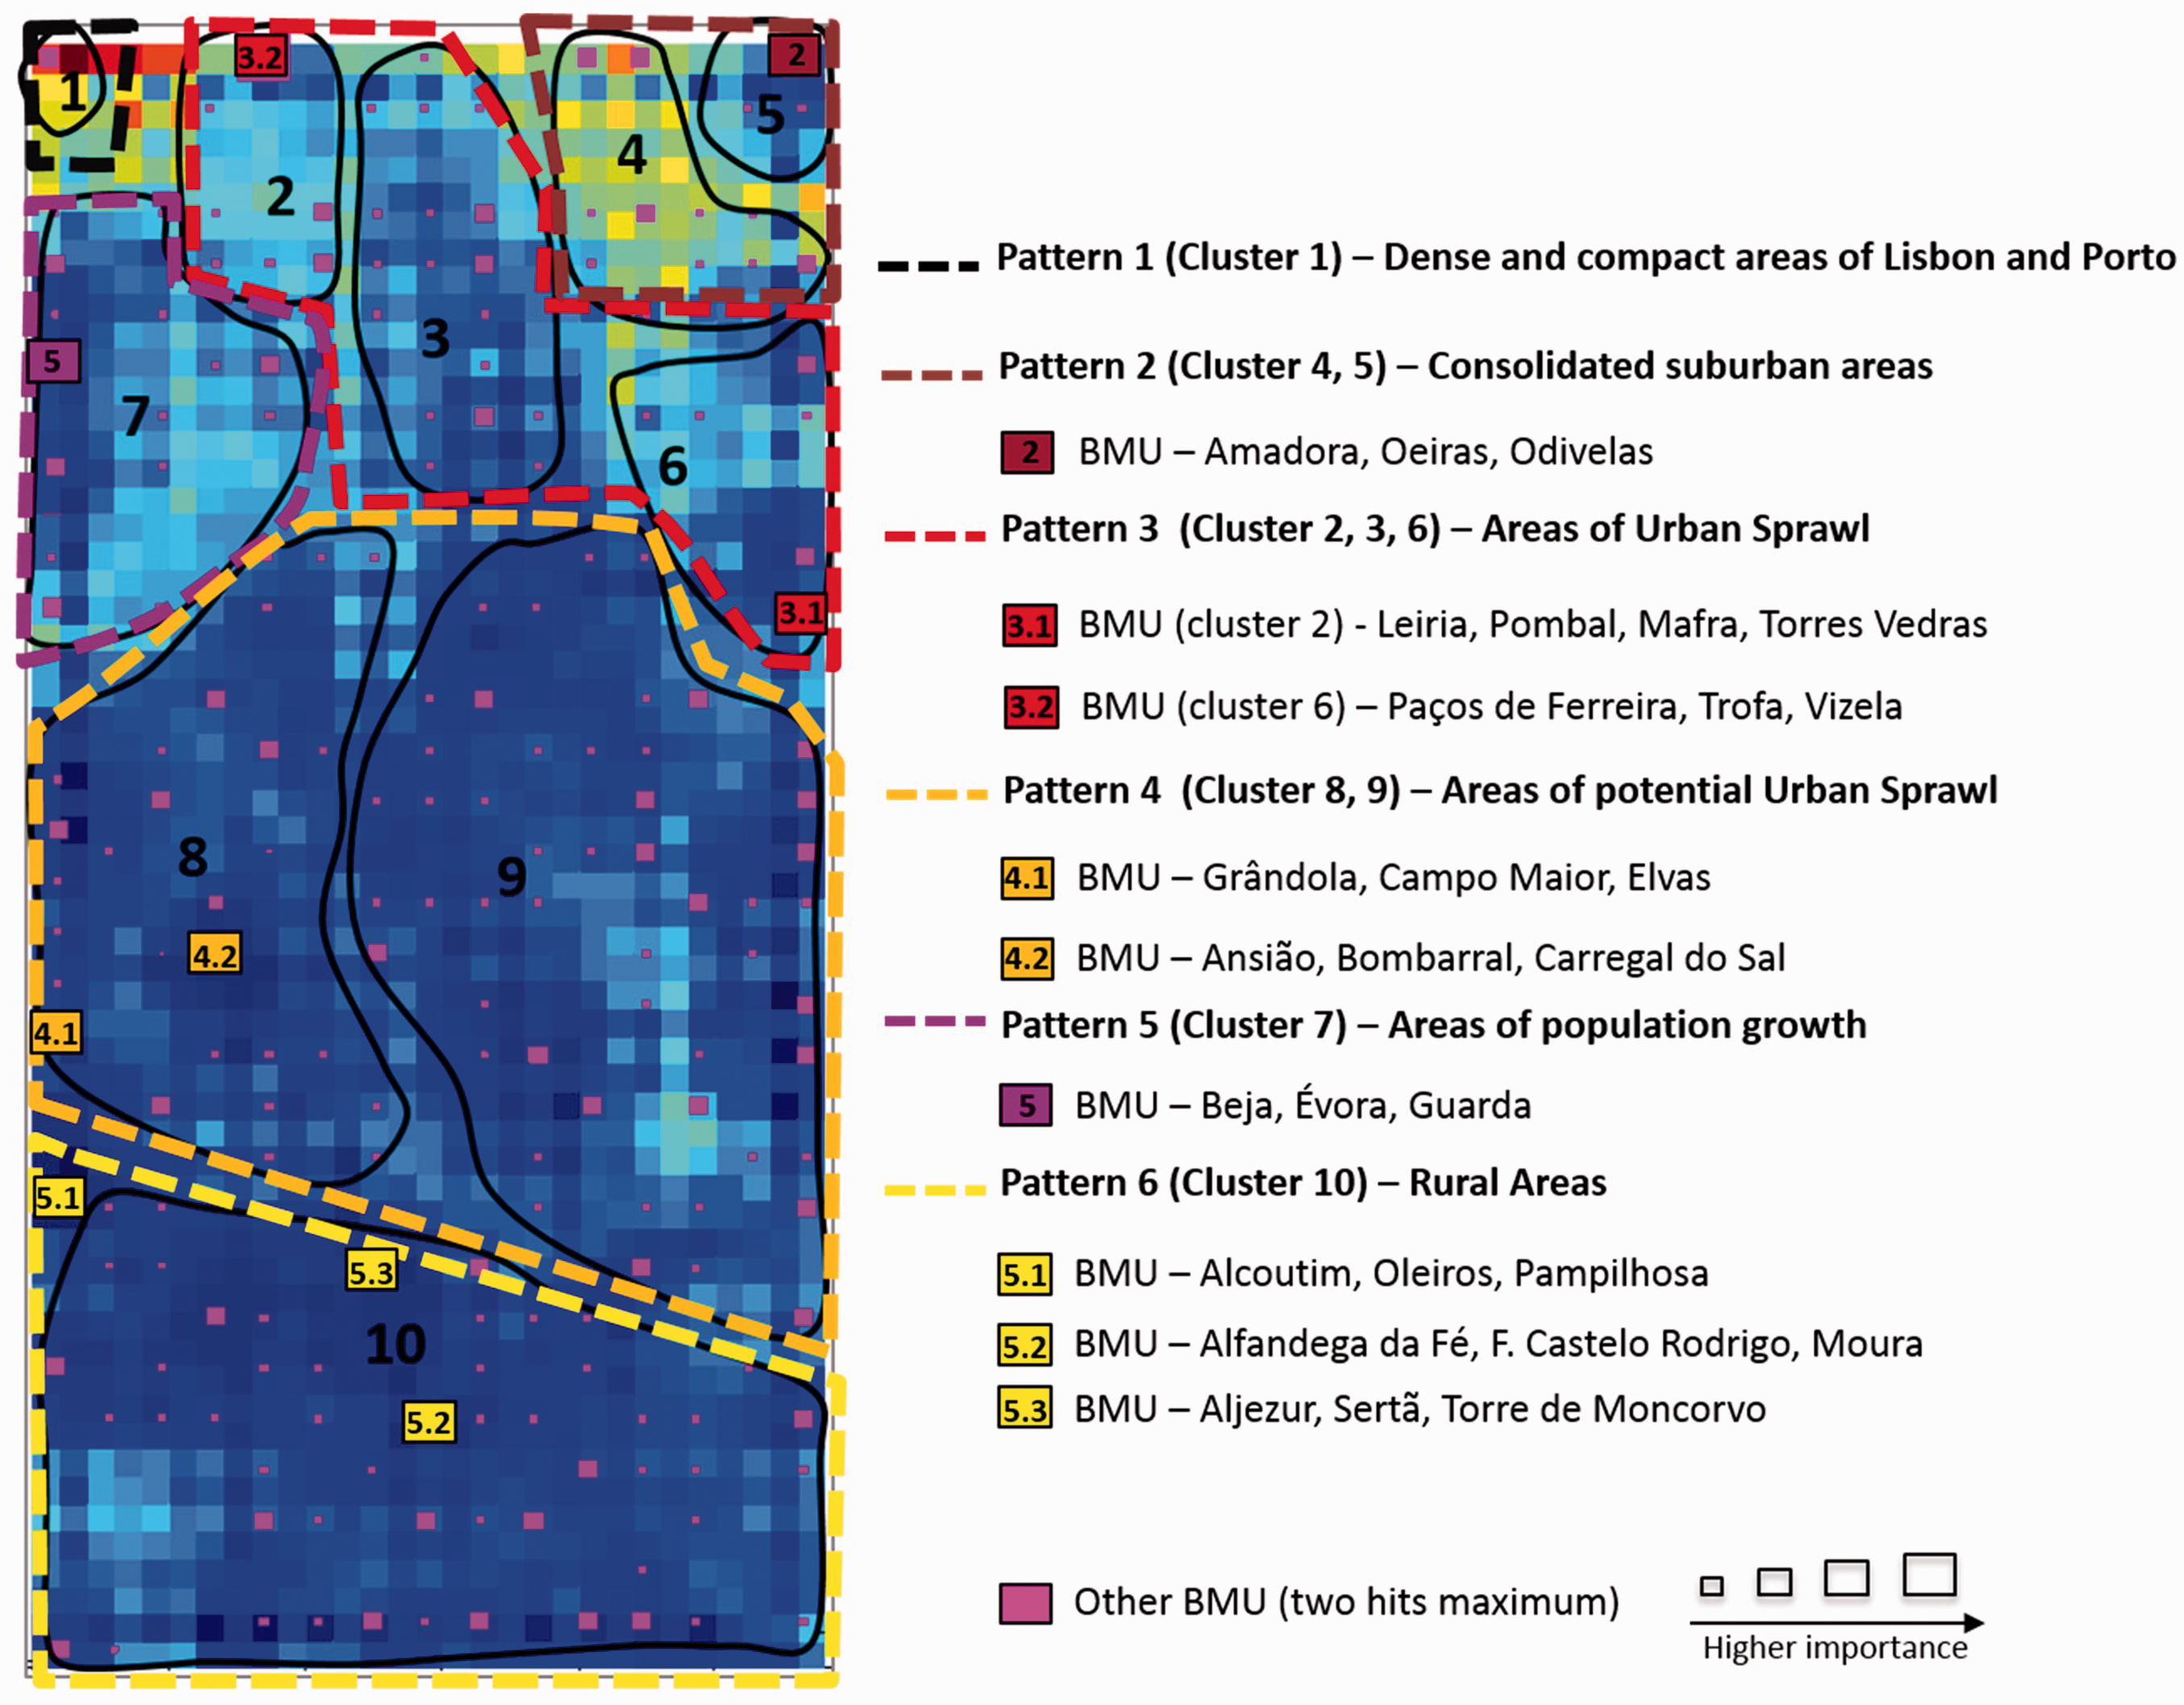
A typology of urban occupation
Six empirical patterns are proposed for this analysis as follows:
Pattern 1) Dense and compact areas of Lisbon and Porto (cluster 1): the 2011 statistical indicators are the most relevant ones, namely the high number of people working in the services sector (PEMP301), educational (TXESCSUP01) and commuting levels (AG01), urban population (POPCID01) and population density (DPOP01). Relating to spatial metrics, the built-up area (AREAMANCHA06) and the compactness index (COMP06) contribute to characterizing this cluster.
Pattern 2) Consolidated suburban areas. This type is characterized by cluster 4 where the area of the urban patch in 2006 (AREAMANCHA06) and its density (DENS06) have a large importance in the cluster; the 1990–2006 variation of the proximity index (VPROX9006) is also important and it shows that urban patches tend to be closer to each other. 1991–2011 variations in urban population (POPCID01), population rate (VARPOP9101), inhabitants commuting (VPACTF) and using automobiles in commuting (PACTFAUTO0), as well as the growth of population density (VDPOP01) are also indicators that explain this class. We considered cluster 5 in this type of urban occupation. Besides the previous indicators, it also strongly related to the compactness index (COMP06) and to population density (DPOP01). Moreover, the density index decreases between 1990 and 2006 (VDENS9006), showing a coalescence of patches.
Pattern 3) Areas of urban sprawl. Clusters 2, 3 and 6 are characterized by urban sprawl forms. Cluster 2 is highly characterized by spatial metrics: by analysing the component plan (Figure 3b), we observe that the number of built-up patches (MANCHAS06) is higher in this region of the map as is the density index variation (VDENS9006), thus showing that more patches are appearing in those areas; additionally, the dispersion index (DISPERSO90), which measures the patches that have appeared by non-contiguity to existing ones, indicates that strong urban sprawl levels have occurred. The statistical data show fewer variations as we can see in the component plans showing low distributions. Viseu and Braga are major district capitals that can be found in this class. Cluster 3 is largely characterized by the density index in 2006 and its variation between 1990 and 2006. There was also an increase in the population rate between 1991 and 2001 and in the population density (VDPOP01). This class occurs near the Porto metropolitan area with traditional land use heterogeneity (Silva and Clarke, 2002). Cluster 6 is related to commuting, and commuting by automobile. Also, the growth of higher education, population and population working in services is relevant. Regarding spatial metrics, there is a tendency for density growth between 1990 and 2006. We can characterize these clusters as areas where urban sprawl occurs: population is moving to those areas and thus commuting levels are important; in terms of spatial patterns, these tend to display a higher density, which implies a large number of patches per area and non-contiguous.
Pattern 4) Areas of potential urban sprawl (clusters 8 and 9). Very homogeneous municipalities considering all indicators (near the average). The compactness index is important and the average nearest neighbour index (VDMVMP9006) is decreasing while the density index and its variation between 1990 and 2006 are growing. They have a population working in services, but also with a positive evolution of the primary sector (VPEM01), especially in cluster 9; commuting is also important.
Pattern 5) Areas of population growth. In cluster 7, the major cities of the country are grouped together, especially because of indicators such as urban population growth between 1991 and 2001, and also the high level of education, the growing population rate and population living in cities (TVPOPCID), and the population working in services.
Pattern 6) Rural areas (cluster 10). This corresponds to municipalities where the population works in the primary sector, but also with an increase in the population working in the services sector. The compactness and its variation are important, as well as the average nearest neighbour index (which is high), revealing that urban patches are more isolated.
Do spatial metrics bring added knowledge to urban occupation patterns?
To test if it is worth combining statistical data with spatial metrics, we have run another SOM just for the statistical indicators, and then defined the same six patterns. Figure 5 compares both typologies through a matrix that includes the spatial metrics (Figure 5a) and without them (Figure 5b).
Typology (a) with and (b) without spatial metrics.
By comparing both maps, we can observe that patterns 2, 3 and 4 are poorly classified if we take into account only the statistical data, but also some rural areas (pattern 5). For example, we can find that municipalities like Peniche or Figueira da Foz (near Leiria and Coimbra) in the highly urbanized coastal area of mainland Portugal went from “areas of potential urban sprawl” (Peniche) and from “areas of urban sprawl” (Figueira da Foz) to a “rural area” pattern. In these two particular cases, spatial metrics provided more pattern discrimination. With statistical data only, these areas are very homogeneous; indicators such as growth of services and commuting are very important but evidence shows that this is a common phenomenon in both rural and peri-urban areas. Moreover, from urban cores to the peripheries, e.g. in Lisbon and Porto metropolitan areas or near some medium-size towns (Viseu, Coimbra), normally there is a transitional pattern from more consolidated areas to more fragmented and sprawled ones. In Figure 5(a), this is evident, but in the second case this property does not appear (Figure 5b). For instance, near these areas, the emergence of urban patches (e.g. growth of urban patch density) in recent years is enhancing spatial fragmentation, and this phenomenon does not appear when using only statistical data.
The map in Figure 6 shows three urban occupation structural patterns. First, we see a high occupation of the coastal area of the country where Portugal's urban development is concentrated around the two metropolitan areas of Lisbon and Porto, along the coastline from Lisbon to Porto, and along the Algarve coast. This is consistent with other studies, such as Carmo (2012) who proposes four metropolitan arcs in the Portuguese urban system. Secondly, the main district capitals changed from areas of population growth to revealing patterns of urban sprawl (e.g. Aveiro, Viseu, Coimbra, Leiria). Finally, we can observe that the predominant pattern of urban occupation is highly related to sprawl. Sprawl is an urban form that is common in many parts of Portugal, where it is frequently the case that urbanisation is growing even though the population is decreasing (Ferreira and Condessa, 2012).
Typology transitions.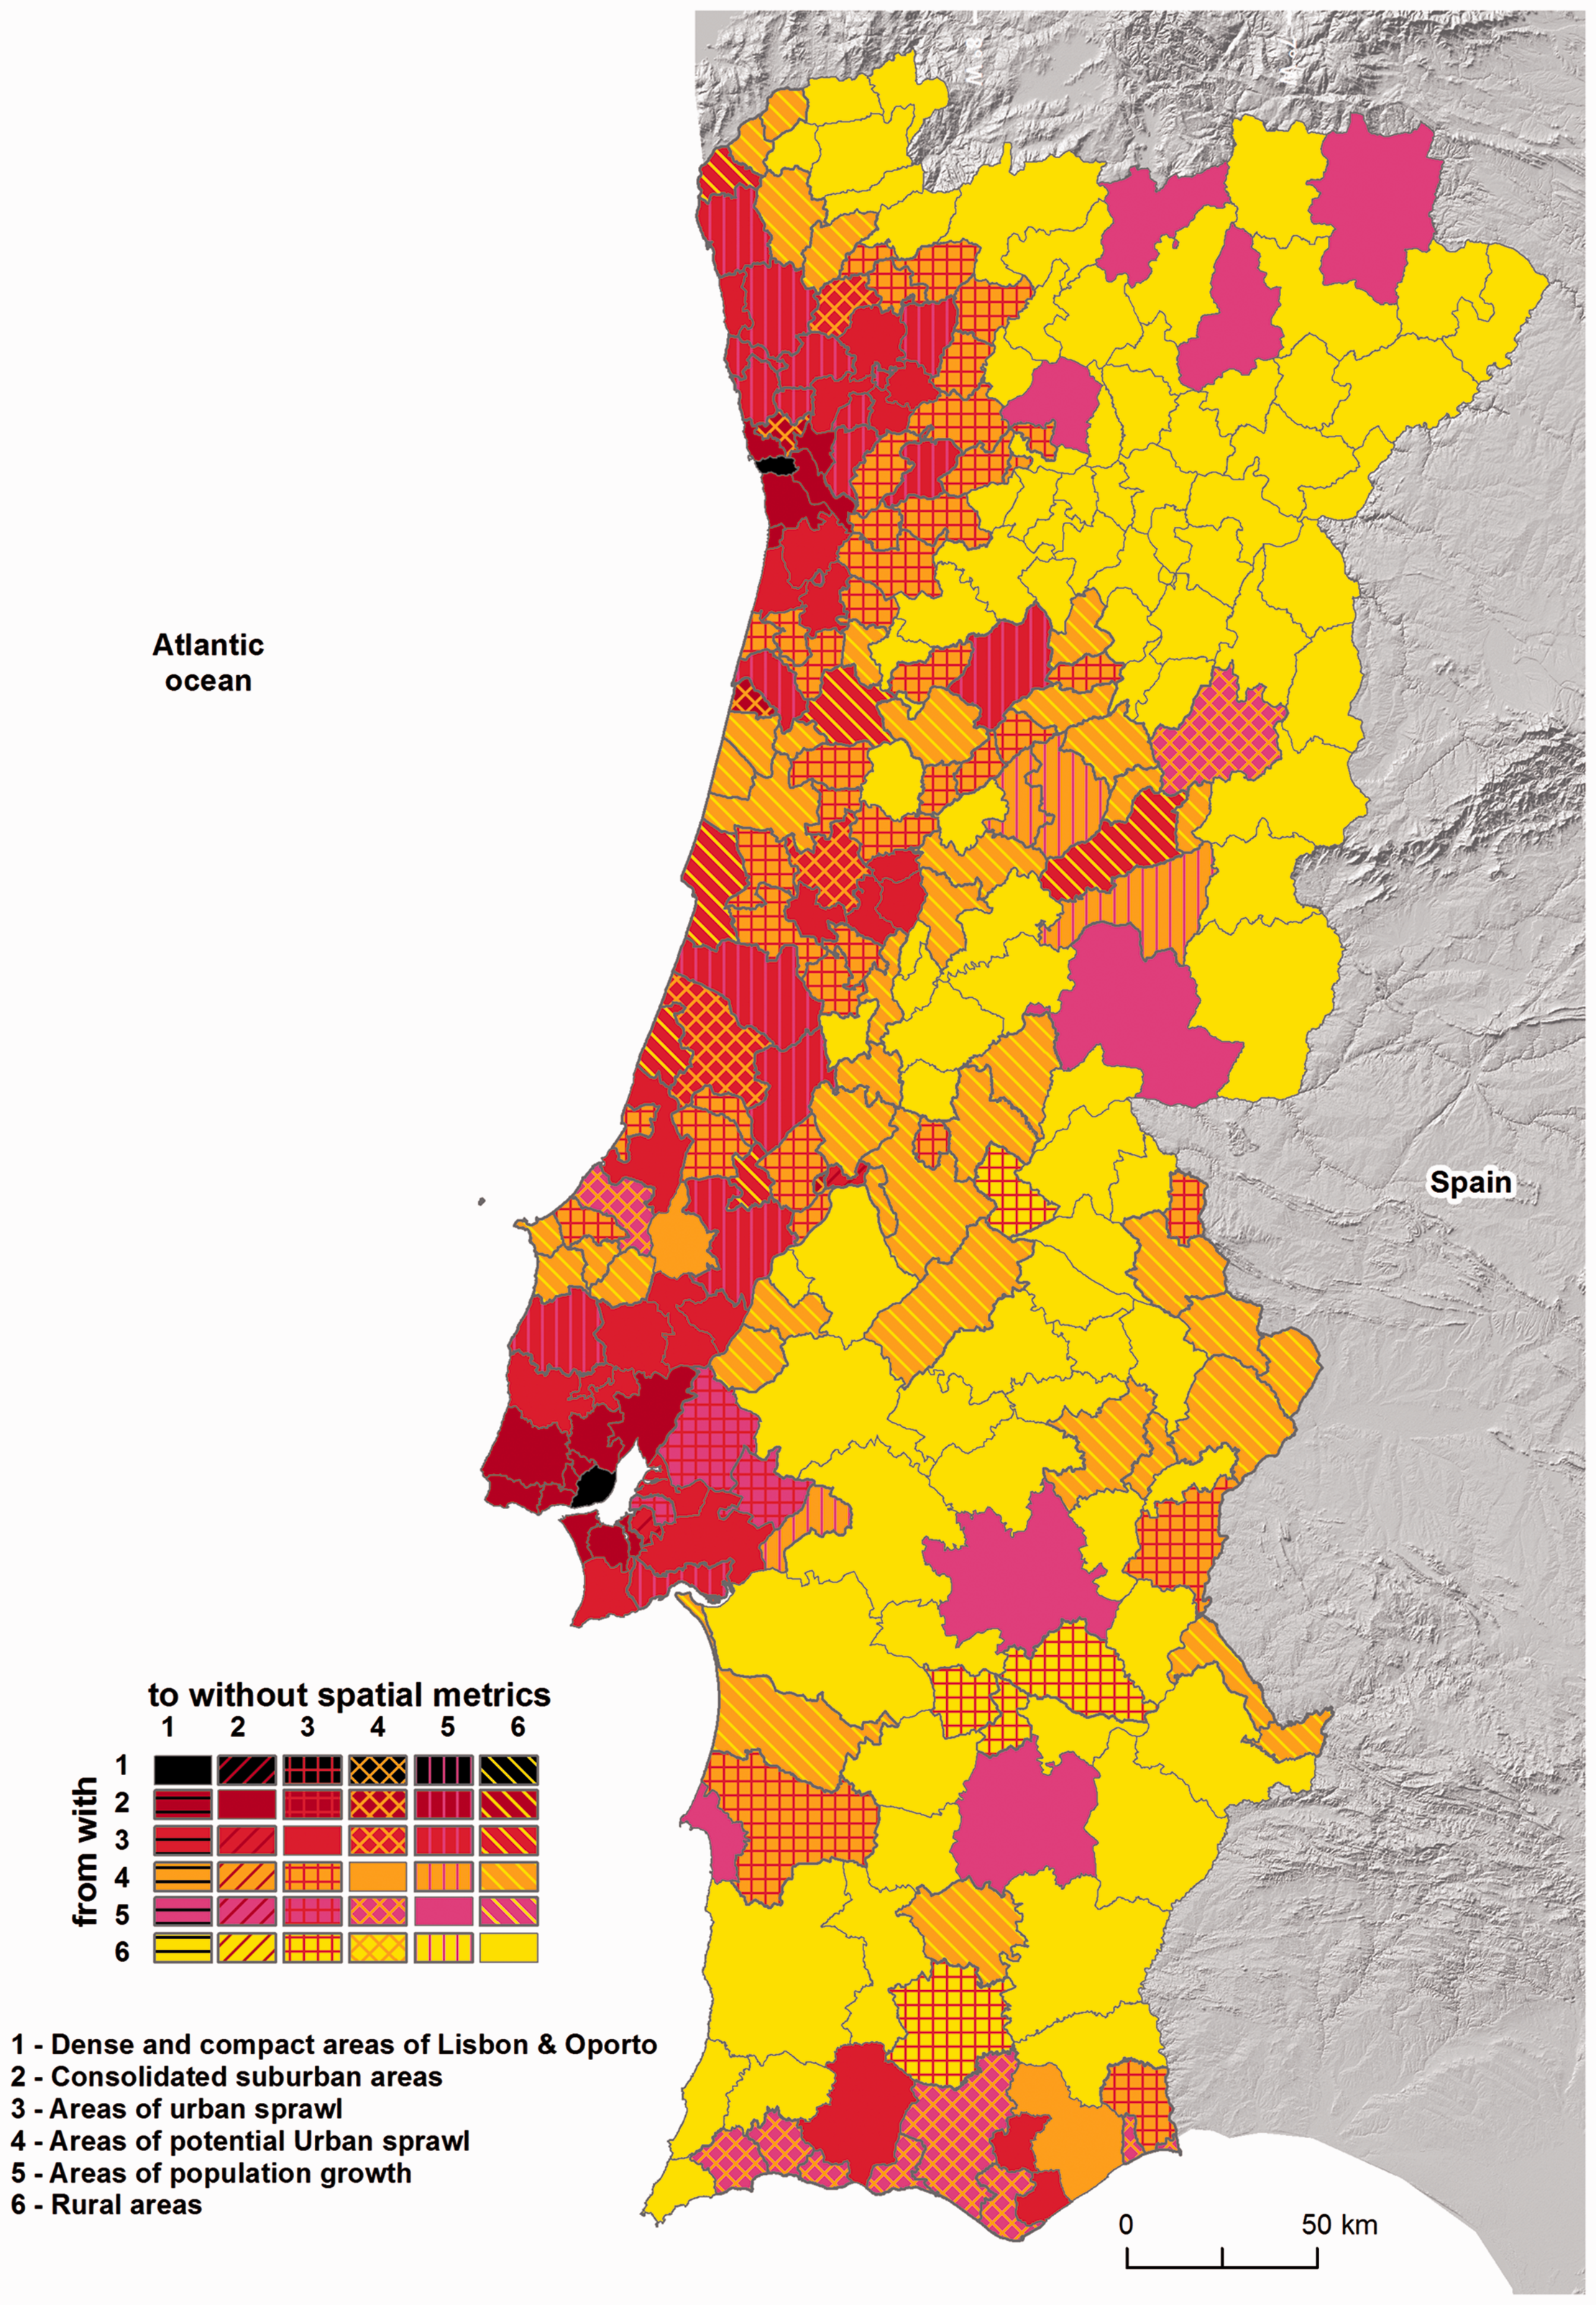
These results show the relevance of combining spatial metrics with statistical indicators in urban occupation typologies for spatial planning purposes, especially in relation with patterns 3 and 4, suggesting urban sprawl patterns. Identifying these current patterns is essential, in particular because there are specific guidelines in the Portuguese Spatial Planning Framework Law (Law No. 31/2014 of 30 May) that directly address the control of urban sprawl. Therefore, for official organisations such as Statistics Portugal or the Directorate-General for Territorial Development, which often deal with statistical data and geographical representations for spatial planning, this methodology is relevant for assessing urban dynamics. It also highlights that even a small set of spatial metrics, when related to statistical indicators, is sensible for capturing these current LUC spatio-temporal signatures, even at a medium-low resolution where they may be underestimated.
Conclusions
This paper presented an exploratory and multidimensional approach to analysing urban occupation in Portugal. The originality and importance of this approach arise from the fact that:
it considers the entire mainland of Portugal and presents a quantitative and methodological approach to extracting spatial patterns; it combines multidimensional indicators related to urban form, and by comparing the different patterns obtained when including LUC spatial metrics with statistical indicators, it shows that hidden patterns of sprawl can be revealed, thus showing the advantage of using spatial metrics combined with statistical data; the use of an SOM allows us to visualize and interact with data in a nonlinear manner without reducing the information content as would occur with other statistical methods. In fact, the use of an SOM and the data visualisation proved to be very suitable in helping us to define clusters and propose patterns. There are several advantages that derive from this approach: it is specifically designed for large and multidimensional datasets, thus exploiting data complexity. Unlike other methods for data reduction and clustering, this family of nonlinear algorithms is data-driven, i.e. it is characterized by an adaptive learning process that improves the output dynamically during training, thus producing more robust results. Moreover, the GeoSOM tool interfaces easily with a GIS, thus making it practical for the needs of studies in geographic sciences and spatial planning (Arribas-Bel et al., 2011; Henriques et al., 2012).
The three combined approaches that were developed are still scarce in Portuguese scientific studies, and have proved useful for uncovering interesting patterns across variables in the territory, as well as areas with particular characteristics, such as areas where scattered patterns are developing, namely pattern 3 where municipalities are characterized by urban sprawl forms (e.g. municipalities around the metropolitan areas of Lisbon and Porto), and pattern 4 where urban sprawl has a potential to be developed (municipalities contiguous to pattern 3 where compactness and proximity indexes are decreasing and density is growing). In fact, by providing new information on those patterns, spatial metrics proved to be useful in completing statistical information.
As an exploratory analysis of urban occupation in Portugal, this study may help to suggest new hypotheses for investigation and to derive spatial planning recommendations. As spatial planning and policy-making are increasingly dealing with big volumes of data, an SOM is a good technique for this purpose. Moreover, one can easily visualize the statistical proximity and dissimilarity between the data, which may be a useful tool when interacting with stakeholders.
The spatial metrics combined with statistical indicators also provided more relevant information about urban structures. Since the CLC covers all of Portugal, is available every 6–10 years and fits the Portuguese municipal scale (average mean area for Portuguese municipalities is 300 km2), it may be interesting to spatial planners to integrate this type of data in their regional and municipal analyses. It also enables us to study urban occupation over time and offers comparative possibilities at a broader geographical scale, e.g. comparisons in European Mediterranean contexts where these studies are less abundant.
Footnotes
Declaration of conflicting interests
The author(s) declared no potential conflicts of interest with respect to the research, authorship, and/or publication of this article.
Funding
The author(s) received no financial support for the research, authorship, and/or publication of this article.
References
Supplementary Material
Please find the following supplemental material available below.
For Open Access articles published under a Creative Commons License, all supplemental material carries the same license as the article it is associated with.
For non-Open Access articles published, all supplemental material carries a non-exclusive license, and permission requests for re-use of supplemental material or any part of supplemental material shall be sent directly to the copyright owner as specified in the copyright notice associated with the article.