
Abstract
Block restructuring has been strongly emphasized in Japan for renovating cities. However, little is known about the relation between block size and building shape. Moreover, the shape of buildings designed on a block after restructuring is unclear. In this study, the relation between block size and building shape is analyzed quantitatively, and a three-dimensional building shape is estimated by a model using an urban planning GIS data set of Tokyo. Results show the quantitative relation between block size and building shape, and the building shape image on the blocks. Higher buildings and buildings with a basement tend to be built in larger blocks, leading to efficient use of the maximum volume permitted in the block. In addition, the region composed by larger blocks can be spacious, because the range of building setback will be long in larger blocks. Designation of a high floor area ratio may induce integration and enlargement of blocks. Blocks are less likely to be partitioned in zones when a high floor area ratio is designated.
Introduction
Recently, urban policies in Japan have shifted from the development of new cities to the renovation of existing cities. Particularly in Tokyo, the importance of block (land surrounded by road) restructuring has been strongly emphasized. Three reasons can be identified. First, in a small block, large buildings cannot be constructed because of urban planning regulations, which may fail to motivate developers to renovate. Second, large offices cannot be located in a small block. Therefore, the city may lose the opportunity to attract investment from global industries. Third, the existence of roads that are too narrow is an obstacle to disaster preparedness. For all these reasons, block restructuring has become necessary.
Although the importance of block restructuring has been emphasized, there is no research on block restructuring, and the relation between block size and building shape has never been analyzed quantitatively. The building shape and location after restructuring are not evident. If the spatial images of the city can be estimated before renovation, they are useful for planning. Many kinds of estimations are used for planning. The result of population estimation is used for policy for each spatial level, country, prefecture, and city. The growth ratio of the population is an important factor to determine the policy. Land-use simulation is used in urban planning. This simulation affects the planning of zoning and transportation. In addition, if the building shape and location could be predicted, the process of the restructuring plan would be considerably improved. If software that estimates the building shape by block size and shape is developed in the future, municipalities and developers could use it to understand the future image of the block and the city. Moreover, environmental influences, such as the energy consumption and wind-induced response of the buildings, can be estimated. Therefore, the predictability of building development in blocks is significant and crucial for city planning.
In this study, the relation between block size and building shape is analyzed quantitatively, and the three-dimensional building shape is estimated by using an urban planning GIS data set of Tokyo (March 2013). Finally, the effect of block restructuring is discussed.
Literature review
Location of buildings
Malcata-Rebelo and Pinho (2010) found that land use and office location are the relevant variables to the mechanisms of office supply, office demand, and market equilibrium. They concluded that these results support municipal decisions concerning office location and management. However, it is not obvious where buildings are located in the new shape of a block after block restructuring.
There are many studies about the land use of blocks. Makio et al. (2006) analyzed apartment house location on the block scale after a change of building use to apartments. Targeting a provincial city, Saito and Kato (2013) researched changing land use and the current status of each block. Nam et al. (2007, 2008) analyzed the location of parking lots for condominiums based on the relation between green space conservation and business balance. Nagatomi et al. (2007) examined land use in blocks adjacent to a highway. Nakao and Ito (2012) analyzed urban conditions in terms of building density and the building coverage ratio (BCR) in a block. Kawaguchi et al. (2015) conducted a quantitative study about the relation between scale and fluctuation of open space and scale and fluctuation of green space. Matsumiya et al. (2014) calculated the distribution of the open space ratio among buildings in a city. Some researchers tried to extract the building footprint (Sahar et al., 2010; Zhang et al., 2006) and three-dimensional outlines of buildings (Sahar and Krupnik, 1999) by aerial images. These studies searched and analyzed the current use of space in blocks, such as land use, parking lots, and building density. But for predicting the use of space in blocks in the future, further analysis and a developing model are needed.
Building shape
Various studies have focused on the analysis of building shape. Chau et al. (2007) analyzed the optimal building shape under building height regulatory restrictions. Moreover, several Japanese researchers examined the association between building shape and city planning regulations, such as floor area ratio (FAR) and slant plane restrictions (see online Appendix 1, Table A1), as can be seen in Katsuragi and Watanabe (2000), Kirita et al. (2007), Aoki et al. (2010), and Kawakami and Ohnishi (2013). Shpuza and Peponis (2008) measured the floorplate shape in two different ways and analyzed its influence on office layout. Some studies have proposed models to simulate the optimal office building shape using a genetic algorithm (Grierson and Khajehpour, 2002; Ouarghi and Krarti, 2006; Wang et al., 2006). These studies analyze the optimal building shape by model. But these analyses did not use actual building samples. In this study, building shape is estimated by using a GIS data set.
In office design terms, offices require a high rentable ratio (the rentable area divided by the area available for use in a building) and an efficient working environment. According to Kooijman (2000), office design has changed because of globalization and the needs of the local environment. The office layout is said to be associated with work practices.
These studies mentioned several factors that are relevant to building shape. In particular, city planning regulations have been focused on for analyzing building shape (e.g. Chau et al., 2007; Grierson and Khajehpour, 2002; Katsuragi and Watanabe, 2000). Developers design a building in order to maximize the benefit of the block under the restriction. In this study, we consider city planning regulation for developing an estimation model of building shape.
Urban renewal
Changes in building shape through urban renewal have been analyzed. Some studies have concluded that the initial block shape affects the future building shape or block shape after urban renewal. Siksna (1998) examined the influence of the initial block shape on the building shape after development. Ryan (2006, 2008) suggested that new residential patterns are established after the transformation of blocks. Processes of urban renewal have also been studied. Lin and Lin (2014) adopted game theory to analyze urban renewal processes based on the characteristics of landowners. In addition, some studies have focused on the process of change in blocks in the center of Tokyo (Matsukura and Miyawaki, 2006), the development process of traditional rectangular blocks in Kyoto (Hayami, 2009), and the development process of blocks used for office buildings in the Marunouchi area in Tokyo (Nomura, 2014). These researchers studied the changing building shape and process of urban renewal. But the building shapes in the future could not be estimated by these analyses.
Estimation
In this study, building location and shape are estimated. Some estimation methods for urban physical status, such as building footprint location, floor area, and land use, have been developed in previous research.
Taima et al. (2016b) developed a model to estimate the building footprint area by using GIS. The future image of the building footprint on various blocks is visualized. Similarly, Asami and Ohtaki (2000) developed a model to estimate detached house location. Orford (2010) developed a methodology for estimating the floor area of individual properties from digital infrastructure data. Shiravi et al. (2015) assessed the utility of some models for estimating floor area using three data sources: a geographic vector building footprint layer, a LiDAR data set, and field survey data for the south side of the city of Fredericton, Canada. They discussed the reliability and accuracy of each model. In other research, Brunner et al. (2009) extended a methodology for building height estimation and tried to improve its accuracy. Schmidt et al. (2010) presented an approach to the estimation of building density on the block scale. Land use (Debnath and Amin, 2016; Güneralp et al., 2012; Spyratos et al., 2017) and floor area (Orford, 2010) are popular topics and estimated in previous studies of the urban field, but estimation of building shape has seldom been a focus in the literature. Three-dimensional estimations of buildings cannot be found. If software to estimate building shape by block shape and other conditions was developed, it would be useful to determine urban planning, such as population estimation and land-use estimation. In this study, an estimation model is developed and applied to certain areas.
Method
Study area and data source
In this study, an urban planning GIS data set of Tokyo (March 2013) is used. This data set contains building types, the number of floors, land-use zones, the designated FAR, and the designated BCR (overview on urban planning regulations in Japan is shown in online Appendix 1, Table A2).
The relation between block size and building shape is first analyzed quantitatively. For analyzing the relation, we aggregate the number of blocks, lots, and buildings. Moreover, we calculate the area of blocks, lots, and building floors. The study area encompasses the special wards of Tokyo (626.70 km2). The population (9,256,625 people) and many functions are dense in this area (Tokyo Metropolitan Government, 2016). Moreover, urban renewal and block restructuring are strongly emphasized in this area.
All buildings, lots (parcel of land), and blocks in the special wards of Tokyo are used for analysis. When the relation between block size and building shape is analyzed, samples are distinguished by designated FAR, because the block size and building shape are expected to be much different in each designated FAR.
Next, the building shape is estimated using a model. The accuracy of the estimation will be higher when sample blocks with only similar conditions are used, such as land use and building type. Therefore, blocks in urgent urban renewal areas of commercial zones are chosen for analysis because the areas are designated for the most urgent block restructuring in Tokyo, where the government finances and promotes the renewal projects. In this estimation, office buildings are used in this area, because office supply is promoted in this area and several studies have focused on office shape (Grierson and Khajehpour, 2002; Kooijman, 2000; Ouarghi and Krarti, 2006; Shpuza and Peponis, 2008; Wang et al., 2006). For our analysis, two typical designated FARs are selected, namely 600% (termed group A: 27 blocks) and 700% (termed group B: 36 blocks). The FAR of 600% and 700% is found to be the mode value and the second mode value of all the blocks in the urgent urban renewal area, respectively. These blocks are used as reference blocks for estimation of building shape.
Building shape estimation model
A building shape estimation (BSE) model was developed to estimate the building shape from a block shape. A similar model has been used to estimate the building footprint in blocks (Author’s previous article) and a detached house location (Asami and Ohtaki, 2000). However, the models in these previous studies estimate two dimensions of the shape, like a footprint. In this study, the model is extended to estimate three dimensions of the shape, including the height of the building.
Siksna (1998) explained that buildings and lots are developed depending on block forms. Moreover, several researchers have noted that building shape is strongly influenced by city planning regulations (e.g. Chau et al., 2007; Grierson and Khajehpour, 2002; Katsuragi and Watanabe, 2000; Kirita et al., 2007). This shows that building shape is determined by block shape and city planning regulations. Thus, we can expect that if two blocks are similar in shape and under similar city planning regulations, the building shapes in the blocks will be similar. This naive but simple assumption enables us to estimate the building location. Accordingly, a model was developed to estimate the probability of each point on every floor level covered by a building.
More specifically, the locations of buildings on reference blocks were overlaid so that the gravity center of the reference blocks matched that of a given block. A probability was assigned to each overlaid layer depending on the similarity of the block shape. The Lee–Sallee measure (Lee and Sallee, 1970) judges the similarity between two blocks by the quotient value—the intersection area divided by the union area of the two blocks.
An index expressing the similarity between two blocks, similarity index, s, is defined below. Generally, a block can be treated as a compact set in

Based on the Lee–Sallee measure (Lee and Sallee, 1970), the provisional similarity index,

The building location greatly depends on the direction of the adjacent roads. The direction of the road is different in each block. However, the influence of the adjacent road on the building location in blocks is not so different when a block revolves around a center of gravity within an angle up to

Reference blocks are used to calculate the probability of building location. Let I be an index set of reference blocks. Then, the set of reference blocks is denoted as
If two blocks are similar in shape and other spatial features, we can expect that the building shapes and locations in the blocks will tend to be similar. Therefore, to estimate building shape in new block X, it is appropriate to use reference blocks that have a high similarity index value with the new block. It may be possible to use the similarity index, s, as a weight that determines the priority of the reference block. However, if this is the case, then all the reference blocks must be used for the BSE model. A better model can be developed by rejecting reference blocks of apparently different shape. To exclude differently shaped reference blocks, those weights should be zero. To this end, we define weight function,

The way to estimate building location can be described as follows. Let
Moreover, let

Let Z be a block to be estimated by the BSE model. Let

Let

If multiple solutions exist, then the solution closest to zero will be assigned to
Revolved block


The indicator function expressing that point 
Then, the building existing probability

Parameter t is decided so that the accuracy of the building location estimation is maximal. To this end, let

The estimation accuracy index, ρ, is given by the integral value of the building existing probability at the points covered by buildings minus the integral value of the building existing probability at the points not covered by buildings. The value of parameter t, which maximizes the estimation accuracy index, ρ, is used for the BSE model. Applying this method to the sample of group A and group B yielded t = 0.73 for group A and t = 0.74 for group B.
The method of visualization
The probability of building coverage for each point on every floor level can be used to predict the potential urban environment before the development. In particular, it is important to know office building shapes, because office supply is promoted and many offices will be developed in Tokyo’s central zones. Moreover, many researchers are interested in office shape (Grierson and Khajehpour, 2002; Kooijman, 2000; Ouarghi and Krarti, 2006; Shpuza and Peponis, 2008; Wang et al., 2006). Therefore, the estimation of the probability of building coverage for each point on each floor level needs to be visualized to obtain the spatial image.
The building existing probability is visualized as follows. First, hypothetical blocks (not actual blocks with a simple block shape) are set, and the building existing probability of the points on the block is visualized. Points are set every 1 m in a north–south direction and an east–west direction. Then, reference blocks are overlaid on a hypothetical block. Second, the building existing probability of each point is calculated by summing the building existing probability of the point overlaid by reference blocks, which is calculated based on the similarity between the reference blocks and the hypothetical block. The probability is expressed by brightness. In the white area, the probability is high. Conversely, in the black area, the probability is low.
Hypothetical blocks are set by changing their size, and the probability of building coverage for each point on every floor level is calculated. Hypothetical blocks are various sizes of squares. All sizes of hypothetical blocks estimated by the samples of group A and group B are visualized.
In addition to the visualization of building existing probability, the building area ratio (BAR) is calculated. The BAR is defined as the estimated area considering probability in each floor divided by block area. The result leads to a quantitative analysis of building shape. The BAR of the first floor is the same value as the BCR.
To analyze the situation of a building set back from the road, the estimated BAR is calculated in each buffer from the surrounding road of a block. The width of the buffer is from 2 m to 20 m, changing every 2 m.
Results
Block size and designated FAR
The number of blocks and average block area in each designated FAR zone.
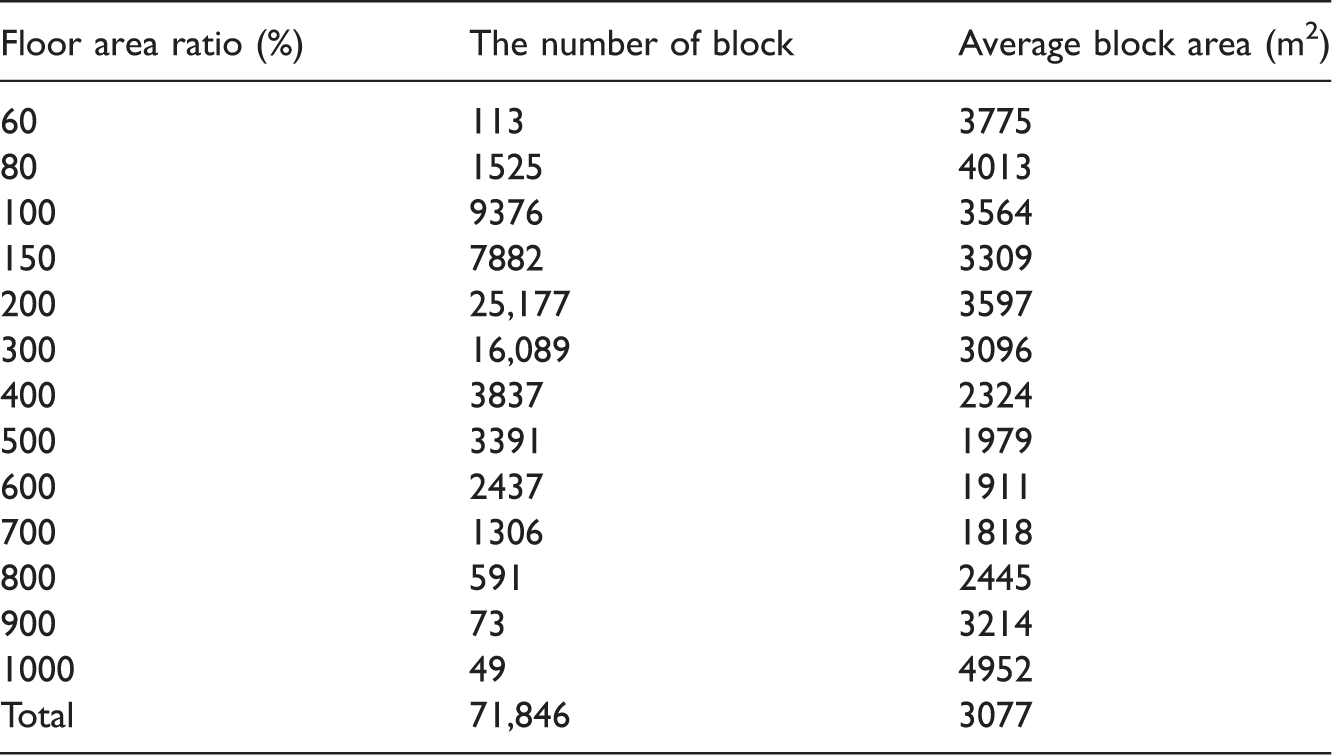
FAR: floor area ratio.
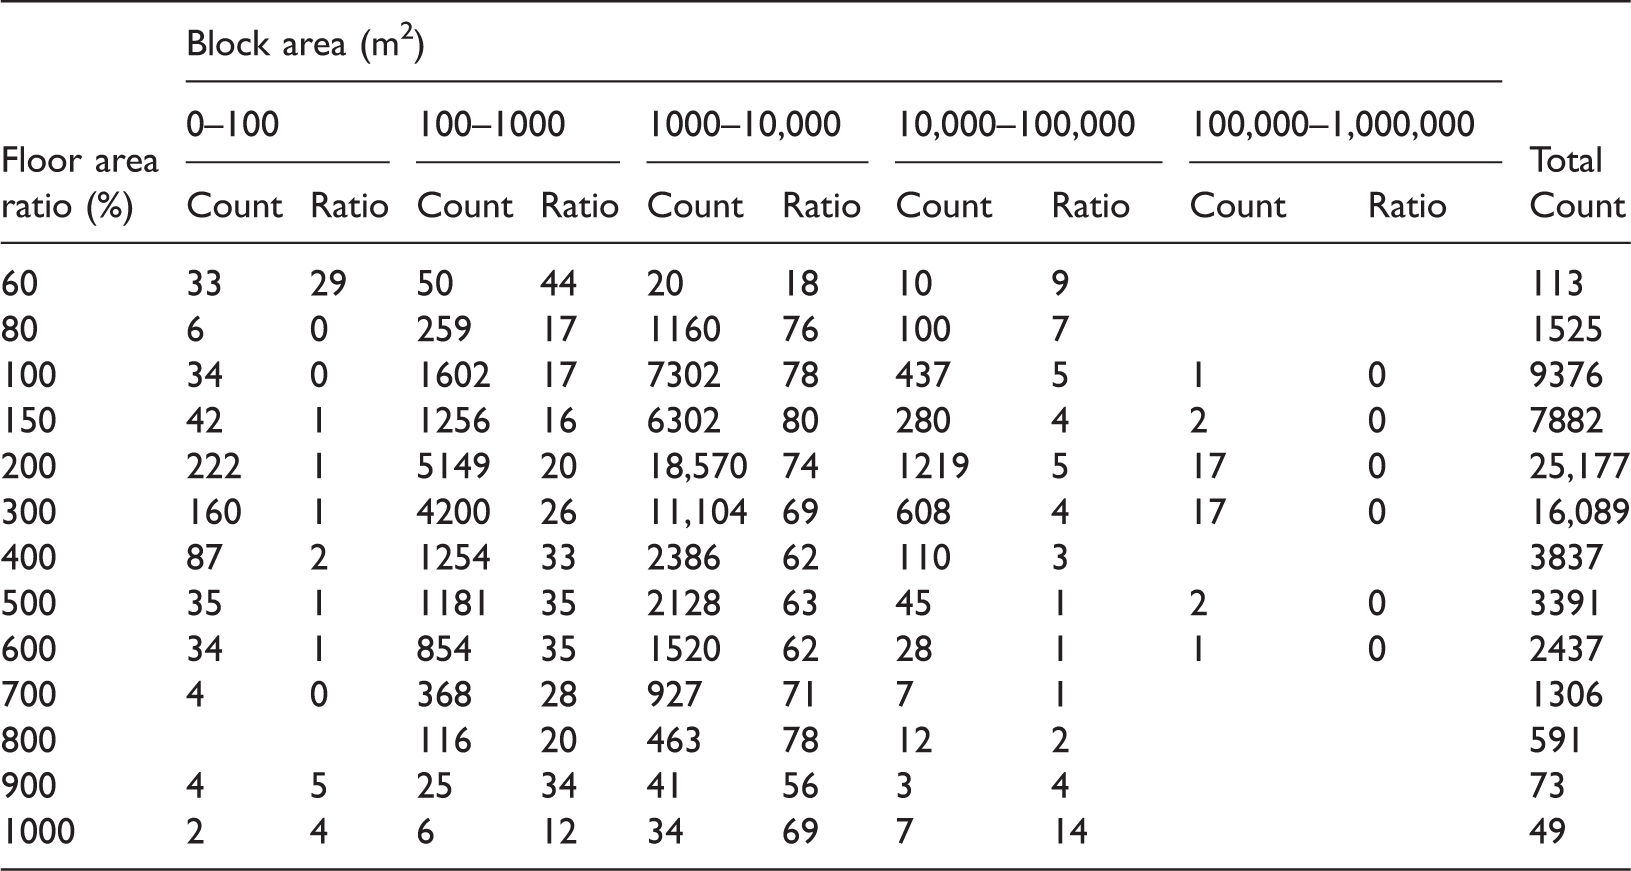
The number of blocks and the ratio (%) in each block area category.
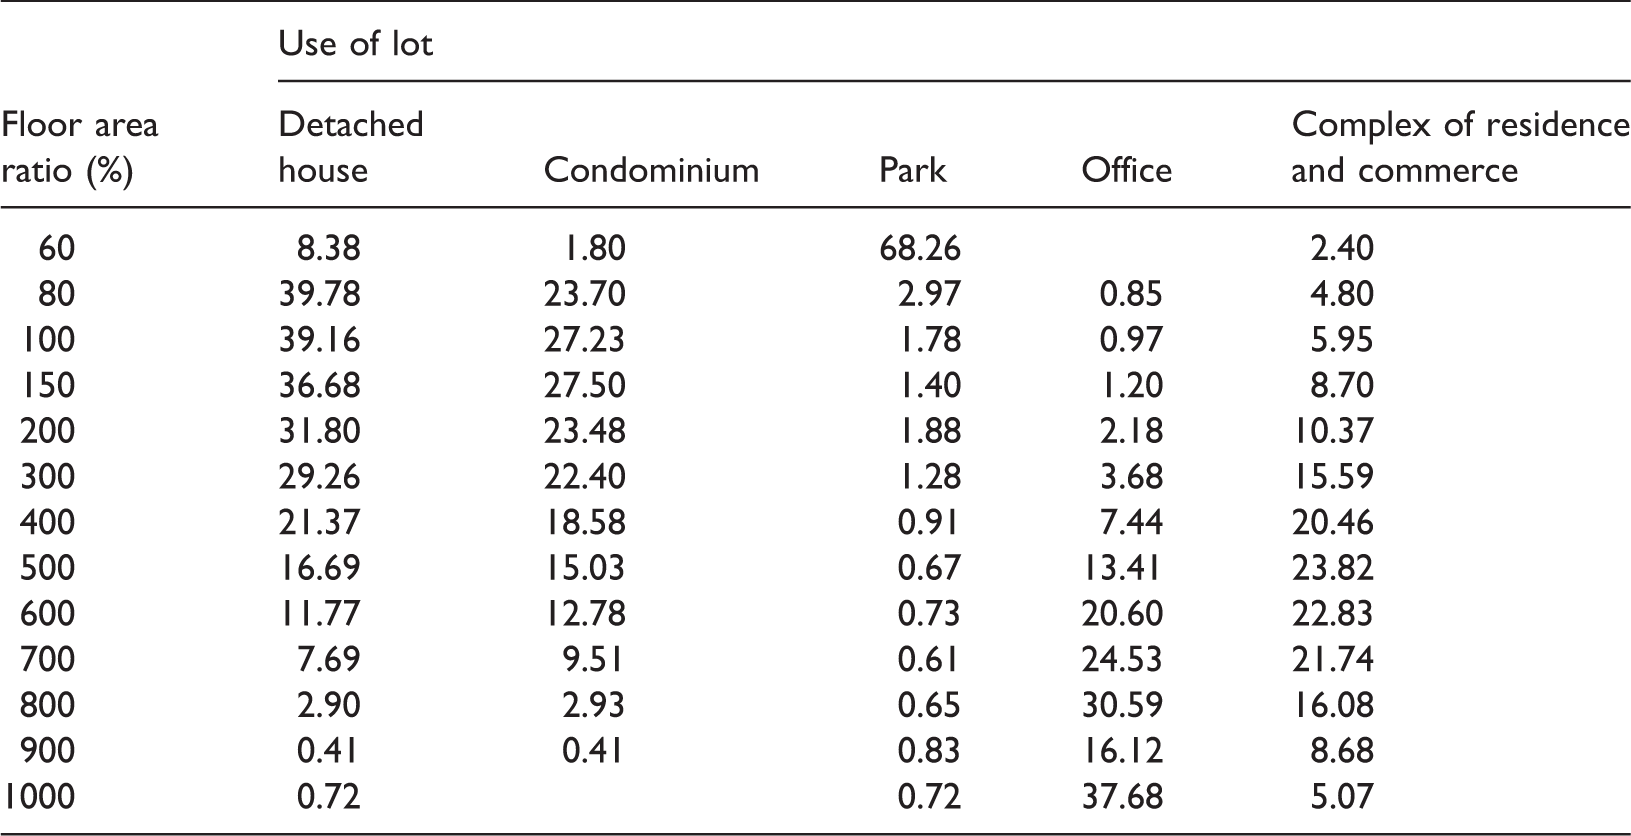
Ratio (%) of number of uses of lots in the blocks.
Block size and number of lots
The average number of lots in a block.

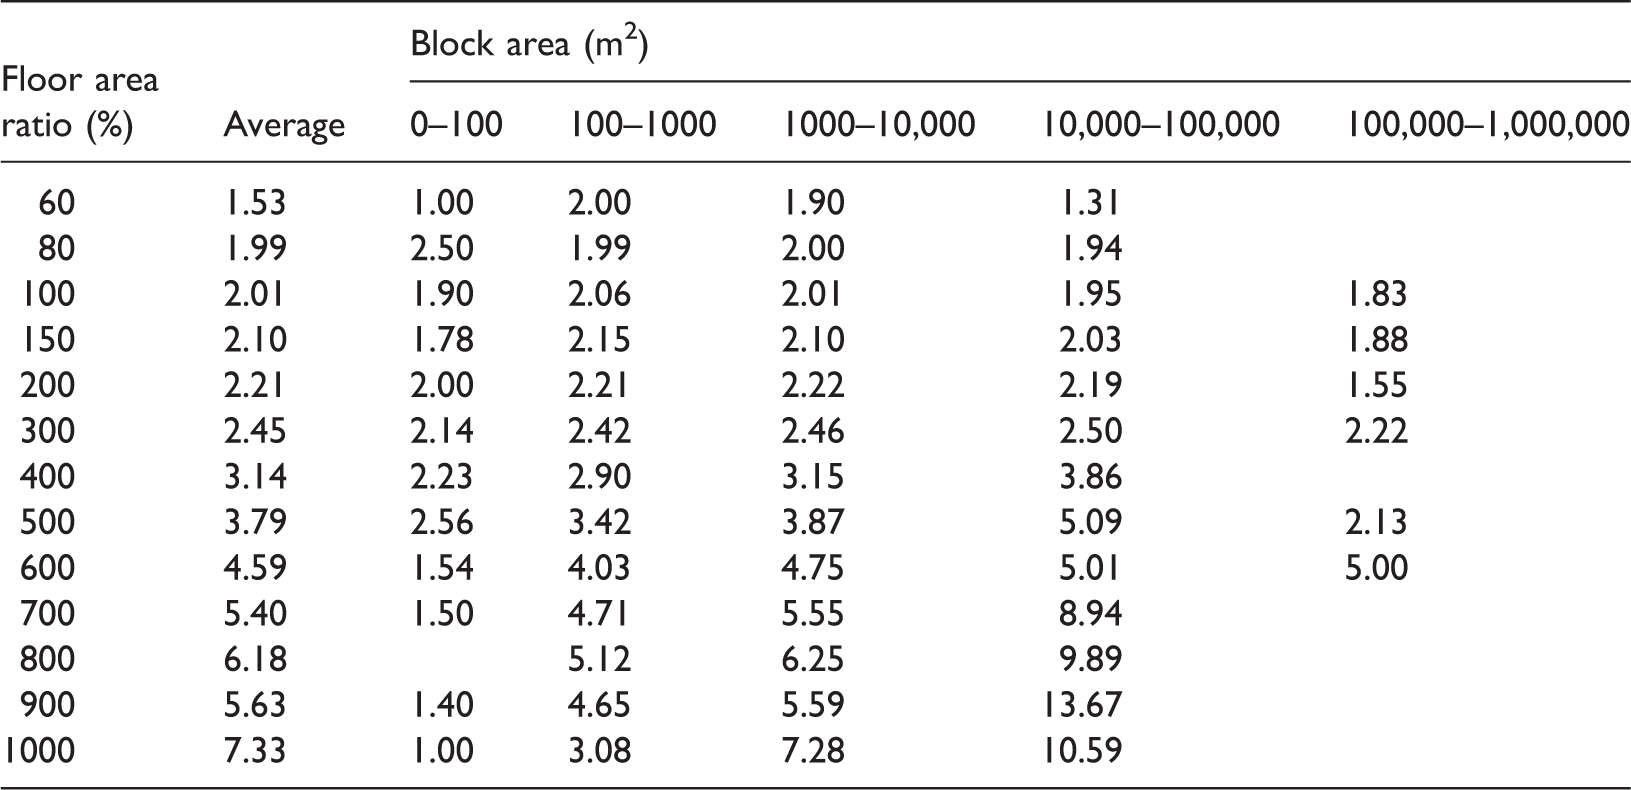
Block size and number of building floors
The average number of floors above ground in each block area category.
The average number of floors underground in each block area category.
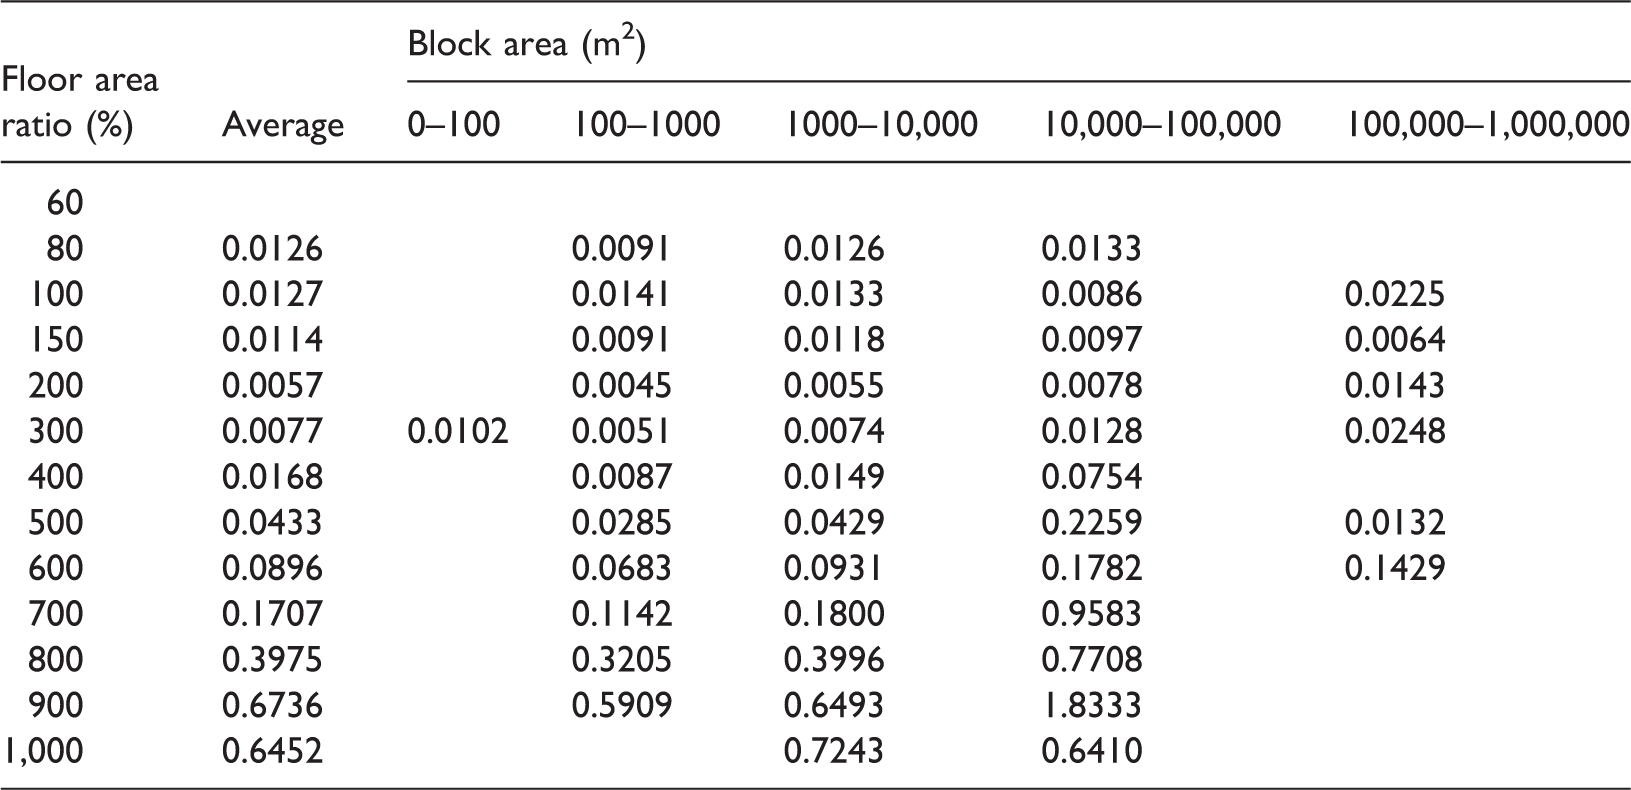
In addition, the relation of the number of floors above ground and those underground probably has a positive correlation. Using all of the samples of buildings (1,043,634 buildings), the Pearson product–moment correlation coefficient between the number of floors above ground and those underground is 0.2653 (p < 0.01). There is a strong positive correlation between them. This is because higher buildings need to develop the basement for the reinforcement of the foundation as well as the requirement of the service area, such as parking. It must be noted that people cannot possess a basement that is deeper than 40 m from the ground or 10 m from the foundation of the building in Tokyo because it is prevented by the Act on Special Measures Concerning Public Use of Deep Underground. The law regulates private use of a basement for the promotion of public use, such as lifeline utilities, and efficient construction.
Block size and volume sufficiency ratio (VSR)
The VSR measures the ratio of the total floor area to the maximum legally allowable floor area under the designated FAR regulation. The VSR is calculated as the whole building floor area divided by the maximum volume of the block. The maximum volume of the block is calculated as the block area multiplied by the designated FAR.
The range of the VSR should be from 0% to 100%. However, some results of the VSR are over 100%. This is partly due to the fact that buildings constructed before the legislation of FAR regulation was introduced are regarded as legally allowable, particularly in small blocks, even if the floor area of the building exceeds the current allowable floor area. Moreover, the application of some special measures relaxing the designated FAR can be pointed out. Particularly in large blocks, the measures are often applied to promote development.
VSR (%) in each block area category.
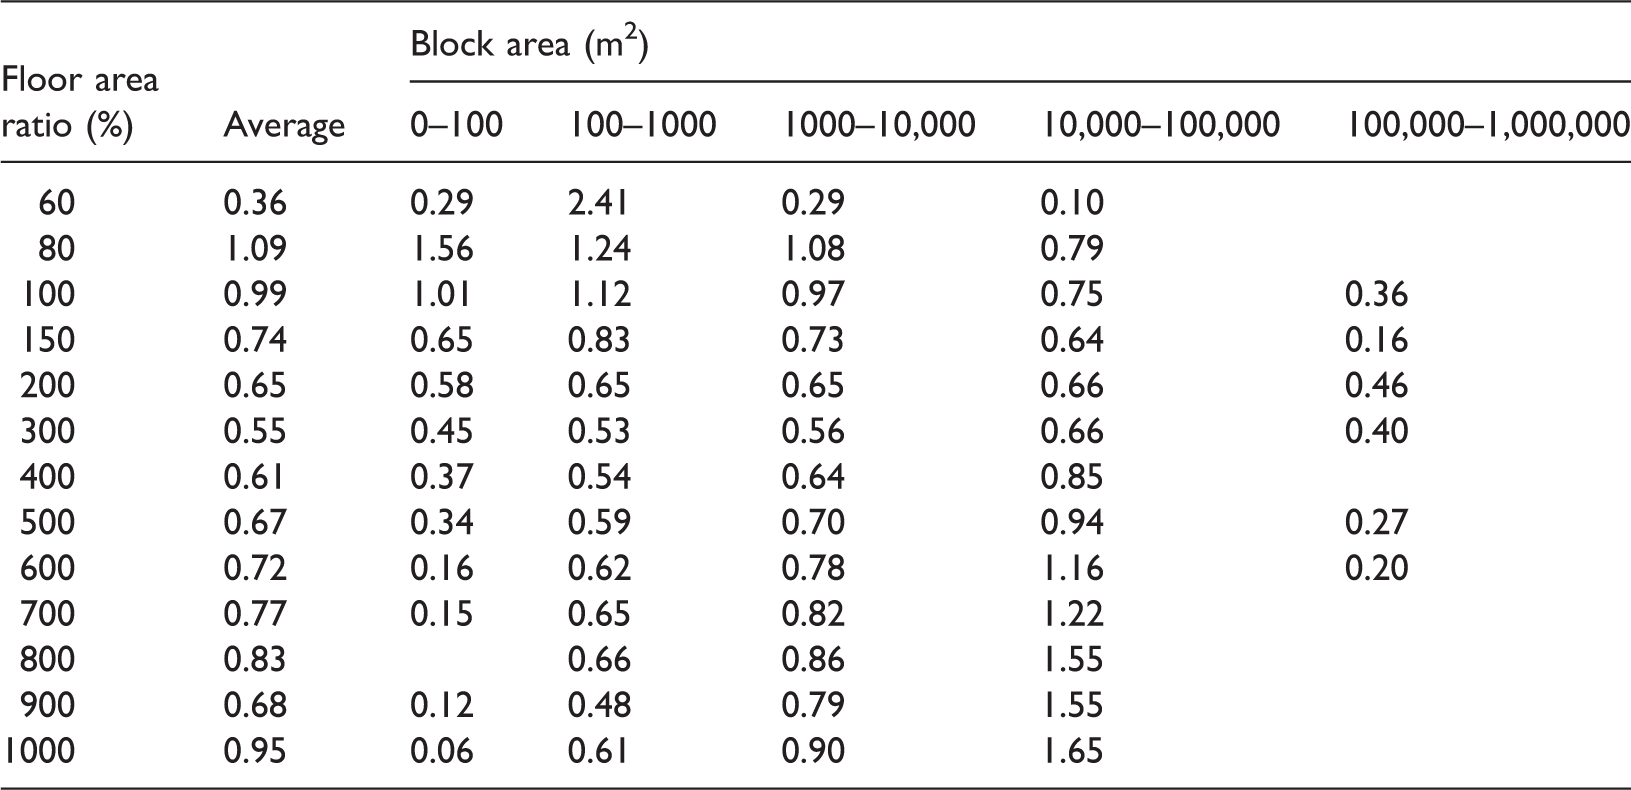
VSR: volume sufficiency ratio.
Estimation of office shape
The building existing probability on the estimated hypothetical blocks is visualized in Figures 1 and 2. From these figures, the image of the building location can be grasped.
Visualization of building existing probability in 600% designated FAR zones. Visualization of building existing probability in 700% designated FAR zones.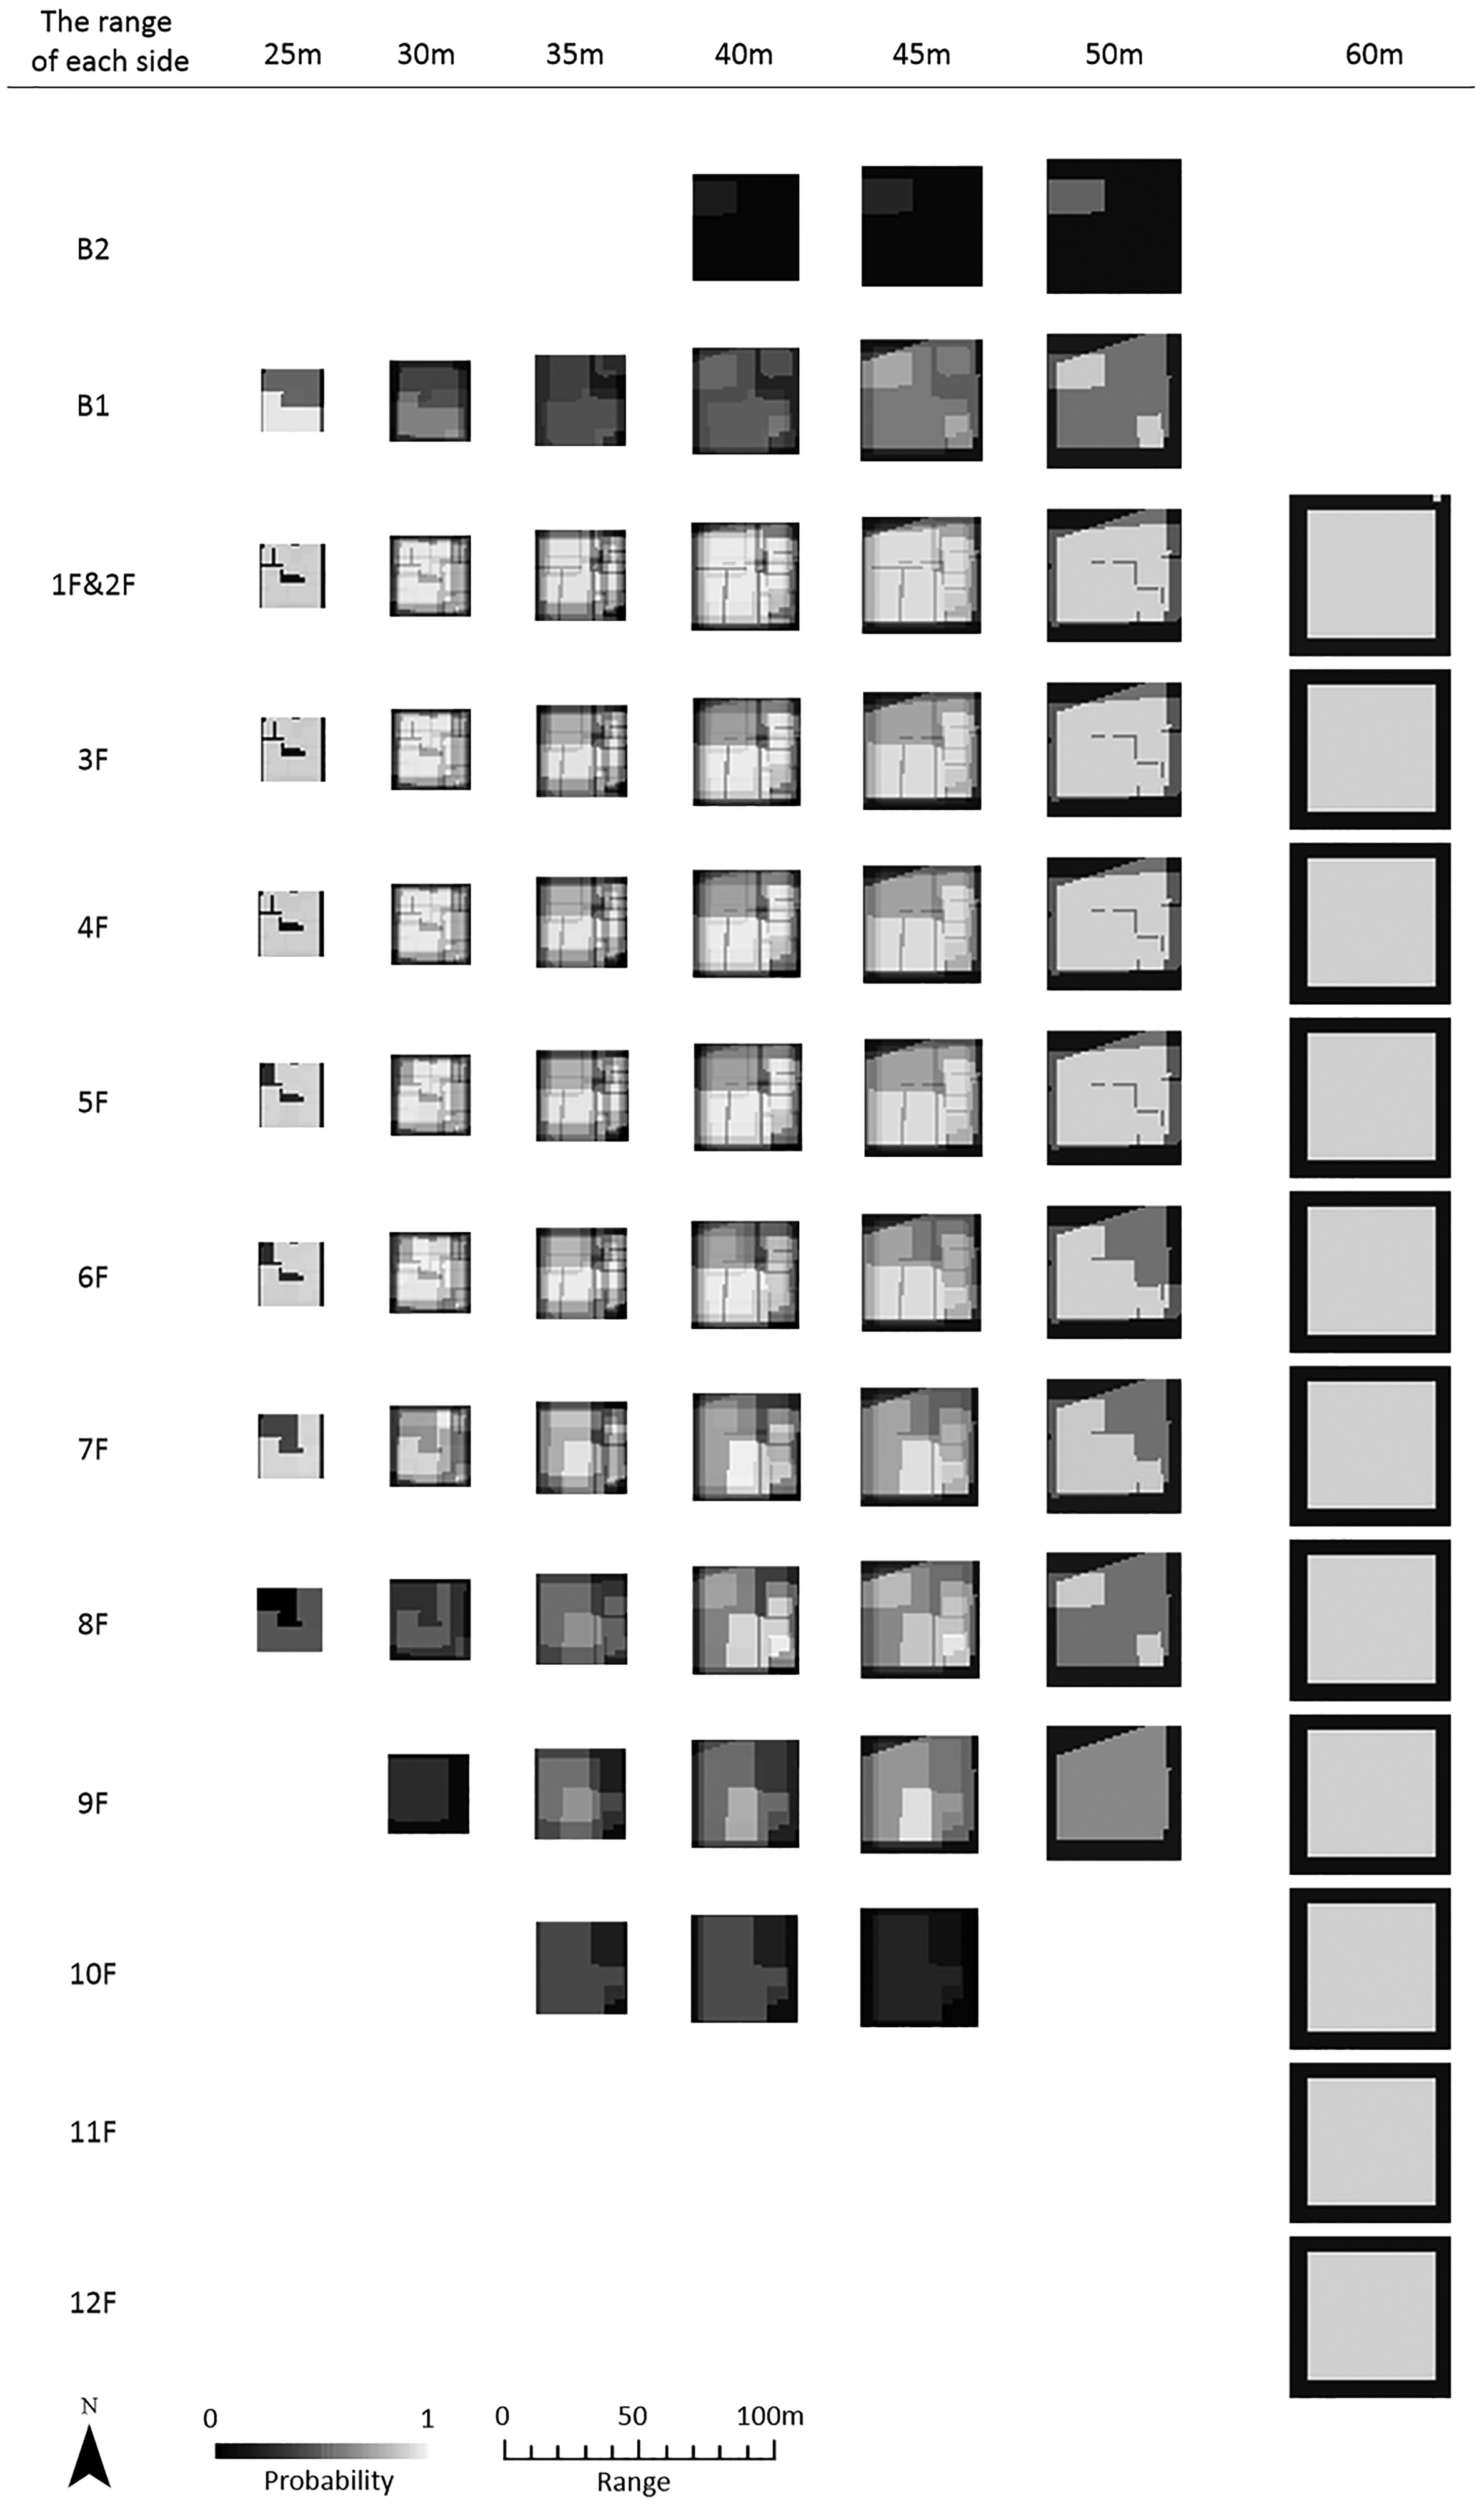
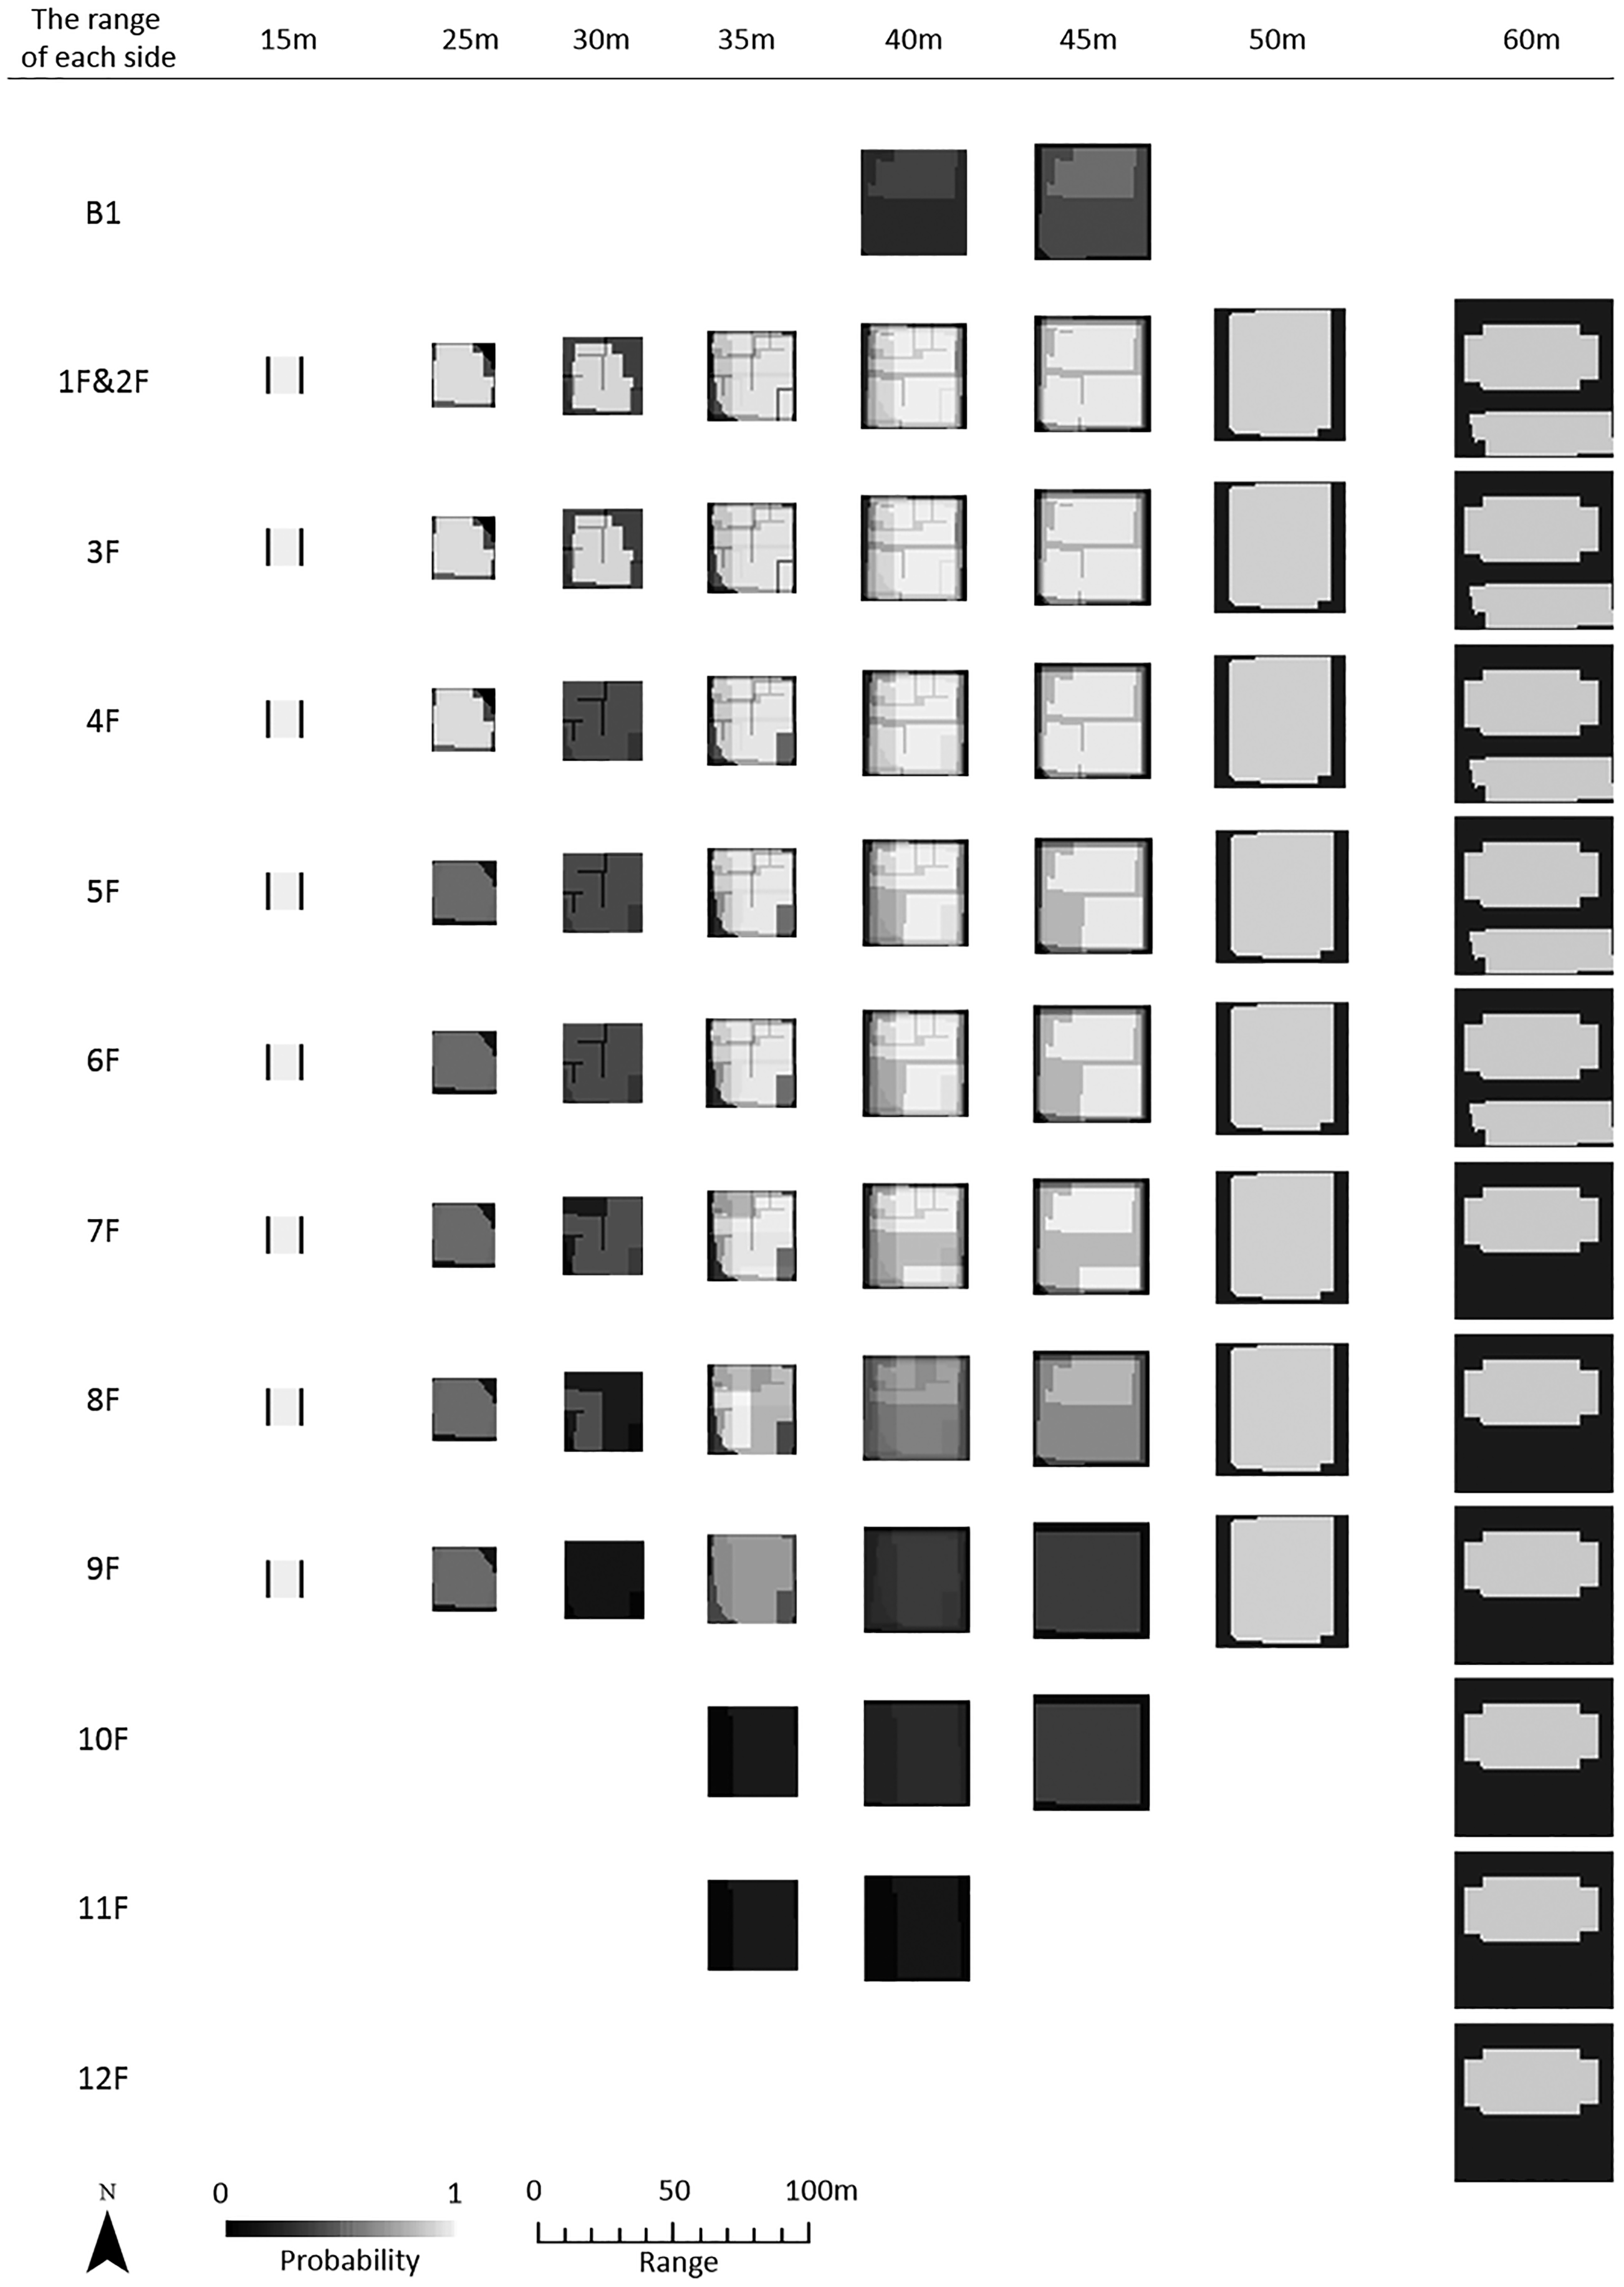
According to Figures 1 and 2, on the upper floors, the estimated BAR is higher in large blocks. In group A, the estimated BAR is almost the same under the seventh floor in all blocks, but for the eighth floor, in the smaller blocks, the range of each side is 25 m and 30 m; the estimated building ratio decreases rapidly compared with the seventh floor (25 m: 78.81% to 32.92%; 30 m: 61.07% to 23.10%). On the other hand, for the larger blocks, the range of each side is 40–60 m, and the estimated BAR does not decrease much. In group B, similar tendencies can be seen. In the smaller block, the range of each side is 25 m, and the estimated BAR decreases rapidly from the fourth floor to the fifth floor as 79.04% to 35.88%. In addition, similarly to the smaller block, the range of each side is 30 m, and the estimated BAR decreases rapidly from the third floor to the fourth floor as 67.23% to 33.67%. In the larger blocks, the range of each side is 40–60 m, and the estimated BAR does not decrease in such lower floors. These results show that the efficiency of using upper floors is high in large blocks. In small blocks, the efficiency of using upper floors is low. If higher buildings and efficient use of upper floors are desired, the blocks should be larger by restructuring.
According to the analysis of the BAR in the buffer area, the larger the blocks, the farther the buildings are set back from the roads. The estimated BAR in the buffer area decreases gradually from the small block to the large block. For example, in Figure 1, when the width of the buffer from the roads is 6 m, the BAR is 82.79% in the block of the range of each side is 25 m, and is 40.55% in the block of the range is 30 m. The BAR increases as the block becomes large, and the value is 15.59% in the block of the range is 50 m, and is 1.29% in the block of the range is 60 m. Similar tendencies can be observed in Figure 2. This is probably because high buildings can be built in the large blocks and do not need to be built near roads. If a city is composed of large blocks, it becomes spacious because much open space exists around buildings. Conversely, if a city is composed of small blocks, it is dense and narrow. In the city, buildings cannot be set back from roads, and open spaces tend not to be created.
Conclusion
In this study, the relation between block size and building shape is analyzed quantitatively. In addition, blocks used for offices are chosen, and the building shape is estimated by a developed BSE model.
Results show that the number of floors above the ground and underground of the higher designated FAR blocks increases as the block becomes larger. On the other hand, the floors do not increase in low designated FAR blocks as the block becomes large. Moreover, there is a strong positive correlation between the number of floors above ground and those underground.
The VSR increases gradually as the block becomes large, excepting blocks of a low designated FAR. However, in blocks that are too large—more than 100,000 m2—the VSR is low. In the low designated FAR block, the VSR decreases as the block becomes larger.
On the upper floors, the estimated BAR is higher in large blocks. Moreover, the larger the blocks, the farther the buildings are set back from the roads. Therefore, the significance of enlarging blocks throughout the block restructuring can be discussed by these results. In large blocks, high buildings can be built, and the volume in the block can be used efficiently. In addition, in the area composed of large blocks, many open spaces will be created because the buildings are set back from the surrounding roads. It is possible that large blocks create a spacious city. But it is necessary to designate high FAR of more than 600% on the blocks.
The average block area is large in low designated FAR zones and high designated FAR zones. Accordingly, high designated FAR may lead to enlarging blocks by promoting block restructuring. By high designated FAR, the blocks are less likely to be split by lots, even in large blocks. The BSE model, which estimates the building shape and location, was developed. The estimated results are shown as targeting offices. This technique can be applied to other buildings and cities.
If software to estimate building shape by block shape and other conditions was developed, it would be useful for determining urban planning, as well as population estimation and land-use estimation. In the future, it is possible to estimate the urban image by using this method, particularly in the city, where development and urban restructuring are active. By the estimation, planners can understand the building shapes and locations of the future and use the results for planning, and citizens can easily understand the future image of the block. They can judge whether the urban renewal plan is better. In addition, the estimation of building location and shape can be applied to many fields. Many studies have been conducted related to the building location and shape, the relation between the building shape and energy efficiency of office buildings (AlAnzi et al., 2009), the energy consumption and buildings (Ko and Radke, 2014; Mortimer et al., 2000; O’Brien et al., 2010; Ourghi et al., 2007; Rode et al., 2014), and the wind-induced response of buildings in a block (Kuang et al., 2011; Kwok, 1988; Merrick and Bitsuamlak, 2009). Combined with this knowledge, it is possible that the estimation of wind, energy efficiency, and consumption can be done using the estimation of buildings.
Limitations and future research
In this research, we aimed to examine the relation between block size and building shape, and we showed the method to estimate building shape from block size (BSE model). We tried to enhance the model’s accuracy by limiting blocks that are in similar situations as follows: designated FAR is 600% and 700%, land-use zoning is commercial zone, and building type is office. However, it is unclear how this model is influenced by each factor (designated FAR, land-use zoning, and building types) and what the most important factor for accurate estimation is. Moreover, we did not consider other factors (e.g. energy consumption, construction cost, width of roads adjacent to blocks) that may impact the building shape. For example, average construction cost per square meter varies for certain height ranges, and the developer decides the building shape within the regulations. For the examination of verification and improvement of the model, we desire to use more samples and apply the model to other regions, including other countries.
Footnotes
Acknowledgements
The urban planning GIS data set of Tokyo (March 2013) was provided by the Tokyo Metropolitan Government. Part of this article is based on the Proceedings of the 17th International Symposium on Spatial Data Handling (Taima et al., 2016a). We are thankful for the valuable comments from attendees of the symposium. In addition, we would like to thank the two referees for their useful comments.
Declaration of conflicting interests
The author(s) declared no potential conflicts of interest with respect to the research, authorship, and/or publication of this article.
Funding
The author(s) disclosed receipt of the following financial support for the research, authorship, and/or publication of this article: This work was partly supported by JSPS KAKENHI Grant Numbers JP 26590036, JP16H01830.
References
Supplementary Material
Please find the following supplemental material available below.
For Open Access articles published under a Creative Commons License, all supplemental material carries the same license as the article it is associated with.
For non-Open Access articles published, all supplemental material carries a non-exclusive license, and permission requests for re-use of supplemental material or any part of supplemental material shall be sent directly to the copyright owner as specified in the copyright notice associated with the article.