




Abstract
There is a lack of understanding of how certain characteristics of the urban environment influence an individual’s spatial cognition and familiarity with surrounding areas, and, subsequently, their travel behaviours and how these change over time. This paper aims to address this research gap in exploring the dynamics of individuals’ spatial cognitions by observing the changes of respondents’ familiar areas over time, and investigating the possible determinants that constitute respondents’ familiar areas. Panel data, containing two-week travel diaries and maps of familiar areas, were collected in four different waves over a seven-month period for 55 individuals in Stockholm, Sweden. The reported familiar areas for each individual were digitised into quantifiable variable form and further analysed by applying dynamic binary probit and linear regression models. The results show that, while familiar area is largely influenced by one’s previous knowledge of the area, it is also continuously corrected by events in between. Different land use characteristics have different impacts on different social groups’ travel patterns, thus contributing to the variability in the size of one’s familiar areas.
Introduction
Transportation planning around the world has been shifted from capacity expansion to the formulation of transportation policies that can manage travel demand efficiently. This, in turn, has increased the necessity of understanding travel behaviour and decision-making processes (e.g. Jones and Clarke, 1988; Steg and Gifford, 2005). The conventional transport demand models assume that all travellers of the same socio-economic characteristics engage in very similar travel behaviour. This approach has been criticised for disregarding the heterogeneity issues that affect people’s decision-making and choice processes with regards to travel (Horeni, 2012; Kitamura, 1990; Kitamura et al., 1997; Pendyala and Pas, 2000; Schlich and Axhausen, 2003; Stead, 2001; Susilo et al., 2012; Yin and Muller, 2007). Due to these reasons, therefore, awareness of the need for understanding people’s travel behaviour on a disaggregated level has increased over the past 40 years. Consequently, different theories have been developed in behavioural science to explain individual choice behaviour for transport planning, leading to the development of different data types (e.g. panel data) and data-collection approaches (e.g. trip-based, activity-based), and modelling approaches (e.g. mixed logit models, latent class models, hybrid choice models). For example, Johnson-Laird (1983) has developed mental model theory and argued that people apprehend the real world by building inner mental replicas of the relations among objects and events that concern them. Moreover, he introduced the concept of mental representations (MR), which are a temporary result of individual perceptions being stored in working memory for the moment of consideration. The development of MR depends on an individual’s experience and the long-term knowledge from which relevant information is retrieved, reordered, or translated into other forms (Cox, 1999). Therefore, MR are crucial in decision-making processes, particularly with regards to travel, and several studies have been conducted to investigate streams of travel behaviour, in order to understand how individuals face complex decision problems before they make a choice (e.g. Arentze et al., 2008, 2013, 2014; Dellaert et al., 2008, 2013, 2017; Horeni, 2012). One of the important elements of MR that is often mentioned, but which tends to be ignored in qualitative modelling processes, is individual’s abstract knowledge of their spatial environment, often known as a cognitive map or a mental map.
To date, the question of how individuals’ mental maps and familiar areas affect their decision-making and choice processes with regards to travel, remains unanswered (Minaei, 2014; Mondschein et al., 2010). It has been suggested that individuals have different space-time environments, given different sets of constraints on satisfying their needs and organising their activities, resulting in different experiences in relation to their environment. Therefore, they have different levels of familiarity with and understanding of their environment, the transportation system, and the institutional context (Horeni, 2012; León et al., 2009). Arguably, this spatial cognition and familiarity, in turn, influences a range of behaviours in the future, such as shaping individuals travel behaviour and travel patterns (Lynch, 1960). However, by travelling, individuals learn about the environment and add this new environmental information into their mental maps (Weston and Handy, 2004), thereby contributing to changes in their existing spatial cognition and familiarities. Thus, the relationships between an individual’s spatial cognition and spatial familiarities, on the one hand, and their activity-travel patterns, on the other, are two-fold. Before the mutual effects are investigated and understood, first, it is important to understand how different individuals portray different spatial cognition and familiarities. Then, in a longitudinal context, it is important to understand how their spatial cognition and familiarities change over time, as well as determining the factors affecting the changes of individuals’ spatial familiarities. Understanding these would provide further insight about the relationships between individuals’ spatial cognition, and their travel choices with regards to route, destination, and mode of transport (Golledge and Garling, 2002; Hannes et al., 2008; Mondschein et al., 2006; Susilo and Dijst, 2009, 2010). Thus, from city planning perspective, this insight can be used to build an urban environment with a suitable transport structure and adequate environmental signals that can provide people with a clearer vision of the city and a greater capacity to navigate smoothly through it (Jackson and Kitchin, 1998; Minaei, 2014). From modelling perspectives, the inclusion of individuals’ familiar areas will help to improve accuracy of travel demand models by delineating individuals’ alternatives and destination choice sets that play a role in their travel decision-making processes (Chorus and Timmermans, 2010; Hannes et al., 2010; Janssens et al., 2003), thus minimising the heterogeneity issue in the models.To contribute to this particular research gap, this paper aims to investigate the factors that may influence individuals’ familiarity with areas, and also to explore how individuals’ familiar areas change over time, using four waves of two-week observations (eight weeks of panel data, in total). To the authors’ knowledge, no previous studies have analysed individuals’ familiar areas and the nature of changes to these, presumably due to the limitation in panel data availability. Thus, this is the main contribution offered by this study.
In the next section, a brief literature review on individual mental maps is provided and is followed by a section that describes the data collection and methodologies used in this study. The estimation results from the dynamic probit and regression models are then discussed. The paper concludes with a section that summarises and discusses the findings.
What do we know about individuals’ spatial cognition and spatial familiarities?
The term ‘cognitive map’ was introduced by Tolman (1948), based on his famous rat and maze experiments, leading to more research done on wayfinding and navigation. Then, in the 1960s, a geographer, Lynch (1960), introduced the five elements of a city’s image: routes (roads, paths), edges (vertical surface limitations), district (quarters), nodes, and landmarks. These five elements together shape ‘the image of the city’ in people’s minds. Lynch believed that people have discrete images of their environment and that this helps them with way-finding and navigation. This, in turn, influences a range of their behaviours in the future such as shaping their activity-travel patterns. Since then, various studies in various scientific fields have been conducted to explore people’s mental images of the environment, thus producing different conceptions of cognitive maps (e.g. Downs and Stea, 1973; Golledge and Stimpson, 1997; Hart and Moore, 1973; Kaplan, 1973; Moore and Golledge, 1976). The terms cognitive map or mental map, as used in this paper, are adopted from Downs and Stea (1973), in which they define cognitive maps as processes formed by a series of psychological changes, in which people can obtain, code, save, recollect, and decode information about their living environment. These cognitive maps depend on an individual’s perception of the world, and, therefore, display significant personal differences (Stea and Downs, 1977). An individual interprets this spatial cognition in their own way, based on personal perception, to enable decision making in a spatial context (Montello, 2001; Suttles, 1972). In much of the literature, the term mental map is used, since it is more common in the discipline of geography (Schenk, 2013). A mental map includes spatial information about the environment, such as place and route identity, location, distance, direction, person-to-object, and object-to-object relationships (Downs and Stea, 1977; Golledge and Stimson, 1997). Allen (1999) has argued that one of the means of wayfinding on travel to familiar destinations is through reference to a mental map. Zhang et al. (2016) have found that an individual’s activity space is partially or completely located within his or her familiar areas, and that they are strongly correlated with each other. Thus, in this particular study, an individual’s mental map is captured by the degree of spatial familiarity, and it is defined as familiar areas. It is also hypothesised that the more an individual is familiar with particular areas, the more likely it is for the areas to be included in their mental map.
To date, a few studies have been conducted investigating factors that influence individuals’ mental maps, using cross-sectional datasets or data taken at a single point in time. Among these few studies, it was found that specific modes of transport, especially active modes of transport, affect learning and the refinement of individuals’ mental maps (Chorus and Timmermans, 2010; Mondschein et al., 2006, 2009). In contrast, Minaei (2014) found that there is no relationship between particular modes of transport and the completeness (or refinement) of individuals’ mental maps, except for car drivers, who remembered more roads than users of other modes of transport. In studies on children’ mental maps, Fang and Lin (2016) found that active and non-motorised modes of transport (e.g. walk and cycle) have a positive influence on children’s spatial cognition when considering their school trips. Aside from modes of transport, it was also found that gender affect individuals’ mental maps, focusing on mental map construction via route learning. However, similar to the effects of modes of transport on individuals’ mental maps, no consistent findings are to be found. For example, Galea and Kimura (1993) and Minaei (2014) found that females are better at route learning than males, but not necessarily at landmark memorising. Meanwhile, Chorus and Timmermans (2010) have found no relationship between gender and the quality of mental map constructions. Several recent studies also found that the mental maps of Global Positioning System (GPS) users and non-GPS users are different. They found that GPS users have problems shaping spatial cognitive knowledge of their environment, thus affecting their mental maps (Krüger et al., 2004; Minaei, 2014; Münzer et al., 2006).
From the dynamics perspective, Arentze and Timmermans (2005) have incorporated a Bayesian learning process into a modelling framework to analyse the dynamics of individuals’ mental maps. They came up with the predicted beliefs of individuals’ mental maps after simulating several of individuals’ leisure activities. They concluded that the locations with high predicted beliefs could be useful for future prediction models of mental maps. Portugali (2004) used an urban simulation model to mimic agents’ cognitive processes in the production of representations of novel cities. The result shows that: (1) some of the agents make location decisions based on their mental maps accumulated from their past experiences and (2) their specific (personal) mental maps evolve over time. Both studies used synthetic agents and simulations to investigate the development of people’s mental maps over time. To the authors’ knowledge, no studies have analysed the changes in individuals’ mental maps/familiar areas using longitudinal panel data, as in this study.
In terms of techniques for obtaining mental maps, most studies used a sketch map to access an individual’s mental map (e.g. Ceccato and Snickars, 2000; Curtis et al., 2014; Fang and Lin, 2016; Halseth and Doddridge, 2000; Kohm, 2009; Ramadier and Bronner, 2006). With the help of sketch maps, researchers are able to investigate the changing content of spatial representation in individual’s mental map, as well as the spatial relationships between objects. Besides, a sketch map is favourable to both interviewers and interviewees because: (1) it is easy to organise without any complicated equipment, (2) it is easy to explain to the respondents regarding the survey procedure, and (3) it is less sensitive to intra-personal variability if appropriate guidance is given (Ramadier and Bronner, 2006). However, studies done by Halseth and Doddridge (2000) and Fang and Lin (2016) have found that sketch maps using explorative and descriptive approaches without standardisation or formalisation, lead to difficulties in digitising individuals’ mental maps (e.g. spending a long time on recognising different representations of mental maps by different individuals). For this reason, Ramadier and Bronner (2006) tried to improve the traditional sketch maps by using a special spatial reconstruction set approach (Jeu de reconstruction spatiale, JRS), which enables the user to model space with standardised items in order to decrease the variability between different social groups’ spatial expression. They found that the JRS is more stable than traditional sketch maps, as well as being preferred by respondents. However, the disadvantages of JRS are: (1) it is more suggestive than the sketch map, but only for the elements that are rarely represented (e.g. railway tracks, green spaces, and unremarkable buildings); (2) it seems to limit the expression of urban items, such as statues, fountains, and bus stops, but it affects only a minority of urban elements in the spatial representation. Therefore, in this study, a new approach for collecting mental map data in a more systematic way is introduced, aiming to capture how different people come up with different mental maps, and this is one of the main contributions of the study.
In terms of methodology in analysing mental maps, little has been done to incorporate transport models with mental maps using Geographical Information System (GIS) applications. A study by Curtis et al. (2014) has integrated sketch maps with GIS applications to illuminate the relationship between individual perceptions and space. They analysed the ‘heat map’ of youth-fear spaces in Los Angeles gang neighbourhoods using a kernel density approach and identified the fear hot spots. Jorgensen and Stedman (2011) only focused on three spatial features in people’s attachment areas in the model, and they have suggested using accurate GIS data for further study. Thus, in this study, the GIS application was implemented in analysing individuals’ mental maps data.
Based on the brief literature review above, several research gaps have been identified and this study aims to answer the following three research questions. First, how do different social groups come up with different mental maps (that, in this study, are captured by the degree of spatial familiarity)? Second, how does an individual’s mental map change over time? Third, what factors are likely to influence the dynamics of an individual’s mental map over time? Answering these questions is crucial, since differences among individuals’ mental maps have important implications for accessibility, transportation planning, and public policy. Sparse and inaccurate awareness of opportunities would be likely to reduce the effectiveness and efficiency of an activity location in relation its surroundings (Mondschein et al., 2010).
In this paper, individuals’ mental maps were obtained as part of a survey of respondents’ spatial knowledge of their familiar areas. The respondents drew their mental maps on top of a specified map of Stockholm within a given boundary (around 198 km2), following specific guidelines. Then, the maps were digitised and transformed into a readable format (e.g. a raster layer), before being exported into ASCII code to build a readable dataset, using ArcGIS software for further analysis and modelling purposes. A dynamic binary probit model with spatial autocorrelation was applied, in order to investigate the determinants that may influence an individual’s familiar area over time. Then, the relationship between individuals’ socio-demographic characteristics, travel characteristics, land use characteristics, and the size of familiar areas are explored through an ordinary least squares model. These aspects are the original contributions of this study.
Data and respondent group characteristics
In order to achieve the research objective, panel data from two-week travel diaries and familiar areas of 55 individuals in Stockholm, Sweden, were used. The focus study areas were in Solna, Sundbyberg, and Alvik: sub-urban areas where the extension of a tram line was introduced on 28 October 2013. The panel survey consists of four waves, which cover all four seasons. Waves 2, 3, and 4 were conducted approximately one month, four months, and seven months, respectively, after the introduction of the tram extension. The reason for collecting data on individuals’ familiar areas is to observe the possible changes in individuals’ familiar areas and their travel behaviour over a seven-month period, as well as how the introduction of a tram extension line contributes to these changes.
The panel survey consists of three instruments: (1) a two-week travel diary, (2) a set of psychological-related questions via an online survey, and (3) a set of mental-map-related questions. The two-week travel diary is a self-reported travel diary, with a pen and pencil approach, that was mailed to each respondent together with a pre-stamped reply envelope. The travel diary consists of the information on origin and destination details; mode of transport choice; trip purpose; departure and arrival time; estimated travel time; estimated travel distance; travel companion details; travel expenses, including costs for parking; types of season ticket used; and long journey details. The psychological-related questions, part of the online survey, captured respondents’ beliefs and opinions about the tram extension line service. However, these psychological questions are neither identical nor unique in each wave, and not related to the purpose of this study. Therefore, the responses to them will not be discussed in this paper. More detailed information about the dataset, including the psychological-related questions, can be seen at Ahmad Termida et al. (2016). In the mental-map-related questions, the respondents received a specified central Stockholm map, in which they were asked to draw polygons that indicate their familiar areas. The boundary of the geographic areas given in the specified map was fixed and pre-defined (see Figure 1, where the highlighted line is the tram extension line).
The location of the tram extension line.
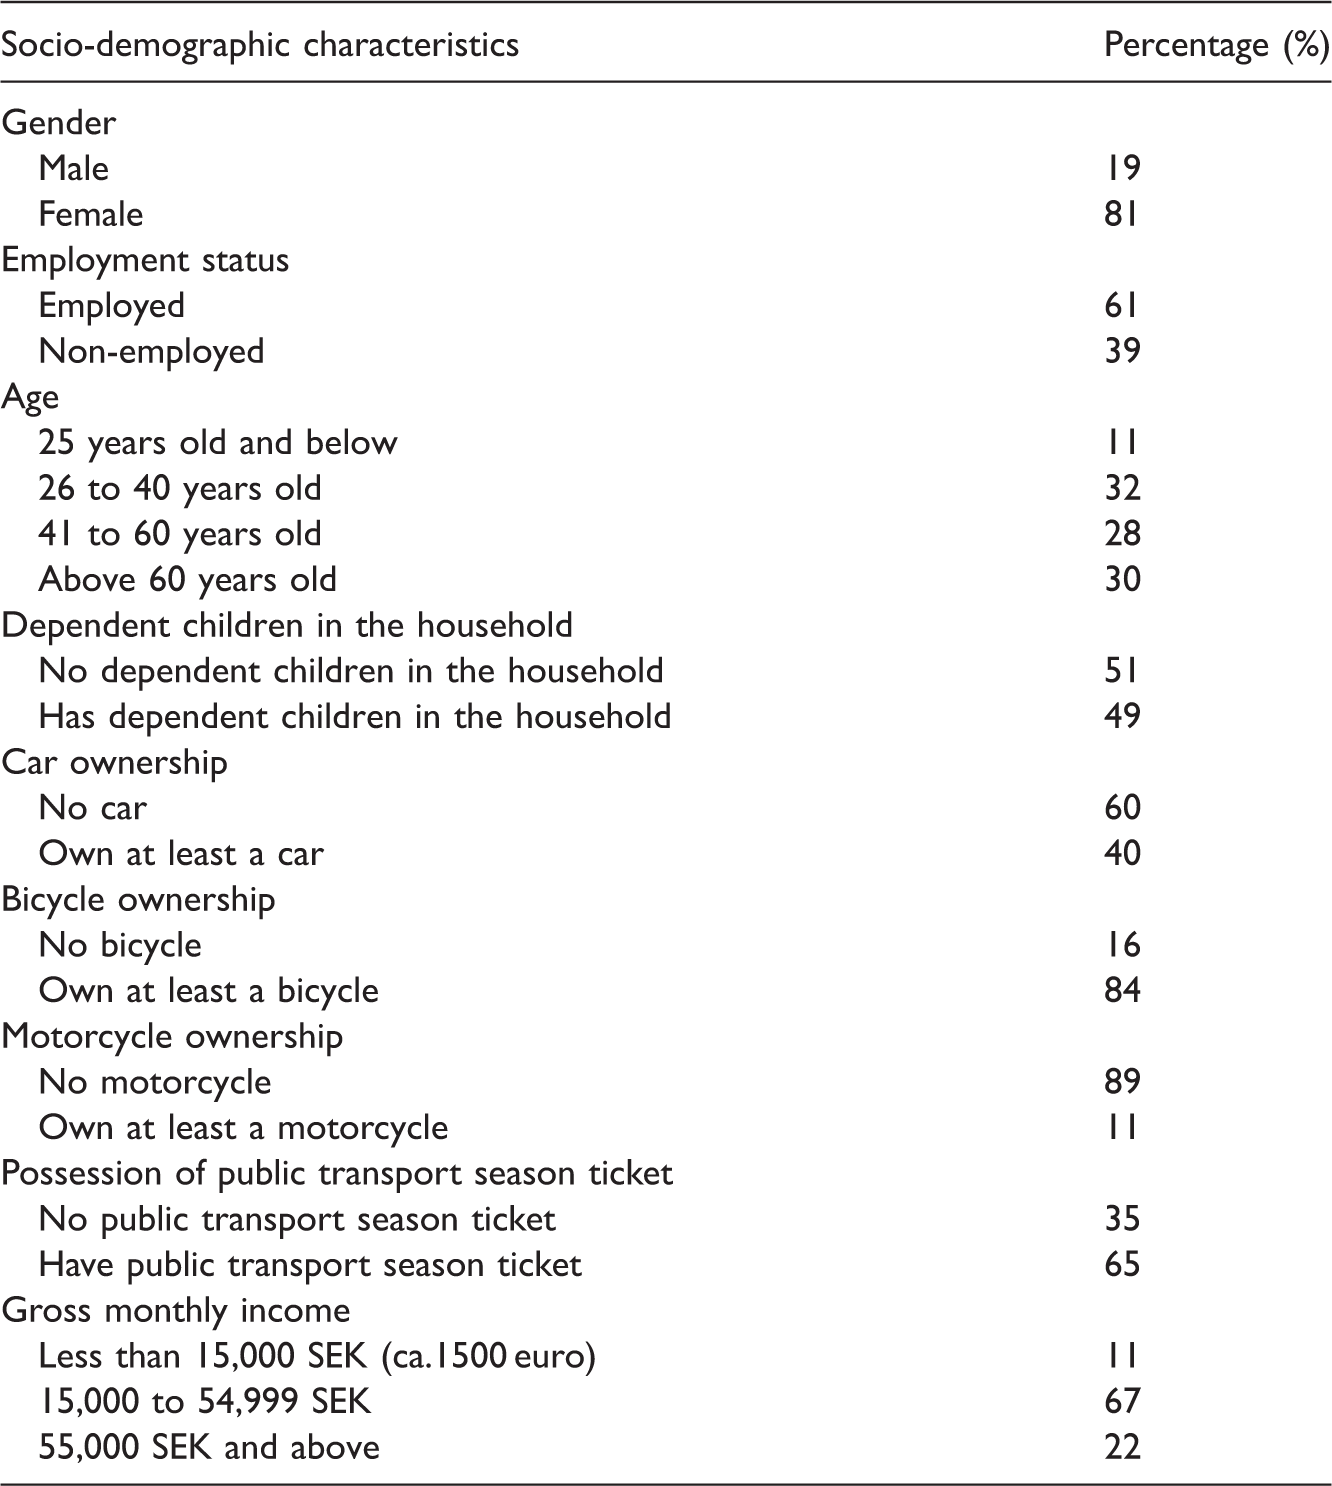
Socio-demographic characteristics of the respondents (N = 55).
Methodology
Digitising and geocoding
In the mental map questionnaire, the respondents were asked to draw their familiar areas. In practice, as expected, respondents use different forms of expression to indicate their familiar areas, even though they were guided by the grid lines provided on the specified map in order for them to draw polygons of the familiar areas on the map. Based on their different expressions, the respondents’ mental maps are divided into three main groups for analysis purposes: (1) using areas (polygons) to represent familiar areas, (2) pointing out the landmarks (e.g. name of the main locations or public transport stations) to represent familiar areas, and (3) using a combination of areas (polygons) and landmarks to represent familiar areas.
Since different forms of expression are used by the respondents in indicating familiar areas, the reported familiar areas are treated differently based on how they were reported to ease the modelling analysis and results interpretation. For Group 1, their sketched areas are directly used as their familiar areas in the data processing stage. For Group 2, in this paper, it is assumed that their familiar areas are a combination of circle-like areas with a radius of 500 meters (based on the bus stop interval distance), in which the centre of the circle is at the point (landmark) that the respondent has highlighted on the given specified map. For Group 3, a combination of the two approaches (from the first two groups) mentioned previously was used. Maps are then digitised and transformed into a readable format, then exported in a form of data, using ArcGIS software for further analysis and modelling purposes. In particular, each map is manually digitised and transformed as a raster map layer, then the layer is exported into ASCII code, so as to produce a data set with 4968 grids. Each grid represents a 200 m × 200 m square, which is assumed as an appropriate size to capture the shape of respondents’ familiar areas and to limit the grid quantity, in order for the model to converge.
Figure 2(a) to (f) shows examples of original and digitised familiar areas in different groups, using the Swedish University of Agricultural Sciences (SLU, 2015) base map. Note that some of the respondents may change their expression of their familiar areas during these four waves, which means they might be in group 1 in Wave 1 but in group 3 in Wave 3.
(a) Original familiar areas from one of the respondent in Group 1. (b) Digitised familiar areas from one of the respondent in Group 1. (c) Original familiar areas from one of the respondent in Group 2. (d) Digitised familiar areas from one of the respondent in Group 2. (e) Original familiar areas from one of the respondent in Group 3. (f) Digitised familiar areas from one of the respondent in Group 3.
Land use and accessibility indicators integrated in the analysis
In this study, it is assumed that information about land use and the built environment forms an important part of the environment knowledge that tends to be in an individual’s mental map, as argued by Lynch (1960) in his five elements of the city’s image. Therefore, several land use and accessibility indicators are included in the analysis for this purpose. In the analysis, these indicators are added in each grid (e.g. place or location), thus, the observations are grid level (e.g. 4968 grids per map). These include:
Land use configuration, categorised into four different types of land use, i.e. commercial, industrial, residential, or other (such as hospitals) areas, Public transport access, defined as the presence of public transport station/stops at the designated grid. It is expected that the grid (e.g. place or location) with public transport access is more accessible and more likely to be visited than other grids, thus, subsequently, more likely to be reported as a familiar place than its counterparts. Such accessibility, however, depends on the attractiveness of the public transport type (e.g. subway, tram, or train), and also depends on the distance of a grid to the nearest grid with public transport access, Individual’s anchor or base location, i.e. work and home locations. It is expected that the grid that includes an anchor or base location is likely to be included in an individual’s familiar place, since this anchor or base location is frequently visited on a daily basis (e.g. every weekday). Such familiarity, however, declines as the distance from the grid with the anchor (home or work) locations increases. The distance from the grid that includes home or work location to any grid is based on Euclidean distance, as the proximity to travel distance (Higgs et al., 2012). It is acknowledged that the travel distance on a real network would be a better indicator than using Euclidean distance (Buczkowska et al., 2015). However, the study area is located in a built-up area (see Figure 2), where transport network is quite dense. A location (in such area) with short Euclidean distance (to home/work location) usually has a small network distance (to home/work location) as well. Thus, in this study, it is assumed that using Euclidean distance data would not make a significant difference in comparison to using real network distance measurement.
Model formulation
Two models are applied in this study: a dynamic binary probit model with spatial autocorrelation, and an ordinary least squares model. The dynamic binary probit model with spatial autocorrelation is applied to every individual (one model per individual, 55 models in total), to capture spatial correlation effect and temporal correlation effect, as well as the land use variables’ effects on familiar areas. The dependent variable is the binary choice of familiarity for a given grid in each wave (1 = the grid is reported as a part of one’s familiar area, 0 = otherwise). Each grid represents a square with area size of 200 m × 200 m. It is not assumed in the model that the choice makers (the grids) choose based on the utility maximisation principle, but rather, use the model’s functional form to model the binary outcome. The model has the following structure:

and



The value of α must be prespecified. Different α values mean different speeds of decay in spatial relationship. Note that different α values have been tested, and the value of ‘−3’ is finally adopted based on the tests done. λ denotes the spatial autocorrelation parameter. A positive value of λ denotes a spatial similarity, while a negative value of λ denotes a spatial dissimilarity.
The initial condition problem of the model is solved by specifying the distribution of the error term 
Where

A simulated maximum likelihood approach is used to estimate the model where vi is simulated according to the joint distribution
Variables used in the dynamic binary probit model.
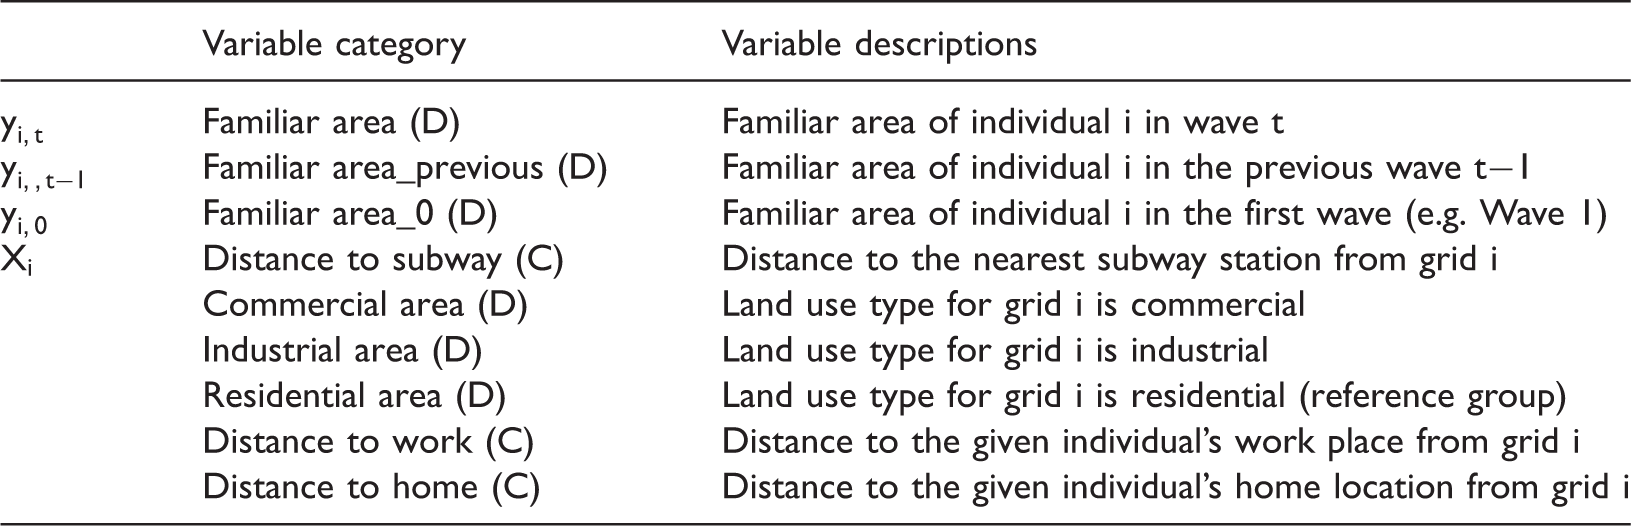
Note: ‘D’ represents dummy variables, ‘C’ represents continuous variables.

Variables used in the linear regression model.

Note: ‘D’ represents dummy variables, ‘C’ represents continuous variables.
Model estimation results
What factors influence the probability of a grid being reported as a part of an individual’s familiar area?
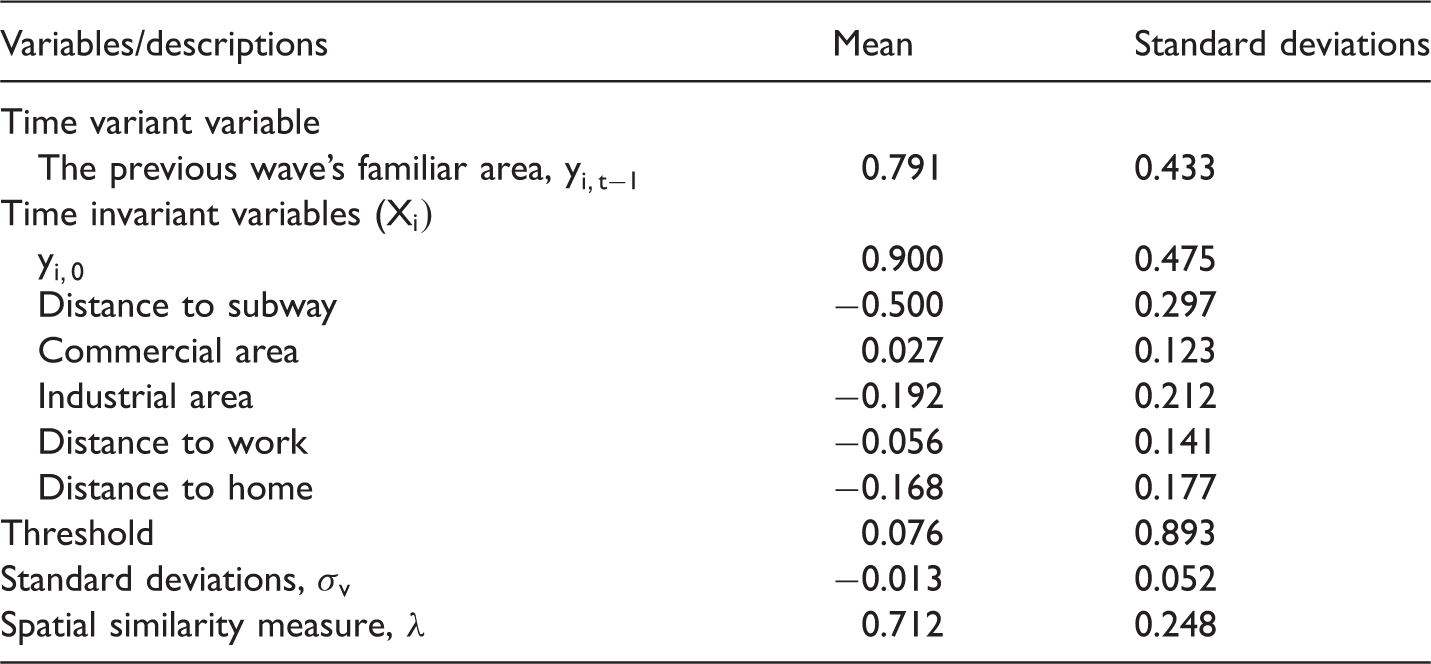
Estimation result of the dynamic probit model.
The effect of
To capture the inter-individual heterogeneity of the familiar areas, the estimated coefficients (among 55 individuals) corresponding to each specific variable is calculated at individual level (the figures of distribution cannot be shown in here due to the article’s length limitation). In terms of intra-individual heterogeneity, 56% out of 52 individuals (note that three out of 55 individuals’ estimates were not significant at 95% level) have higher values of
As expected, the variable ‘distance to subway’ shows negative correlation to the propensity of the location to be registered in one’s familiar area. This implies the locations that are close to subway stations are more likely to be included in an individual’s familiar area; though very few individuals show opposite influences. Commercial areas are likely to be included in an individual’s familiar areas, while industrial areas show the opposite effect. Locations that are close to an individual’s work place and home are likely to be included in their familiar areas, which can be observed from the negative coefficients of the variables ‘distance to work’ and ‘distance to home’, respectively. Note that individuals who are unemployed have a value of 0 in terms of variable ‘distance to work’. The coefficient of variable ‘distance to home’ is relatively uniform among these 55 individuals. Regarding spatial correlation, 17 out of 55 individuals show significant positive spatial similarity,
Due to the individual heterogeneity regarding different variables (cannot be shown in here due to the article’s length limitation), a linear regression model is applied to uncover the significant difference in land use variables. It was found that the coefficient of
The influence of an individual’s socio-demographic and travel characteristics attributes on the average size of their reported familiar area
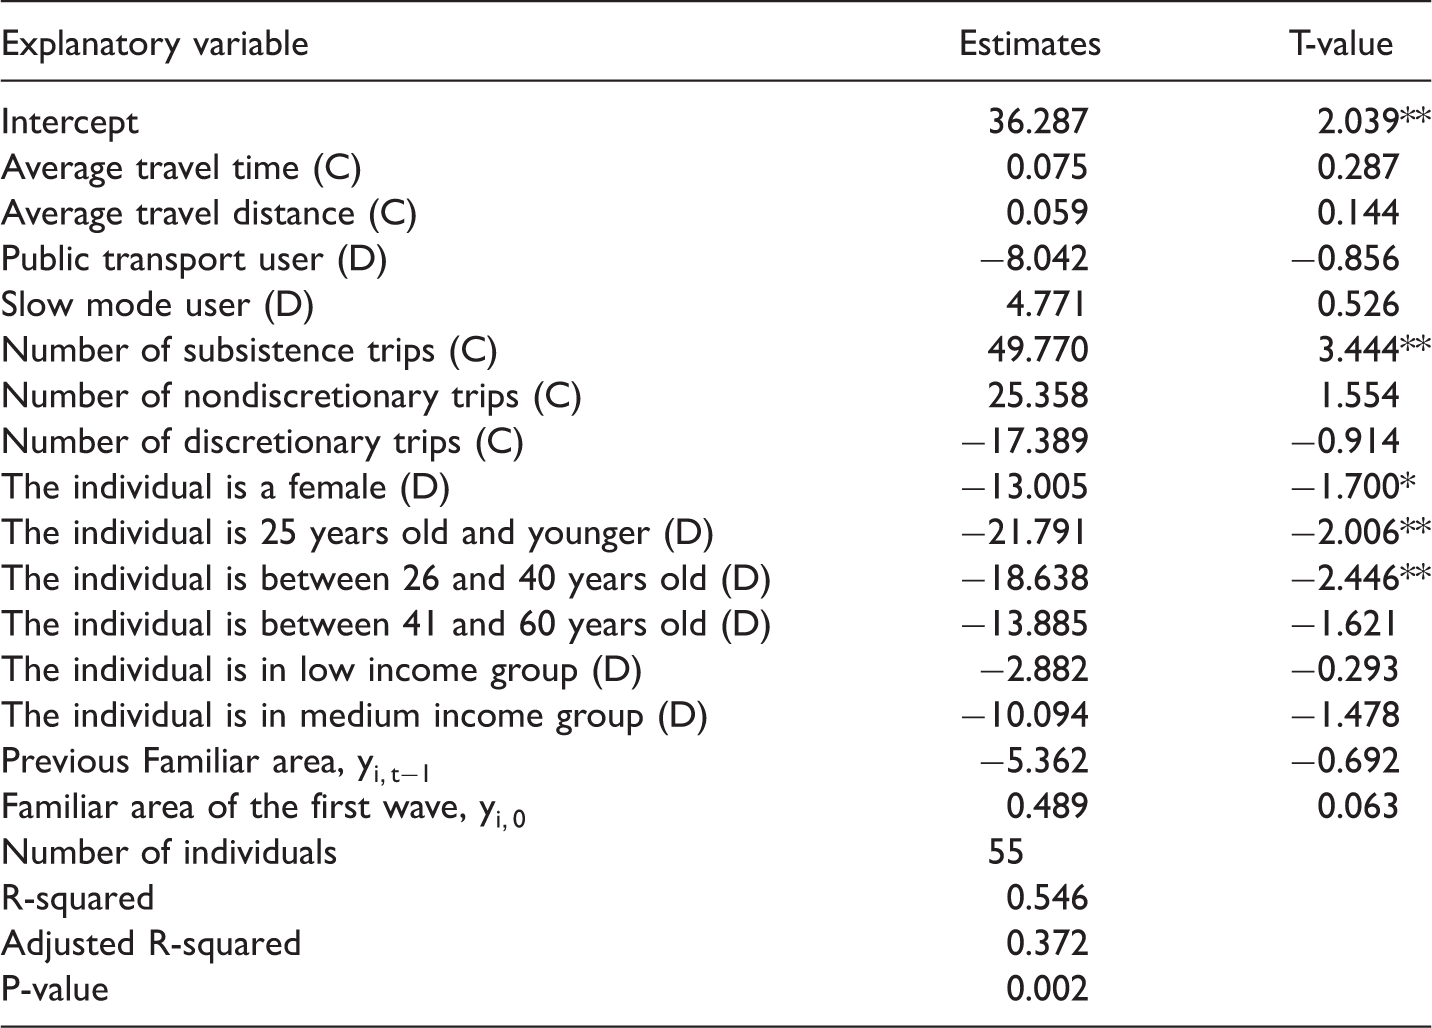
Estimation result of the linear regression model on the size of familiar areas.
Note: ‘D’ represents dummy variable, ‘C’ represents continuous variable.
Significant at level p < 0.1.
Significant at level p < 0.05.
Conclusions and discussions
This paper presents an explorative quantitative approach to investigating the dynamics of individuals’ familiar areas over a seven-month period. It introduces a way of obtaining mental maps from individuals’ minds by recording their familiar areas on a specified map, given a fixed boundary. Compared to the traditional sketch maps (e.g. Fang and Lin, 2016; Halseth and Doddridge, 2000; Ramadier and Bronner, 2006), the familiar areas recorded in this paper are more standardised and formalised, which made them easier to digitise for modelling purposes. Furthermore, the familiar areas were collected in four different waves, thus making it possible to observe the evolution of individuals’ familiar areas in a real situation, rather than using a dynamic simulated activity travel behaviour (e.g. Arentze and Timmermans, 2005; Portugali, 2004). Moreover, the results of this study show how an individual’s familiar area evolves with time, how land use attributes influence an individual’s familiar area over time, and how socio-demographic factors and travel characteristics factors influence the average size of the respondents’ familiar areas.
The result of dynamic probit model, which captures spatial correlation and temporal correlation, shows that an individual’s familiar area is largely dependent on their initial (the first wave) familiar areas and the previous wave of familiar areas. This indicates that some individuals’ familiar areas depend on their long-term memory (at least seven months’ memories), while others depend on recent activity-travel behaviours. Land use attributes show a distinct influence on different social groups of individuals. Furthermore, familiar areas’ spatial similarity also varies from person to person. Meanwhile, the variables ‘number of subsistence trips’, ’gender’, and ’young age group’ show significant influence on the size of familiar area.
In this study, it was found that an individual’s familiar area is highly dependent on long-term memory, and once a familiar area (in one wave) is obtained, this familiar area could serve as an indicator of ‘probability-to-be-visited’, in order to refine the existing activity-based modelling, especially in modelling the agents’ activity locational choice sets. Furthermore, a particular traveller group’s interest towards a certain land use attribute could be identified by studying their familiar areas. For example, in this study, women are found to be likely to register ‘commercial area’ as a part of their familiar areas over the long-term, and, presumably, they are likely to go to these commercial areas more often in the future than their male counterparts. Moreover, understanding the impact of different land use and accessibility factors would also help us to understand what kind of locations are more or less likely to be visited by different group of individuals. This could be useful when evaluating the effectiveness and efficiency of the existing and future infrastructure, as well as the distribution of point-of-interest locations in the given neighbourhood/region.
However, it should also be noted here that this conclusion only applies to the given sample, since the sample size only includes 55 respondents, with 220 registered familiar areas, which is not a representative sample of the whole Stockholm population. It is also worth pointing out that the familiar areas used in the study were obtained through a self-reported approach, which may have flaws, such as: (1) it may not be a complete mental map representation, since the respondents were only asked to draw their familiar areas; (2) the familiar areas are the places that the individuals think they are familiar with on the given time or day; (3) recent activity travel behaviour is likely to influence the familiar area. The inclusion of recent activity travel behaviour might help in developing a more comprehensive understanding of the formation of mental maps. Note that the first attempt to study the relationship between individuals’ activity spaces and travel patterns in relation to their familiar areas was done by Zhang et al. (2016) using only Wave 1 data from the same dataset as in this study. Therefore, for future studies, investigating the interaction between individuals’ activity locations and familiar areas dynamically would be a worthy objective, so as to discover whether there is any possible mutual relationship between them, as argued by Weston and Handy (2004). Based on the estimation results of the dynamic probit model, though familiar areas rely heavily on the previous wave of familiar areas, there is still variability in familiar areas that cannot be explained by it. This may indicate that individuals’ upgrading their information about the environments in their mind is influenced by where they have recently visited, and vice versa. Many questions can be raised by including an activity-based travel diary in the modelling, for example, what types of travel destinations are likely to be included in an individuals’ mental maps? By answering such questions, a better travel demand model could be produced through inclusion of both mental map data and recent activity travel, as argued by Chorus and Timmermans (2010) and Hannes et al. (2012). Furthermore, more subjective mental-map-related variables (e.g. psychological questions) can be incorporated into the model (e.g. Jorgensen and Stedman, 2011), and marginal effects of land use attributes that interest planners should be explored, so as to understand the plausible impacts of individuals’ mental maps on issues that are important from land use and urban planning perspectives.
Footnotes
Acknowledgements
The earlier version of this paper has been accepted for presentation at the 2016 World Conference in Transport Research in Shanghai, China, which proceedings will be available at Transport Research Procedia.
Declaration of conflicting interests
The author(s) declared no potential conflicts of interest with respect to the research, authorship, and/or publication of this article.
Funding
The author(s) received no financial support for the research, authorship, and/or publication of this article.